
 ?Mathematical formulae have been encoded as MathML and are displayed in this HTML version using MathJax in order to improve their display. Uncheck the box to turn MathJax off. This feature requires Javascript. Click on a formula to zoom.
ABSTRACT
Egypt is grappling with water shortage, with agriculture using about 80% of its water consumption. Climate change is only going to further complicate water availability and water consumption. This study investigates the potential impacts of climate change on irrigation demands in the Western Nile Delta of Egypt, focusing on both coastal region, Mahmodia, (Ma) and interior region, Nubaria, (Nu). An ensemble of 40 Global Circulation Models (GCM) was utilized to project climate conditions under two representative concentration pathways, RCP4.5 and RCP8.5, based on the Intergovernmental Panel on Climate Change (IPCC) and the Fifth Assessment Report. The CROPWAT model was used to calculate the reference evapotranspiration (ET0) and the crop water requirements (CWR) for key crops in the Western Nile Delta. This included summer crops (sugar beet, cotton, summer maize, summer tomato, watermelon and sweet melon), winter crops (wheat, alfalfa, winter potato, winter squash and broad bean), and permanent crops (orange, apple, grape, and olives). The assessments considered both historical and projected climate data extending until 2100. According to RCP8.5 scenario, the findings indicate a projected rise in CWR rates in Nubaria, with an increase of 1.03%, 1.15%, and 0.94% per decade until the end of the century for summer, winter, and permanent crops, respectively. Similarly, Mahmodia is expected to experience a rise in CWR rates by 1.1%, 1.16%, and 1.08% per decade for the same crop categories until 2100. These projections underscore the urgent necessity to integrate climate change considerations into water resource management strategies to enhance the efficiency of these strategies.
Introduction
Egypt, situated between the Sahara and Arabian deserts, holds the distinction of being one of the world’s hottest and sunniest countries, characterized by remarkably low humidity. This climatic condition can be attributed to its proximity to the circumglobally latitudinal belt of high atmospheric pressure and the arid nature of its climate according to the Köppen classification (Belda, Holtanová, Halenka, & Kalvová, Citation2014). While the country experiences aridity in general, except the coastal region receives a notable amount of rainfall, approximately 200 mm annually (Gado, El-Hagrsy, & Rashwan, Citation2019; Roushdi, Citation2022).
The Mediterranean Sea plays a crucial role in moderating temperatures along the northern coast of Egypt through the continuous influence of prevailing winds, unobstructed by any significant topographical features such as mountain ranges (Gebaly, Nashwan, Khadr, & Shahid, Citation2023). However, as one moves further south, this wind effect diminishes, resulting in a notably hotter climate. These findings collectively position Egypt as one of the most vulnerable regions to the impacts of climate change (Jungudo, Citation2023).
The complete effects of climate change on both water supply and demand are not yet fully understood (Dallison, Patil, & Williams, Citation2021). Climate change will have an impact on evaporative demand, particularly due to the projected rise in temperature, which would generally increase potential evapotranspiration if all other factors remained constant. However, the influence of other climatic factors such as humidity, radiation, and wind speed on evapotranspiration will modify this effect (Rochdane, Reichert, Messouli, Babqiqi, & Khebiza, Citation2012).
In Egypt, agriculture is responsible for consuming 79.15% of the country’s total water consumption (IDSC, Citation2021), although this proportion is expected to decrease as municipal and industrial demands rise due to population growth and industrialization. Nevertheless, agriculture is projected to remain the primary water user in the country (El-Rawy et al., Citation2020). Crop water requirements primarily depend on climate conditions, along with other biological factors such as crop type and variety. Therefore, crop water requirements are highly sensitive to the impacts of climate change (Kang, Khan, & Ma, Citation2009). In addition, the temperature increase associated with climate change may lead to shifts in planting dates (Ye et al., Citation2019), highlighting the need for research efforts to predict and understand these impacts more accurately.
Climate projection relies on the utilization of Climate Circulation Models, which serve as the primary approach for investigating the influence of greenhouse gas concentrations on future climate. These models, known as Climate Models, are numerical representations that simulate the intricate interactions among the atmosphere, oceans, land surface, and ice. They discretize and solve the complete equations governing mass and energy transfer, as well as radiant exchange, within the Earth’s climate system. In order to account for processes occurring on scales that are too small to be directly resolved, the models incorporate parameterizations, such as convection. To comprehensively capture the various interactions taking place within the Earth’s climate system, a specific type of model called a Global Circulation Model (GCM) is employed. GCMs provide a framework for modeling the complex dynamics and feedback mechanisms at play in the climate system (Illangasingha et al., Citation2023; Meehl et al., Citation2007). A Representative Concentration Pathway (RCP) refers to a trajectory of greenhouse gas concentrations, rather than emissions, that has been adopted by the Intergovernmental Panel on Climate Change (IPCC). In the context of the IPCC Fifth Assessment Report (AR5) released in 2014, four distinct pathways were utilized for climate modeling and research. These pathways serve to illustrate various scenarios of climate change, all of which are considered plausible based on the levels of greenhouse gas (GHG) emissions expected in the future. The RCPs, initially denoted as RCP2.6, RCP4.5, RCP6, and RCP8.5, are named according to the potential range of radiative forcing values anticipated for the year 2100, specifically 2.6, 4.5, 6, and 8.5 watts per square meter (W/m2), respectively (Adeniyi, Citation2016).
In this regard, the main objective of this research is to assess the impacts of climate change on crop water requirements in the Western Nile Delta region. To achieve this, an ensemble of 40 GCMs and two RCPs scenarios, namely RCP4.5 and RCP8.5, are employed. The research aims to assess how climate change, as projected by these models and scenarios, impacts the amount of water needed by crops in the region.
Methodology
The study established the crop water requirements for a range of crops in the study area, which includes summer crops (sugar beet, cotton, summer maize, summer tomato, watermelon and sweet melon), winter crops (wheat, alfalfa, winter potato, winter squash and broad bean), and permanent crops (orange, apple, grape, and olives). The research aims to assess how climate change might affect the water demands of these crops. It involved the examination of historical climate data covering the years 1979 to 2015 and projected data from 2016 up to 2100, considering climate factors: rainfall, temperatures (minimum and maximum), relative humidity, sunshine hours, and wind speed. The water needs for these crops were computed on a monthly basis for both the historical and the projected time frames. In projected crop water requirements, the study utilized two different climate scenarios, RCP4.5 and RCP8.5, based on ensemble of 40 global general circulation models.
Study area
The study area is located in the western Nile delta between 29º 55’30“and 30º 41’ 45” E and 30º 40’25“and 31º 15’ 20” N, . Generally, the study area exhibits a Mediterranean semi-arid climate, where distinct seasonal patterns can be observed. The warmest month, typically August, experiences an average temperature of 26.25 ºC, while the coldest month, usually January, has an average temperature of 12.5 ºC. Occasional short rainstorms are observed, primarily during the winter season (Abd El-Kawy, Rød, Ismail, & Suliman, Citation2011). Climatic data reveals that the region receives relatively low levels of precipitation, with the majority occurring in winter. Conversely, the summer months are generally characterized by dry conditions (Mohamed & Gouda, Citation2018).
Figure 1. Case study area.
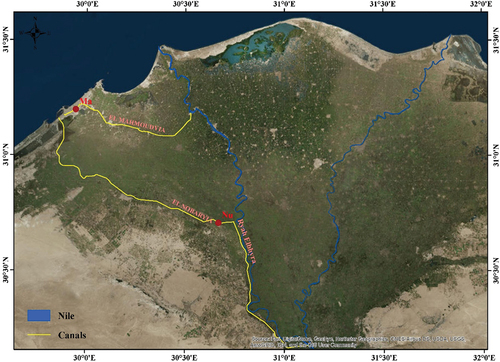
The study area is characterized by an extensive canal network stretching over 4000 km. Two distinct climate zones were selected to represent the inland zone (the intake of Nubaria Canal, Nu, with lat. 30.66º E and long. 30.712º N) and the coastal zone (the end of Mahmoudia Canal, Ma, with lat. 29.942º E and long. 31.201º N).
Historical climate data
The CRU TS series is a widely used and trusted dataset in climate research. Developed by the Climate Research Unit (CRU) at the University of East Anglia, it provides gridded climate data on various climate variables, including temperature and precipitation, with global coverage. The dataset is derived from a combination of observations, reanalysis data, and climate model outputs. One of the strengths of the CRU TS series is its long-term coverage, spanning several decades, which enables the analysis of climate variability and trends over time. The data undergoes rigorous quality control procedures to ensure accuracy and consistency (Harris, Jones, Osborn, & Lister, Citation2014). The CRU TS series has been instrumental in numerous studies, contributing to our understanding of historical climate patterns, assessing climate change impacts, and validating climate models. Its availability and reliability make it a valuable resource for researchers and policymakers working in climate science and related fields (Kheireldin, Roushdi, & Aboelkhear, Citation2020).
The monthly historical climate data for the intake of Nubaria Canal and the end of Mahmodia Canal were analyzed using the CRU TS dataset, covering the period from 1979 to 2015.
Climate projection
GCMs are sophisticated computer simulations used to study and understand the Earth’s climate system. These models are designed to simulate the complex interactions between the atmosphere, oceans, land surface, and ice cover, providing valuable insights into past, present, and future climate conditions. GCMs play a crucial role in climate research, informing our understanding of climate processes, predicting future climate patterns, and assessing the potential impacts of climate change. GCMs are based on fundamental principles of physics, fluid dynamics, and thermodynamics. They divide the Earth into a three-dimensional grid, with each grid cell representing a specific region. The models utilize mathematical equations to describe the physical processes occurring within and between these grid cells, including the movement of air, heat exchange, moisture transport, and energy balance, (Flato et al., Citation2014).
Utilizing GCMs introduces significant uncertainties in analytical outcomes (Hurlbatt et al., Citation2017). This is largely due to the reliance on various Green House Gas (GHG) emission scenarios, which are contingent on differing paths of economic and technological evolution, and the interplay between global and local development dynamics. The Special Report on Emission Scenarios (SRES) by the IPCC (IPCC, Citation2000), outlines numerous such scenarios. Moreover, the availability of multiple GCMs results in divergent climate predictions for identical GHG emission scenarios. The inherent uncertainties from GCMs suggest that climate change impacts derived from a single model should be approached with caution. Consequently, recent research has increasingly employed multi-model ensemble climate simulations, as evidenced in studies by Knutti, Furrer, Tebaldi, Cermak, and Meehl (Citation2010), Jung, Bae, and Lee (Citation2013), Zhang and Huang (Citation2013) and Zamani, Akhond-Ali, Roozbahani, and Fattahi (Citation2017). These ensembles generally provide more accurate simulations of climate variables than individual models, as found in research by Knutti, Furrer, Tebaldi, Cermak, and Meehl (Citation2010), and Zhang and Huang (Citation2013), especially when the available GCMs are not individually evaluated for the specific study area (Kheireldin, Roushdi, & Aboelkhear, Citation2020).
Thus, in the current research, the main focus of the ensemble consists of 40 GCMs models, primarily utilizing the IPCC CMIP5 datasets (Allen, Plattner, Nauels, Xia, & Stocker, Citation2014). The baseline period typically spans from 1986 to 2005, with a central emphasis on the year 1995. Within the ensemble, the fundamental spatial datasets for current and future climate are implemented on a global scale, using a resolution of 0.50° by 0.50°. Higher spatial resolution is achieved through bilinear interpolation, resulting in a resolution of 800 meters by 800 meters. When constructing scenarios based on climate model results, the baseline period also serves as the reference point for calculating the modeled future climate changes. The ensemble of 40 GCMs models is employed to minimize uncertainty in climate data analysis. This ensemble includes the GCMs listed in .
Table 1. Description of used GCMs from IPCC’s fifth assessment report (AR5), (Flato et al., Citation2014).
This study utilizes two specific Representative Concentration Pathways (RCPs), namely RCP 4.5 and RCP 8.5. The investigation of climate change projections encompasses both a pessimistic scenario (RCP 4.5) and an optimistic scenario (RCP 8.5). Climate parameters were extracted on an average monthly basis until 2100, with each ten-year period being considered to support calculations related to crop water requirements. Data extraction was carried out subsequent to the statistical downscaling of GCMs data to a 1 Km *1 Km over the study region.
Crop water requirement calculations
Estimations of crop water requirements, both for historical and future periods, were conducted using the CROPWAT software. CROPWAT is a decision support tool developed by the Land and Water Development Division of the FAO, designed to facilitate irrigation planning and management. It serves as a practical tool for carrying out standardized calculations related to reference evapotranspiration, crop water requirements, irrigation requirements, and specifically for designing irrigation scheme management (Clarke, Citation1998).
The software enables the generation of recommendations to enhance irrigation practices, the planning of irrigation schedules considering varying water supply conditions, and the evaluation of production in rainfed or deficit irrigation scenarios. By utilizing soil, climate, and crop data, CROPWAT functions as a computer program for calculating both crop water requirements and irrigation requirements.
The calculation procedures employed in CROPWAT are derived from two publications within the Irrigation and Drainage Series by FAO. These publications include paper No. 56, titled “Crop Evapotranspiration – Guidelines for computing crop water requirements” (Allen, Pereira, Raes, & Smith, Citation1998). These FAO publications serve as the foundation for the methodologies and guidelines used in CROPWAT for computing crop water requirements and assessing the impact of water on crop yield.
In this research, various datasets were utilized to calculate crop water requirements using CROPWAT. These datasets include:
Climate data. Five climate parameters were employed to estimate reference evapotranspiration, including maximum temperature, minimum temperature, relative humidity, wind speed, and sunshine hours. Historical climate data from the past 30 years was incorporated into CROPWAT as input data for each location. Additionally, predicted climate data spanning 10-year intervals, such as 2016–2025, 2026–2035, and so on, up to 2096–2100, was integrated into CROPWAT. Climate data is used for calculating evapotranspiration.
Rainfall data. Rainfall data was considered to determine effective rain, which is used in irrigation calculations. Historical rain data from the past 30 years was included in CROPWAT for each location. Furthermore, predicted rain data covering 10-year periods, such as 2016–2025, 2026–2035, and so forth, up to 2096–2100, was incorporated into CROPWAT.
The United States Department of Agriculture (USDA) Soil Conservation Service (SCS) method is used as recommended by Smith (Citation1992) to calculate effective rainfall. This method calculates effective rainfall (Peff) with the help of actual rainfall per month (Pmonth) with the following formulae, EquationEquation (1)(1)
(1) :
Crop data. The cropping pattern for El Mahmoudia and El Nubaria regions was identified based on the Agricultural census results, Agricultural year 2009–2010, Economic Affairs Sector, Ministry of Agriculture and Land Reclamation (MALR, Citation2010). For each of the 15 main crops, specific crop data was included, such as planting date, harvesting date, crop coefficient (Kc) for each growth stage, duration of each growth stage, rooting depth, critical depletion, yield response, and crop height. These parameters were integrated into CROPWAT to accurately calculate crop water requirements.
Soil data. The soil characteristics of the study areas were derived from CROPWAT’s library, which the soil type in Nu and Ma feature sandy loam soil. The required characteristics of the soil are total available soil moisture, maximum rain infiltration rate, maximum rooting depth, initial soil moisture depletion, and initial available soil moisture.
Reference crop evapotranspiration (ET0). In order to ascertain ET0, meteorological data from the selected stations was gathered. The Penman-Monteith equation, recommended by FAO for calculating ET0, is provided in EquationEquation (2)(2)
(2) (Allen, Pereira, Raes, & Smith, Citation1998; Ndulue & Ranjan, Citation2021).
Where,
= net radiation at the crop surface (MJ/m2 per day);
= soil heat flux density (MJ/m2 per day);
= mean daily air temperature at 2 m height (°C);
= wind speed at 2 m height (m/sec);
= Saturation vapor pressure (kPa);
= Actual vapor pressure (kPa);
= saturation vapor pressure deficit (kPa);
= slope of saturation vapor pressure curve at temperature T (kPa/°C);
= psychrometric constant (kPa/°C).
Crop water requirement calculations. Numerous runs of the CROPWAT model were conducted to determine the crop water requirements in Nu and Ma, considering the variety of crops, prevailing climate conditions, the specific time frame under study, and various climate scenarios that include both past records and future projections. This also factored in the various climate emission scenarios being scrutinized, RCP4.5 and RCP8.5. The analysis covered the historical time frame (1979–2015) as well as future intervals (2016–2025, 2026–2035, and subsequent decades up to 2095–2100), with the aim of estimating the water requirements for each crop within the areas being researched. During both the historical and projected periods, the crop and soil data input remain constant for past and future evaluations. The only variable that alters is the climate data, which fluctuates based on different climate scenarios. Therefore, the variations in the projected climate data, in accordance with the specific period and climate scenario under investigation, are what lead to changes in the projected crop water requirements.
Results and discussions
Historical data analysis
The historical climate data of Nu and Ma, including maximum temperature, minimum temperature, relative humidity, wind speed, sunshine hours, and rainfall, are presented, . Nu experiences a hot desert climate characterized by specific climatic parameters throughout the study period. In terms of Maximum temperature, Nu maintains a relatively high average maximum temperature of 27.5°C. The warmest month, July, records an average temperature of 33.7°C, while the coldest month, January, exhibits an average temperature of 19.3°C. The same trend for minimum temperature with highest value of 21.7 in August and lowest value of 8.3 in January and February.
Figure 2. Historical climate data for both Nu and Ma.
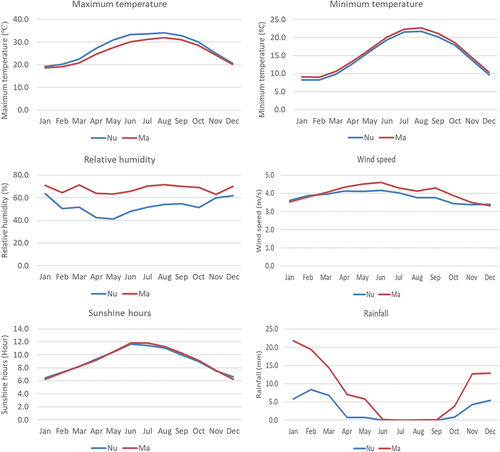
Regarding relative humidity, Nu is considered a relatively dry location, with an average relative humidity level of 48%. January is the most humid month, with an average humidity of 63.5%, whereas May registers the least humidity at 41.1%.
The results indicate moderate wind speed, with an average of 3.8 m/s. June stands out as the windiest month, with an average wind speed of 4.2 m/s. On the other hand, October, November and December witnesses the least wind activity, with an average speed of 3.4 m/s.
Nu enjoys abundant sunshine, with an average of 9.1 hours of sunshine per day. June tops the list as the sunniest month, boasting an average of 11.6 hours of sunshine per day. Conversely, January experiences the least sunshine.
Rainfall in Nu is extremely scarce, with an annual amount of 33.23 mm. February receives the highest amount of rainfall, with an average of 8.4 mm, while June, July, August and September are the driest months, with an average of 0 mm of rainfall.
These climatic characteristics, including high temperatures, low humidity, notable wind speed, abundant sunshine, and minimal rainfall, collectively define the climatic conditions experienced in Nu throughout the study period.
Ma, located in the study area, experiences an average annual maximum temperature of 25.7°C. The warmest month, August, exhibits the highest average temperature of 32.0°C, while the coldest month, January, records an average temperature of 18.7°C. The trend is similar for minimum temperatures, with the highest value of 22.7°C occurring in August and the lowest value of 9.0°C observed in February.
In terms of humidity, Ma is humid than Nu, with an average humidity level of 67.8%. August is the most humid month, with an average humidity of 71.4%, while November is the least humid month, with an average humidity of 62.9%.
Ma also experiences relatively high wind speeds, with an average of 4.0 m/s. June stands out as the windiest month, with an average wind speed of 4.6 m/s, while December witnesses the least wind activity, with an average speed of 3.3.
It enjoys abundant sunshine, with an average of 9.1 hours of sunshine per day. June and July rank as the sunniest month, with an average of 11.8 hours of sunshine per day, while January and December experiences the least sunshine.
Rainfall in Ma is wetted than Nu, with an annual rainfall of 98.16 mm. February receives the highest amount of rainfall, with an average of 21.8 mm, while July is the driest month, with an average of 0 mm of rainfall.
These climatic characteristics, including average temperatures, low humidity, notable wind speeds, abundant sunshine, and average rainfall, collectively define the climatic conditions experienced in Ma throughout the year.
Projected climate data
Climate parameter projections are obtained through an ensemble of 40 GCMs utilizing both RCP4.5 and RCP8.5. Observed alterations in the projected data show notable changes in minimum temperature, maximum temperature, and rainfall, while relative humidity, wind speed, and sunshine duration exhibit negligible or no substantial changes. Consequently, it is the projected values of minimum temperature, maximum temperature, and precipitation that are the critical factors influencing the variation in crop water requirements throughout the projection timeline. illustrates the projected shifts in maximum and minimum temperatures, as well as rainfall, at 10-year intervals for Nu, Egypt, considering two climate scenarios: RCP4.5 and RCP8.5.
Figure 3. Monthly maximum temperature, minimum temperature, rainfall at Nu for both RCP 4.5 and RCP 8.5 (10-years intervals).
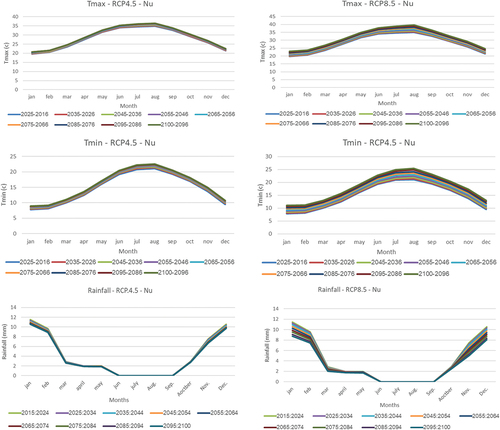
The charts in indicate a trend of rising maximum and minimum temperatures in Nu across both climate scenarios. However, the increase in temperature is projected to be greater under RCP8.5. It is noted that the projected changes in maximum temperature shows that the average maximum temperature in Nu is projected to increase by 1.8°C by 2100 under RCP4.5 and by 4.3°C by 2100 under RCP8.5, as an average value. It is also noted that the maximum increasing in projected maximum temperature will occur in summer for both scenarios. The same behavior is projected for minimum temperature. It is noted that the projected changes in minimum temperature Nu is projected to increase by 2.1°C by 2100 under RCP4.5 and by 4.5°C by 2100 under RCP8.5, as an average value. These results align with those presented by Mostafa, Wahed, El-Nashar, El-Marsafawy, and Abd-Elhamid (Citation2021), who indicated a projected rise in the mean temperature by 3.96°C by 2100. Once again, the peak rise in temperatures is projected to occur in the summer for both scenarios. Even though the region is dry with average annual rainfall of 33 mm, the projected rainfall refers to drier environment. A reduction in rainfall by approximately 9% under RCP4.5 and 14% under RCP8.5 is projected by the end of the century.
displays the expected changes in maximum and minimum temperatures, along with rainfall for Ma, Egypt, under the climate scenarios RCP4.5 and RCP8.5.
Figure 4. Monthly maximum temperature, minimum temperature, rainfall at Ma for both RCP 4.5 and RCP 8.5 (10-years intervals).
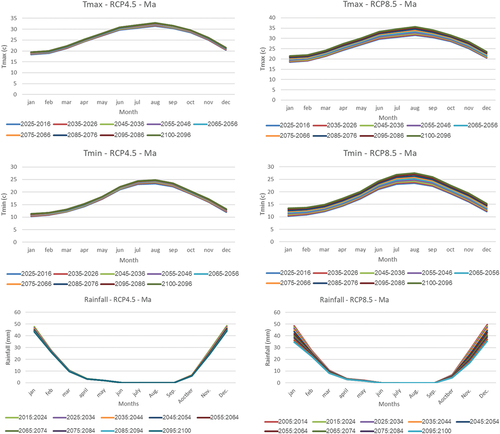
The data presented in designates a rising pattern in both the maximum and minimum temperatures in Ma, under each climate scenario, with a more substantial rise projected under RCP8.5. The projections reveal an average increase in the maximum temperature of 1.7°C by the year 2100 under RCP4.5, and an even sharper rise of 4.0°C under RCP8.5. A similar upward trend is projected for minimum temperatures, with projected average increase of 1.7°C by 2100 under RCP4.5 and a rise of 4.3°C under RCP8.5. The summer months are projected to experience the highest increases in maximum and minimum temperatures for both scenarios. Geographically situated by the Mediterranean Sea, Ma experiences a more humid climate compared to Nu. Nevertheless, a decrease in rainfall is expected, with an estimated 12% decline by 2100 under RCP4.5 and a more severe 21% reduction under RCP8.5 by the century’s end.
Historical and projection ET0 calculations
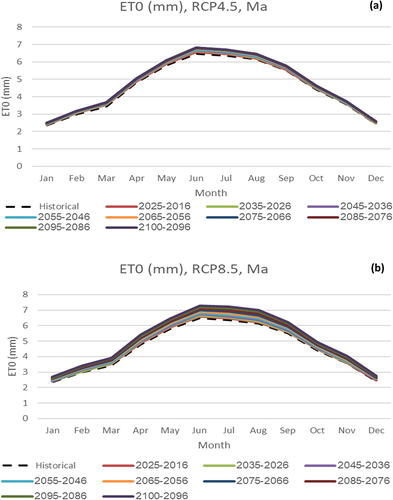
present a comprehensive portrayal of the projected reference evapotranspiration for Nu and Ma, quantified in millimeters (mm). The underlying data delineate an intense trajectory, suggesting an increasing pattern in evapotranspiration rates throughout the century under both RCP4.5 and RCP8.5 climate scenarios. The implications of such a trend cannot be understated; it sheds light on potential shifts in agricultural water needs and anticipates significant challenges tied to water resource management as the century progresses.
Figure 5. Projected reference evapotranspiration (ET0) for Nu, (a) using RCP4.5, (b) using RCP8.5.
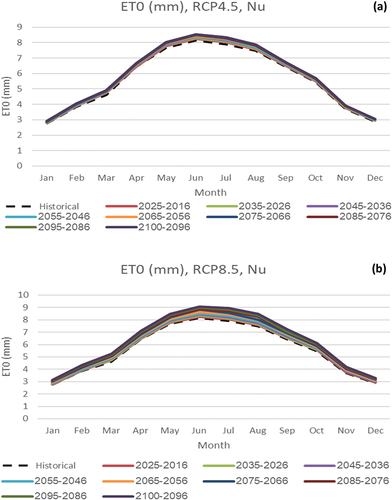
Figure 6. Projected reference evapotranspiration (ET0) for Ma, (a) using RCP4.5, (b) using RCP8.5
The granularity of the Nu’s ET0 data in is evident, capturing ET0 values across a diverse spectrum of periods: from historical benchmarks to subsequent ten-year intervals culminating in 2100. In the context of historical figures, ET0 registers a low at 2.75 mm during January, while escalating to its peak at 8.05 mm in June. El Afandi and Abdrabbo (Citation2015) reported a mean annual ET0 for Middle Nile Delta of 4.26 mm, which is lower than the 5.6 mm reported in this study for Nu.
A tangible increment in ET0 values is discerned across all calendar months as the projections stretch toward 2100, indicative of escalating evapotranspiration rates in the upcoming epochs. Zooming into the specific projections for the century’s conclusion (2096–2100), under the RCP4.5 scenario, ET0 values are projected at 2.9 mm for January and peak at 8.55 mm in June. The projected increase in ET0 ranges from 5 to 5.5% for different months by 2100 under RCP4.5. The projections for RCP8.5 amplify this trend. They postulate ET0 figures of 3.14 mm in January and a more pronounced 9.03 mm during June. The projected increase in ET0 varies between 10.1 and 12.4% for different months by the end of the century according to RCP8.5.
illustrates the detailed ET0 data for Ma, spanning from historical records to future projections culminating in 2100. The figure effectively captures the evolution of ET0 values across various time periods. Examining the historical data, ET0 exhibits a distinct seasonal pattern, reaching a minimum of 2.35 mm in January and soaring to a maximum of 6.48 mm in June. The mean annual historical ET0, recorded at 4.6 mm, aligns with the ET0 calculated for the year 2013 in Ma, as documented by El-Shirbeny, Ali, and Saleh (Citation2014), which were reported to be 4.3 mm. This data is characterized by a lower ET0 value of 2.1 mm in December and a peak value of 6.3 mm in July. The ET0 values reported in current study are slightly higher than those reported by Khalil (Citation2013), who found a mean annual ET0 of 3.96 mm.
The projections reveal a consistent upward trend in ET0 values across all calendar months as we approach 2100, suggesting a significant increase in evapotranspiration rates in the coming decades. Focusing on the specific projections for the end of the century (2096–2100), under the RCP4.5 scenario, ET0 values are projected to range from 2.49 mm in January to 6.83 mm in June. This translates to a projected increase in ET0 ranging from 5.1 to 5.7% for different months by 2100 under RCP4.5. The projections for RCP8.5 demonstrate an even more pronounced trend. Under this scenario, ET0 values are projected to reach 2.68 mm in January and a peak of 7.3 mm in June. This represents a projected increase in ET0 varying between 11.2 and 12.6% for different months by the end of the century under RCP8.5.
The collective insights harvested from carry paramount significance for Nu and Ma. They not only spotlight a foreseeable augmentation in agricultural water requisites but also underscore potential complexities tied to managing water resources, owed largely to surging evapotranspiration metrics. summarizes the historical and increasing projection rates of ET0 in Nu and Ma under RCP4.5 and RCP8.5
Figure 7. Results of historical and mean projected crop water requirements for Nu.
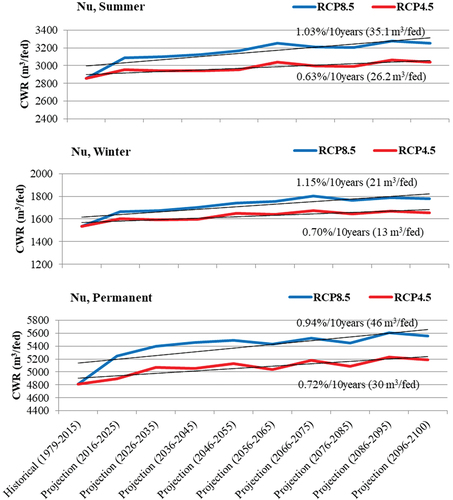
Table 2. Historical and increasing projection rates of ET0 in Nu and Ma under RCP4.5 and RCP8.5.
Impacts of climate change on crop water requirements
presents the projected crop water requirements for investigated summer, winter and permanent crops cultivated in Nu and Ma, under two RCPs: RCP4.5 and RCP8.5. These projections showcase the percentage increase in water demand over a 10-year horizon and for the end of the century, by 2100. Across both locations and RCPs scenarios, there is a clear trend of increasing in crop water requirements for all crops considered. This trend is consistent with expectations under climate change, where rising temperatures and ET0 can lead to increased crop water requirements (Jia et al., Citation2022).
Table 3. Historical and projected CWR for summer, winter and permanent crops in Nu and Ma under RCP4.5 and RCP8.5.
For summer crops, the CWR for sugar beet in Nu is projected to rise from 23.04 m3/fed/10 years under RCP4.5 to 30.1 m3/fed/10 years under RCP8.5 by the end of the century, equating to an increase of 10.2%. In contrast, the same crop in Ma exhibits a slightly lower percentage increase, from 23.71 m3/fed/10 years to 29.1 m3/fed, culminating in a 10.1% rise under RCP8.5 in 2100. Moving to cotton, the projections show a starker increase, with Nu expecting an increase from 34.56 m3/fed/10 years to 46.05 m3/fed/10 years, representing an 11.0% surge by 2100 under RCP8.5. Similarly, in Ma, cotton’s CWR is estimated to escalate by the same percentage, reaching 46.4 m3/fed/10 years by 2100 under RCP8.5. For summer maize the CWR in Nu under RCP8.5 is projected to jump by 9.5%, going from 28.8 m3/fed/10 years to 34.3 m3/fed/10 years. Ma shows a parallel trend, with an increase from 28.8 m3/fed/10 years to 30.9 m3/fed/10 years, which translates into a 9.3% hike under RCP8.5 in 2100. The watermelon is not exempt from this trend, with its CWR in Nu projected to ascend by 10.6% in 2100 under RCP8.5, moving from 27.648 m3/fed/10 years to 33.25 m3/fed/10 years. The same percentage increase is anticipated for Ma, with a forecasted climb from 31.10 m3/fed/10 years to 35.2 m3/fed/10 years. Sweet melon still faces a notable rise in CWR in Ma with 7.3% under RCP4.5 and 9.6% under RCP8.5 in 2100, escalating from 25.10 m3/fed/10 years to 28.6 m3/fed/10 years by 2100.
For winter crops in Nu, wheat is projected to have a CWR of 15.18 m3/fed/10 years, with 8.1% increasing rate in 2100 under RCP4.5. For Ma, the CWR for wheat is projected at 17.28 m3/fed/10 years with an increasing rate of 8.5%. Alfalfa shows a CWR of 8.06 m3/fed/10 years in Nu with a 6.5% increasing rate, whereas in Ma, it is slightly higher at 8.46 m3/fed/10 years with a 6.7% increasing rate. Winter potato CWR in Nu is projected at 18.89 m3/fed/10 years with a 7.1% increase rate in 2100, while in Ma it is significantly higher at 21.83 m3/fed/10 years with an 8.8% increasing rate in 2100. Winter squash requires 10.37 m3/fed in Nu and 12.81 m3/fed in Ma, with increasing rates of 5.4% and 6.3% respectively, in 2100. Broad bean recorded CWR of 17.28 m3/fed/10 years in Nu and a 6.5% increasing rate, compared to 19.49 m3/fed/10 years in Ma with a 6.9% increasing rate in 2100. CWR under the RCP8.5 are uniformly higher than those under RCP4.5 for both locations, which indicates that more severe climate conditions will likely increase the water demand for these crops. The percentage increasing rate also follows this trend, being higher under the RCP8.5 scenario across all crops and locations, reflecting the anticipated intensification of water requirements due to the effects of climate change.
Regarding to permanent crops in Nu, under RCP4.5, the CWR for orange is 52.97 m3/fed/10 years with a projected increase of 8.4% by 2100. This requirement rises under the RCP8.5 to 64.2 m3/fed/10 years with a 9.6% increase. For apple, the CWR under RCP4.5 is 60.51 m3/fed/10 years with an 8.1% increasing by 2100, increasing to 74.6 m3/fed and a 9.4% increase under RCP8.5. Grape have a lower CWR in Nu at 41.47 m3/fed/10 years, which is expected to increase by 7.8% under RCP4.5, and under RCP8.5, the CWR reaches 50.1 m3/fed/10 years with a 9.0% increase. Olives show a CWR of 54.06 m3/fed/10 years under RCP4.5 with an 8.5% increase by 2100, climbing to 62.7 m3/fed/10 years and a 9.6% increase under RCP8.5.
For Ma, the CWR under the RCP4.5 scenario for orange is 61.34 m3/fed/10 years with a projected increase of 9.7% by 2100, while under RCP8.5, it goes up to 69.8 m3/fed/10 years with a 10.3% increase. Apple require a CWR of 66.96 m3/fed/10 years with a 9.1% increase by 2100 under RCP4.5, escalating to 76.5 m3/fed/10 years with a 9.8% increase under RCP8.5. Grape in Ma will need 35.69 m3/fed with a 7.5% increase by 2100 under RCP4.5, which increases to 46.2 m3/fed/10 years with a 9.2% increase under RCP8.5. Olives have a CWR of 65.74 m3/fed/10 years with a 9.4% increase by 2100 under RCP4.5, rising to 78.3 m3/fed/10 years with a 10.1% increase under RCP8.5.
The CWR projections of Gabr (Citation2023) for Upper Egypt are marginally lower compared to the current study, which predicts a CWR increase of 5.9% and 9.7% under RCP 4.5 and 8.5 for the periods 2081–2100. Furthermore, Makar, Shahin, El-Nazer, Wheida, and Abd El-Hady (Citation2022) projected that by the year 2050, CWR in Egypt will escalate by 3 to 3.9% across various crop types. These projections are in alignment with the results of the present study.
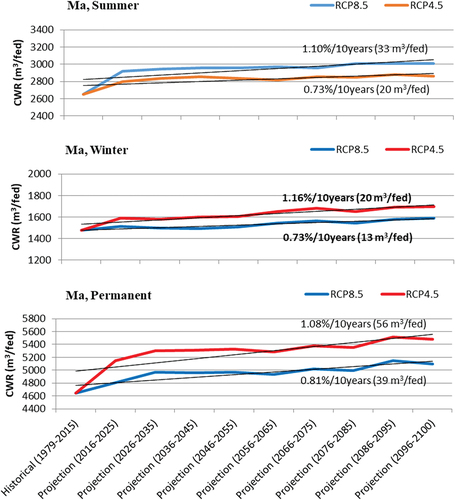
illustrate six graphs representing the mean projected crop water requirements for summer, winter and permanent crops in Nu and Ma. The data spans a historical period (1979–2015) and extends into future projections up to 2100 under two different RCPs: RCP4.5 and RCP8.5.
Figure 8. Results of historical and mean projected crop water requirements for Ma.
depicts the CWR trends for Nu. The projection period begins (2016–2100), there is a discernible divergence between the two climate scenarios. Under RCP4.5, the CWR increases for summer crops at a slower rate of 0.63% per decade, reaching an additional 26.2 m3/fed per decade. In contrast, under RCP8.5, which assumes a higher greenhouse gas concentration, CWR climbs at a more accelerated rate of 1.03% per decade, resulting in a larger increase of 35.1 m3/fed/10 years. For winter crops, a split in trajectories under the two future climate scenarios is detected. Under RCP4.5, an increase in CWR is noted at a rate of 0.70% per decade, translating to an additional 13 m3/fed by decade. RCP8.5 projects a steeper increase in CWR at 1.15% per decade, amounting to a more significant rise of 21 m3/fed/10 years. According to permanent crops, under RCP4.5, there is a moderate increase in water requirements at a rate of 0.72% per decade, suggesting a rise of 30 m3/fed by decade. In contrast, RCP8.5 projects a more pronounced increase at 0.94% per decade, which would lead to an increase of 46 m3/fed/10/years.
Ma follows a similar pattern of Nu, . For summer crops, projections indicate a rise under both climate scenarios, albeit at different rates. RCP4.5 shows a CWR increase of 0.73% per decade (an addition of 20 m3/fed/10 years), while RCP8.5 projects a greater increase of 1.10% per decade (33 m3/fed/10 years). For winter crops, projections indicate an upward trend for both scenarios. The rate of increase under RCP4.5 is 0.73% per decade, with a projected rise of 13 m3/fed/10 years. The more intensive RCP8.5 scenario estimates a 1.16% increase per decade, adding up to 20 m3/fed/10 years.
Similarly, for permanent crops, projections show an upward trend under both climate scenarios. For RCP4.5, the rate of increase is 0.81% per decade with an expected increase in CWR of 39 m3/fed/10 years. The RCP8.5 scenario projects a greater rise of 1.08% per decade, culminating in a 56 m3/fed increase by decade.
These visual trends suggest that, for both cities, the RCP8.5 scenario predicts a more substantial increase in CWR for summer crops than RCP4.5, consistent with its more severe greenhouse gas concentration trajectory. This information is critical for agricultural and water resource planning, indicating a more pressing need for water-saving strategies, improved irrigation technologies, and perhaps shifts in crop choices or planting schedules to mitigate the anticipated increase in water demands in a warmer, potentially drier future.
Moreover, these graphs underscore the potential impacts of climate change on agricultural water requirements in the region. They present a clear signal that adaptive measures may be required to sustain crop production without exerting unsustainable pressure on water resources, which could be exacerbated under the more severe climate change scenario of RCP8.5. This data should serve as a foundational element for policymakers, agronomists, and water resource managers as they prepare to navigate the challenges posed by climate change to the agricultural sector in Egypt.
The present findings concur with those of Mostafa et al. (Citation2021), who noted that the CWR for winter crops is expected to increase by 11.7 to 13.2% by the year 2100. Similarly, the CWR for summer crops is projected to rise by 9.3 to 10.9% by 2100 across various districts in Egypt.
Conclusion
Two case studies were selected in the Western Nile Delta of Egypt, one in the coastal area of Mahmodia and the other in the inland region of Nubaria. This study aims to examine the impact of climate change on the crop water requirements for major crops in the region. Climate projections were performed utilizing an ensemble of 40 Global Circulation Models for RCP4.5 and RCP8.5 climate scenarios. The CWR for the region’s main crops was estimated using the CROPWAT software.
The results reveal a consistent trend where CWR is expected to increase for all types of crops under both RCPs, but at different rates. RCP8.5, which assumes higher greenhouse gas emissions, projects a steeper rise in water demands for crops compared to RCP4.5.
In Nu, under RCP4.5, the CWR is projected to increase by 0.63%, 0.70% and 0.72% in decade for summer, winter and permanent crops, respectively. Under the more severe RCP8.5, the respective increases are 1.03%,1.15% and 0.94% per decade for summer, winter and permanent crops, respectively.
Ma exhibits similar trends for CWR increasing by 0.73%, 0.73% and 0.81% per decade for summer, winter and permanent crops, respectively, under RCP4.5. While, CWR increases by 1.10%, 1.16% and 1.08% per decade for summer, winter and permanent crops, respectively, under RCP8.5. These figures highlight a future with increased CWR, especially under the high-emission RCP8.5 scenario, emphasizing the need for efficient water management and adaptive agricultural strategies in Egypt.
Disclosure statement
No potential conflict of interest was reported by the author.
References
- Abd El-Kawy, O. R., Rød, J. K., Ismail, H. A., & Suliman, A. S. (2011). Land use and land cover change detection in the western Nile delta of Egypt using remote sensing data. Applied Geography, 31(2), 483–494. doi:10.1016/j.apgeog.2010.10.012
- Adeniyi, M. O. (2016). The consequences of the IPCC AR5 RCPs 4.5 and 8.5 climate change scenarios on precipitation in West Africa. Climatic Change, 139(2), 245–263. doi:10.1007/s10584-016-1774-2
- Allen, R. G., Pereira, L. S., Raes, D., & Smith, M. (1998). Guideline for computing crop water requirements. (FAO Irrigation and Drainage Paper 56). Rome, Italy. 65–125.
- Allen, S. K., Plattner, G. K., Nauels, A., Xia, Y., & Stocker, T. F. (2014). Climate change 2013: The physical science basis. An overview of the Working Group 1 contribution to the fifth assessment report of the Intergovernmental Panel on climate change (IPCC). In EGU General Assembly Conference Abstracts, Vienna, Austria (pp. 3544).
- Belda, M., Holtanová, E., Halenka, T., & Kalvová, J. (2014). Climate classification revisited: From Köppen to Trewartha. Climate Research, 59(1), 1–13. doi:10.3354/cr01204
- Clarke, D. 1998. CROPWAT for windows: User guide. http://tarwi.lamolina.edu.pe/~jgoicochea/Manuales/CROPWAT4W.pdf
- Dallison, R. J., Patil, S. D., & Williams, A. P. (2021). Impacts of climate change on future water availability for hydropower and public water supply in Wales, UK. Journal of Hydrology: Regional Studies, 36, 100866. doi:10.1016/j.ejrh.2021.100866
- El Afandi, G., & Abdrabbo, M. (2015). Evaluation of reference evapotranspiration equations under current climate conditions of Egypt. Turkish Journal of Agriculture - Food Science & Technology, 3(10), 819–825. doi:10.24925/turjaf.v3i10.819-825.481
- El-Rawy, M., Abdalla, F., & El Alfy, M. (2020). Water resources in Egypt. In Z. Hamimi, A. El-Barkooky, J. M. Frías, H. Fritz, & Y. Abd El-Rahman (Eds.), The geology of Egypt (pp. 687–711). Cham: Springer International Publishing.
- El-Shirbeny, M. A., Ali, A., & Saleh, N. H. (2014). Crop water requirements in Egypt using remote sensing techniques. Journal of Agricultural Chemistry and Environment, 3(2), 57–65. doi:10.4236/jacen.2014.32B010
- Flato, G., Marotzke, J., Abiodun, B., Braconnot, P., Chou, S. C. , and Forest, C. (2014). Evaluation of climate models. In climate change 2013: The physical science basis. Contribution of Working Group I to the fifth assessment report of the intergovernmental panel on climate change (741-866). Cambridge University Press.
- Gabr, M. E. (2023). Impact of climatic changes on future irrigation water requirement in the Middle East and North Africa’s region: A case study of upper Egypt. Applied Water Science, 13(7), 158. doi:10.1007/s13201-023-01961-y
- Gado, T. A., El-Hagrsy, R. M., & Rashwan, I. M. H. (2019). Spatial and temporal rainfall changes in Egypt. Environmental Science and Pollution Research, 26(27), 28228–28242. doi:10.1007/s11356-019-06039-4
- Gebaly, A. M., Nashwan, M. S., Khadr, W. M. H., & Shahid, S. (2023). Future changes in wind energy resources in Egypt under Paris climate agreements’ goals. Regional Environmental Change, 23(2), 1–14. doi:10.1007/s10113-023-02039-w
- Harris, I. P. D. J., Jones, P. D., Osborn, T. J., & Lister, D. H. (2014). Updated high-resolution grids of monthly climatic observations – the CRU TS3 .10 dataset. International Journal of Climatology, 34(3), 623–642. doi:10.1002/joc.3711
- Hurlbatt, A., Gibson, A. R., Schröter, S., Bredin, J., Foote, A. P. S. … Gans, T. (2017). Concepts, capabilities, and limitations of global models: A review. Plasma Processes and Polymers, 14(1–2), 1600138. doi:10.1002/ppap.201600138
- IDSC, Information and Decision Support Center. (2021). Egypt’s description by information (12th ed., p. 23). Cairo, Egypt: Information and Decision Support Center (IDSC), Egyptian Cabinet.
- Illangasingha, S., Koike, T., Rasmy, M., Tamakawa, K., Matsuki, H., & Selvarajah, H. (2023). A holistic approach for using global climate model (GCM) outputs in decision making. Canadian Journal of Fisheries and Aquatic Sciences, 626, 130213. doi:10.1016/j.jhydrol.2023.130213
- IPCC. (2000). IPCC special report on emission scenarios, SRES. Cambridge, UK: Cambridge University Press.
- Jia, K., Zhang, W., Xie, B., Xue, X., Zhang, F., & Han, D. (2022). Does climate change increase crop water requirements of Winter wheat and Summer maize in the lower reaches of the Yellow River Basin? International Journal of Environmental Research and Public Health, 19(24), 16640. doi:10.3390/ijerph192416640
- Jung, I. W., Bae, D. H., & Lee, B. J. (2013). Possible change in Korean streamflow seasonality based on multi‐model climate projections. Hydrological Processes, 27(7), 1033–1045. doi:10.1002/hyp.9215
- Jungudo, M. (2023). The impact of climate change in Egypt. In K. J. Ani (Ed.), Resource conflict and environmental relations in Africa (pp. 173–188). Singapore: Springer Nature Singapore.
- Kang, Y., Khan, S., & Ma, X. (2009). Climate change impacts on crop yield, crop water productivity and food security–a review. Progress in Natural Science, 19(12), 1665–1674. doi:10.1016/j.pnsc.2009.08.001
- Khalil, A. A. (2013). Effect of climate change on evapotranspiration in Egypt. The Researcher, 5(1), 7–12.
- Kheireldin, K., Roushdi, M., & Aboelkhear, M. (2020). Selection of the optimum global circulation model that mimics the circumstances of Egypt. The International Journal of Recent Technology & Engineering (IJRTE), 9(1), 784–793. doi:10.35940/ijrte.F1229.059120
- Knutti, R., Furrer, R., Tebaldi, C., Cermak, J., & Meehl, G. A. (2010). Challenges in combining projections from multiple climate models. Journal of Climate, 23(10), 2739–2758. doi:10.1175/2009JCLI3361.1
- Makar, R. S., Shahin, S. A., El-Nazer, M., Wheida, A., & Abd El-Hady, M. (2022). Evaluating the impacts of climate change on irrigation water requirements. Sustainability, 14(22), 14833. doi:10.3390/su142214833
- MALR, Ministry of Agriculture and Land Reclamation. (2010). Agricultural census results, agricultural year 2009-2010, Economic Affairs Sector, Ministry of Agriculture and land reclamation. Cairo, Egypt: Economic Affairs Sector, Ministry of Agriculture and Land Reclamation (MALR), Egypt.
- Meehl, G. A., Stocker, T. F., Collins, W. D., Friedlingstein, P., Gaye, A. T. , and Raper, S. C. (2007). Global climate projections. Chapter 10. New Jersey, U.S.A: Wiley.
- Mohamed, E. S., & Gouda, M. S. (2018). Assessment of agricultural sustainability in some areas west of Nile Delta. Egyptian Journal of Soil Science, 58(3), 309–323.
- Mostafa, S. M., Wahed, O., El-Nashar, W. Y., El-Marsafawy, S. M., & Abd-Elhamid, H. F. (2021). Impact of climate change on water resources and crop yield in the Middle Egypt region. Journal of Water Supply: Research and Technology-Aqua, 70(7), 1066–1084. doi:10.2166/aqua.2021.019
- Mostafa, S. M., Wahed, O., El-Nashar, W. Y., El-Marsafawy, S. M., Zeleňáková, M., & Abd-Elhamid, H. F. (2021). Potential climate change impacts on water resources in Egypt. Water, 13(12), 1715. doi:10.3390/w13121715
- Ndulue, E., & Ranjan, R. S. (2021). Performance of the FAO Penman-Monteith equation under limiting conditions and fourteen reference evapotranspiration models in southern Manitoba. Theoretical and Applied Climatology, 143(3–4), 1285–1298. doi:10.1007/s00704-020-03505-9
- Rochdane, S., Reichert, B., Messouli, M., Babqiqi, A., & Khebiza, M. Y. (2012). Climate change impacts on water supply and demand in Rheraya Watershed (Morocco), with potential adaptation strategies. Water, 4(1), 28–44. doi:10.3390/w4010028
- Roushdi, M. (2022). Spatio-temporal assessment of satellite estimates and gauge-based rainfall products in northern part of Egypt. Climate, 10(9), 134. doi:10.3390/cli10090134
- Smith, M. (1992). CROPWAT: A computer program for irrigation planning and management. FAO Irrigation and Drainage Paper 46, Rome, Italy.
- Ye, T., Zong, S., Kleidon, A., Yuan, W., Wang, Y., & Shi, P. (2019). Impacts of climate warming, cultivar shifts, and phenological dates on rice growth period length in China after correction for seasonal shift effects. Climatic Change, 155(1), 127–143. doi:10.1007/s10584-019-02450-5
- Zamani, R., Akhond-Ali, A. M., Roozbahani, A., & Fattahi, R. (2017). Risk assessment of agricultural water requirement based on a multi-model ensemble framework, southwest of Iran. Theoretical and Applied Climatology, 129(3–4), 1109–1121. doi:10.1007/s00704-016-1835-5
- Zhang, H., & Huang, G. H. (2013). Development of climate change projections for small watersheds using multi-model ensemble simulation and stochastic weather generation. Climate Dynamics, 40(3–4), 805–821. doi:10.1007/s00382-012-1490-1