
 ?Mathematical formulae have been encoded as MathML and are displayed in this HTML version using MathJax in order to improve their display. Uncheck the box to turn MathJax off. This feature requires Javascript. Click on a formula to zoom.
ABSTRACT
We are introducing cost effective, easily available brick sand nano-particles (BSNP) (44.208 nm) as an adsorbent in batch process for removal of heavy toxic metals such as Pb, Cd, and Cr from aqueous solution. We used two types of adsorbents, one is acid treated BSNP and other one is untreated BSNP, and investigated adsorbent properties with function of contact time, temperature, and pH. The efficiency or performance of adsorbent was characterized by AAS for percentage of removal from solution, EDS for elemental analysis to confirm the metals adsorption. The Langmuir, Freundlich, Temkin, Hill De Boer, Elovich, and Redlich-Peterson adsorption isotherms were studies to find out the quality of the adsorbent. At 5.68 to 7.6 pH, the maximum removal percentages of Pb, Cd, and Cr were 97% from the aqueous solution. The temperatures at 40℃ to 60℃, the Pb, Cd, and Cr experiments were carried out at their highest possible percentages (98%). The reaction process was pseudo-second order model and several thermodynamic factors, including Intraparticle diffusion, Elovich kinetic model, Boyd kinetic model, activation energy, Gibbs free energy, enthalpy change, and entropy change ensured the adsorbent efficiency of brick sand nanoparticles. The results of present research indicated that Brick Sand Nano-Particles (BSNP) may play a vital role as a cost-effective, efficient, and easily available adsorbent for the removal of Pb, Cd, and Cr from wastewater.
Introduction
Water pollution is a severe environmental issue in the world and brings uncountable challenges. The peoples are suffering for safe water due to water pollution every time by industrial effluents. Many countries are already suffering for heavy toxic metal arsenic. Beside that, Lead, Chromium, and Cadmium pollution are added as an additional pollutant in water. It is very difficult and costly for the peoples to buy the expensive filter or community filter to remove the toxic metals for safe drinking water. Most of them are using heavy metals (like Lead, Chromium, and Cadmium) contaminated polluted water and suffering with severe health issues. Lead-acid processing and lead-acid recycling industries are the 85.18% sources of lead (Majumder, Al Nayeem, Islam, Akter, & Carter, Citation2021). Burning fossil fuels like coal or oil and incinerating municipal garbage like plastics and nickel-cadmium batteries are the primary sources of chromium and cadmium along with the effluent from the leather industry and the electroplating industry. By consume high level of heavy metals like Cd, Cr, and Pb, human body are suffering for life threating health issues like the liver, kidneys, blood vessels, and central nervous system disorder diseases. To remove heavy metals from wastewater, many techniques are reported in literatures, such as chemical precipitation (Oncel, Muhcu, Demirbas, & Kobya, Citation2013), oxidation and reduction (Khan, Sayed, Sohail, Shah, & Raja, Citation2019), ion exchange (Kansara, Bhati, Narang, & Vaishnavi, Citation2016), reverse osmosis (Ozaki, Sharma, & Saktaywin, Citation2002), and adsorption (Ihsanullah et al., Citation2016). However, all of the techniques are not popular to the user level due to high cost of media or filter or adsorbent.
To consider the cost and efficiency of the adsorbent, we are trying to find out the most efficient and economical affordable adsorbent in most popular adsorption process. There are more than 100 different types of efficient adsorbent used in adsorption process which were reported in literatures, including sawdust (Bulut & Tez, Citation2007), limestone (Aziz, Adlan, & Ariffin, Citation2008), brick clay (Sanad, Moniem, Abdel-Latif, Hossein, & El-Mahllawy, Citation2021), rice husk (Chuah, Jumasiah, Azni, Katayon, & Choong, Citation2005), tea waste (Amarasinghe & Williams, Citation2007), orange peel (Feng, Guo, Liang, Zhu, & Liu, Citation2011), sugar industry waste (Gupta, Jain, Ali, Sharma, & Saini, Citation2003), red mud (Gray, Dunham, Dennis, Zhao, & McGrath, Citation2006), coconut waste (Anirudhan & Sreekumari, Citation2011), powder of calcined brick (Krishna & Swamy, Citation2012), peanut hull (Brown, Jefcoat, Parrish, Gill, & Graham, Citation2000), and more.
Using crushed clay bricks as an adsorbent might remove more than 60% of Pb and Cd from wastewater (Lin, Citation2006). Using surkhi, a locally produced brick sand particle, Cr was removed 94% from wastewater (Karim, Dipti, & Azad, Citation2021). Brick kiln chimney waste was the type of adsorbent that was 87.7% effective in removal of Cr(VI) from an aqueous environment (Yang et al., Citation2022).
Brick particles has a great potential for removing heavy metals from wastewater as an adsorbent. Brick particles have abundant resources throughout the world. Moreover, due to its low swelling and water dispersion properties brick particles has been reported to be a better adsorbent for metals adsorption on it nano-lamellar structural silicate minerals contained surfaces (Barati, Asgari, Miri, & Eskandari, Citation2013). Therefore, the brick particles may widely use at a low cost in wastewater purification if we can use it without pretreatment.
In our investigation, we are using brick sand nanoparticles as an adsorbent in batch adsorption process for removal of Pb, Cd, and Cr, which is affordable in cost, easily available, efficient, and may take attention gross level user as well as industry owner. For that purpose, we take grade 3 brick and crushed it like powder. According to physical properties, the major advance of the Third-class brick is -it can absorb about 25 % moisture or water of dry weight. The major drawback of this adsorbent is a) it is very soft, b) it is not suitable for prolong time, and c) it needs to change periodically. Counting the absorption advantages, we make two types of adsorbents one is untreated and other is treated by sulfuric acid. The nanoparticles size was confirmed by XRD spectrum and calculated by using Scherrer Equation. The batch adsorption process was contact with three different condition such as 1) contact time, 2) temperature, and 3) pH. The percentage of removal of heavy metals was investigated by AAS. By the investigation of Energy Dispersive X-ray Spectroscopy (EDS), we can analysis the element presents in the sample to confirm the adsorption. Langmuir, Freundlich, Temkin, Hill DeBoer Isotherm, Elovich isotherm, and Redlich-Peterson adsorption isotherms were studies to find out the quality of the adsorbent. We also investigated the kinetics of the adsorption process by intraparticle diffusion, Boyd and Elovich kinetic model, as well as several thermodynamic factors, including activation energy, Gibbs free energy, enthalpy change, and entropy change characterizes the adsorbent efficiency of brick sand nanoparticles.
Materials and methods
Materials: Potassium dichromate (Merck India), cadmium sulfate hydrate (Sigma-Aldrich), Lead (II) chromate (Sigma-Aldrich), H2SO4 acid (Sigma-Aldrich) deionized water etc.
Collection and preparation of adsorbent
In the current study, heavy metals like Cd, Cr, and Pb were removed from aqueous solution using brick sand nanoparticles (44.208 nm-sized) as an adsorbent. Class 3 grade brick adsorbent was collected from the local area. Utilizing locally built machinery, the collected brick was broken down like powder and passed through the screener. The brick sand particle adsorbent was cleaned with deionized water and let dry for 1day in the sun. For our analytical study, two types of adsorbents were used, one was the untreated brick sand particles, and the other brick sand particles was treated with 0.5N H2SO4 acid.
Preparation of stock solution
Cd, Cr, and Pb stock solutions were made using an analytical method. For 500ppm of Cr, 0.706825 g of potassium dichromate was used, while for 500ppm of Cd, 0.570367 g of cadmium sulfate hydrate was used in 500 ml of stock solution. Similarly, 500 ml of a stock solution with 500 ppm Pb was created using 0.389953 g of lead chromate.
Research design and batch adsorption studies
Brick sand nanoparticles were utilized to remove the Cd, Cr, and Pb, which have specific properties that help the adsorption of heavy metals. At first, dying the brick sand nanoparticles, the percentages of moisture content in the adsorbent were calculated after the 250 g brick nanoparticles were dried in the sun for 1 day. The following equation was used to determine the moisture content (Nielsen, Citation2010):
In our study, the sample was taken at 250 g, and the weight of moisture was 15 g. Thus, the % of moisture content was as follows:
A 500 ml beaker was filled with 100 ml of a 500ppm sample of Pb, Cd, and Cr. The sample was heated to various degrees using a water bath. Samples were heated for 10 minutes at 30°C, 20 minutes at 40°C, 30 minutes at 50°C, 40 minutes at 60°C, and 50 minutes at 70°C. The effect of pH was studied at pH 5.6 to 8.7. The 98% or more than removal of Pb, Cd, and Cr were effective at lower pH 5.6 to 7.5. The pH was maintained by using NaCl pellets.
Characterizations
AAS was analyzed to determine the existing concentration of a solution in ppm. By AAS (atomic absorption spectroscopy) result, we determined the percentage of Cd, Cr, and Pb removal from the water. Residual brick sand nanoparticles were used for the elemental analysis by using Energy Dispersive X-ray Spectroscopy (EDS). The XRD investigation was performed to determine the brick sample’s particle size.
Adsorption isotherm studies
Langmuir adsorption isotherm
In 1916, Langmuir demonstrated a monolayer equation for deposited on the adsorbent’s outer surface; no further adsorption takes place on the surface after absorption. The distribution of metal ions in a system’s solid phase and liquid phase at equilibrium is represented by Langmuir. When a monolayer is deposited onto a surface with a finite number of identical sites, the Langmuir isotherm remains true. This model precludes adsorbate transmigration in the surface plane while allowing uniform deposition impulses onto the surface (Langmuir, Citation1918). According to these scientific presumptions, Langmuir provided the following equation:
Langmuir adsorption parameters are determined by using the linear form of the following equation,
Here, Ce =equilibrium concentration of adsorbate, qe = amount of metal adsorbed per gram of the adsorbate at equilibrium, qmax = maximum monolayer coverage capacity, Kι = Langmuir isotherm constant.
Here, the value of qmax and Kι were found by computing versus
plot in Origin Lab Software program. For plotting regression line or fitting the equation, the Langmuir isotherm may be expressed by the following equation, or equilibrium constant
which is dimensionless.
where, C0 = initial concentration of the solution, Rl = a constant related to the energy of adsorption by surface area or the Langmuir constant. Rl constant indicates; if Rl >1, nature of adsorption to be either unfavorable, if Rl = 1, nature of adsorption to be favorable and linear, if, 0 < Rl <1, nature of adsorption to be favorable, if, Rl = 1, nature of adsorption to be irreversible.
Freundlich adsorption isotherm
For heterogeneous surfaces, the Freundlich adsorption isotherm scientifically described the adsorption properties and characteristics in 1859. Freundlich (Citation1906), postulated an equation for multilayer adsorption onto heterogeneous adsorption process. Freundlich proposed the following empirical equation for modeling data:
For data modeling, the following log-based linear formula is found:
where, Kf = Freundlich adsorption isotherm constant, n= adsorption intensity of this process, Ce = equilibrium concentration of adsorbate, and Qe = amount of metal absorbed per gram of adsorbent at equilibrium stage. The constant Kf indicates the adsorption capacity of this process, while is a function of strength in an adsorption process. It assumes that, if n = 1, then the partition of the two phases is independent, if
<1, then it indicates a normal adsorption, if
>1, then it indicates cooperative adsorption. The linear square method is widely used to describe n and Kf parameter. We used Origin program for fitting the linear data model.
Temkin adsorption isotherm
The adsorbate–adsorbate interactions on the adsorption process were drive by Temkin isotherm model (Temkin & Pyzhev, Citation1940). The Temkin isotherm is valid only for an intermediate range of ion concentrations (Shahbeig, Bagheri, Ghorbanian, Hallajisani, & Poorkarimi, Citation2013).
Temkin Adsorption isotherm implies that the heat of adsorption of all molecules in the layer would not be decreased logarithmically but linearly by ignoring the extremely low and high concentration value. In the implementation of this equation between absorbate and absorbent, the maximum value of binding energies was carried out by plotting Qe against lnCe and the constant of this equation is determined by the linear equation y = mx + c. Temkin equation follows:
Lets,
Thus, the equation is written following linear form,
Here, the binding constant of Temkin isotherm, bT = the Temkin isotherm constant, R= the molar gas constant, T= the temperature variable at K, and B= the constant related to heat sorption.
Hill isotherm model
Hill-Deboer Model. The Hill-Deboer isotherm model describes a case where there is mobile adsorption as well as lateral interaction among adsorbed molecules (De Boer, Citation1953; Hill, Citation1946). The linearized form of this isotherm equation is as follows (Kumara, Ramalingamb, Kiruphac, Murugesanc, & Vidhyarevicsivanesam, Citation2010):
where is Hill-Deboer constant and
is the energetic constant of the interaction between adsorbed molecules. Equilibrium data from adsorption experiments can be analyzed by plotting ln [
(1 −
)/
] −
/(1 −
) versus
[Kumara et al. 20010].
Elovich isotherm model
The literature claims that Dusart et al (Dusart, Bouabane, & Mazet, Citation1991) published research article is the first original source of the Elovich adsorption isotherm. But, Roginsky and Zeldovich was the first exponential function proposed authors (Landsberg, Citation1955; Roginsky & Zeldovich, Citation1934). The equation was rearranged by (Dusart, Bouabane, & Mazet, Citation1991), and the equation is consist of two parameters in it linear form. The Elovich adsorption isotherm linear form is given as below (Ayawei, Ebelegi, & Wankasi, Citation2017):
The maximum adsorption capacity and adsorption constant can be calculated from ln qe/Ce versus qe curve slope and intercept, respectively. The Elovich model can study the adsorption rate based on absorption capacity on heterogeneous surfaces.
(Dusart, Bouabane, & Mazet, Citation1991) used the linearized Elovich equation to describe the adsorption of amino acids by activated carbon. A follow-up study published in 1995 by Ferrandon et al. applied the linearized expression to the adsorption data of several water pollutants. The Elovich equation lay dormant until the mid-2000s when [(Mec¸abih, Kacimi, & Bouchikhi, Citation2006)], Hamdaoui [(Hamdaoui, Citation2006)], and Hamdaoui and Na rechoux [(Hamdaoui & Naffrechoux, Citation2007)] used the linearized Elovich expression to fit the adsorption data of several water contaminants. Today, when using the Elovich equation to fit water contaminant adsorption data, the linearized form is preferred.
Redlich-peterson isotherm
The Redlich-Peterson isotherm is three-parameter isotherms. The Redlich-Peterson isotherm model is a combination of the Langmuir and Freundlich isotherms. This model is an empirical isotherm model incorporating three parameters. The principle of this adsorption isotherm is a mix of both Langmuir and Freundlich equations and does not follow ideal monolayer adsorption (Brouers & Al-Musawi, Citation2015). The Redlich-Peterson isotherm model can be expressed linear form as follows (Kiseler, Citation1958):
where A = constant of Redlich-Peterson isotherm, β is exponent that lies between 0 and 1, Ce = concentration of the adsorbent at equilibrium liquid-phase, and qe = equilibrium of adsorbate loading on the adsorbent. The plot of (Ce/qe) versus ln Ce can determination the Redlich-Peterson constants, where slope is β and intercept is A (Brouers & Al-Musawi, Citation2015; Chan, Cheung, Allen, & McKay, Citation2012; Ng, Cheung, & McKay, Citation2002; Wu, Liu, Wu, & Tseng, Citation2010). The linear Redlich-Peterson isotherm model is dependent on concentration. This is versatile model in both homogeneous or heterogeneous systems and the adsorption equilibrium is representing a wide range of concentration of adsorbate (Gimbert, Morin-Crini, Renault, Badot, & Crini, Citation2008; Sips, Citation1948).
Adsorption diffusion models
Intra-particle diffusion model
Webber-Morris expressed an important adsorption process that the uptake of adsorbates varies proportionally with the square root of time (t 1/2) (Ben Hamissa, Brouers, Ncibi, & Seffen, Citation2014). The linear form of the model is as follows (Vadivelan & Vasanth, Citation2005);
Here, KIPD is intra-particle diffusion constant, and C is intercept. The intra-particle diffusion alone is the rate determining step then a plot of qt vs t 1/2 appears as a linear graph.
Elovich model
The Elovich model is describing adsorption processes that follow second-order
kinetics which is involved in chemical absorption without desorption of the products in the surface of the heterogeneous nature adsorbent (Cheung, Porter, & McKay, Citation2000; Dotto & Pinto, Citation2011). The Elovich model can be written as follows (Elovich & Larionov, Citation1962; Wu, Tseng, & Juang, Citation2009):
Here, qt is adsorption capacity at any time t, α is initial adsorption rate, β is adsorption constant. Both the initial adsorption rate (α) and adsorption constant (β) can be determined from a linear plot of qt versus lnt.
Boyd model
The Boyd model predicts the rate determining step (slow step) involved in the adsorption process. The Boyd kinetic model is represented by the following expression (Badruzzman, Westerhoff, & Knappe, Citation2004; Boyd, Schubert, & Adamson, Citation1947):
Here, F = the fraction of metal ion adsorbed at any time, t; qe = amount adsorbed at equilibrium, qt = amount adsorbed at time t, and Bt = mathematical function of F. If Bt vs t plot is a straight line, then the processes is governed by Boyd kinetic model.
Pseudo-second order reaction equation
The expression of Pseudo-first order reaction is
When n = 2, the expression is obtained for the pseudo-second-order reaction, which follows:
By integrating this equation, the conditions t = 0 and t = t gives the following form:
The linear mathematical model of this equation is written in the following form
where, = the amount of adsorbate in the adsorbent at equilibrium,
=constant rate for second order, t = contract time between solid and liquid
Thermodynamics
In this process, thermodynamics parameters such as free energy of adsorption, the heat of the adsorption process, and standard entropy changes can be evaluated by the following equation
where kd is adsorption distribution coefficient. The kd values are used to determine Gibbs’s free energy at different temperature ranges. Thus, the Gibbs free energy is
where, ΔG0 = is the free energy of the adsorption process(kJ/mol), T= is the Kelvin temperature, and R=is the universal gas constant (8.316 J/mol K)
The distribution constant of this process is determined by the term’s standard entropy changes and temperature changes function
where, ΔH0 = is the heat of adsorption (kJ/mol), ΔS0 = is the standard entropy changes (kJ/mol). The values of ΔH0 and ΔS0 are obtained by plotting 1/t vs ln k(l) in origin lab software.
Result and discussion
In , XRD peaks are very sharp and having high intensity which means particles are solid crystalline. We calculated the particles size using Scherrer equation and obtained size was 44.2107825 nm. The particles size indicating the brick sand particles are nanoparticles in size. The Scherrer equation which was used to estimate the average particle size of brick particles as follows:
Figure 1. XRD spectrum of brick sand particles.
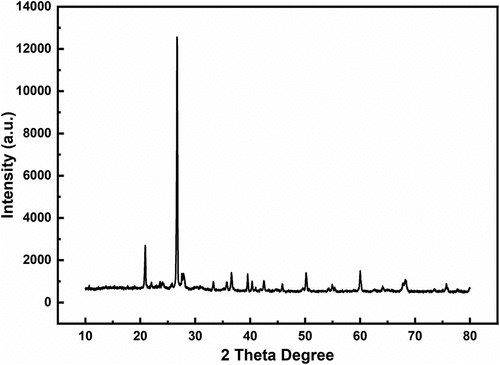
Here, D = Crystalline Size (nm), β = Line Broadening at FWHM -Radians, θ (Bragg Angle) = Peak Position (Radians), and λ = X-ray Wavelength K= Scherrer Constant, 2θ= 26.68542 degrees.
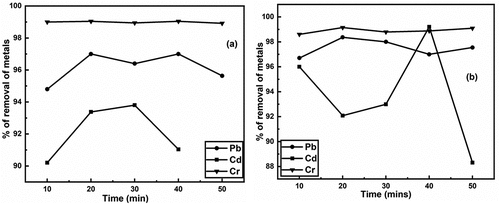
The is illustrating the impact of contact time on Pb, Cd, and Cr metal removal from aqueous solution using both untreated and treated BSNP as an adsorbent. is representing effect of contact time using untreated BSNP, and is representing effect of time using treated BSNP as an adsorbent. In case of removal of Cr, there is no effect contact time in both adsorbent as it is shown in . And in both cases, 99% Cr metal was removed from aqueous solution. But in case of Pb and Cd, time is showing a significant in both adsorbent as we can see in . In removal of Pb metal, removal % of Pb metal fluctuated with respect to time and maximum 97 % of Pb metal was removed for untreated BSNP and 98.385 % for treated BSNP within time 20 min. In removal of Cd metal, time has also significant effect like Pb metal. The maximum 96 % of Cd metal was removed at 40 min using treated BSNP as shown in .
Figure 2. a) removal of heavy metals (pb, Cd & Cr) using untreated and b) removal of heavy metals (pb, Cd & Cr) using treated brick nano particles as an adsorbent with respect to time.
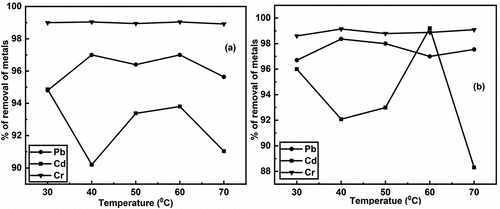
The effect of temperatures is showed in the following . In the removal rate of Cr metal, there were no significant effect on temperature range with this experiment in both adsorbent. But in case of Pb, temperature has a significant effected. At temperature 40°C, treated BSNP had the highest removal rate 98.365% for Pb as shown in , while at temperature 40°C and 60°C, untreated BSNP demonstrated the effective removal rate 97%. At 30°C temperature, the removal rate of Cd metal using untreated BSNP was the highest (94.865%), while at 40°C temperature, it was the lowest (90.2%) as shown in , respectively. However, the removal rate for Cr metal was nearly 99% which was the highest among Pb, Cr, and Cd as shown in .
Figure 3. a) removal of heavy metals (pb, Cd & Cr) using untreated and b) removal of heavy metals (pb, Cd & Cr) using treated brick nano particles as an adsorbent with respect to temperature.
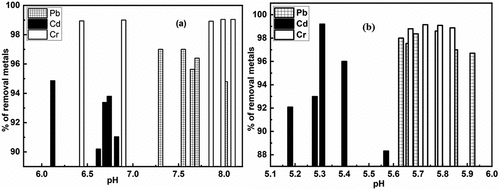
Acidic and basic media were used to show the removal of Pb, Cd, and Cr, as indicated in the . Removal of Pb with untreated BSNP in slightly basic conditions was best. At pH 7.35 to 7.6, the maximum removal rate which was 97% as shown in . By lowering the pH, the removal rate of Pb was significantly reduced. Cd had the maximum removal percentage for untreated brick particles at a 6.12 pH of 94.865% as shown in . However, treated brick particles resulted in higher Cd removal percentages at lower pH (at 5.3), which was 99.2% represented by . Both treated and untreated brick particles were found to have more than sufficient removal capability in mildly basic and acidic environments. Both slightly acidic and basic media successfully removed over 98.9% to 99 % of Cr from untreated and treated brick particle environments as shown in .
Figure 4. a) removal of heavy metals (pb, Cd & Cr) using untreated and b) removal of heavy metals (pb, Cd & Cr) using treated brick nano particles as an adsorbent with respect to pH.
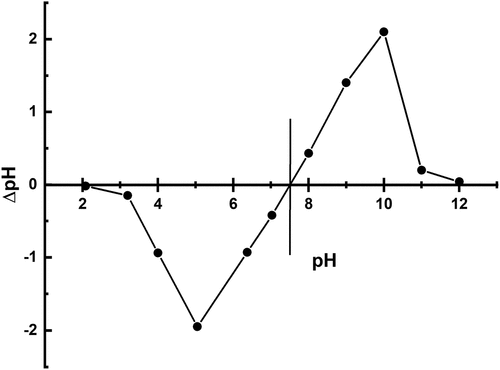
The pH of the solution is an important parameter influencing the adsorption process and it can also affect the adsorbent surface charge (Mayakaduwa et al., Citation2016). This important property can be explained by analyzing point of zero charge. The point of zero charge value of brick sand nanoparticles is 7.5 as shown in . From the , when pH of the solution is lower than pHpzc, the surface of the adsorbent is predominating by negative charge, on the other hand, at the pH values above pHpzc, the surface charge of the adsorbent is positive in charge. Therefore, we may conclude that the adsorption process is dominating by slightly acidic to slightly basic media and which is agreed with the applied experimental condition.
Figure 5. Point zero charge (pHPZC) for adsorbent.
Studies on adsorption isotherms
Langmuir Adsorption Isotherm Model: In this research was investigated for both untreated and treated BSNP adsorbent efficiency in which experimental data of Pb were fitted with Langmuir adsorption isotherm model using origin Lab software. And from the plot versus
and Equationequation 4
(4)
(4) , calculated the values of
were 0.857083 and 0.9397008, respectively, which were less than 1 as mentioned in . Following the Langmuir Adsorption Isotherm assumption, the untreated and treated brick particles is showed favorable adsorption isotherm performance. The results showed that the untreated and treated BSNP have good correlation coefficients (
= 0.9998 and 1) which is indicating an acceptable agreement between experimental data and isotherm parameters as shown in and shown in .
Figure 6. Fitting of Longmuir adsorption isotherm model for removal of heavy metals using untreated and treated brick sand nanoparticles for Pb [(a) &; (b)], Cd [(c) &; (d)] and Cr [(e) &; (f)].
![Figure 6. Fitting of Longmuir adsorption isotherm model for removal of heavy metals using untreated and treated brick sand nanoparticles for Pb [(a) &; (b)], Cd [(c) &; (d)] and Cr [(e) &; (f)].](/cms/asset/28463e90-a705-4adb-b4cf-50004b6bab3f/twas_a_2307197_f0006_b.gif)
Table 1. Summary of the three-adsorption model used in the study for removal of heavy toxic metals (pb, Cd & Cr) from aqueous solution using brick sand nanoparticles as an adsorbent.
In case of Cd metal, the values for untreated and treated BSNP were 1.0382970 and 0.405853488, respectively, as shown in . Among the two values of
, one being more significant than one and the other being less than 1. In agreement with the Langmuir Adsorption Isotherm assumption, untreated brick particles show unfavorable isotherm performance, while treated brick particles showed the best ability. Both untreated and treated brick particles have decent correlation coefficients (=0.99998 and 1), noting experimental data and isotherm parameters negotiated as shown in .
In case of Cr metal, the value of Rl both untreated and treated BSNP were 1.19629317 and 0.405853488, respectively. The one value was greater than one and the other less than 1 as shown in , according to the Langmuir Adsorption Isotherm assumption, untreated brick particles have unfavorable adsorption isotherm performance, whereas treated brick particles have the better isotherm performance (Rl was 0.405853488). The untreated and treated brick particles both have a good correlation coefficients (R2 =0.9996 and 0.9997), indicating that the experimental data and isotherm parameters agreed well enough as shown both in and .
Freundlich Adsorption Isotherm Model: showed that the 1/n values for both the untreated and treated brick particles are 0.9974 and 0.99874 for removal of Pb metal and which were less than 1. The Freundlich Adsorption Isotherm indicated that it is favorable for isotherm and that the adsorbent quality is outstanding. The value of R2 for untreated and treated brick particles has values of 0.9992 and 1, indicating a better adsorption isotherm as shown in ).
Figure 7. Fitting of Freundlich adsorption isotherm model for removal of heavy metals using untreated and treated brick sand nanoparticles for Pb [(a) &; (b)], Cd [(c) &; (d)] and Cr [(e) &; (f)].
![Figure 7. Fitting of Freundlich adsorption isotherm model for removal of heavy metals using untreated and treated brick sand nanoparticles for Pb [(a) &; (b)], Cd [(c) &; (d)] and Cr [(e) &; (f)].](/cms/asset/83beebff-31be-421f-bad6-b355547a70f7/twas_a_2307197_f0007_b.gif)
In case of Cd metal, the 1/n values for untreated and treated BSNP were 1.0033 and 0.99815, respectively, as shown in . From the 1/n value, it can be easily assumed that untreated BSNP was less effective adsorbent than the treated BSNP adsorbent. The fitting of experimental data with Freundlich adsorption isotherm using origin software, the R2 values were 0.99997 and 1 for untreated and treated BSNP adsorbents, respectively. The resultant values were indicating that the adsorbent meets the Freundlich Adsorption Isotherms as shown in ).
For removal of Cr metal, the 1/n values for untreated and treated BSNP were 1.00113 and 0.99516, respectively. The 1/n value of treated BSNP was better than untreated BSNP adsorbent. The R2 values for untreated and treated BSNP were 0.99971 and 0.999784, respectively, showing that both adsorbents satisfied the Freundlich Adsorption Isotherms as shown in ) respectively.
Temkin Adsorption Isotherm Model: The untreated and treated BSNP Temkin Adsorption Isotherm for Pb metal are shown in . In both untreated and treated BSNP adsorbents, the value of R2 were nearly 1 as shown in ), respectively. This value indicates that both of the adsorbents perform exceptionally well. The values of BT were 0.35882 and 0.21589 for untreated and treated BSNP adsorbents, the KT values were 0.141688 and 0.2387362, indicating that it performed Temkin Adsorption Isotherm signify good as shown in .
Figure 8. Fitting of Temkin adsorption isotherm model for removal of heavy metals using untreated and treated brick sand nanoparticles for Pb [(a) &; (b)], Cd [(c) &; (d)] and Cr [(e) &; (f)].
![Figure 8. Fitting of Temkin adsorption isotherm model for removal of heavy metals using untreated and treated brick sand nanoparticles for Pb [(a) &; (b)], Cd [(c) &; (d)] and Cr [(e) &; (f)].](/cms/asset/d0ed0dde-1121-4d66-b480-471ca60c987d/twas_a_2307197_f0008_b.gif)
For removal of Cd metal, using untreated and treated BSNP adsorbents, the BT and KT values in Temkin Adsorption Isotherm were significantly good, which were 10.498 and 0.07633, 5.233 and 0.24189, respectively, as shown in . These values are indicating that both the untreated and treated BSNP adsorbents are satisfied Temkin Adsorption Isotherm very well. The values of R2 are 0.99018 and 0.82805, which indicates that untreated BSNP was perform well and treated one as shown in ).
In case of removal Cr metal, the values of R2 both untreated and treated BSNP adsorbents were 0.99839 and 0.99598 as shown in and ). The values of R2 are indicating that both untreated and treated BSNP adsorbents are better performing in removal of Cr metal and satisfied Temkin Adsorption Isotherm. The BT and KT values for untreated and treated BSNP were 0.5603 and 0.487737 and 0.4918 and 0.557, respectively, as shown in .
Hill De Boer Adsorption Isotherm: The is representing the experimental data fitted with Hill De Boer adsorption isotherm. The Hill-Deboer constant K1 is describing the interaction between adsorbent and adsorbate. The higher value of K1 indicates a good interaction between adsorbent-adsorbate (Ragadhita & Nandiyanto, Citation2021). The K1 values are showing in . The all values of K1 are very favorable for adsorbent and adsorbate interaction. But due to the value of R2 in the adsorption process, the Cr metal removal percentage became higher than others.
Figure 9. Fitting of Hill De Boer adsorption isotherm model for removal of heavy metals using untreated and treated brick sand nanoparticles for Pb, Cd, and Cr.
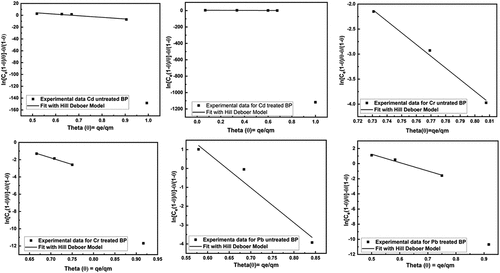
Table 2. Summary of the hill de boer, elovich and redlich-petersons adsorption model used in the study for removal of heavy toxic metals (pb, Cd & Cr) from aqueous solution using brick sand nanoparticles as an adsorbent.
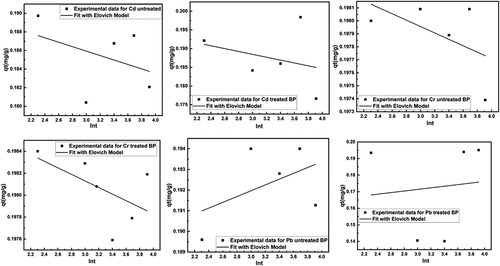
Elovich Adsorption Isotherm: The is representing the experimental data fitted with Hill De Boer adsorption isotherm. The Hill-Deboer constant K1 is describing the interaction between adsorbent and adsorbate. The higher value of K1 indicates a good interaction between adsorbent-adsorbate [(Ragadhita & Nandiyanto, Citation2021)]. The K1 values are showing in . The all values of K1 are very favorable for adsorbent and adsorbate interaction. But due to the value of R2 in the adsorption process, the Cr metal removal percentage became higher than others.
Figure 10. Fitting of Elovich adsorption isotherm model for removal of heavy metals using untreated and treated brick sand nanoparticles for Pb, Cd, and Cr.
Redlich-Petersons Adsorption Isotherm: The sorption of heavy toxic metal onto BSNP following the linear form of Redlich–Peterson isotherm was shown in which were plotted between ln (Ce/qe) versus ln (Ce). However, the Redlich–Peterson isotherm equation contains three unknown parameters. Redlich–Peterson isotherm equation was fitted with the experimental data and a theoretical data to maximize the determination of coefficient R2 from the linearized form.
Figure 11. Fitting of redlich-petersons adsorption isotherm model for removal of heavy metals using untreated and treated brick sand nanoparticles for Pb, Cd, and Cr.
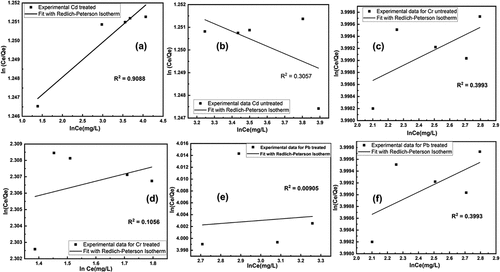
The Redlich–Peterson constants were calculated and their corresponding linear regression coefficient of determination were summarized in . It was observed from the that the R2 value for Redlich–Peterson isotherm was found to be more or less nearer to the best-fit Langmuir, Freundlich, Temkin, Elovich and Hill De Boer adsorption isotherm.
Adsorption diffusion models
Intra-particle diffusion model
From equation of the model, linear plotted qt versus t0.5 were presenting in . And the diffusion model data are summarized at . If the line pass through the origin means intraparticle diffusion is the sole rate-limiting step. If it was observed that plotted line did not go through the origin indication that intraparticle diffusion was not only the rate-limiting step, it is a multiple steps like boundary layer diffusion or other processes take place (Özacar, Citation2003). From the , the kinetic modeling has shown that adsorption capacity increased with increasing temperature which recommends chemisorption reaction between the adsorbent and the metal ions (Ho & Ofomaja, Citation2006)]. As adsorption temperature increased, the mobility of the metal ions reduced because of chemisorption similarly reducing the diffusion of the metal ions into the adsorbent of the inner surface, resulting the reduction of intraparticle diffusion rate constant with temperature. Besides that, the values of intercept, C, recommended boundary diffusion or surface adsorption. It may conclude that surface adsorption was prominent as temperature was increased.
Figure 12. Fitting of Intra-particle diffusion model for removal of heavy metals using untreated and treated brick sand nanoparticles for Pb, Cd, and Cr.
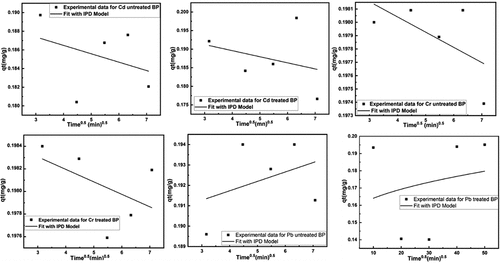
Table 3. Summary of the intra-particle diffusion, elovich and boyd kinetic model used in the study for removal of heavy toxic metals (pb, Cd & Cr) from aqueous solution using brick sand nanoparticles as an adsorbent.
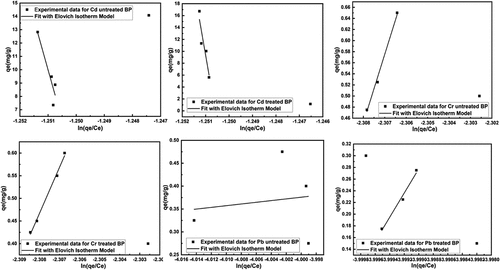
Elovich Kinetic Model: The assumption of t>>t0 and validity of EquationEquation (14)(14)
(14) is checked by the linear plot of qt vs. ln t. shows that when the mass of sorbent is fixed, the increase in concentration caused the constant a to increase but the constant b to decrease. When the concentration was fixed, the effect of increasing the mass of sorbent increased the constants a and b. The are showing Elovich kinetic model for removal of the heavy toxic metals Pb, Cd, and Cr. The kinetic model data are summarized in . The R2 values of the adsorption isotherm are indicating that the adsorption processes are favorable except the removal of Pb using untreated BSNP.
Figure 13. Fitting of Elovich kinetic model for removal of heavy metals using untreated and treated brick sand nanoparticles for Pb, Cd, and Cr.
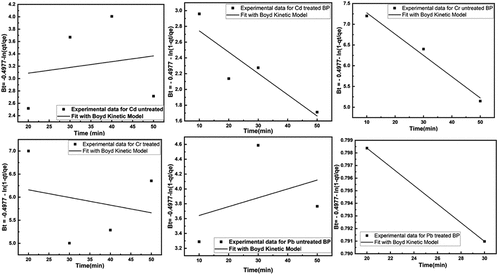
Boyd Model: The diffusion is the limiting step of the adsorption process, due to the adsorbent particle. The experimental data were adjusted to the Boyd kinetic expression as shown in . The experimental data did not pass through the origin and did not follow absolutely the linear trend. This experimental data was demonstrated and controlled both by the effects of intraparticle diffusion and external diffusion. The kinetic model data are summarized in .
Figure 14. Fitting of Boyd model for removal of heavy metals using untreated and treated brick sand nanoparticles for Pb, Cd, and Cr.
Pseudo 2nd Order Reaction Kinetics: The Pb kinetics parameter for untreated and treated brick particles for removal of Pb metal is shown in and . Untreated brick particles K2 value is −84.1668, which is negative. But in treated brick particles K2 value is 0.69481055, which is positive. The value of R2 for untreated and treated brick particles is 0.99967 and 0.84244, respectively. R2 values indicate that untreated brick particles are better performed than treated brick particles.
Figure 15. Kinetic for removal of heavy metals using untreated and treated brick sand nanoparticles for Pb [(a) &; (b)], Cd [(c) &; (d)] and Cr [(e) &; (f)].
![Figure 15. Kinetic for removal of heavy metals using untreated and treated brick sand nanoparticles for Pb [(a) &; (b)], Cd [(c) &; (d)] and Cr [(e) &; (f)].](/cms/asset/abd50729-69e8-4d17-a92d-769d2bf6f235/twas_a_2307197_f0015_b.gif)
Table 4. Pseudo 2nd order reaction kinetics parameter for untreated and treated brick sand nano-particles for removal of heavy toxic metals Pb, Cd, and Cr.
The Cd metal kinetics parameter for untreated and treated brick sand particles for removal of Cd metal is shown in and . K2 value for untreated and treated brick particles is −20.6399 and −5.9204, both negative. It is indicated that both are performed well as an adsorbent. The value of R2 is 0.998 and 0.9846 for untreated and treated brick particles.
In case Cr metal, kinetics parameter for untreated and treated brick sand nanoparticles for removal of Cr metal is shown in and . Untreated brick particles and treated brick particles K2 values are −83.021 and −1495.65, which are negative. The value of R2 for untreated and treated brick particles are 0.9998 and 0.9999, respectively. R2 values indicate that untreated and treated brick particles are good as adsorbents
To get insight into the adsorption process, study the thermodynamic characteristics of the process, such as activation enthalpy ΔH0 (KJmol−1), activation entropy ΔS (Jmol−1 K−1) in the below Table.
Thus, the temperature-dependent free Gibb’s energy is
Here, T is the temperature of the process 30°C to 70° C.
Now, when we utilized different temperature ranges, we noticed that the ΔG0 values were all positive, suggesting that the adsorption reaction needed some external energy source to turn reactants into products. When the value ofΔH0 positive, it suggests that the adsorption process is endothermic, and when the values are negative, it indicates that the adsorption phenomena are exothermic. ΔH value of untreated and treated Pb is 49.012 and 2.0537, respectively, which are positive. For the assumption of thermodynamics, we decide that this reaction occurs endothermically. But for Cd, ΔH0 value is −37.032 and 34.21. Similarly, we say that untreated brick particle’s reaction is exothermic and treated brick nanoparticle’s reaction is endothermic. In Cr, ΔH0 is negative for both treated and untreated brick particles. Therefore, we say that untreated and treated Cr reaction is exothermic .
Table 5. Thermodynamics parameter for untreated and treated brick sand nano-particles (pb, Cd, and Cr) using R = 8.316 Jmol−1K−1..
Bot h the magnitude and the sign of ΔS in the adsorption response offer an indication of whether or not it is a dissociative or an associative mechanism. The negative result may suggest that the associative mechanism is involved in adsorption. During the process of adsorption, the activation of a complex between the adsorbate and the adsorbent is what eventually leads to the formation of order. A negative number indicates that the internal structures of the adsorbent undergo no significant change throughout the adsorption process. This is another consequence of the ΔS value. The positive result may indicate that the dissociative mechanism is involved in adsorption. For the assumption of thermodynamics, we say that all untreated and treated brick particles have involved a dissociative adsorption mechanism []. When temperatures are high, adsorption processes like this are not likely to be successful.
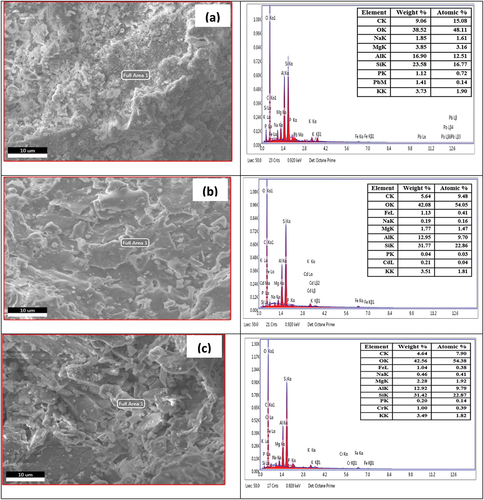
EDS results of untreated brick particle samples and untreated and treated brick particles sample are shown below in , respectively. The untreated brick sample clearly shows that there is no Pb, Cd, and Cr present and the weight% and atomic% are also zero (inset table in the Figures). To compare with the (untreated and treated brick particles for Pb), it is found that for untreated brick particles, Pb is present in the sample 1.74 its weight% and 0.17 its atomic%, and for treated brick particles Pb is present 1.41 its weight% and 0.14 atomic%. The results are indicting the adsorption of Pb metal in untreated and treated bricks sand nanoparticles surface in significant manner. To compare with untreated brick particles sample and untreated and treated brick particles with Cd sample , it is clearly shown that Cd is present in untreated brick particles sample it’s 0.63 weight% and 0.11 it’s atomic %, and for treated brick particles sample Cd is present 0.21 its weight % and 0.04 atomic %. That’s mean the Cd metal are successfully adsorbed by brick sand nanoparticles. In the , for untreated and treated brick particles adsorbent, it is clearly shown that Cr present in untreated brick particles sample is 0.94 its weight % and 0.37 atomic% and for the treated brick particles sample, the present of Cr it’s 1.00 weight % and 0.39 atomic %. The EDS results ensured the adsorption of Cr metal onto the surface of brick sand nanoparticles are quite successful. The above investigation proved that the adsorption quality of brick particle samples treated and untreated are relatively good for removal of heavy toxic metals Pb, Cd, and Cr from aqueous solution.
Figure 16. EDS spectrum of untreated brick sand nanoparticles(a), untreated brick sand nanoparticles adsorbed Pb (b), untreated brick sand nanoparticles adsorbed Cd (c), untreated brick sand nanoparticles adsorbed Cr (d).
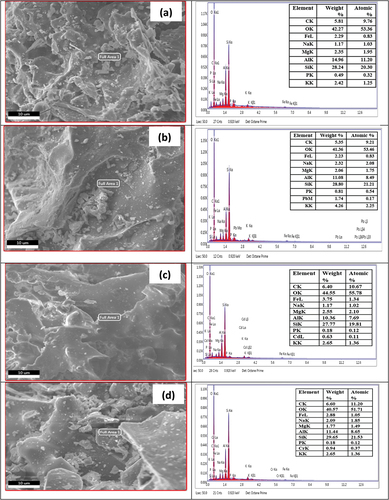
Figure 17. EDS spectrum of treated brick sand nanoparticles adsorbed Pb (a), treated brick sand nanoparticles adsorbed Cd (b), treated brick sand nanoparticles adsorbed Cr (c).
According to physical properties, the major advance of the Third-class brick is -it can absorb about 25 % moisture or water of dry weight. The major drawback of this adsorbent is a) it is very soft, and b) it is not suitable for prolong time, c) it needs to change periodically.
Conclusion
BSNP is quite cheap, easily available, and effective adsorbent. From the XRD analysis, it was shown it crystallinity and nanoparticle properties. In this experiment both untreated and treated brick sand nanoparticles were used as an adsorbent for removal of heavy toxic metals from solution and shown the most significant removal capacities for Pb (97%), Cd (99%), and Cr (99%). The Langmuir, Freundlich, Temkin, Hill De Boer, Elovich, and Redlich-Peterson Isotherm Models are also almost agreed with the adsorption properties as well as capacities of brick sand nanoparticles. Moreover, the EDS analysis was also ensured the adsorption of heavy toxic metals onto the surface of brick sand nanoparticles. The thermodynamics properties of BSNP were studied are faviourable for this adsorbent. From the above discussion, we may conclude that brick sand nanoparticles have an excellent adsorption capacity and better removal properties for removal of Pb, Cd, and Cr from aqueous solution. Finally, we may suggest that the brick sand nanoparticles can be an effective, economical, and ecologically acceptable alternative adsorbent for removal of toxic metals from wastewater.
Disclosure statement
No potential conflict of interest was reported by the author(s).
Additional information
Funding
References
- Amarasinghe, B. M. W. P. K., & Williams, R. A. (2007). Tea waste as a low-cost adsorbent for the removal of Cu and Pb from wastewater. Chemical Engineering Journal, 132(1), 299–309. doi:10.1016/j.cej.2007.01.016
- Anirudhan, T. S., & Sreekumari, S. S. (2011). Adsorptive removal of heavy metal ions from industrial effluents using activated carbon derived from waste coconut buttons. Journal of Environmental Sciences, 23(12), 1989–1998. doi:10.1016/S1001-0742(10)60515-3
- Ayawei, N., Ebelegi, A., & Wankasi, D. (2017). Modelling and interpretation of adsorption isotherms. Journal of Chemistry, 2017, 1–11. Article ID: 3039817. doi:10.1155/2017/3039817
- Aziz, H. A., Adlan, M. N., & Ariffin, K. S. (2008). Heavy metals (cd, pb, zn, ni, cu and cr (III)) removal from water in Malaysia: Post treatment by high quality limestone. Bioresource Technology, 99(6), 1578–1583. doi:10.1016/j.biortech.2007.04.007
- Badruzzman, M., Westerhoff, P., & Knappe, D. R. U. (2004). Intra particle diffusion and adsorption of arsenate onto granular ferric hydroxide (GFH). Water Research, 38(18), 4002–4012. doi:10.1016/j.watres.2004.07.007
- Barati, A., Asgari, M., Miri, T., & Eskandari, Z. (2013). Removal and recovery of copper and nickel ions from aqueous solution by poly(methacrylamide-co-acrylic acid)/montmorillonite nanocomposites. Environmental Science and Pollution Research, 20(9), 6242–6255. doi:10.1007/s11356-013-1672-3
- Ben Hamissa, A. M., Brouers, F., Ncibi, M. C., & Seffen, M. (2014). Kinetic modeling study on methylene blue sorption onto agave americana fibers: Fractal kinetics and regeneration studies. Separation Science and Technology, 48(18), 2834–2842. doi:10.1080/01496395.2013.809104
- Boyd, G. E., Schubert, J., & Adamson, A. W. (1947). The exchange adsorption of ions from aqueous solutions by organic zeolites. I. Ion-exchange equilibria 1. Journal of the American Chemical Society, 69(11), 2818–2829. doi:10.1021/ja01203a064
- Brouers, F., & Al-Musawi, T. J. (2015). On the optimal use of isotherm models for the characterization of biosorption of lead onto algae. Journal of Molecular Liquids, 212, 46–51. doi:10.1016/j.molliq.2015.08.054
- Brown, P., Jefcoat, I. A., Parrish, D., Gill, S., & Graham, E. (2000). Evaluation of the adsorptive capacity of peanut hull pellets for heavy metals in solution. Advances in Environmental Research, 4(1), 19–29. doi:10.1016/S1093-0191(00)00004-6
- Bulut, Y., & Tez, Z. (2007). Removal of heavy metals from aqueous solution by sawdust adsorption. A Scientific Journal of Environmental Sciences, 19(2), 160–166. doi:10.1016/S1001-0742(07)60026-6
- Chan, L. S., Cheung, W. H., Allen, S. J., & McKay, G. (2012). Error analysis of adsorption isotherm models for acid dyes onto bamboo derived activated carbon. Chinese Journal of Chemical Engineering, 20(3), 535–542. doi:10.1016/S1004-9541(11)60216-4
- Cheung, C. W., Porter, J. F., & McKay, G. (2000). Elovich equation and modified second order equation for sorption of cadmium ions onto bone char. Journal of Chemical Technology and Biotechnology, 75(11), 963–970. doi:10.1002/1097-4660(200011)75:11<963:AID-JCTB302>3.0.CO;2-Z
- Chuah, T. G., Jumasiah, A., Azni, I., Katayon, S., & Choong, S. Y. T. (2005). Rice husk as a potentially low-cost biosorbent for heavy metal and dye removal: An overview. Desalination, 175(3), 305–316. doi:10.1016/j.desal.2004.10.014
- De Boer, J. H. (1953). The dynamical character of adsorption. Oxford, England: Oxford University Press.
- Dotto, G. L., & Pinto, L. A. A. (2011). Adsorption of food dyes onto chitosan: Optimization process and kinetic. Carbohydrate Polymers, 84(1), 231–238. doi:10.1016/j.carbpol.2010.11.028
- Dusart, O., Bouabane, H., & Mazet, M. (1991). Adsorption sur charbon actif d’acides aminés dans l’eau: Détermination de paramètres d’équilibre par différentes équations. Journal de Chimie Physique, 88, 259–270. doi:10.1051/jcp/1991880259
- Elovich, S. Y., & Larionov, O. G. (1962). Theory of adsorption from solutions of non electrolytes on solid (I) equation adsorption from solutions and the analysis of its simplest form,(II) verification of the equation of adsorption isotherm from solutions. Izvestiya Akademi Nauk, Seriya Khimicheskaya, 2(2), 198–203. doi:10.1007/BF00908017
- Feng, N., Guo, X., Liang, S., Zhu, Y., & Liu, J. (2011). Biosorption of heavy metals from aqueous solutions by chemically modified orange peel. Journal of Hazardous Materials, 185(1), 49–54. doi:10.1016/j.jhazmat.2010.08.114
- Freundlich, H. M. F. (1906). Über die adsorption in lösungen. Zeitschrift Für Physikalische Chemie, 57(1), 385–470. doi:10.1515/zpch-1907-5723
- Gimbert, F., Morin-Crini, N., Renault, F., Badot, P.-M., & Crini, G. (2008). Adsorption isotherm models for dye removal by cationized starch-based material in a single component system: Error analysis. Journal of Hazardous Materials, 157(1), 34–46. doi:10.1016/j.jhazmat.2007.12.072
- Gray, C. W., Dunham, S. J., Dennis, P. G., Zhao, F. J., & McGrath, S. P. (2006). Field evaluation of in situ remediation of a heavy metal contaminated soil using lime and red-mud. Environmental Pollution, 142(3), 530–539. doi:10.1016/j.envpol.2005.10.017
- Gupta, V. K., Jain, C. K., Ali, I., Sharma, M., & Saini, V. K. (2003). Removal of cadmium and nickel from wastewater using bagasse fly ash—a sugar industry waste. Water Research, 37(16), 4038–4044. doi:10.1016/S0043-1354(03)00292-6
- Hamdaoui, O. (2006). Batch study of liquid-phase adsorption of methylene blue using cedar sawdust and crushed brick. Journal of Hazardous Materials, 135(1–3), 264–273. doi:10.1016/j.jhazmat.2005.11.062
- Hamdaoui, O., & Naffrechoux, E. (2007). Modeling of adsorption isotherms of phenol and chlorophenols onto granular activated carbon. part I. Two parameters models and equations allowing determination of thermodynamic parameters. Journal of Hazardous Material, 147(1–2), 381–394. doi:10.1016/j.jhazmat.2007.01.021
- Hill, T. L. (1946). Statistical mechanics of multimolecular adsorption II. Localized and mobile adsorption and absorption. The Journal of Chemical Physics, 14(7), 441–453. doi:10.1063/1.1724166
- Ho, Y. S., & Ofomaja, A. E. (2006). Kinetic studies of copper ion adsorption on palm kernel fibre. Journal of Hazardous Materials, 137(3), 1796–1802. doi:10.1016/j.jhazmat.2006.05.023
- Ihsanullah, A. A., Al-Amer, A. M., Laoui, T., Al-Marri, M. J., Nasser, M. S., Khraisheh, M., & Ali Atieh, M. (2016). Heavy metal removal from aqueous solution by advanced carbon nanotubes: Critical review of adsorption applications. Sep. Purification Technology, 157, 141–161. doi:10.1016/j.seppur.2015.11.039
- Kansara, N., Bhati, L., Narang, M., & Vaishnavi, R. (2016). Wastewater treatment by ion exchange method: A review of past and recent researches. Indian Journal of Environmental Sciences, 12(4), 143–150.
- Karim, M. A., Dipti, S. S., & Azad, M. A. K., 2021. Cost effective and efficient absorbent brick sand particles (surkhi) for removal of chromium from solution. In 2021 International Conference on Computer, Communication, Chemical, Materials and Electronic Engineering (IC4ME2), Rajshahi, Bangladesh, (pp. 1–4).
- Khan, S., Sayed, M., Sohail, M., Shah, L. A., & Raja, M. A. (2019). Chapter 6 -advanced oxidation and reduction processes. In S. Ahuja (Ed.), Advances in water purification techniques (pp. 135–164). Elsevier.
- Kiseler, A. V. C. (1958). Vapour adsorption in the formation of adsorbate mollecule complexes on the surface. Kolloid Zhur, 20, 338–348.
- Krishna, R. H., & Swamy, A. V. V. S. (2012). Investigation on the effect of particle size and adsorption kinetics for the removal of Cr (VI) from the aqueous solutions using low-cost sorbent. European Chemical Bulletin, 1(7), 258–262.
- Kumara, P. S., Ramalingamb, S., Kiruphac, S. D., Murugesanc, A., & Vidhyarevicsivanesam, S. (2010). Adsorption behaviour of nickel (II) onto cashew nut shell. Equilibrium Thermodynamics Kinetics Mechanism and Process Design Chemical Engineering Journal, 1169(1), 122–131. doi:10.1016/j.cej.2010.12.010
- Landsberg, P. T. (1955). On the logarithmic rate law in chemisorption and oxidation. Journal of Chemical Physics, 23(6), 1079–1087. doi:10.1063/1.1742193
- Langmuir, I. (1918). The adsorption of gases on plane surface of glass, mica and platinum. Journal of the American Chemical Society, 40(9), 1361–1403. doi:10.1021/ja02242a004
- Lin, K. L. (2006). Feasibility study of using brick made from municipal solid waste incinerator fly ash slag. Journal of Hazardous Materials, 137(3), 1810–1816. doi:10.1016/j.jhazmat.2006.05.027
- Majumder, A. K., Al Nayeem, A., Islam, M., Akter, M. M., & Carter, W. S. (2021). Critical review of lead pollution in Bangladesh. Journal of Health Pollution, 11(31), 210902. doi:10.5696/2156-9614-11.31.210902
- Mayakaduwa, S. S., Kumarathilaka, P., Herath, I., Ahmad, M., Al-Wabel, M., Ok, Y. S., & Abduljabbar, A. (2016). Equilibrium and kinetic mechanisms of woody biochar on aqueous glyphosate removal. Chemosphere, 144, 2516–2521. doi:10.1016/j.chemosphere.2015.07.080
- Mec¸abih, Z., Kacimi, S., & Bouchikhi, B. (2006). Adsorption des matières organiques des eaux usées urbaines sur la bentonite modifiée par Fe(III), Al(III) et Cu(II). Al(iii) Et Cu(ii) Revue Des Sciences De L’Eau, 19(1), 23–31. doi:10.7202/012261ar
- Ng, J. C. Y., Cheung, W. H., & McKay, G. (2002). Equilibrium studies of the sorption of cu (II) ions onto chitosan. Journal of Colloid and Interface Science, 255(1), 64–74. doi:10.1006/jcis.2002.8664
- Nielsen, S. S. (2010). Determination of moisture content, in food analysis laboratory manual. Boston, MA: Springer US pp. 17–27. doi:10.1007/978-1-4419-1463-7_3
- Oncel, M. S., Muhcu, A., Demirbas, E., & Kobya, M. (2013). A comparative study of chemical precipitation and electrocoagulation for treatment of coal acid drainage wastewater. Journal of Environmental Chemical Engineering, 1(4), 989–995. doi:10.1016/j.jece.2013.08.008
- Özacar, M. (2003). Equilibrium and kinetic modeling of adsorption of phosphorus on calcined alunite. Adsorption, 9(2), 125–132. doi:10.1023/A:1024289209583
- Ozaki, H., Sharma, K., & Saktaywin, W. (2002). Performance of an ultra-low-pressure reverse osmosis membrane (ULPROM) for separating heavy metal: Effects of interference parameters. Desalination, 144(1), 287–294. doi:10.1016/S0011-9164(02)00329-6
- Ragadhita, R., & Nandiyanto, A. B. D. (2021). How to calculate adsorption isotherms of particles using two-parameter monolayer adsorption models and equations. Indonesian Journal of Science & Technology, 6(1), 205–234. doi:10.17509/ijost.v6i1.32354
- Roginsky, S. Z., & Zeldovich, Y. B. (1934). The catalytic oxidation of carbon monoxide on manganese dioxide. Acta Physical Chemistry USSR, 1, 554–594.
- Sanad, S. A., Moniem, S. M. A., Abdel-Latif, M. L., Hossein, H. A., & El-Mahllawy, M. S. (2021). Sustainable management of basalt in clay brick industry after its application in heavy metals removal. The Journal of Materials Research and Technology, 10, 1493–1502. doi:10.1016/j.jmrt.2020.12.070
- Shahbeig, H., Bagheri, N., Ghorbanian, S. A., Hallajisani, A., & Poorkarimi, S. (2013). A new adsorption isotherm model of aqueous solutions on granular activated carbon. World Journal of Modelling and Simulation, 9(4), 243–254.
- Sips, R. (1948). On the structure of a catalyst surface. The Journal of Chemical Physics, 16(5), 490–495. doi:10.1063/1.1746922
- Temkin, M. J., & Pyzhev, V. (1940). Recent modifications to Langmuir Isotherms. Acta Physical Chemistry, 12, 217–225.
- Vadivelan, V., & Vasanth, K. K. (2005). Equilibrium, Kinetics, mechanism, and process design for the sorption of methylene blue onto rice husk. Journal of Colloid and Interface Science, 286(1), 90–100. doi:10.1016/j.jcis.2005.01.007
- Wu, F.-C., Liu, B.-L., Wu, K.-T., & Tseng, R.-L. (2010). A new linear form analysis of Redlich- Peterson isotherm equation for the adsorptions of dyes. Chemical Engineering Journal, 162(1), 21–27. doi:10.1016/j.cej.2010.03.006
- Wu, F.-C., Tseng, R.-L., & Juang, R.-S. (2009). Characteristics of Elovich equation used for the analysis of adsorption kinetics in dye-chitosan systems. Chemical Engineering Journal, 150(2–3), 366–373. doi:10.1016/j.cej.2009.01.014
- Yang, L., Wang, L., Cui, C., Long, H., Huang, X. … Yan, D. (2022). Heavy metal and metalloid emissions during co-processing of waste in a sintering kiln: Migration characteristics in the kiln and long-term leaching from bricks. Journal of Environmental Management, 322, 116145. doi:10.1016/j.jenvman.2022.116145