
 ?Mathematical formulae have been encoded as MathML and are displayed in this HTML version using MathJax in order to improve their display. Uncheck the box to turn MathJax off. This feature requires Javascript. Click on a formula to zoom.
ABSTRACT
Weirs play an important role in controlling and managing water in irrigation canal networks through several functions, such as discharge measurements, water distribution, and lowering the water level. Weirs also play a crucial role in protecting canals from flooding, which might cause the earthen banks to collapse, by eliminating surplus water at the ends of the canals. Over the previous decades, the flow over the traditional sharp-crested weirs was extensively investigated by many researchers; however, the well-escape weirs have not received sufficient attention. These types of weirs were mostly constructed in the form of vertical wells that may be circular or rectangular in shape, and water may flow through the entire perimeter of the weir or part of the perimeter. In the present research, the effect of the well-escape-weir shape on the characteristics of flow over the weir was studied. A set of models were constructed in different shapes, circular and square, and the entire perimeter of the weir or part of the perimeter is working as the weir crest length. The discharge passing over the unit length of the weir crest (q) is investigated and compared for the circular and square weirs of various crest lengths and positions. The results indicated that the discharge capacity of the circular weirs increases by a rate ranging between 7.5% and 15% more than that of the square weirs at the same head. Also, results indicated that the discharge coefficient of the circular weirs increases by a rate ranging between 9.3% and 10.3% more than that of the square weirs. This behavior can be attributed to the interference between the orthogonal water nappes at the corners of the square models. In addition, the flow direction has little effect on the discharge coefficient at small discharges, and this effect becomes more obvious at higher discharges. Additionally, the well-escape weirs of the upstream crest have a slightly higher discharge capacity than those of the downstream crest due to the effect of the approach velocity, which increases the water entrance velocity at the upstream crest. The results of flow patterns around the weir showed that the locations of maximum flow velocities (u, v, w) are mostly near the weir crest and depend entirely on the crest length and position.
Introduction
A weir is one of the most important hydraulic structures which used for flow control and measurements in open channels. There are many shapes of weirs such as rectangular, triangular, trapezoidal, circular, etc. Based on the alignment of the weir crest, weirs can be classified as a traditional weir in which the weir axis is perpendicular to the canal axis, a side weir in which weir axis parallel to channel axis. Meanwhile, the curved weir is in the form of a circular arch embedded between channel walls to provide more crest length for the passage of flow, and the skew weir in which the weir axis is inclined to the channel axis. In the last case, the length of the weir crest increased within the limited channel width so, more discharge could be passed over such a weir compared to a sharp-crested weir. EquationEquation 1(1)
(1) is a mathematical correlation is used to describe the flow over a sharp-crested weir in a canal under free flow conditions.
Where Q = discharge, Cd = coefficient of discharge, L = crest length, h = water head over the weir crest and g = acceleration due to gravity.
Rehbock (Citation1929) investigated the primary influences on the discharge characteristics of sharp-crested weirs and proposed EquationEquation 2(2)
(2) for computing the discharge coefficient of the sharp crested-weir as function of h/p ratio, ignoring viscous and capillary effects. (Kandaswamy & Rose, Citation1957)
Where p = weir height measured from the canal bed.
A tail escape weir is constructed at the end of channels to drain the excess water. Reyad, Elkholy, and El-Fitiany (Citation2017) investigated the effect of different canal parameters (weir height, canal length, slope, and off-take abstraction time) on the amount of water lost. They developed an unsteady flow model (“IRCS”) based on the Preissmann scheme. The results showed that raising the weir height and abstraction time reduced water losses considerably. Furthermore, the data revealed that longer and milder canals provide greater storage, lowering water losses. Fahmy (Citation2017) conducted tests on circular weir models, which have three different heights and diameters, to study the influence of weir height and diameter on the efficiency of the tail escape. The results indicated that the discharge coefficient of the circular weir increases by increasing the weir height and decreasing the weir diameter.
As previously stated, various researchers thoroughly analyzed the flow over traditional weirs. Swamee, Pathak, and Ghodsian (Citation2001) investigated at the influence of viscosity and surface tension on the discharge coefficient of a rectangular weir. Kumar, Ahmed, Mansour, and Himanshu (Citation2012) used six models of curved weirs with varied vertex angles to examine sharp-crested curved plan-form weirs under free-flow condition. Results indicated that the efficiency of the curved weir is high for high vertex angles and decreases with an increase in h/p ratio due to interference of the jets downstream. Gupta, Kumar, and Ahmad (Citation2015) studied experimentally the effect of weir height on the flow performance of sharp-crested rectangular-Planform weir under free flow conditions. The results showed that, for the same value of h, discharge increases as weir height decreases due to fewer energy losses during streamline approach up to the weir crest. Kumar, Ahmada, and Mansoor (Citation2011) investigated the free flow discharge capacity of a sharp-crested triangular plan form weir. The results showed that triangle plan type weirs are more efficient than conventional weirs. Bagheri and Heidarpour (Citation2010) proposed equations for the flow nappe profiles and the discharge coefficient of rectangular sharp-crested weirs. Afzalimehr and Bagheri (Citation2009) improved an equation for the discharge coefficient of the sharp-crested rectangular weir using potential flow theory. Arvanaghi and Oskuei (Citation2013) investigated the effect of dimensionless parameters such as weir height, Reynolds number, and Froude number on the discharge coefficient of the sharp-crested weir and found that the discharge coefficient has a constant value of 0.7 when the following conditions are met: h/p = 0.6, Fr = 0.2, Re = 2000.
Ionescu, Nistoran, Opriş, and Simionescu (Citation2019) Ionescu, Nistoran, Opriş, and Simionescu (Citation2019) investigated four sharp-crested weir shapes: rectangular, V-notch, trapezoidal, and proportional-Sutro. According to the results, the proportional weir has the highest sensitivity. Tekade and Vasudeo (Citation2016) evaluated the influence of the sharp-crested rectangular weir (SCW) material type, height, and width on the head discharge relationship. The results demonstrated that the crest height p has no effect on the discharge characteristics and that the head–discharge relationship for SCW is an exponential series.
The shaft spillway is one of the most important hydraulic structures constructed in front of dams in order to control the water level and removes the excess water from the dam reservoir. The excess water can produce a rise in the water pressure acting on the dam, which can lead to dam failure; therefore, the shaft spillway protects the dam by draining surplus water. It should be noted that the shaft spillway is significantly similar to well escape weirs but the last one is constructed at the end of canals to transport the excess water to the drains.
Several researchers have investigated experimentally and numerically the flow characteristics at shaft spillways. Bagheri, Bajestan, and Jahromi (Citation2010) investigated the effect of polyhedral spillway crests on the discharge intensity of the flow passing through the spillways and on the discharge coefficient of morning glory spillways. Their results proved that the greatest discharge coefficient was obtained when trihedral spillway crests were used. Jalil, Hussein, and Sarhan (Citation2020) conducted an experimental and numerical study on the elbow flow as a shaft spillway. The results showed that there are two phases of flow, namely free flow and orifice flow, which occur when the water head increases up to a critical value that depends on the elbow diameter. Kashkaki, Banejad, Heydari, and Olyaie (Citation2019) carried out experimental tests on a haft spillway with a piano-key inlet and proved that this type of inlet increases overflow discharge capacity by about 15.16% compared to a normal shaft spillway. Sukerta et al. (Citation2022) made a comparison of the lateral spillway and morning glory spillway performance in flood control. Christodoulou, Mavrommatis, and Papathanassiadis (Citation2010) studied the effect of piers and boundary proximity on the discharge capacity of the Morning Glory spillway and proved that piers have a slightly negative effect for small water and a positive effect for large head. Asadsangabi, Talebbeydokhti, and Rahnavard (Citation2014) conducted a numerical study on three types of morning glory spillway inlets (circular, Wagner, and Greager). They concluded that the circular model has a lower discharge coefficient than the other two models, and the discharge coefficient in the Wagner model is higher than the discharge coefficient in the Greager model.
Vortex flow is recognized as a significant issue for hydraulic engineers in spillway design because it diminishes the efficiency of the shaft spillway and limits discharge capacity. Several researchers conducted studies on vortex breakers as an instrument used to weaken the vortex formation. Researchers such as (Kabiri-Samani & Borghei, Citation2013; Nohani, Citation2014), and (Sayadzadeh, Musavi-Jahromi, Sedghi, & Khosrojerdi, Citation2020) investigated the effect of vortex breakers on the efficiency of the shaft spillway and concluded that the use of vortex breakers causes a significant increase in the discharge capacity of the shaft spillway.
Review of researches on weirs shows that less attention has been paid to studying well-type weirs, especially weir shapes and flow direction. The current study aims to study the effect of well weir shape and flow direction on flow characteristics over the weir.
Dimensional analysis
In order to find the factors affecting flow over well-escape weirs, dimensional analysis is performed to simplify and define the problem. Referring to , a functional relationship linking the main variables of flow over the escape-weir can be expressed as,
Figure 1. Definition sketch for experimental model.
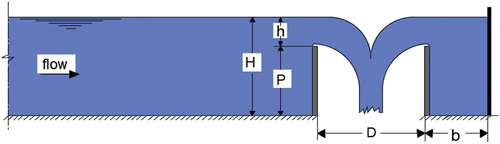
In which is a functional symbol, p is the weir height, h is the water head over the weir, L is the crest length, B is the channel width, b is the clearance between the well weir wall and the wall of the channel, g is the acceleration of the gravity,
is the water viscosity,
is the water surface tension,
is the water density, S.F is the shape factor, F.D is a factor depending on the flow direction.
EquationEquation (3)(3)
(3) represents a typical phenomenon based on the Buckingham
theorem, this equation can be expressed in a dimensionless form,
In which are dimensionless groups and
is functional symbol. Considering
as a dimensional independent variable, the dimensionless groups were obtained as,
Taking into account that some groups should be combined to deduce the dimensionless variables commonly used in hydraulics, EquationEquation 18(18)
(18) is expressed in the following form.
Replacing from EquationEquation 18
(18)
(18) into EquationEquation 18
(18)
(18) leads,
The left-hand side of EquationEquation 18(18)
(18) shows the weir discharge coefficient. The fifth and sixth terms on the right hand represent the Reynolds number Re and the Weber number We. The effects of the Reynolds number and Weber number can be negligible except for small values of the measured head over the weir. If the effects of the Reynolds and Weber numbers can be considered negligible, the discharge equation of flow over the escape weir is,
Experimental set-up
To perform the tests, a smooth rectangular horizontal flume at the Irrigation and Hydraulic Laboratory of Assiut University was implemented. The flume was 3 m long, 0.6 m wide, and 0.45 m deep. The walls of the flume were fabricated from painted steel, and the bed was made from wood painted with water-proofing material. shows the schematic view of the experimental setup.
Figure 2. Layout of the experimental set up.
Water is circulated by a centrifugal pump with a total discharge of 150 L/s. The flume was supplied by water through a delivery pipe from an elevated tank, which has escape valves to maintain a constant head. A calibrated orifice meter fitted to the delivery pipe was used to measure the discharge passing through the flume. A valve was fitted on the delivery pipe to control the discharge. A point gauge with an accuracy of ±0.1 mm was used to measure the water levels. A current meter with a propeller of 5 mm diameter is used for measuring the velocity of flow at different depths and locations around the crest of the well weir. In order to investigate the flow patterns around the tested well-escape weirs, the velocities in three dimensions (u, v, and w) were measured at the points shown in by employing a 16 Mhz ADV (Acoustic Doppler Velocimeter) built by Sontek. The ADV has the following parameters: a sampling rate equal to 50 Hz, a 5 cm distance to the sample, a sampling volume (cc) of 0.09, a resolution of 0.01 cm/s, and an accuracy of 1% of the measured velocity. The time taken to measure velocity by the ADV at each point was 30 min. The velocities obtained from the ADV device were post-processed by MATLAB version 9.12 and entered into the Teckplot 2021 R2 program to draw the velocity vectors and streamlines.
Figure 3. Locations at which the velocity in three dimensions was measured by the ADV.
In order to investigate the effect of well weir shape and flow direction on the flow characteristics, nine circular well weir models were made from PVC pipes with three different diameters (0.15 m, 0.187 m, and 0.265 m) and with different flow directions as follows: water flows over the entire crest perimeter, and water flows over two-thirds of the crest perimeter from the front and behind. Twelve square well weir models were made from Perspex with three different side lengths of 0.12 m, 0.17 m, and 0.21 m and with different water directions as follows: water flows over the entire crest perimeter; water flows over three sides of the crest from the front and behind; water flows over the left and right sides of the crest; and water flows over the front and behind sides of the crest, as shown in and . All the tested models have a constant crest height of 0.17 m above the channel bed. Each model was located at the end of the flume so that the clearance between the model edge and the flume wall was equal in all directions and tested under different discharges. For each run, the head over the crest of the weir was measured by the point gauge. The ranges of the parameters in the present study are given in .
Figure 4. A sketch of well weir models used in the present study: a) circular well weir models, b) square well weir models.
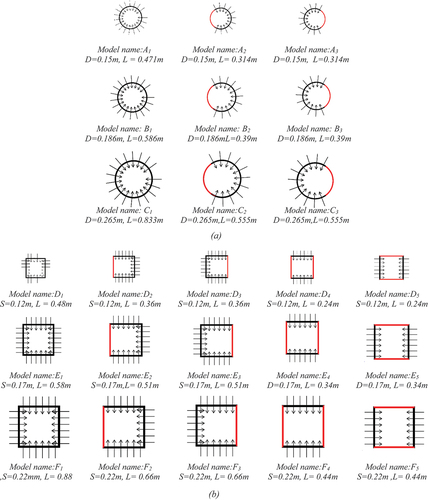
Photo 1. samples of used models.
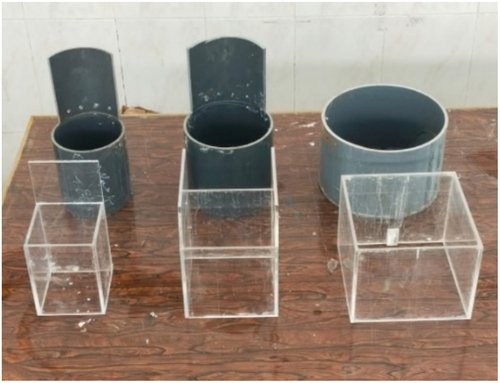
Table 1. Ranges of variables in the present study.
Results and analysis
Flow patterns
To study the effect of weir shape and flow direction on flow patterns around the well escape weirs, The velocities in three dimensions (u, v, and w) were measured around the models by using the ADV device. The average of velocity readings was calculated by Excel software and exported to the Techplot program to plot the velocity vectors as shown in . These figures represent the velocity vectors around some of the tested models in different shapes and flow directions. All the velocity readings were taken on different vertical and horizontal planes.
Figure 5. Velocity vectors around circular weir with full-length crest.
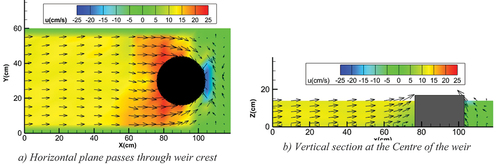
Figure 6. Velocity vectors around circular weir of two-thirds crest at downstream.
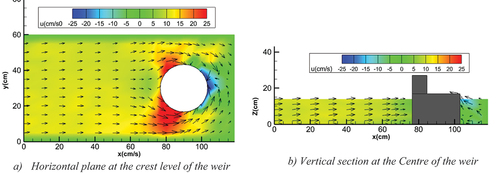
Figure 7. Velocity vectors around circular weir of two-thirds crest at upstream.
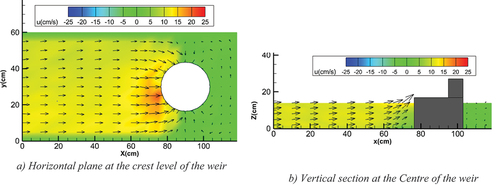
Figure 8. Velocity vectors around a square weir of full-length crest for Q = 15.48 L/s.
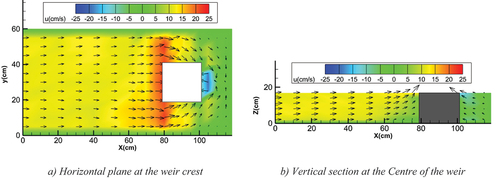
Figure 9. Velocity vectors around a square weir with three-sides crest at downstream for Q = 15.48 L/s.
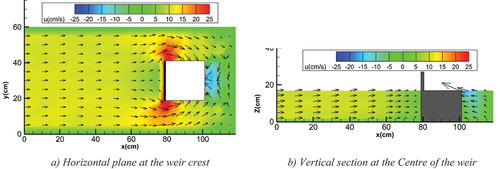
Figure 10. Velocity vectors around a square weir with three-sides crest at upstream for Q = 15.48 L/s.
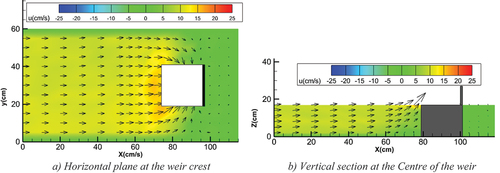
Figure 11. Velocity vectors around a square weir with two sides-crest (right and left) for Q = 15.48 L/s.
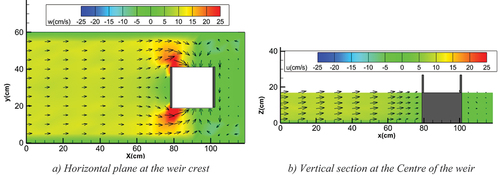
Figure 12. Velocity vectors around a square weir with two-sides crest (upstream and downstream) for Q = 15.48 L/s.
Flow patterns around circular weirs
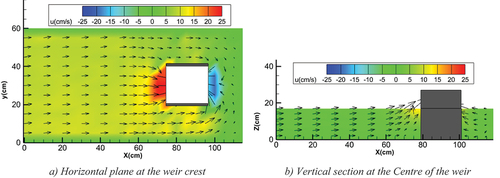
show the flow patterns around circular weir models of constant diameter (D = 27.5 cm) and different flow directions under constant discharge (Q = 15.48 l/s). indicates the flow patterns around a circular weir with a full-length crest. It is shown from this Figure that the maximum flow velocities occur above the weir crest and range between 74 cm/s at the weir crest and 20 cm/s near the water surface. In addition, the velocity decreases gradually away from it until it reaches a nearly constant value. The dead zone, which has very small velocities, is small and located downstream of the weir. The vertical component of flow velocity (w) has nearly the same value around the weir (see ).
visualizes the water velocity vectors for a circular weir that has a 27.5 cm diameter with a two-thirds crest downstream. It is noticed from this figure that the maximum velocities occur at two-thirds of the crest perimeter downstream and range between 90 cm/s at the weir crest and 30 cm/s at the near water surface. In addition, the downstream dead zone significantly decreases compared to weirs with full crest length. The vertical component of flow velocity (w) at upstream has greater values than those at downstream (see ).
shows the flow patterns around a circular weir of 27.5 cm diameter and a two-thirds crest upstream. It was noticed that the maximum values of velocities occur around the front part of the weir crest and range between 92 cm/s at the weir crest and 20 cm/s near the water surface. In addition, the downstream dead zone became larger than the other weir shapes. In general, the value of maximum flow velocity increases by decreasing the weir crest length, where it increased by 23% when the crest length was reduced by 33.33%. This behavior may be attributed to the fact that, for the same discharge, the water head over the crest increases by decreasing the crest length, which causes an increase in flow velocity over the crest.
Flow patterns around square weirs
visualize the velocity vectors around square well-escape weirs of constant side length (S = 22 cm), different flow directions, and discharge (Q = 15.48 L/s). shows the velocity vectors around a square weir with a full-length crest. It can be shown from this figure that the maximum velocities around square weirs with full-length crests occur on the entire crest perimeter. In addition, the flow velocity above the weir crest ranges between 0.73 m/s above the crest and 0.25 m/s near the water surface. The downstream velocities are more noticeable due to water being allowed to enter from behind, which reduces the downstream dead zone.
visualizes the water velocity vectors around a square weir with a three-side crest downstream. It is noticed that maximum flow velocities occur at the weir crest position where water was allowed to flow. indicates the water velocity vectors around a square weir with a three-side crest upstream. From this figure, we can notice that at this type of weir, the maximum values of flow velocities are found in front of the weir where water was allowed to enter and range between 0.82 m/s at the weir crest and 0.34 m/s near the water surface. In addition, the downstream dead zone is more noticeable than those behind other weirs.
depicts the velocity vectors surrounding a square weir with two crests (right and left). The flow velocities on the right and left sides have the highest values, ranging between 0.99 m/s at the weir crest and 0.4 m/s near the water surface. Furthermore, the area of the dead zone behind this weir was the highest compared to other weirs because the flow was blocked downstream. shows the water velocity vectors around a square weir with two sides crest (upstream and downstream). At this type of weir, the maximum flow velocities occur around the upstream and downstream sides. Additionally, the downstream dead zone takes up little space. One resemblance conclusion given by the figures from 8 to 11 is that the maximum flow velocity occurs directly above the weir crest and increases by decreasing the crest length, where it decreased by 12.33% and 35.62% when the crest length was reduced by 25% and 50%, respectively.
In general, by investigating the flow patterns around different weirs, we can notice that the locations of maximum flow velocities (u, v, and w) are mostly near the weir crest and depend entirely on the crest length and position. The values of these velocities also depend on the discharge value and the water head over the crest, where it increases by decreasing the crest length at the same discharge, so the weirs of partially crest length have greater flow velocities than those of full crest length. The region of the dead zone, which has very low velocities, depends on the crest position. This region significantly increases when the flow is not allowed to enter from behind. The vertical component of flow velocity (w) is also dependent on the position of the water entrance, so it has obvious values near the crest position.
Effect of Weir shape and crest position on discharge
To investigate the influence of the flow direction and crest length on the capacity of the well-escape weirs, the variation of discharge (Q) with water head-to-weir height ratio (h/p) is studied for all tested weirs, as shown in . shows the variation of Q with h/p for circular weirs of 15 cm diameter and different crest lengths and flow directions (full-length crest, two-thirds of the perimeter is crest downstream, and two-thirds of the perimeter is crest upstream). Similar sets of curves are plotted for variations of Q with h/p ratio for circular weirs of different diameters (D = 18.7 cm and 26.5 cm) in , respectively. From these figures, it can be noticed that the weirs of full-length crest pass higher discharge than those of partially crest length at the same ratio of h/p. In addition, the discharge capacity of the weir with a two-thirds crest upstream is slightly higher than that of the two-thirds crest downstream.
Figure 13. Variation of Q with h/p for a circular well-escape weirs with a constant diameter (D = 15 cm) and various flow directions.
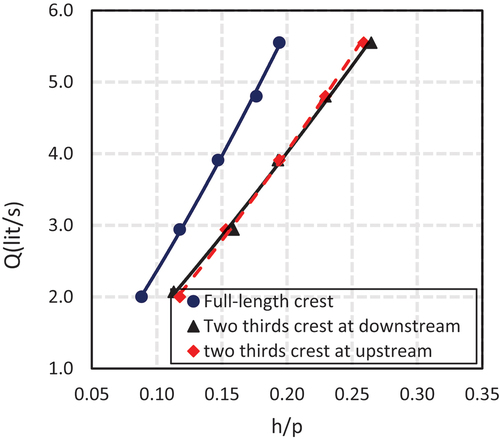
Figure 14. Variation of Q with h/p for a circular well-escape weirs with a constant diameter (D = 18.7 cm) and various flow directions.
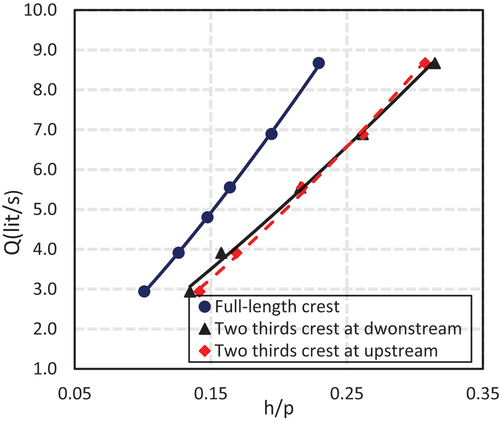
Figure 15. Variation of Q with h/p for a circular well-escape weirs with a constant diameter (D = 26.5 cm) and various flow directions.
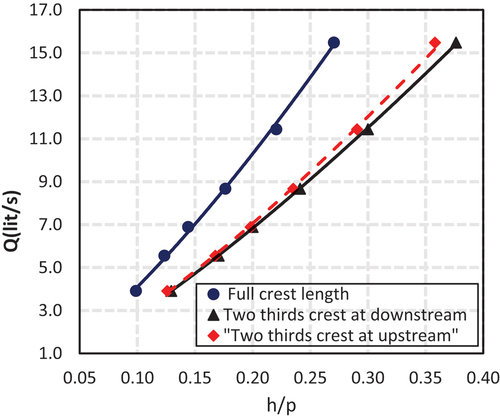
Figure 16. Variation of Q with h/p for a square well-escape weirs with a constant side length (S = 12 cm) and various flow directions.
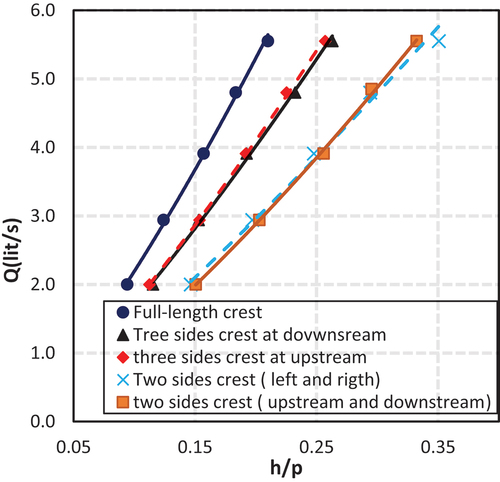
Figure 17. Variation of Q with h/p for a square well-escape weirs with a constant side length (S = 17 cm) and various flow directions.
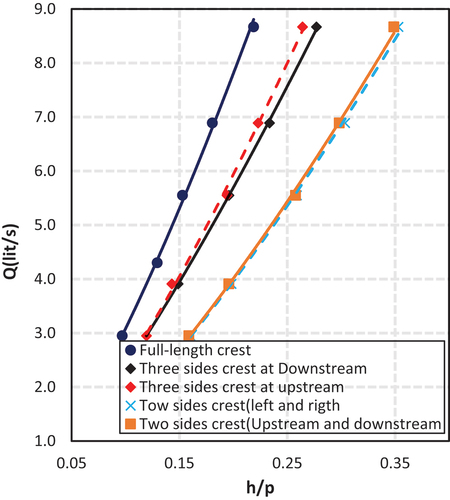
Figure 18. Variation of Q with h/p for a square well-escape weirs with a constant side length (S = 26.5 cm) and various flow directions.
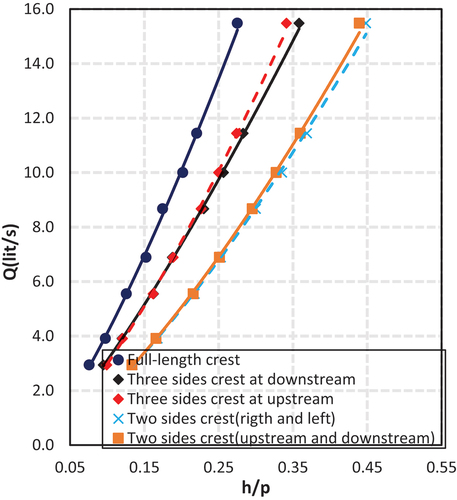
indicates the variation of Q with h/p for square weirs of 12 cm side length, 17 cm weir height, and various crest lengths and flow directions (full-length crest, three-side crest at downstream, three-side crest at upstream, two-side crest (upstream and downstream), and two-side crest (right and left)). Similar sets of curves are plotted for variation of Q with h/p for different side lengths (S = 17 cm and 22 cm) in , respectively. It can be noticed that the full-length crest passes the highest discharge, and the upstream crest gives slightly higher discharge than the downstream crest.
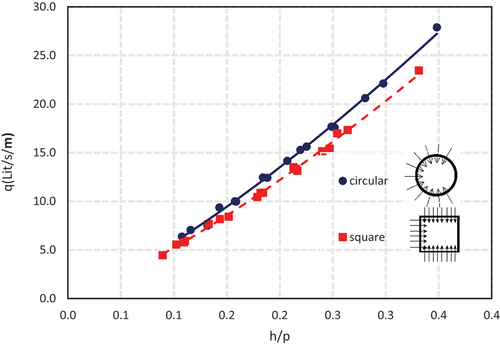
It’s important to investigate the impact of the well-escape-weir shape on the discharge capacity. For this purpose, the variations of discharge per unit length of weir crest (q) with h/p ratio for circular and square well-escape weirs of different dimensions are plotted in . shows the variation of q with h/p ratio for circular weirs of different diameters (D = 15 cm, 18.7 cm, and 26.5 cm) and square weirs of different side lengths (S = 12 cm, 17 cm, and 22 cm), 17 cm weir height, and full-length crest. It was noticed that, at the same value of h/p, the circular well-escape weirs pass higher discharges per unit length of crest than those of square shape. This behavior may be attributed to the interference between the two orthogonal water nappes at the corner of the square weirs, which decreases the effective crest length and then the discharge capacity. Similar sets of curves are plotted for variations of q with h for different flow directions in , showing similar trends of curves and similar conclusions as mentioned above. In addition, the difference in the discharge capacity between the circular and square well-escape-weirs increases by increasing the water head over the crest. This may be attributed to the fact that the interference between the two orthogonal water nappes becomes more effective, which significantly decreases the effective crest length and then the discharge capacity for the square weirs.
Figure 19. Variation of q with h/p for circular and square well-escape weirs of constant weir height and flow along the total length of crest perimeter.
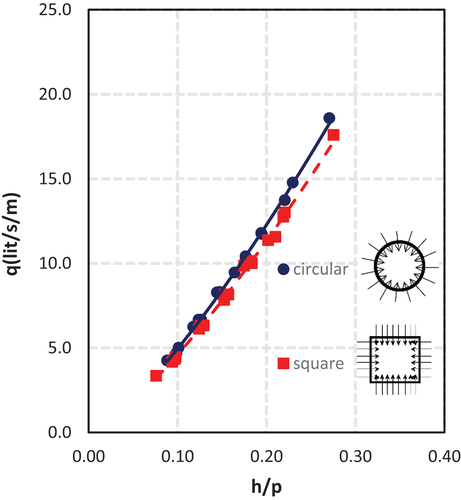
Figure 20. Variation of q with h/p for circular and square well-escape weirs of constant weir height and flow from downstream.
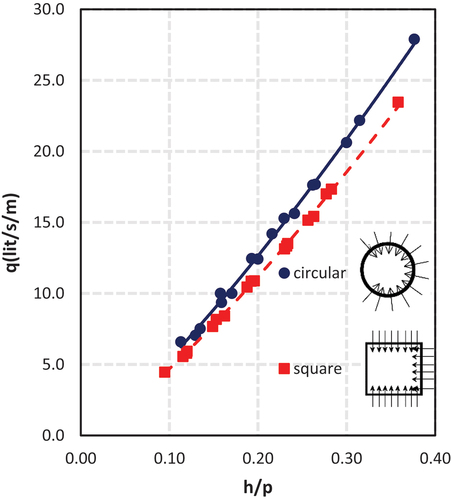
Figure 21. Variation of q with h/p for circular and square well-escape weirs of a constant weir height and flow from upstream.
For further clarification of the effect of the weir shape on the discharge capacity, the percentage increase of the circular weir discharge capacity per meter length of the weir crest compared to the square weir is calculated using EquationEquation 18(18)
(18) and plotted against h/p ratio in . From this figure, it can be noticed that circular weirs offer higher values of discharge capacity than square weirs. In addition, the percentage increase in the circular weir’s discharge capacity over the square weir depends significantly on the position and length of the crest, as follows: the percentage increase for the weirs of full-length crest ranges between 7.5% and 8.5%, for the weirs of partial-length crest at downstream ranges between 12% and 15%, and for the weirs of partial-length crest at upstream is almost 10.5%. In addition, the difference in discharge capacity between circular and square weirs slightly increases by increasing the ratio of h/p for weirs of partial-length crests downstream and vice versa for those of partial-crest lengths upstream.
Figure 22. The variation of the relative increase in circular weir’s discharge capacity over that of square weir with h/p.
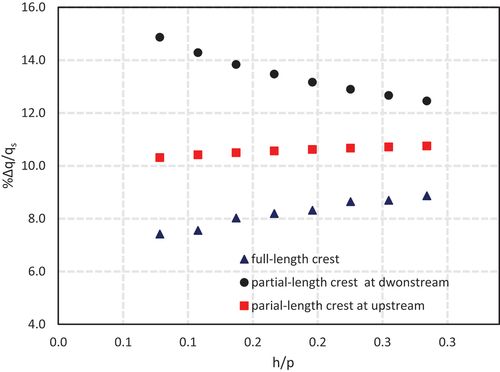
Where,
qc and qs are the discharges passing over the unit length of the crest of the circular and square weirs at the same head, respectively.
To demonstrate the effect of crest position on the discharge capacity of the well-escape weirs, the relative difference in discharge capacity per unit crest length was calculated using Eq. (10) and plotted against the h/p ratio in . The discharge capacity per unit crest length of a weir with two sides crest (upstream and downstream), a weir with two sides crest (right and left), and a weir with three sides crest at upstream increases by 2–8%, 4%, and 2%, respectively, more than weirs with full-length crest. Furthermore, the discharge capacity of the three-side crest weirs downstream reduces by 1–6%.
Figure 23. The variation of relative difference in the discharge capacity between the weirs of full-length crest and partial-length crest.
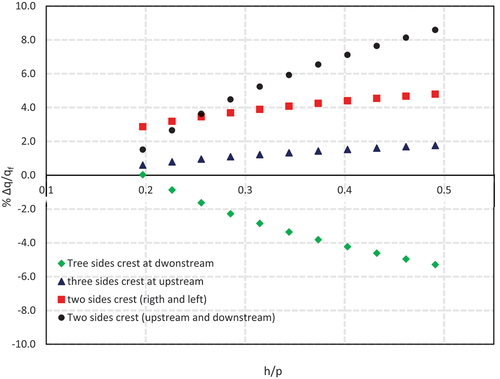
Where;
are the discharges passing over a unit length of crest of weir with partial-crest length and full-length crest, respectively.
Relative value of discharge of partial crest length to full crest length (Qp/Qf)
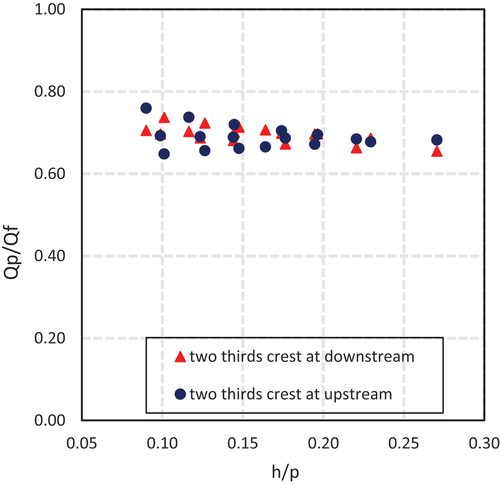
The variation of Qp/Qf with h/p ratio is drawn for the tested weir models to indicate the influence of crest length (L) on the discharge capacity of the well-escape weirs, where Qp and Qf are the discharge flowing over a weir with partial crest length and full-length crest, respectively. depicts the variability of Qp/Qf with h/p for a two-thirds perimeter crest weir upstream and downstream. It is clear that the upstream crest has a larger discharge percentage than the downstream crest. The partial crest discharge to full crest discharge ratio is between 0.6 and 0.8.
Figure 24. Variation of Qp/Qf with h/p for circular weirs of various crest position.
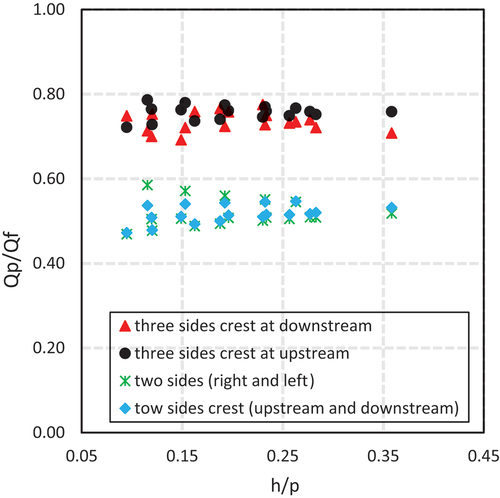
depicts the relationship between Qp/Qf and h/p ratio for square weirs with different crest lengths and locations (three sides crest upstream and downstream, two sides crest (right and left), and two sides crest (upstream and downstream). It can be seen that the upstream crest has a larger discharge percentage than the downstream crest. The ratio of partial crest discharge to complete crest discharge for two-side and three-side crest weirs is 0.5 to 0.6 and 0.7 to 0.8, respectively.
Figure 25. Variation of Qp/Qf with h/p for square weirs of various crest length and position.
Discharge coefficient Estimation
Effect of the weir shape on the discharge coefficient of the well-escape weirs
The variations of Cd with h/p for circular and square weirs with various flow directions are studied to investigate the influence of weir shape and flow direction on the discharge coefficient of the well escape weirs, as shown in .
Figure 26. Variation of Cd with h/p for circular and square weirs with full-length crest.
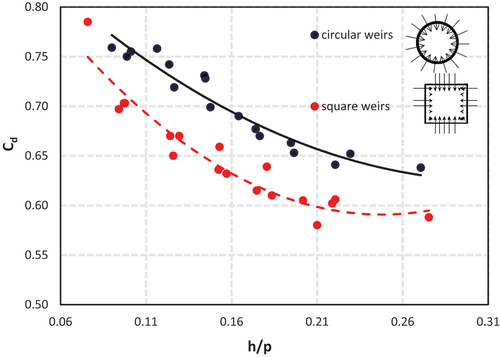
Figure 27. Variation of Cd with h/p for circular and square weirs with partial crest length from downstream.
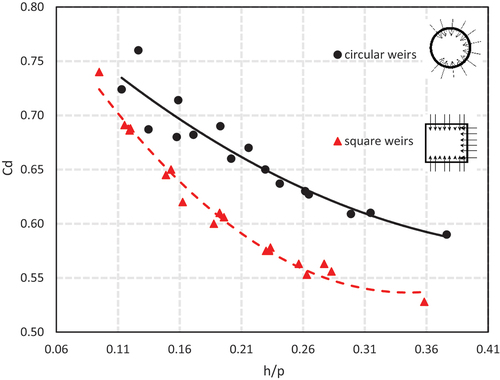
Figure 28. Variation of Cd with h/p for circular and square weirs with partial crest length from upstream.
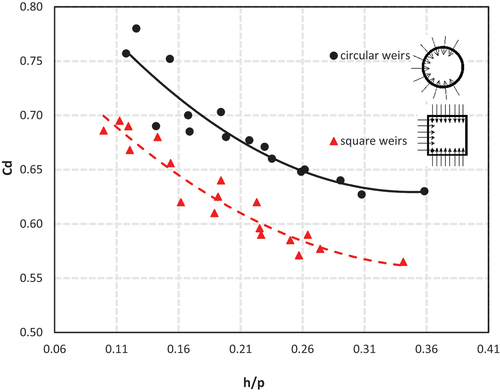
visualizes the variation of Cd with h/p ratio for circular and square weirs with full-length crests. As shown in this figure, the discharge coefficient significantly decreases as the value of h/p increases. In their research on sharp-crested curved plan-form weirs and sharp-crested triangular plan-form weirs under free flow conditions (Kumar, Ahmada, & Mansoor, Citation2011), and (Kumar, Ahmed, Mansour, & Himanshu, Citation2012) came to a similar conclusion. Furthermore, the discharge coefficient of circular well-escape weirs is larger than that of square well-escape weirs due to interference between two orthogonal nappes at the corners of the square models. Regression analysis is to deduce EquationEquation 18(18)
(18) and EquationEquation 18
(18)
(18) to predict the value of Cd for circular and square well-escape weirs of full-length crest, respectively, for h/p in the range of 0.08 to 0.28.
Where;
Cd is the discharge coefficient;
h is the water head over the weir crest, and
p is the weir height above the canal height.
shows the variation of Cd with h/p ratio for circular and square well-escape weirs of different dimensions, with two-thirds of the perimeter being crest at downstream for circular weirs and three sides being crest at downstream for square weirs. This figure shows similar trends of curves and a similar conclusion as mentioned above. In addition, Cd decreases by increasing the value of h/p. Regression analysis is used to deduce EquationEquation 18(18)
(18) andEquationEquation 18
(18)
(18) to predict the values of Cd for circular weirs of two-thirds crest at downstream and square weirs of three sides crest at downstream, respectively, for h/p in the range of 0.11 to 0.36.
shows the variation of Cd with h/p ratio for circular and square well-escape weirs of different dimensions, with two-thirds of the perimeter being crest at downstream for circular weirs and a three-side crest at downstream for square weirs. This figure shows similar trends in curves and a similar conclusion as mentioned above. In addition, Cd decreases by increasing the value of h/p. Regression analysis is used to deduce EquationEquation 18(18)
(18) andEquationEquation 18
(18)
(18) to predict the values of Cd for circular weirs of two-thirds of the parameter being crest at downstream and square weirs of three-side crest at downstream, respectively, for h/p in the range of 0.11 to 0.36.
visualizes the variation of Cd with h/p ratio for circular and square well-escape weirs of different dimensions, with two-thirds of the perimeter being crest at upstream for circular weirs and a three-side crest at upstream for square weirs. This figure illustrates similar trends in curves and similar conclusions as mentioned above. Regression analysis is used to deduce EquationEquation 18(18)
(18) and EquationEquation 18
(18)
(18) to predict the values of Cd for circular weirs of two-thirds of the perimeter being crest at upstream and square weirs of a three-side crest at upstream, respectively, for h/p in the range of 0.11 to 0.36.
shows the percentage increase in the circular weir’s average discharge coefficient for different crest lengths and positions compared to that of the square weirs. It is noticed that the average discharge coefficient of the circular weir increases by 9.3–10.3% more than that of the square weir.
Table 2. Comparison of the average discharge coefficient of circular and square weirs with different flow directions.
Effect of the flow direction on the discharge coefficient of the well-escape weirs
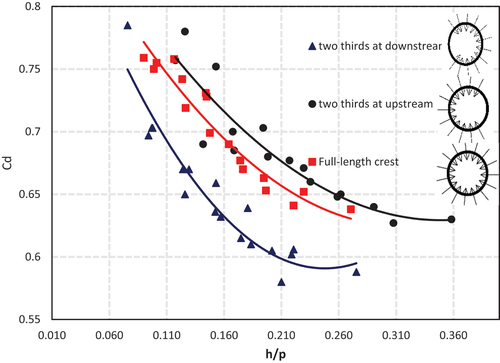
In the current section, the effect of the weir crest position on the discharge coefficient (Cd) is studied. For this purpose, the variations of Cd with h/p ratio for circular well-escape weirs with three different flow directions (Full-length crest, two-third crest at downstream, and two-third crest at upstream) are plotted in . As shown in this figure, the well escape weirs of a two-third crest at upstream offer higher values of Cd than those of full-crest and two-thirds crest at downstream. This behavior can be attributed to the effect of the approach velocity (u) which increases the water entry velocity to the well-escape weirs. Also, this Figure shows that the discharge coefficient of the weirs of two-thirds crest at downstream is small compared to the other weirs.
Figure 29. Variation of Cd with h/p for the circular well-escape weirs for different flow directions.
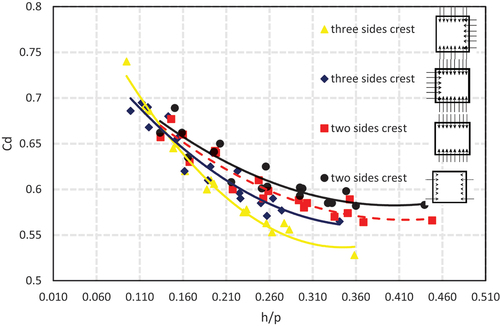
indicates the variation of Cd with h/p ratio for square well-escape weirs with different flow directions (full-length crest, three-side crest at downstream, three-side crest at upstream, two-side crest (right and left), and two-side crest (upstream and downstream)). As shown in this figure, the flow direction has a slight effect on Cd at small h/p ratios, and this effect increases by increasing the ratio of h/p. Also, this figure shows that the well-escape weirs of a two-side crest (upstream and downstream) offer the highest values of Cd, unlike the weirs of a three-side crest downstream, which have the lowest values of Cd compared to other weirs. This behavior can be attributed to the fact that the water entry velocity at the upstream crest is higher compared to the downstream and right crests due to the effect of approach velocity (u), so weirs at the upstream crest offer higher values of Cd. In addition, the weirs of only two opposite sides crest have higher values of Cd than those of full-length crest and three sides crest due to the interference between the orthogonal water nappes at corners, which decreases the discharge coefficient. Regression analysis is used to deduce EquationEquation 18(18)
(18) and EquationEquation 18
(18)
(18) to predict the value of Cd for square weirs of the right and left sides crest and upstream and downstream sides crest, respectively, for h/p in the range of 0.15 to 0.45.
Figure 30. Variation of Cd with h/p for the square well-escape weirs for different flow directions.
Where;
Cd is the discharge coefficient,
h is the water head over the weir crest, and
p is the weir height above the canal bed.
Conclusion
In the present study, the effect of weir shape and flow direction on the flow patterns and discharge coefficient of well-escape weirs have been evaluated experimentally by building physical models with circular and square crest shapes. According to findings, the maximum velocities (u, v, w) occur near the weir crest and depend on the water head over the crest, where it increases by decreasing the crest length at the same discharge, so the weirs of partially crest length have greater flow velocities than those of full crest length. In addition, the dead region, which has very small velocities, is mostly located behind the weir model and increases significantly behind the well escape weirs of the crest upstream. The results showed that at the same value of h, the weirs of full-length crest pass higher discharge than those of partially crest length, and the discharge coefficient decreases by increasing the value of h/p. Also, the results showed that the discharge capacity (q) of the circular weirs increased by 7.5%–15% more than that of the square weir at the same head. The comparison between the circular and square well escape weirs proved that the discharge coefficient of the circular weirs increased by 9.3 ─10.3% more than that of the square weirs. This behavior may be attributed to the fact that the interference between the orthogonal water nappes at the corners of the square models increases the water head above the weir crest. Also, results indicated that at low discharges, the flow direction has a small effect on the discharge coefficient of the well-escape weirs, and this effect increases gradually by increasing the discharge. In addition, the results proved that the square well-escape weirs of the two sides of the crest (upstream and downstream) have the best discharge coefficient compared to other tested square weirs. Empirical equations were deduced for computing the discharge coefficient for various weir shapes and crest positions as a function of the water head over the weir height ratio (h/p).
Notations
| B | = | channel width (m) |
| Cd | = | discharge coefficient |
| D | = | weir diameter (m) |
| Fr | = | Froude number |
| g | = | acceleration of gravity (m/s2) |
| h | = | water head over the weir (m) |
| H | = | water depth (m) |
| L | = | crest length (m) |
| p | = | weir height (m) |
| Q | = | discharge (m3/s) |
| Re | = | Reynolds number |
| S | = | side length (m) |
| u | = | water velocity in X-Direction (m/s) |
| U | = | approach velocity (m/s) |
| v | = | velocity of flow in Y-Direction (m/s) |
| w | = | velocity of flow in Z-Direction (m/s) |
| We | = | Weber number |
| = | water density (kg/m3) | |
| = | viscosity of water (N.s/m2) | |
| = | surface tension (N/m) |
Disclosure statement
No potential conflict of interest was reported by the author(s).
References
- Afzalimehr, H., & Bagheri, S. (2009). Discharge coefficient of sharp-crested weirs using potential flow. Journal of Hydraulic Research, 47(6), 820–823. doi:10.3826/jhr.2009.369
- Arvanaghi, H., & Oskuei, N. N. (2013). Sharp-crested weir discharge coefficient. Journal of Civil Engineering and Urbanism, 3(3), 87–91.
- Asadsangabi, F., Talebbeydokhti, N., & Rahnavard, M. (2014). Two phase flow modeling in shaft-spillways using volume of fluid (vof) method. The Iranian Journal of Science and Technology Civil Engineering, 38(C1), 99–109.
- Bagheri, A., Bajestan, M. S., & Jahromi, H. M. (2010). Hydraulic evaluation of the flow over polyhedral morning glory spillways. World Applied Sciences Journal, 9(7), 712–717. doi:10.1007/s00271-009-0172-1
- Bagheri, S., & Heidarpour, M. (2010). Flow over rectangular sharp-crested weirs. Irrigation Science, 28(2), 179–179. doi:10.1007/s00271-009-0172-1
- Christodoulou, G., Mavrommatis, A., & Papathanassiadis, T.(2010). Experimental study on the effect of piers and boundary proximity on the discharge capacity of a morning glory spillway. International 1st IAHR European Congress, Scotland, Edinburgh, 1–6.
- Fahmy, M. R. (2017). Effect of circular weir heights and diameters on the discharge coefficient and efficiency of tail escape structure. Al Azhar University Civil Engineering Research Magazine (CERM), 39(4), 334–345.
- Gupta, K., Kumar, S., & Ahmad, Z. (2015). Effect of weir height on flow performance of Sharp Crested Rectangular-Planform weir. World Applied Sciences Journal, 33(1), 168–175.
- Ionescu, C. S., Nistoran, D. E., Opriş, I., & Simionescu, Ș.-M. (2019). Sensitivity analysis of Sharp-Crested Weirs as a function of shape opening, for small discharges. HIDRAULICA, 2, 43–51.
- Jalil, S. A., Hussein, B. S., & Sarhan, S. A. (2020). Visualization of elbow flow performance as shaft spillway. Ain Shams Engineering Journal, 11(4), 865–873. doi:10.1016/j.asej.2020.03.017
- Kabiri-Samani, A. R., & Borghei, S. M. (2013). Effects of anti-vortex plates on air entrainment by free vortex. Sharif University of Technology, 20(2), 251–258.
- Kandaswamy, K. P., & Rose, H. (1957). Characteristics of flow over terminal weirs and Sills. Journal of the Hydraulics Division, 83(4), 1345–1. doi:10.1061/jyceaj.0000101
- Kashkaki, Z., Banejad, H., Heydari, M., & Olyaie, E. (2019). Experimental study of hydraulic flow of circular piano-key inlet in shaft spillways. Journal of Rehabilitation in Civil Engineering, 7(3), 96–102.
- Kumar, S., Ahmada, Z., & Mansoor, T. (2011). A new approach to improve the discharging capacity of sharp-crested triangular plan form weirs. Flow Measurement and Instrumentation, 22(3), 175–180. doi:10.1016/j.flowmeasinst.2011.01.006
- Kumar, S., Ahmed, Z., Mansour, T., & Himanshu, S. K. (2012). Discharge characteristics of Sharp Crested Weir of curved plan-form. Research Journal of Engineering Sciences Introduction, 1(4), 16–20.
- Nohani, E. (2014). An experimental study on the effect of vortex breakers on discharge coefficient for the shaft spillways with sharp edge and wide edge. Journal of Civil Engineering and Urbanism, 4(5), 546–549.
- Rehbock, T. (1929). Discussion of Precise Measurements. Trans. of ASCE ,93,1143-1162.
- Reyad, M., Elkholy, M., & El-Fitiany, F. (2017). Utilization of tail-escape weir for water conservation in distributary canals. Alexandria Engineering Journal, 57(3), 1811–1820. doi:10.1016/j.aej.2017.06.018
- Sayadzadeh, F., Musavi-Jahromi, S. H., Sedghi, H., & Khosrojerdi, A. (2020). Pyramidal vortex breakers influences on the flow discharge of morning glory spillway. Ain Shams Engineering Journal, 11(2), 455–463. doi:10.1016/j.asej.2019.08.013
- Sukerta, Chen, T. C., Mardizal, J., Salih, M. S., Zulkarnain, S. M. … Aravindhan, D. A. (2022). Comparison of lateral spillway and morning glory spillway performance in flood control. Journal of Water and Land Development, 53, 187–191. doi:10.24425/jwld.2022.140796
- Swamee, P. K., Pathak, S. K., & Ghodsian, M. (2001). Viscosity and surface tension effects on rectangular weirs. ISH Journal of Hydraulic Engineering, 7(2), 45–50. doi:10.1080/09715010.2001.10514697
- Tekade, S. A., & Vasudeo, A. D. (2016). Head discharge relationship of thin plated rectangular lab fabricated sharp crested weirs. Journal of Applied Fluid Mechanics, 9(3), 1231–1235. doi:10.18869/acadpub.jafm.68.228.23128