
 ?Mathematical formulae have been encoded as MathML and are displayed in this HTML version using MathJax in order to improve their display. Uncheck the box to turn MathJax off. This feature requires Javascript. Click on a formula to zoom.
ABSTRACT
Madhabdi municipality of the Narsingdi district of Bangladesh, the “Manchester of the East,” is famous for its cloth market and fabric dyeing industries. The untreated effluent discharge has been mixed with the water and soil, degrading the environmental standards of this area for years. Installing an effluent treatment plant (ETP) in all textile industries in Bangladesh is mandatory. This study evaluates the soil condition, surface water quality, and heavy metal contamination in cultivated vegetables after the compulsory installation of ETP. Soil and water samples from eight locations and cultivated vegetable samples from three locations are collected and analyzed for this study. The pH, EC (electric conductivity), TDS (total dissolved solids), DO (dissolved oxygen), and heavy metal concentrations are observed. The water quality index, contamination index, metal evaluation index, pollution load index, and metal pollution index are calculated from the collected samples. The study found that the physico-chemical properties of water pH (9.19), EC (2232.38 µScm-1), and DO (0.79 mgL-1) violate the national standards. The mean TDS is below the maximum permissible level. The heavy metal concentrations of Cr and Pb in water are 1.03 and 0.13 mgL-1, crossing the permissible limit, respectively, but Mn, having 0.89 mgL-1, is within the limit. The water quality is unsuitable for domestic and agricultural use, contamination is “medium,” and metal evaluation is “medium.” The soil is alkaline, having a pH of 8.58. The soil’s Cr, Pb and Mn concentrations are 68.21 µgg-1, 52.73 µgg-1and 805.16 µgg-1, respectively. The soil contamination level is low to moderate. Cultivated leafy vegetables have a concentration of Cr, Pb and Mn; 2.61 µgg-1, 0.30 µgg-1and 288.67 µgg-1, respectively, where Cr has crossed, Pb is within, and Mn is lower than the permissible limit. Produced vegetables have high (12.10–33.09) MPI (metal pollution index) and are at a high-risk level for consumption as food.
Introduction
Bangladesh earns over 80% of its foreign currency from the export of textile-based industries (Raian et al., Citation2022). Moreover, millions of employments are generated by this textile industry, where most workers are female (Matsuura & Teng, Citation2020). The textile industry consumes enormous amounts of energy, water and other resources and is responsible for severe environmental pollution (Cai & Choi, Citation2020). It is one of Bangladesh’s top sources of industrial pollution, accounting for 45% of all industrial employment (Iqbal, Mahmud, & Quader, Citation2014). Textile-dyeing industries are among the top consumers and polluters of fresh water (Chakraborty & Ahmad, Citation2022; Uddin, Citation2021). As per industry estimates, the dyeing and finishing of one ton of textile may require up to 300 tons of water (Kar, Keane, & Greer, Citation2012). Textile-dyeing industries are chemical-intensive industries. These chemicals are enzymes, detergents, dyes, acids, alkalis and salts, oil, grease, heavy metals, and other toxic substances (Hossain, Sarker, & Khan, Citation2018; Roy et al., Citation2010).
As a result textile dyeing industries are categorized as red industries according to the Bangladesh environment conservation act 1995 and the environment conservation rules 1997 (Kamal, Ahmed, Hassan, Uddin, & Hossain, Citation2016). The use of effluent treatment plants is mandatory for these industries. In Bangladesh, most industries are not equipped with proper treatment facilities; for this reason, they dump untreated effluents into nearby surface water bodies (Hoque & Clarke, Citation2013). There are small textile factories in residential neighborhoods; in most cases, they do not have ETP. These small factories dump a significant volume of contaminated discharge into surface waterbodies (Tania, Bhuiyan, & Ferdous, Citation2022). There are many factories which have low maintenance of ETP or have not set up ETP because of high price and tax issues or turn the ETP off after a specific time for high running cost, high maintenance cost and low probability of being caught for fine (Haque, Citation2017; Sakamoto, Ahmed, Begum, & Huq, Citation2019). The leading causes of not having ETPs and turning those off include unavailability of funds and technical expertise of industries, lack of workforce and continuous monitoring of the Department of Environment according to Khan, Ahmed, Evans, and Chadwick (Citation2009). As a result, untreated or poorly treated disposals are directly discharged into the environment. The dye used in textiles also has an undesirable aesthetic impact on the water. It impedes sunlight through the water and harms aquatic ecosystems (Karim, Das, & Lee, Citation2006). Environmental degradation and contamination of soil, air, surface water and groundwater are caused by solid and liquid waste from the textile-dyeing industry (Hasan, Mow, Alam, Hasan, & Mamtaz, Citation2018). Metal pollution from textile dyeing can eliminate sensitive native species or reduce abundance (Kibria, Hossain, Mallick, Lau, & Wu, Citation2016). High volumes of textile wastewater may cause alteration of physicochemical and biological properties of the aquatic environment and could be harmful to livestock, wildlife, fish, biodiversity, groundwater, and public health (Hossain et al., Citation2011; Hossain, Sarker, & Khan, Citation2018; Islam, Mahmud, Faruk, & Billah, Citation2011; Mamun et al., Citation2022; Rahman, Rahman, & Nasirujjaman, Citation2017). Untreated wastewater can also cause waterborne diseases (Hasan, Shahriar, & Jim, Citation2019; Sultana, Ali, Uddin, & Haque, Citation2013; Sultana, Islam, Saha, & Al-Mansur, Citation2009). The rivers (the Buriganga, the Turag, the Shitalakshya and the Karnaphuli) in the major cities of Bangladesh are highly polluted with heavy metals and other hazardous chemicals; water colored in pitch black and stingy in ordure, one of the top polluters of these rivers are from the textile sectors (Hossain & Hossain, Citation2020; Islam et al., Citation2015; Ranjan, Citation2020).
Water pollution due to the textile industry was studied by Ahmed, Matsumoto, and Kurosawa (Citation2018); Ahsan et al. (Citation2019); Nahar, Chowdhury, Chowdhury, Rahman, and Mohiuddin (Citation2018); Sultana, Islam, Saha, and Al-Mansur (Citation2009); Sultana, Ali, Uddin, and Haque (Citation2013). Heavy metal contamination in soil has been studied by Ahmed, Matsumoto, and Kurosawa (Citation2018); Ahmed, Matsumoto, Ozaki, Thinh, and Kurosawa (Citation2019); Kashem and Singh (Citation1999); Shammi, Salam, and Khan (Citation2021); Tusher, Piash, Latif, Kabir, and Rana (Citation2017); Zakir, Sumi, Sharmin, Mohiuddin, and Kaysar (Citation2015). Research on heavy metal contamination in vegetables and other food items due to industrial pollution is done by Alam et al. (Citation2023); Jolly et al. (Citation2023); Islam et al. (Citation2018) Laboni et al. (Citation2023); Parvin, Sultana, and Zahid (Citation2014); Proshad, Kormoker, Islam, and Chandra (Citation2020); Sultana et al. (Citation2017); Sultana, Tanvir, Hussain, Chamon, and Mondol (Citation2022).
Ahmed, Matsumoto, and Kurosawa (Citation2018) study on heavy metal concentration in irrigation water, soil, and vegetables in multi-industrial (textile, dye, ago-chemical, ceramic) area (Gazipur district) concluded that contaminated soil and irrigation water might be responsible for the high heavy metal concentration in root vegetables (As, Cr and Pb concentration exceed the permissible limits). Ahsan et al. (Citation2019) study found that textile-dyeing effluent in Narayanganj has a high concentration of heavy metals and high EC, pH, and TDS. Sultana, Islam, Saha, and Al-Mansur (Citation2009) studied both textile dyeing effluent and adjacent surface water in the Narayanganj area and found that the surface water is polluted in terms of physicochemical parameters (high pH, EC, TDS, and low DO) and anionic pollutants. Zakir, Sumi, Sharmin, Mohiuddin, and Kaysar (Citation2015) studied pollution of agricultural soil in the mixed industrial zone of Gazipur and found that soil is polluted with high concentrations of heavy metals (Pb, Cd, Zn, Cu and Cr) and 9 out of 23 sites shows progressive deterioration based on pollution load index (PLI). However, Zakir, Sumi, Sharmin, Mohiuddin, and Kaysar (Citation2015) identified Pb, Cd, and Zn as the main pollutants of that area as the concentration was several times greater than the Cu and Cr concentration. Tusher, Piash, Latif, Kabir, and Rana (Citation2017) study identified Cu, Pb, and Cr as the dominant heavy metal-pollutant of soil adjacent to dyeing, textile, and glass industries in Tangail district. Shammi, Salam, and Khan (Citation2021) studied in the sub-urban, mixed industrial area of Dhamrai, near Dhaka, conclude the moderate level of soil pollution according to PLI and excessive level of Cr and high concentration of other heavy metals (Cu, Ni, Co, Zn, Pb and Cd) in soil. Sultana et al. (Citation2017) studied heavy metal concentration in fruits and vegetables grown with polluted irrigation water from the river in Gazipur and concluded that the area is unsuitable for the cultivation of leafy and root vegetables due to high concentration of heavy metals (Pb, As, Mn, and Fe). Sultana, Tanvir, Hussain, Chamon, and Mondol (Citation2022) study found higher heavy metal concentrations in leafy vegetables than root vegetables by collecting samples from the largest vegetable market, Kawran Bazar of Dhaka. High contamination of heavy metals in crops and vegetables has also been reported by the study of Jolly et al. (Citation2023); Alam et al. (Citation2023); Parvin, Sultana, and Zahid (Citation2014); Proshad, Kormoker, Islam, and Chandra (Citation2020); Sultana et al. (Citation2017). Laboni et al. (Citation2023) study of heavy metal concentration in vegetables using AAS in the Narsingdi district found high concentration of heavy in cultivated vegetables. Nahar, Chowdhury, Chowdhury, Rahman, and Mohiuddin (Citation2018) analyzed effluent samples and bio absorption of heavy metal by the agricultural byproducts (eggshell, lemon peel, sawdust, and rice husk) in the Madhabdi area of Narsingdi. The high concentrations of (Fe, Cr, Cu, Mn, and Pb) and high pH, TDS, and EC value in effluent was reported by the study of Nahar, Chowdhury, Chowdhury, Rahman, and Mohiuddin (Citation2018). Moreover, Nahar, Chowdhury, Chowdhury, Rahman, and Mohiuddin (Citation2018) also suggested that if the present conditions continue, the area will be unsuitable for living within 10–15 years and recommended the use of agricultural byproducts (eggshell, lemon peel, sawdust, rice husk) as agents of bio absorption of heavy metal. From the above literature review, the number of studies regarding water and soil pollution and contamination of heavy metals in food products by textile industries seems insufficient compared to the extent and impact of the pollution. Moreover, many previous studies only examined the physicochemical parameters of effluents. Holistically, textile pollution of soil, water, and heavy metal concentration in food products is yet to be addressed.
For this reason, we have selected a textile-dyeing industry hub in Bangladesh (Madhabdi of Narsingdi upazila) for our research. Our study objectives are to assess physicochemical properties and heavy metal contamination of surface water adjacent to textile-dyeing industries, assess physicochemical properties and heavy metal contamination in soil, and assess heavy metal contamination in vegetables grown adjected to the textile-dyeing industries.
Study area
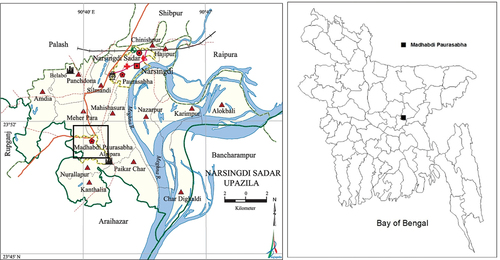
This study aims to assess the environmental impact of textile dyeing industries by determining some physico-chemical parameters of soil, water and pollution levels caused by heavy metals released with effluents in surface water, soil, and vegetables in Madhabdi municipality, Narsingdi district of Bangladesh. Madhabdi is renowned for textile weaving, dyeing industries, and clothes markets (). Around 3000–4500 automatic and handloom weaving and manufacturing mills are in Madhabdi (Nahar, Chowdhury, Chowdhury, Rahman, & Mohiuddin, Citation2018). These industries generate a considerable volume of waste daily. Untreated or poorly treated effluent is directly discharged into the lands, canals, rivers, and other water bodies. It transfers to agricultural land as well.
Figure 1. Location of the study area (Banglapedia, Citation2021).
Data analysis
Station site and sampling
The samples were collected in February 2020 (). To obtain more accurate data on the concentration of heavy metals, the samples were taken in February during the winter (dry season) (Rajeshkumar et al., Citation2018). Metals initially enter the ecosystem through surface soil, where they tend to accumulate over time. These contaminants often contaminate the soil’s top 0–40 cm (Abechi, Okunola, Zubairu, Usman, & Apene, Citation2010; Krishna & Govil, Citation2007). According to Acharya (Citation2018), from the fertility perspective, the topsoil plow layer is within 0-15 cm. Thus, considering both facts, we took soil samples from 0 to 15 cm depth. Water samples were collected from surface water bodies adjacent to the discharge location of dyeing industries. Leafy vegetables were selected as vegetable samples since they show a higher concentration of heavy metals than root vegetables (Nassar, Nasr, El-Sayed, & Kobisi, Citation2018). The sampling points were selected randomly based on large textile dyeing industries that had installed ETPs and discharged effluent waterbodies near agricultural land. Soil and water samples were collected from eight locations (stations), and vegetable samples were collected from three locations. The sample vegetables were Pumpkin leaves (Cucurbita pepo), Bottle gourd leaves (Lagenaria siceraria) and Bathua leaves (Chenopodium album). Hand gloves were worn during sample collection to avoid contamination. The soil was dug with a stainless spade, and samples of (0.5–1) kg were carried in polythene zipper bags to keep them airtight during transportation (Acharya, Citation2018). Moreover, eight water samples were collected in 5-liter airtight plastic bottles.
Table 1. Location and description of collected samples from the Madhabdi municipality, Narsingdi, Bangladesh.
Physico-chemical analysis
Fifty ml of water samples were taken for immediate pH, EC (electrical conductivity), TDS (total dissolved solids) and DO (dissolved oxygen) tests. Ten grams of soil samples were kept separate for pH and EC tests. For the pH test, 10 g soil and 25 ml distilled water were taken into separate beakers for separate stations. The soil-to-distilled water ratio was 1: 2.5. For the EC test, 25 ml of distilled water was added to each beaker. Here, the soil : distilled water ratio was 1: 5.
Sample preparation and digestion
Soil
Ten grams of soil samples were taken for physicochemical analysis. Nitric acid digestion was followed for heavy metal concentration analysis (Hseu, Citation2004). For heavy metal analysis, the remaining samples were air-dried for four days and oven-dried at 65°C for 48 hours. One gram of dry soil sample from each station was taken into separate beakers, and 10 ml of concentrated HNO₃ was added. The samples were kept at normal room temperature for a day. Then, the sample was heated for 45 minutes on a hot plate at 90°C. The temperature then increased to 150°C. The samples were boiled for three hours until a clear solution was received. Digestion continued until the volume was reduced to 5 ml. Then, the samples were kept at room temperature for cooling. The solutions were filtered with Whatman No. 42 filter paper. Later, the solutions were diluted to 50 ml by adding di-ionized water and preserved at room temperature for heavy metal analysis.
Water
The water sample preparation and digestion were done following Sagagi, Bello, and Danyaya (Citation2022). Fifty ml of water samples were taken for physicochemical analysis, and 250 ml were filtered using Whatman No. 42 filter paper for digestion for heavy metal analysis. Each sample was filtered at least five times, and 50 ml was digested using 10 ml of concentrated HNO₃. The samples were heated for 45 minutes on a hot plate at 90°C. Then the temperature was increased to 150°C. The samples were boiled for four hours until the volume was reduced to less than 45 ml. The samples were kept at room temperature for cooling. After cooling, the samples were filtered with Whatman No. 42 filter paper, diluted to 50 ml using di-ionized water and preserved at room temperature for further heavy metal analysis.
Vegetables
Following Gebeyehu, Bayissa, and Bhatnagar (Citation2020), the vegetable samples were prepared and digested. For two days, the samples were stored at room temperature. The samples’ stems and leaves were cut down and air-dried for eight days. They were then oven-dried for 48 hours at 60 ° C. Powder was made by crushing the dried sample. Then, 10 ml of concentrated HNO₃ was added to 0.5 g of each sample in separate beakers. The crushed samples were heated at 90°C on a hot plate for 45 minutes. The temperature was raised to 150°C later. The samples were boiled for five hours to obtain a clear solution and digested until the volume was decreased to around 5 ml. Finally, the samples were stored at room temperature for heavy metal analysis after being filtered using Whatman No. 42 filter paper and diluted to 50 ml with di-ionized water.
Heavy metal concentration analysis
Heavy metal concentrations (Cr, Pb and Mn) in soil, water and vegetable samples were assessed in this study. We used an atomic absorption spectrometer (AAS) for heavy metal concentration analysis. It is the most available and cost-effective technique in Bangladesh, which detects sensitive trace elements accurately and quickly.
Indices for surface water
Water quality index (WQI)
Water quality can be evaluated by the WQI method in a single value. The composite influence of different quality parameters on the overall quality of water is reflected by the value. The WQI is calculated by using a weighted arithmetic water quality index. It was originally proposed by Horton (Citation1965) and developed by Brown, McClelland, Deininger, and O’Connor (Citation1972).
The equation for calculating weighted arithmetic water quality index (WQI):
Where, n= number of variables or parameters,
= Unit weight of nth water quality parameter,
= Quality rating of nth water quality parameter
The equation for calculating unit weight (wn):
Where, = Constant of proportionality and
it is calculated by using the expression is given in equation,
The equation for calculating quality rating (qn):
Where, All the ideal values are taken as zero except for,
pH = 7.5 and DO = 6.25 mg L−1
Contamination index (cd)
The contamination index shows the relative contamination of different heavy metals separately. It also manifests the sum of generated components as a representative (Backman, Bodiš, Lahermo, Rapant, & Tarvainen, Citation1998). The contamination index is calculated using the following equation:
Where, = contamination factor for the component,
= analytical value for the component
= upper permissible concentration of the component
Heavy metal evaluation index (HEI)
The heavy metal evaluation index estimates the overall water quality, particularly focusing on heavy metals in the samples (Edet & Offiong, Citation2002).
It is calculated using the following equation:
Where, = the monitored value of the parameter
= the maximum admissible concentration of the parameter
Indices for soil
3.4.2.1 Degree of Contamination (Cd)
It is calculated as per surface water.
Pollution load index (PLI)
The pollution load index is calculated using the contamination factor for each sample. The sum of the contamination factor value refers to the pollution load index of the stations.
It is developed by Tomlinson, Wilson, Harris, and Jeffrey (Citation1980) and the equation is:
Where, = contamination factor for the component
Index for vegetables
Metal pollution index: MPI
As humans and animals directly consume vegetables, it is necessary to know their overall heavy metal concentration. This index will be calculated using the geometrical mean of concentrations of all the metals in the leaves and stems of vegetables (Usero, Citation1997):
Where,
concentration of metal in the station.
Results
Field observation
We found that all dyeing industries at the survey sites had an effluent treatment plant (ETP) during the fieldwork. However, some factories did not operate it regularly. As a result, the polluted water from factory effluent is directly discharged into the surface water channel. This effluent discharge was dark-colored and emitted a foul odor.
Water sample assessment results
Physico-chemical properties and heavy metal assessment
The recorded values of physico-chemical parameters and analyzed results of heavy metal concentration of water near the effluent discharge points of the study area are presented in . The pH values of the water range varying from 7.72–11.43. The average pH value of the stations is 9.19. The highest and lowest pH values are 7.72 and 11.43 in station_7 and station_1, respectively.
Table 2. Test results for water samples.
The average EC value of the stations in the study area is 2232.38 µScm-1. The acceptable limit of EC in Bangladesh is 1200 µScm-1 as per the national standards for industrial wastewater proposed through DoE (Citation1997). However, the average EC value of the stations in this study is 2232.38 µS cm-1, which is higher than the acceptable value. The highest is 4280 µS cm-1 in station_6. Individually, all stations’ TDS values are below the permissible limit of 2100 mgL-1, except for station_6, which is 2420 mgL-1. The average TDS value is 1294.88 mgL-1, below the standard’s permissible limit (). At station_4 and station_7, the assessed value is the lowest (881 mgL-1). The dissolved oxygen range in the study is 0.5–1.3 mgL-1, much lower than the standard set for industrial units through DoE (Citation1997). The standard value ranges between 4.5 and 8 mgL-1, which ensures a healthy living environment for life forms. In the study area, DO was less than the standard range at all the stations (). The average DO is 0.79 mgL-1, much lower than the standard range. Heavy metals (Cr, Mn and Pb) concentration in water is assessed, and the results are annotated in . In the study area, the average Cr and Pb concentrations in water exceeded the national permissible limit (0.50 mgL-1 and 0.10 mgL-1 for Cr and Pb, respectively). The concentration of Mn in water is within the permissible limit (5.00 mgL-1) ().
Indices for surface water
The water quality index (WQI), contamination index (CI), and heavy metal evaluation index (HEI) of the water samples were calculated using the parameters evaluated in and presented in . The overall results of WQI showed that the quality of all the stations’ surface water has deteriorated. The water quality of station_1 and station_3 is labeled “poor quality”. Moreover, water quality has been found unsuitable for intended purposes (domestic usage) in the rest of the six stations. According to the contamination index, the samples of station_1, station_3, and station_6 are low-contaminated, and station_7 is “highly contaminated”. Most samples were “medium contaminated”, which is alarming. The heavy metal evaluation index (HEI) of the samples from station_1, station_3, and station_7 showed results similar to the contamination index. However, as per HEI calculation, most of the station’s water samples are medium-contaminated.
Table 3. Indices for water samples.
Soil sample assessment results
Physico-chemical properties and heavy metal assessment
Soil parameters pH, EC and heavy metals concentration (Cr, Pb and Mn) were assessed in this study (). The pH of the soil ranged between 7.77–9.03, and the average pH was 8.58, which indicates that the soil is alkaline. The highest and lowest pH were found at station_1 (pH-9.03) and station_7 (pH-7.77), respectively. The electric conductivity ranged from 379–1444 µScm-1. The average electric conductivity is 862.25 µScm-1. Chromium concentration ranged between 36.40–157.70 µgg-1. The average value was 68.21 µgg-1, which did not exceed the maximum limit (100 µgg-1). However, station_8 crossed the limit. Lead and manganese concentrations ranged between 31.06–78.94 µgg-1 and 543.41–1743.76 µgg-1, respectively. Mn and Pb concentrations were within the limit (the maximum lead limit is 100 µgg-1, and manganese is 2000 µgg-1); however, both are close to the limit in station_8.
Table 4. Test results for soil samples.
Indices for soil
The contamination factor () was calculated using chromium, lead, and manganese concentrations () in the soil samples. The contamination factor threshold was labeled into four categories (low, moderate, considerable, and very high contamination). The analysis found that lead and manganese contamination factors were categorized as low-contaminated in all soil samples (). However, station_8 was found to be moderately contaminated.
Table 5. Contamination factor of soil samples.
The pollution load index (PLI) was calculated and labeled into three criteria, and the results are presented in . It was found that the results of PLI were consistent with those of the contamination factor, with less pollution observed in seven out of eight samples. However, station_8 was found to be polluted.
Table 6. Pollution load index (PLI) of soil samples.
Vegetable samples assessment results
Heavy metal concentration
Leafy vegetables significantly show higher heavy metal concentrations than non-leafy ones (Sultana, Tanvir, Hussain, Chamon, & Mondol, Citation2022). Three different leafy vegetable samples (Pumpkin leaves, Bottle guard leaves and Bathua leaves) were collected from three locations. The same vegetables were not collected as samples since the locals grew different vegetables at different stations. The results of heavy metal concentration in collected vegetables are presented in .
Table 7. Heavy metal concentration in vegetable samples.
Pumpkin, Bottle guard and Bathua leaves were collected from station_2, station_4 and station_5, respectively. Bathua, Bottle guard and Pumpkin guard leaves exceeded chromium’s maximum permissible limit (1.3 µgg-1), which was 3.56 µgg-1, 2.32 µgg-1 and 1.95 µgg-1, respectively (). Moreover, Bathua leaves crossed the maximum permissible (0.3 µgg-1) Pb limit (0.36 µgg-1). In all of the samples, the manganese was within permissible limits (). However, in Bathua leaves, manganese concentration (486 µgg-1) was very close to the maximum permissible limits (500 µgg-1).
Index for vegetable samples
Metal pollution index (MPI) was calculated using the concentration of trace elements () in collected vegetables. The locals produced these vegetables in bulk quantities and sold them in the market in Madhabdi. The calculated MPI (12.10–33.09) is high; for this reason, the vegetables cultivated in the study area can be leveled as a high-risk category for consumption as food ().
Table 8. Metal pollution index of vegetables.
Discussions
Physico-chemical properties and heavy metal concentration in water
The previous studies on textile industry pollution by Ahsan et al. (Citation2019); Nahar, Chowdhury, Chowdhury, Rahman, and Mohiuddin (Citation2018); Sarker, Razzaque, Hoque, Roy, and Hossain (Citation2015); Sultana, Islam, Saha, and Al-Mansur (Citation2009); Sultana, Ali, Uddin, and Haque (Citation2013) in Madhabdi and other parts of Bangladesh found higher pH, EC, TDS and low DO in effluent/industry adjacent surface water. Nahar et al.‘s 2018 study in the Madhabdi found pH, EC and TDS higher than ours, which may be because the sample was collected directly from the effluent. In contrast, our study collected the sample from surface water sources adjacent to the textile industry. The pH standard 6–9 is used for effluent treatment plants in EMP or EIA reports for textile industries in Bangladesh (DoE, Citation2008). The average pH value of surface water in the study area is 9.19, slightly above the standard. A study by Sultana, Ali, Uddin, and Haque (Citation2013) found a pH range of 8–10 when the sample was collected from a canal adjacent to the textile industry of Savar Dhaka. Ahsan et al. (Citation2019) found that the pH ranges from 8.1 to 11.2 in the textile industry effluent of Narayanganj. Nahar et al. (Citation2018) found an average pH of 4.15–12.79 and a mean pH of 10.61 in the effluent of the Madhabdi area. Increased pH levels might result from using a variety of colors, salts, and solvents (Nahar, Chowdhury, Chowdhury, Rahman, & Mohiuddin, Citation2018). Alkaline water can potentially cause skin irritations and itchy and dry skin (Proksch, Citation2018; UCLA Health, Citation2023). Moreover, ammonia toxicity increases with a high pH value and harms plants and aquatic life (Wurts, Citation2003). The acceptable limit of EC in Bangladesh is 1200 µS cm-1 as per the national standards for industrial wastewater proposed through DoE (Citation1997). However, the average EC value of the stations in this study is 2232.38 µS cm-1, which is higher than the acceptable value (). The highest was 4280 µScm-1 in station_6. The highest EC value of effluents of handloom dyeing industries at Madhabdi, 5405 μScm −1, was found by Nahar, Chowdhury, Chowdhury, Rahman, and Mohiuddin (Citation2018) by collecting effluent from dyeing industries and shows consistent results with our study. High EC was also found by the study of Ahsan et al. (Citation2019) (range: 811–7960 µScm-1 mean: 3845 µS cm-1); Sarker, Razzaque, Hoque, Roy, and Hossain (Citation2015) (range: 1850–1870 µScm-1, mean 1857.1 µScm-1); Sultana, Islam, Saha, and Al-Mansur (Citation2009) (range: 795–60200 µS cm-1; mean: 14109.56 µS cm-1) of textile effluent. Water with high EC is unsuitable for irrigation and harmful to the ecosystem (MoE, Citation2023; Olson, Citation2019; Zaman, Shahid, & Heng, Citation2018). The TDS >2000 mg L − 1 is also unsuitable for irrigation and harmful to the soil (Nahar, Chowdhury, Chowdhury, Rahman, & Mohiuddin, Citation2018). The average TDS value in the study area is 1294.88 mgL-1 (). However, station 1 was close to the standard permissible limit, and station 6 crossed the standard limit of 2100 mgL-1 (). Nahar, Chowdhury, Chowdhury, Rahman, and Mohiuddin (Citation2018) found much higher TDS (mean 8084.706 mgL-1), which may be because the sample was collected directly from effluent. Sultana, Ali, Uddin, and Haque (Citation2013) found that the TDS value ranges from 2050–3050 mgL-1 in a surface water body adjacent to textile industries in the Savar area. High TDS values were also found in the effluent in other places in Bangladesh by the study of Ahsan et al. (Citation2019) (246–8180 mgL-1); Sarker, Razzaque, Hoque, Roy, and Hossain (Citation2015) (range 1850–1870 mgL-1); Sultana, Islam, Saha, and Al-Mansur (Citation2009) (range: 391–46700 mgL-1). The salts, acids, and bases in dye and different operational stages in dyeing might be responsible for the higher TDS value (Correia, Stephenson, & Judd, Citation1994).
The dissolved oxygen range in the study is 0.5–1.3 mgL-1, much lower than the standard set for industrial units through DoE (Citation1997). The standard value ranges between 4.5 and 8 mgL-1 (DoE, Citation1997), ensuring a healthy living environment for life forms. Fish cannot survive in water with a DO of less than five mgL-1 (Bozorg-Haddad, Delpasand, & Loáiciga, Citation2021). This study found DO less than the standard range at all stations (). The average DO was 0.78 mgL-1, much lower than the standard range (4.5–8 mgL-1). Azanaw, Birlie, Teshome, and Jemberie (Citation2022) found similar results: low DO in textile effluent ranged from 1.95 mgL-1-5.83 mgL-1. Low DO is also reported by a study by Sultana, Ali, Uddin, and Haque (Citation2013) (2.6–5.72 mgL-1) in the adjacent water body of textile effluent. The study by Ahsan et al. (Citation2019) (0.30–3.68 mgL-1); Sarker, Razzaque, Hoque, Roy, and Hossain (Citation2015) (1.20–4.58 mgL-1); Sultana, Islam, Saha, and Al-Mansur (Citation2009) (0.42–4.60 mgL-1) also found very low DO in textile industry effluent in different parts of Bangladesh.
The textile industry is a major source of chromium contamination since metal-based dyes used in this industry mostly include Cr (Banat, Nigam, Singh, & Marchant, Citation1996). The mean Cr (1.03 mgL-1) and Pb (0.13 mgL-1) concentrations in water exceeded the national permissible limit (). In the study of Nahar, Chowdhury, Chowdhury, Rahman, and Mohiuddin (Citation2018) in the Madhabdi area, the concentration of Cr and Pb in the effluent was BDL ~ 2.15 mgL-1 and BDL ~ 0.44 mgL-1, respectively. The concentration of Mn in water in our study is (Mean 0.89 mgL-1, range 0.18–2.17 mgL-1), which has not crossed the permissible limit (). A study by Nahar, Chowdhury, Chowdhury, Rahman, and Mohiuddin (Citation2018) found Mn range of 0.10 ~ 2.46 mgL-1 in the effluent of the textile industries of the Madhabdi area. Our study is concurrent with the study of Nahar, Chowdhury, Chowdhury, Rahman, and Mohiuddin (Citation2018). However, we found a slightly lower concentration than Nahar, Chowdhury, Chowdhury, Rahman, and Mohiuddin (Citation2018) as collected samples were not directly from effluent. According to the water quality index (WQI), 6 out of 8 samples were unsuitable for drinking, and the two remaining samples were in poor condition (). According to the contamination index, one sample was highly polluted, four showed medium pollution, and the rest three showed low pollution. According to the heavy metal evaluation index, one sample shows high pollution, five samples show medium pollution, and two show low pollution. The result of indexing indicates serious water pollution in the study area.
Physico-chemical properties and heavy metal concentration in soil
The pH of the soil ranged between 7.77–9.03, and the average pH was 8.58, which indicates that the soil is alkaline. The study conducted by Ajmal and Khan (Citation1985) also found soil for agricultural farming adjacent to textile factories to be alkaline and deficient in dissolved oxygen. The pH level in the soil can impact nutrient recycling and availability for crop yield production, distribution of harmful substances in the environment, and their removal or translocation (Neina, Citation2019). Alkaline soil is harmful to plant growth, and thus, it can potentially harm the growth of vegetables grown on that land (Liu & Zhang, Citation2012). The electric conductivity ranged from 299–1444 µScm-1. The average electric conductivity is 862.25 µScm-1. A study by Shammi, Salam, and Khan (Citation2021) found soil pH varied from 6.7 to 7.7, and the EC of soil from 177–326 μS/cm, respectively, in agricultural soil of the Kulla union of Dhamrai upazila much lower than our study. Dhamrai is a sub-urban mixed-industrial area. However, the concentration of industry is not similar to the Madhabdi area. Soil with high EC indicates a high concentration of salt that can be toxic to the plant (USDA, Citation2023). A high concentration of Pb and Cr near textile dyeing industries was reported in the study by Ahmed, Matsumoto, and Kurosawa (Citation2018), Shammi, Salam, and Khan (Citation2021), Tusher, Piash, Latif, Kabir, and Rana (Citation2017), and Zakir, Sumi, Sharmin, Mohiuddin, and Kaysar (Citation2015). Chromium concentration ranged between 36.40–157.70 µgg-1 in the study area (). The average value was 68.21 µgg-1, which did not exceed the maximum limit (100 µgg-1). However, station_8 crossed the limit (). Lead and manganese concentrations ranged between 31.06–78.94 µgg-1 and 395.43–1743.76 µgg-1, respectively (). Mn and Pb concentrations were within the limit; however, both are close to the limit in station_8.
A study by Shammi, Salam, and Khan (Citation2021) found Cr, Pb and Mn concentrations in agricultural topsoil 16.14 µgg-1, 17.93 µgg-1, 426.76 µgg-1, respectively, in the suburban mixed industrial zone of Dhaka. Zakir, Sumi, Sharmin, Mohiuddin, and Kaysar (Citation2015) found that Cr and Pb concentrations in the Gazipur area range from 0.00 to 80.78 µgg-1 and 0.44 to 127.45 µgg-1, respectively. The concentration in our study area was much higher than that of Shammi, Salam, and Khan (Citation2021), as Madhabdi is heavily industrialized with textile areas with high pollution levels in the soil. We found a moderate pollution level in the pollution load index (PLI) at one site, and the rest of the seven were unpolluted to moderate pollution levels in our study area. A study by Shammi, Salam, and Khan (Citation2021) reports a moderate level of pollution based on PLI. Zakier et al. report 9 out of 23 sites in the Gazipur area as moderate levels of pollution based on PLI. However, studies by Ahmed, Matsumoto, and Kurosawa (Citation2018), Shammi, Salam, and Khan (Citation2021) and Zakir, Sumi, Sharmin, Mohiuddin, and Kaysar (Citation2015) conducted their study in mixed industrial areas.
Heavy metal concentration in vegetables
A high concentration of Pb and Cr and other metals was found in the previous studies in different parts of Bangladesh in vegetables that were grown adjacent to industrial areas by Alam et al. (Citation2023); Jolly et al. (Citation2023); Laboni et al. (Citation2023); Parvin, Sultana, and Zahid (Citation2014); Proshad, Kormoker, Islam, and Chandra (Citation2020); Sultana et al. (Citation2017); Sultana, Tanvir, Hussain, Chamon, and Mondol (Citation2022). In our study, the Cr pollution in all samples was higher than the maximum level proposed by WHO and FAO (Popovici et al., Citation2021) (see ). The Pb concentration was higher in one sample (). Although Mn concentrations were within the permissible limit, these were close to the limit in one sample. In the metal pollution index, all the vegetables are found at high-risk levels for consumption as food due to high MPI value (). Higher MPI in vegetables signifies a greater concentration of heavy metals (Mawari et al., Citation2022). Sultana et al. (Citation2015) took samples from industrial and non-industrial sites of Dhaka, Pabna and Teknaf of Cox’s Bazar and calculated MPI. We found the MPI value in leafy vegetables much higher (12.10–33.09) than the study of Sultana et al. (Citation2015) (the highest MPI in different crops and plants was 11, and in leafy vegetables, it was 6.27). All these vegetables are grown in contaminated soil adjacent to dyeing industries using water polluted with the effluent from the dyeing industries. Laboni et al. (Citation2023) study of heavy metal concentration in vegetables using AAS in the same district adjacent to the study area found similar results (where Pb and Cr concentration exceeded the permissible level, Mn concentration stayed within the limit). Hossain et al. (Citation2016) describe the Pb concentration as alarming by studying heavy metal concentration in vegetables in all 64 districts in Bangladesh. Even high heavy metal concentrations were found in different vegetables collected from the largest market, Kawran Bazar of Dhaka, according to the study by Sultana, Tanvir, Hussain, Chamon, and Mondol (Citation2022). Pb and Cr is a carcinogenic heavy metals. Cardiovascular diseases, disruption in vitamin D, iron, zinc, and copper metabolism, kidney dysfunction, liver diseases, and disorders of the immune and reproductive system can be caused by Pb exposure through these vegetables (Zwolak, Sarzyńska, Szpyrka, & Stawarczyk, Citation2019). Regular consumption of these vegetables contaminated with heavy metals may lead to diseases like thalassemia, dermatitis, brain and kidney damage, cardiovascular diseases and cancer (Hoaghia, Cadar, Moisa, Roman, & Kovacs, Citation2022; Khan, Jolly, Islam, Akhter, & Kabir, Citation2014). Leafy vegetables concentrate the highest amount of heavy metal, followed by root vegetables (Sultana, Tanvir, Hussain, Chamon, & Mondol, Citation2022). The cultivation of crops adjacent to industrial areas and irrigation using wastewater is the reason behind the significant accumulation of heavy metals in vegetables and other crops (Zwolak, Sarzyńska, Szpyrka, & Stawarczyk, Citation2019). No agricultural crop should be grown in contaminated soil adjacent to industrial effluents like Madhabdi (particularly leafy and root vegetables). Moreover, the polluted water must not be used for irrigation.
Conclusions
The water quality of effluent discharge in the Madhabdi area is alarmingly poor. The effluent discharge is thick and dark and emits an unbearable stench. During sample collection and lab analysis, skin irritation was experienced. The pH value of four out of eight water samples exceeded the acceptable limit, with the average pH of 9.19 also slightly higher than the permissible limit of 6–9. The mean EC level was 2232.38 µScm-1, far higher than the permitted limit of 1200 µScm-1. However, the TDS was within the acceptable limit except for one station (2420 mgL-1). The DO level was alarmingly low (0.79 mgL-1) compared to the 4.5–8 mgL-1 standard. The results indicate that the water in this area, even after the ETP installation, is unsuitable for bathing, domestic and agricultural use. The low DO level also makes it impossible for fish and other aquatic fauna to survive in this water. Urgent measures must be taken to address this critical issue before it seriously threatens public health and the environment. In the water samples, the Cr concentration was higher than the acceptable limit. The Pb concentration was slightly higher, and the Mn concentration was within the limit. The soil is alkaline (mean pH was 8.58). The soil stations show unpolluted to moderate pollution in pollution load index in all the stations except for station_8, where pollution was moderate. Heavy metal concentration was higher or close to the maximum permissible limit in most vegetable samples. The concentration of manganese was below permissible limits. Although, in station_5, it was 486 µgg-1 (the maximum permissible limit is 500 µgg-1). Chromium concentration in vegetables exceeds the permissible limits in all stations, and the mean chromium concentration was 2.61 µgg-1, which is higher than the maximum limit of 1.3 µgg-1.
In one station, the lead concentration was 0.36 µgg-1, higher than the maximum permissible limit of 0.3 µgg-1. The cultivated vegetables from that area are at a high-risk level (MPI range from 12.10–33.09) for consumption as food. The study concludes that the water quality and heavy metal concentration in vegetables are concerning. The effluent discharges that mix with the nearest water bodies and agricultural lands face adverse consequences. Heavy metals are non-degradable and stay in the environment for a long time. It will adversely affect aquatic flora and fauna, including fish. The consumption and use of this water for domestic usage are also harmful to public health. Consuming this heavy metal through food and water for a long time will result in kidney, liver and other diseases. Vegetables and other crops must not be grown adjacent to the textile industry effluent and polluted water bodies. The polluted water from the effluent must not be used for irrigation as well. The factories should operate the ETPs properly. These places need continuous monitoring by the respective authorities. All business owners and other stakeholders, including government authorities, should take a joint approach to resolve this situation.
Acknowledgments
Special thanks to the Department of Soil, Water & Environment, the University of Dhaka, for their continuous assistance and help performing laboratory tests during the pandemic to complete the research.
Disclosure statement
No potential conflict of interest was reported by the author(s).
References
- Abechi, E. S., Okunola, O. J., Zubairu, S. M. J., Usman, A. A., & Apene, E. (2010). Evaluation of heavy metals in roadside soils of major streets in jos metropolis, Nigeria. Journal of Environmental Chemistry & Ecotoxicology, 2(6), 98–102.
- Acharya, S. M. (2018). Collection and preparation of soil, water and plant samples for analysis. International Journal of Chemical Studies, 6(2), 3298–3303.
- Ahmed, M., Matsumoto, M., & Kurosawa, K. (2018). Heavy metal contamination of irrigation water, soil, and vegetables in a multi-industry district of Bangladesh. International Journal of Environmental Health Research, 12(4), 531–542. https://doi.org/10.1007/s41742-018-0113-z
- Ahmed, M., Matsumoto, M., Ozaki, A., Thinh, N. V., & Kurosawa, K. (2019). Heavy metal contamination of irrigation water, soil, and vegetables and the difference between dry and wet seasons near a multi-industry zone in Bangladesh. Water, 11(3), 583. https://doi.org/10.3390/w11030583
- Ahsan, M. A., Satter, F., Siddique, M. A. B., Akbor, M. A., Ahmed, S., Shajahan, M., & Khan, R. (2019). Chemical and physicochemical characterization of effluents from the tanning and textile industries in Bangladesh with multivariate statistical approach. Environmental Monitoring and Assessment, 191(9), 575. https://doi.org/10.1007/s10661-019-7654-2
- Ajmal, M., & Khan, A. U. (1985). Effects of a textile factory effluent on soil and crop plants. Environmental Pollution Series A, Ecological and Biological, 37(2), 131–148. https://doi.org/10.1016/0143-1471(85)90004-2
- Alam, M. N. E., Hosen, M. M., Ullah, A. K. M. A., Maksud, M. A., Khan, S. R. … Quraishi, S. B. (2023). Pollution characteristics, source identification, and health risk of heavy metals in the soil-vegetable system in two districts of Bangladesh. Biological Trace Element Research, 201(10), 4985–4999. https://doi.org/10.1007/s12011-023-03558-7
- Azanaw, A., Birlie, B., Teshome, B., & Jemberie, M. (2022). Textile effluent treatment methods and eco-friendly resolution of textile wastewater. Case Studies in Chemical and Environmental Engineering, 6, 100230. https://doi.org/10.1016/j.cscee.2022.100230
- Backman, B., Bodiš, D., Lahermo, P., Rapant, S., & Tarvainen, T. (1998). Application of a groundwater contamination index in Finland and Slovakia. Environmental Geology, 36(1–2), 55–64. https://doi.org/10.1007/s002540050320
- Banat, I. M., Nigam, P., Singh, D., & Marchant, R. (1996). Microbial decolorisation of textile-dyecontaining effluents: A review. Bioresource Technology, 58(3), 217–227. doi:10.1016/S0960-8524(96)00113-7
- Banglapedia. (2021). Narsingdi sadar upazila. In S. Islam and S. MiahEds., Banglapedia - the national encyclopedia of Bangladesh Dhaka: Asiatic Society of Bangladesh. https://en.banglapedia.org/index.php/Narsingdi_Sadar_Upazila#:~:text=Narsingdi%20Sadar%20Upazila%20(narsingdi%20district,92%C2%B050’%20east%20longitudes
- Bozorg-Haddad, O., Delpasand, M., & Loáiciga, H. A. (2021). Water quality, hygiene, and health. In O. Bozorg-Haddad (Ed.), Economical, political, and social issues in water resources (pp. 217–257). Elsevier. doi:10.1016/B978-0-323-90567-1.00008-5
- Brown, R. M., McClelland, N. I., Deininger, R. A., & O’Connor, M. F. 1972. A water quality index — crashing the psychological barrier. In W. A. Thomas. Ed., Indicators of environmental quality, Vol. 3pp. 173–182. Boston, MA.
- Cai, Y. J., & Choi, T. M. (2020). A United Nations’ sustainable development goals perspective for sustainable textile and apparel supply chain management. Transportation Research Part E: Logistics & Transportation Review, 141, 102010. https://doi.org/10.1016/j.tre.2020.102010
- Chakraborty, R., & Ahmad, F. (2022). Economical use of water in cotton knit dyeing industries of Bangladesh. Journal of Cleaner Production, 340, 130825. https://doi.org/10.1016/j.jclepro.2022.130825
- Chiroma, T. M., Ebewele, R. O., & Hymore, F. K. (2014). Comparative assessment of heavy metal levels in soil, vegetables and urban grey water used for irrigation in Yola and Kano. International Reference Journal of Engineering Science, 3(2), 1–9.
- Correia, V. M., Stephenson, T., & Judd, S. J. (1994). Characterisation of textile wastewaters‐a review. Environmental Technology, 15(10), 917–929. https://doi.org/10.1080/09593339409385500
- DoE (Department of Environment). (1997). The environment conservation rules, 1997. Dhaka: Government of the People’s Republic of Bangladesh.
- DoE (Department of Environment). (2008). Guide for assessment of effluent treatment plants. Dhaka: Government of the People’s Republic of Bangladesh.
- Edet, A. E., & Offiong, O. E. (2002). Evaluation of water quality pollution indices for heavy metal contamination monitoring. A study case from akpabuyo-odukpani area, lower Cross River Basin (southeastern Nigeria). GeoJournal, 57(4), 295–304. https://doi.org/10.1023/B:GEJO.0000007250.92458.de
- Gebeyehu, H. R., Bayissa, L. D., & Bhatnagar, A. (2020). Levels of heavy metals in soil and vegetables and associated health risks in mojo area, Ethiopia. PloS One, 15(1), e0227883. https://doi.org/10.1371/journal.pone.0227883
- Haque, N. (2017). Exploratory analysis of fines for water pollution in Bangladesh. Water Resources and Industry, 18, 1–8. https://doi.org/10.1016/j.wri.2017.05.001
- Hasan, M. F., Mow, N., Alam, M. R., Hasan, S. M. A., & Mamtaz, R. (2018). Recycling potential of textile solid waste. In F. A. O. RiejosEd., Waste management and the environment, WIT transactions on ecology and the environment (Vol. 231, pp. 125–136). https://doi.org/10.2495/WM180121
- Hasan, M. K., Shahriar, A., & Jim, K. U. (2019). Water pollution in Bangladesh and its impact on public health. Heliyon, 5(8), e02145. https://doi.org/10.1016/j.heliyon.2019.e02145
- Hoaghia, M. A., Cadar, O., Moisa, C., Roman, C., & Kovacs, E. (2022). Heavy metals and health risk assessment in vegetables grown in the vicinity of a former non-metallic facility located in Romania. Environmental Science and Pollution Research, 29(26), 40079–40093. https://doi.org/10.1007/s11356-022-18879-8
- Ho, N., & Aj, E. (2018). Contamination indices and heavy metal concentrations in soils in Okpoko and environs, Southeastern Nigeria. Journal of Environmental Science and Public Health, 2(2), 77–95. https://doi.org/10.26502/jesph.96120031
- Hoque, A., & Clarke, A. (2013). Greening of industries in Bangladesh: Pollution prevention practices. Journal of Cleaner Production, 51, 47–56. https://doi.org/10.1016/j.jclepro.2012.09.008
- Horton, R. K. (1965). An index-number system for rating water quality. Journal - Water Pollution Control Federation, 37(3), 300–306.
- Hossain, M. A., & Hossain, M. I. (2020). The environmental impacts of textile dyeing industries in Bangladesh. International Research Journal of Advanced Engineering and Science, 5(2), 113–116.
- Hossain, A. M. M. M., Islam, M. S., Mamun, M. M., Al-Jonaed, H. M., Imran, M. … Elahi, S. F. (2016). Environmental surveillance of commonly-grown vegetables for investigating potential lead and chromium contamination intensification in Bangladesh. SpringerPlus, 5, 1803. https://doi.org/10.1186/s40064-016-3458-9
- Hossain, L., Sarker, S. K., & Khan, M. S. (2018). Evaluation of present and future wastewater impacts of textile dyeing industries in Bangladesh. Environmental Development, 26, 23–33. https://doi.org/10.1016/j.envdev.2018.03.005
- Hossain, M. A., Uddin, M. K., Molla, A. H., Afrad, M. S. I., Rahman, M. M., & Rahman, G. K. M. M. (2011). Impact of industrial effluents discharges on degradation of natural resources and threat to food security. The Agriculturists, 8(2), 80–87. https://doi.org/10.3329/agric.v8i2.7581
- Hseu, Z. Y. (2004). Evaluating heavy metal contents in nine composts using four digestion methods. Bioresource Technology, 95(1), 53–59. https://doi.org/10.1016/j.biortech.2004.02.008
- Iqbal, S. A., Mahmud, I., & Quader, A. K. M. A. (2014). Textile sludge management by incineration technique. Procedia Engineering, 90, 686–691. https://doi.org/10.1016/j.proeng.2014.11.795
- Islam, M. M., Mahmud, K., Faruk, O., & Billah, M. S. (2011). Textile dyeing industries in Bangladesh for sustainable development. International Journal of Environmental Science & Development, 2, 428–436. https://doi.org/10.7763/IJESD.2011.V2.164
- Islam, M. S., Proshad, R., Haque, M. A., Hoque, M. F., Hossin, M. S., & Sarker, M. N. I. (2018). Assessment of heavy metals in foods around the industrial areas: Health hazard inference in Bangladesh. Geocarto International, 35(3), 280–295. https://doi.org/10.1080/10106049.2018.1516246
- Islam, M. S., Uddin, M. K., Tareq, S. M., Shammi, M., Kamal, A. K. I. … Kuramitz, H. (2015). Alteration of water pollution level with the seasonal changes in mean daily discharge in three main rivers around Dhaka city, Bangladesh. Environments, 2(4), 280–294. https://doi.org/10.3390/environments2030280
- Jolly, Y. N., Akter, S., Kabir, M. J., Mamun, K. M., Abedin, M. J., Fahad, S. M., & Rahman, A. (2023). Heavy metals accumulation in vegetables and its consequences on human health in the areas influenced by industrial activities. Biological Trace Element Research. https://doi.org/10.1007/s12011-023-03923-6
- Kamal, A. K. I., Ahmed, F., Hassan, M., Uddin, M. K., & Hossain, S. M. (2016). Characterization of textile effluents from Dhaka export processing zone (DEPZ) area in Dhaka, Bangladesh. Pollution, 2(2), 153–161. https://doi.org/10.7508/pj.2016.02.005
- Karim, M. M., Das, A. K., & Lee, S. H. (2006). Treatment of colored effluent of the textile industry in Bangladesh using zinc chloride treated indigenous activated carbons. Analytica Chimica Acta, 576(1), 37–42. https://doi.org/10.1016/j.aca.2006.01.079
- Kar, A., Keane, S. E., & Greer, L. (2012). Best practices for textile mills to save money and reduce pollution, Bangladesh: A practical guide for responsible sourcing. Natural Resources Defense, Council, 28. viewed on 14.03.2023 from. https://www.nrdc.org/sites/default/files/cbd-textilemills-best-practices-bangladesh.pdf
- Kashem, M. A., & Singh, B. R. (1999). Heavy metal contamination of soil and vegetation in the vicinity of industries in Bangladesh. Water, Air, and Soil Pollution, 115(1/4), 347–361. https://doi.org/10.1023/A:1005193207319
- Khan, M. S., Ahmed, S., Evans, A. E. V., & Chadwick, M. (2009). Methodology for performance analysis of textile effluent treatment plants in Bangladesh. Chemical Engineering Research Bulletin, 13(2), 61–66. https://doi.org/10.3329/cerb.v13i2.3939
- Khan, F. E., Jolly, Y. N., Islam, G. R., Akhter, S., & Kabir, J. (2014). Contamination status and health risk assessment of trace elements in foodstuffs collected from the Buriganga River embankments, Dhaka, Bangladesh. International Journal of Food Contamination, 1(1), 1–8. https://doi.org/10.1186/s40550-014-0001-z
- Kibria, G., Hossain, M. M., Mallick, D., Lau, T. C., & Wu, R. (2016). Monitoring of metal pollution in waterways across Bangladesh and ecological and public health implications of pollution. Chemosphere, 165, 1–9. https://doi.org/10.1016/j.chemosphere.2016.08.121
- Krishna, A. K., & Govil, P. K. (2007). Soil contamination due to heavy metals from an industrial area of Surat, Gujarat, Western India. Environmental Monitoring and Assessment, 124(1–3), 263–275. https://doi.org/10.1007/s10661-006-9224-7
- Laboni, F. A., Ahmed, M. W., Kaium, A., Alam, M. K., Parven, A. … Khan, M. S. I. (2023). Heavy metals in widely consumed vegetables grown in industrial areas of Bangladesh: A potential human health hazard. Biological Trace Element Research, 201(2), 995–1005. https://doi.org/10.1007/s12011-022-03179-6
- Liu, X. H., & Zhang, X. C. (2012). Effect of biochar on pH of alkaline soils in the loess plateau: Results from incubation experiments. International Journal of Agriculture & Biology, 14(5), 745–750.
- Mamun, A. A., Bormon, K. K., Rasu, M. N. S., Talukder, A., Freeman, C., Burch, R., & Chander, H. (2022). An assessment of energy and groundwater consumption of textile dyeing mills in Bangladesh and minimization of environmental impacts via long-term key performance indicators (KPI) baseline. Textiles, 2(4), 511–523. https://doi.org/10.3390/textiles2040029
- Matsuura, A., & Teng, C. (2020). Understanding the gender composition and experience of ready-made garment (rmg) workers in Bangladesh. Bangladesh: International Labour Organization.
- Mawari, G., Kumar, N., Sarkar, S., Daga, M. K., Singh, M. M., Joshi, T. K., & Khan, N. A. (2022). Heavy metal accumulation in fruits and vegetables and human health risk assessment: Findings from Maharashtra, India. Environmental Health Insights, 16, 117863022211191. https://doi.org/10.1177/11786302221119151
- MoE (Ministry of Environment). 2023. Electrical conductivity (EC), ministry of environment (MoE). Taiwan, viewed in December 21, 2023. from: https://wq.moenv.gov.tw/EWQP/en/Encyclopedia/NounDefinition/Pedia_48.aspx
- Nahar, K., Chowdhury, M. A. K., Chowdhury, M. A. H., Rahman, A., & Mohiuddin, K. M. (2018). Heavy metals in handloom-dyeing effluents and their biosorption by agricultural byproducts. Environmental Science and Pollution Research, 25(8), 7954–7967. 10.1007/s11356-017-1166-9
- Nasrabadi, T. (2015). An index approach to metallic pollution in river waters. Journal of Engineering Geology, 9(2), 2841–2868. https://doi.org/10.18869/acadpub.jeg.9.2.2841
- Nassar, O. M., Nasr, H. A., El-Sayed, M. H., & Kobisi, A. E. (2018). Heavy metal levels in some popular vegetables from some selected markets in Saudi Arabia. Egyptian Journal of Botany, 58(3), 627–638. 40. https://doi.org/10.21608/ejbo.2018.4548.1192
- Neina, D. (2019). The role of soil pH in plant nutrition and soil remediation. Applied & Environmental Soil Science, 2019(5794869), 1–9. https://doi.org/10.1155/2019/5794869
- Olson, J. R. (2019). Predicting combined effects of land use and climate change on river and stream salinity. Philosophical Transactions of the Royal Society B: Biological Sciences, 374(1764), 20180005. https://doi.org/10.1098/rstb.2018.0005
- Parvin, R., Sultana, A., & Zahid, M. A. (2014). Detection of heavy metals in vegetables cultivated in different locations in Chittagong, Bangladesh. IOSR Journal of Environmental Science, Toxicology and Food Technology, 8(4), 58–63. https://doi.org/10.9790/2402-08425863
- Popovici, V., Bucur, L., Calcan, S. I., Cucolea, E. I., Costache, T. … Badea, V. (2021). Elemental analysis and in vitro evaluation of antibacterial and antifungal activities of Usnea barbata (L.) Weber ex F.H. Wigg from Călimani mountains, Romania. Plants, 11(1), 32. https://doi.org/10.3390/plants11010032
- Proksch, E. (2018). pH in nature, humans and skin. The Journal of Dermatology, 45(9), 1044–1052. https://doi.org/10.1111/1346-8138.14489
- Proshad, R., Kormoker, T., Islam, M. S., & Chandra, K. (2020). Potential health risk of heavy metals via consumption of rice and vegetables grown in the industrial areas of Bangladesh. Human and Ecological Risk Assessment: An International Journal, 26(4), 921–943. https://doi.org/10.1080/10807039.2018.1546114
- Rahman, M. M., Rahman, M. F., & Nasirujjaman, K. (2017). A study on genotoxicity of textile dyeing industry effluents from Rajshahi, Bangladesh, by the allium cepa test. Chemistry & Ecology, 33(5), 434–446. https://doi.org/10.1080/02757540.2017.1316491
- Raian, S., Ali, S. M., Sarker, M. R., Sankaranarayanan, B., Kabir, G., Paul, S. K., & Chakrabortty, R. K. (2022). Assessing sustainability risks in the supply chain of the textile industry under uncertainty. Resources, Conservation & Recycling, 177, 105975. https://doi.org/10.1016/j.resconrec.2021.105975
- Rajeshkumar, S., Liu, Y., Zhang, X., Ravikumar, B., Bai, G., & Li, X. (2018). Studies on seasonal pollution of heavy metals in water, sediment, fish and oyster from the Meiliang Bay of Taihu Lake in China. Chemosphere, 191, 626–638. https://doi.org/10.1016/j.chemosphere.2017.10.078
- Ranjan, A. (2020). Water issues in Bangladesh: Growing pollution and mismanagement. Asian Aff, 51(2), 328–346. https://doi.org/10.1080/03068374.2020.1749456
- Roy, R., Fakhruddin, A. N. M., Khatun, R., Islam, M. S., Ahsan, M. A., & Neger, A. J. M. T. (2010). Characterization of textile industrial effluents and its effects on aquatic macrophytes and algae. Bangladesh Journal of Scientific & Industrial Research, 45(1), 79–84. https://doi.org/10.3329/bjsir.v45i1.5187
- Sagagi, B. S., Bello, A. M., & Danyaya, H. A. (2022). Assessment of accumulation of heavy metals in soil, irrigation water, and vegetative parts of lettuce and cabbage grown along Wawan Rafi, Jigawa State, Nigeria. Environmental Monitoring and Assessment, 194(10), 699. https://doi.org/10.1007/s10661-022-10360-w
- Sakamoto, M., Ahmed, T., Begum, S., & Huq, H. (2019). Water pollution and the textile industry in Bangladesh: Flawed corporate practices or restrictive opportunities? Sustainability, 11(7), 1951. https://doi.org/10.3390/su11071951
- Sarker, M. R. H., Razzaque, A., Hoque, M. M., Roy, S., & Hossain, M. K. (2015). Investigation of effluent quality from an effluent treatment plant of a textile industry, Fakir Knitwear Ltd. Journal of Environmental Science & Natural Resources, 8(2), 25–31. https://doi.org/10.3329/jesnr.v8i2.26860
- Shammi, S. A., Salam, A., & Khan, M. A. H. (2021). Assessment of heavy metal pollution in the agricultural soils, plants, and in the atmospheric particulate matter of a suburban industrial region in Dhaka, Bangladesh. Environmental Monitoring and Assessment, 193(2), 104. https://doi.org/10.1007/s10661-021-08848-y
- Srivastava, A. K., Mishra, D. K., Tripathi, S., & Singh, P. (2007). Determination of water quality index and suitability of ground water in a college in Balrampur, U.P. Nature Environment & Pollution Technology, 6(2), 315–319.
- Sultana, Z., Ali, M. E., Uddin, M. S., & Haque, M. M. (2013). Study on implementation of effluent treatment plants for safe environment from textile waste. Journal of Research in Environmental Science and Toxicology, 2(1), 9–16.
- Sultana, M. S., Islam, M. S., Saha, R., & Al-Mansur, M. A. (2009). Impact of the effluents of textile dyeing industries on the surface water quality inside D.N.D embankment, Narayanganj. Bangladesh Journal of Scientific & Industrial Research, 44(1), 65–80. https://doi.org/10.3329/bjsir.v44i1.2715
- Sultana, M. S., Jolly, Y. N., Yeasmin, S., Islam, A., Satter, S., & Tareq, S. M. (2015). Transfer of heavy metals and radionuclides from soil to vegetables and plants in Bangladesh. In K. Hakeem, M. Sabir, M. Ozturk, & A. Mermut (Eds.), Soil remediation and plants: Prospects and challenges (pp. 331–366). Amsterdam, The Netherlands: Elsevier.
- Sultana, M. S., Rana, S., Yamazaki, S., Aono, T., Yoshida, S., Drago, C. K., & Amulen, D. R. (2017). Sociocultural factors associated with fish consumption in Lake Albert fishing community: Guidelines for lead and mercury. Cogent Environmental Science, 3(1). https://doi.org/10.1080/23311843.2017.1304604
- Sultana, R., Tanvir, R. U., Hussain, K. A., Chamon, A. S., & Mondol, M. N. (2022). Heavy metals in commonly consumed root and leafy vegetables in Dhaka city, Bangladesh, and assessment of associated public health risks. Environmental Systems Research, 11(1), 15. https://doi.org/10.1186/s40068-022-00261-9
- Tania, K. A., Bhuiyan, M. A. R., & Ferdous, M. (2022). Emerging small-scale textile industries in residential areas of Mirpur, Dhaka City, Bangladesh: An assessment of the discharged wastewater quality and potential impacts. Environmental Monitoring and Assessment, 194(8), 560. https://doi.org/10.1007/s10661-022-10239-w
- Tomlinson, D. L., Wilson, J. G., Harris, C. R., & Jeffrey, D. W. (1980). Problems in the assessment of heavy-metal levels in estuaries and the formation of a pollution index. Helgoländer Meeresuntersuchungen, 33(1–4), 566–575. https://doi.org/10.1007/BF02414780
- Tusher, T. R., Piash, A. S., Latif, M. A., Kabir, M. H., & Rana, M. M. (2017). Soil quality and heavy metal concentrations in agricultural lands around dyeing, glass and textile industries in Tangail district of Bangladesh. Journal of Environmental Science & Natural Resources, 10(2), 109–116. https://doi.org/10.3329/jesnr.v10i2.39020
- UCLA Health. 2023. Is water with a high pH safe to drink? Viewed in December 21, 2023. from: https://www.uclahealth.org/
- Uddin, F. (2021). Environmental hazard in textile dyeing wastewater from local textile industry. Cellulose, 28(17), 10715–10739. https://doi.org/10.1007/s10570-021-04228-4
- USDA (U.S Department of Agriculture). 2023. Soil quality indicator. Viewed on December 25, 2023. from: https://www.nrcs.usda.gov/conservation-basics/natural-resource-concerns/soils/soil-health/soil-health-assessment
- Usero, J. (1997). Trace metals in the bivalve molluscs ruditapes decussatus and ruditapes philippinarum from the Atlantic coast of southern Spain. Environment International, 23(3), 291–298. 10.1016/S0160-4120(97)00030-5
- Wurts, W. A. (2003). Daily pH cycle and ammonia toxicity. World Aquacult, 34, 20–21.
- Zakir, H. M., Sumi, S. A., Sharmin, S., Mohiuddin, K. M., & Kaysar, S. (2015). Heavy metal contamination in surface soils of some industrial areas of Gazipur, Bangladesh. Journal of Chemical, Biological and Physical Sciences, 5(2), 2191–2206.
- Zaman, M., Shahid, S. A., & Heng, L. (2018). Irrigation water quality. In Guideline for salinity assessment, mitigation and adaptation using nuclear and related techniques (pp. 113–131). Springer. Cham. https://doi.org/10.1007/978-3-319-96190-3_5
- Zwolak, A., Sarzyńska, M., Szpyrka, E., & Stawarczyk, K. (2019). Sources of soil pollution by heavy metals and their accumulation in vegetables: A review. Water, Air, and Soil Pollution, 230(164), 1–9. https://doi.org/10.1007/s11270-019-4221-y