
 ?Mathematical formulae have been encoded as MathML and are displayed in this HTML version using MathJax in order to improve their display. Uncheck the box to turn MathJax off. This feature requires Javascript. Click on a formula to zoom.
ABSTRACT
Constructing dams is one of the human achievements in developing urban societies. In the last few decades, rapid growth in developing the Red Sea coast and Sinai in Egypt has taken place. According to the UN Nexus definition, water, energy, and food are the main sources of sustainable development. The dam gives the best structure that can fulfill these requirements. The geology of Egypt in the concerning areas in both the Red Sea and Sinai shows that both areas are mountainous areas. The wadies in these mountains suffer from being exposed to severe weathering conditions. Flash floods and wind blowing are the main causes of exposing sedimentary rocks in these Wadies to different degrees of weathering. The present paper focuses on studying the effect of weathering on the engineering behavior of dams intended to be constructed in these areas. The examined rock foundations cover mud-stone, Sand-stone, and limestone. A published numerical model for Longtan Dam was utilized as a reference case to construct a verified numerical model that was later employed in a parametric study to clear the effect of weathering on the studied sediment rock. The verification and parametric study were carried out using GeoStudio software. The results show the clear effect of the variation in weathering on the engineering parameters of the examined sedimentary rock deposits.
KEYWORDS:
Introduction
Dams play an important role in the ecological system. Dams have various benefits and advantages, but when exposed to any foundation problem, these dams may show instability failure greater than their benefits. The accumulated problems in the dam may lead to different modes of failure, resulting in damage to the surrounding environment and human loss (Mata, Tavares de Castro, & Sá da Costa, Citation2013). The growing quantity and scale of dams necessitate the use of improved methods for assessing safety aspects, including the quality of concrete, the stiffness, and uniformity of the rock foundation. Pre-construction numerical models of dam structures offer valuable insights and contribute to enhancing both the stability of the dam and optimizing construction costs. An additional benefit of advancing computer modeling tools is the capability to assess the integrity of existing dam structures and the impact of material aging and construction flaws on the stability of the dam. For concrete gravity dams, sliding along the seam where the dam meets the rock foundation is the most common mode of collapse. Historical research shows that the strength and stiffness of the foundation are essential elements in the design of concrete gravity dams. Data gathered from a number of China’s major and smaller gravity dams shows that 82 of these dams possess weak foundations, and over 30 dams had to undergo design modifications because of the significant risk of potential failure (Wei et al., Citation2008).
The web of relationships between the WEF (water, energy, and food) industries is depicted by the Nexus. Academics and policymakers have begun to pay more and more attention to these interconnections of the WEF assets in recent years. In 2011, the World Economic Forum highlighted the importance of comprehending the Nexus as a significant global economic challenge. Simultaneously, the Bonn conference proposed the Nexus approach as an essential and fundamental change for sustainable development (ADC, Citation2015). When building dams in wadis that are prone to flash floods, this method reveals a plethora of options and factors to think about. In the case of a flash flood, dams constructed in wadis act as silent sentinels, collecting and storing water. This valuable resource is essential for a range of uses, including irrigation and industrial processes. Hydropower can be harnessed from the tremendous kinetic energy contained in wadi-flowing streams. By acting as conduits, dams increase energy security and decrease dependency on fossil fuels. Communities and infrastructure downstream are at risk from flash floods that originate in wadis. illustrates this holistic method of evaluating the WEF Nexus (GIZ, Citation2016). The flash floods that take place in Sinai and Red sea coast in Egypt illustrated a clear example of such scenario. Utilizing dams in dealing with such cases clear the importance of examined the effect of suffering the dam foundation from different degree of weathering on dam function and stability. The present work focus on clear these effects.
Figure 1. The WEF Nexus from the ecosystem perspective (GIZ, Citation2016).

As long as the foundations in the present study are stones with variable degree of weathering the gravity dam’s type techniques will be utilized in constructing dams which will be examined. Masonry dams, concrete, and RCC are common for these applications. The investigation of the dam foundation weakness and associated dam failures draw attention of many researchers. Seid-Karbasi and Byrne (Citation2004), and Barakat, Malkawi, and Omar (Citation2005) illustrated in their works different causes of such failures (Barakat, Malkawi, & Omar, Citation2005; Seid-Karbasi & Byrne, Citation2004).
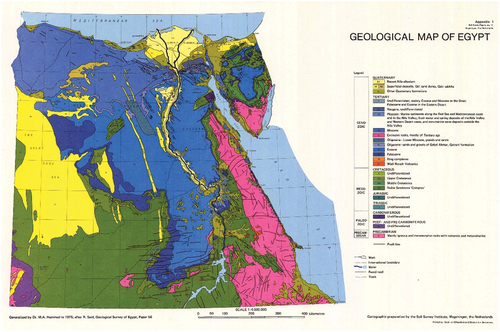
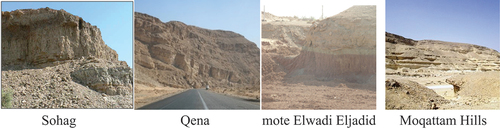
Rough mountains dominate the geology of the Sinai and Red Sea regions of Egypt, creating an impressive panorama. Here, the landscape is relentlessly shaped by natural processes, such as wind erosion and flash floods, which weather the sedimentary rocks in the wadis to different degrees. The engineering behavior of dams planned for construction in these places is greatly affected by weathering, and it is vital to understand this impact. The geological map of Egypt is shown in .
Figure 2. Geologic map of egypt (ESDAC, Citationn.d.).
Longtan dam, which is built in china on the Hongshui River 15 Km far from Tian’e County, is used to generate power and in irrigation to that area. Longtan is a gravity dam constructed using roller-compacted concrete (RCC), featuring a height of 216.5 meters and a length of 849 meters. Upon its completion, it held the distinction of being the world’s tallest and largest RCC dam (Hällqvist & Hy, Citation2016). In this paper, the non-overflow section of Longtan dam is taken as a reference modeling published case. The verification of the studied section and the following parametric studies were performed using Geo-Studio program to study and understand the dam behavior through different types of loads and dam parameters.
Methodology
Numerical modeling parameters
The stability analysis of the dam is conducted in the section that is most susceptible to potential risks. The most substantial segment of the dam, labeled as S1 in , represents its central region and consequently endures the most significant forces. Section S1 is positioned at a distance of 371.74 meters from left abutment (Novak et al., Citation2017).
Figure 3. Cross-section of wadi longtan.
Geometry of non-overflow section of Longtan reservoir-dam-foundation is illustrated as shown in . The height and width of the dam are 188 m and 149.4 m, respectively (Bochnak & Saracco, Citation2020). The slope of the upstream wall is 0.15, while the downstream wall has a slope of 0.75. Reservoir depth will be taken in case of normal water level (NWL) 181.6 meters and for critical water level (CWL) 186.7 meters. Due to the substantial limestone layer in the dam site’s foundation, the hydraulic conductivity value for limestone as provided in Linsley et al. (Citation1992) was adopted for the base material’s hydraulic conductivity (Linsley et al., Citation1992). The material parameters that used in the model are presented in (Bochnak & Saracco, Citation2020).
Table 1. List of material properties (Bochnak & Saracco, Citation2020).
Validation study
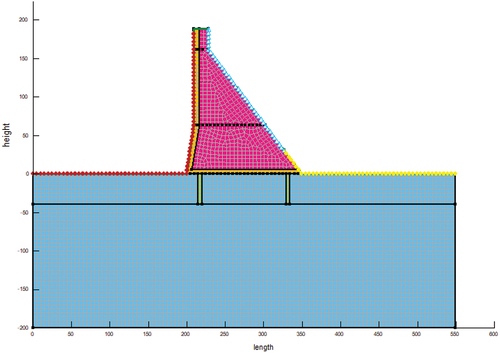
In Geo-studio software, SEEP/W is employed to perform analyses related to pore water pressure and seepage velocity. SEEP/W calculations are based on two-dimensional (2D) plane strain theory and Darcy law. The presumption was made that all materials display isotropic (Krahn, Citation2004). The upstream and tail water level is applied as hydrostatic pressure. The FEM of triangle and quads mesh was used to simulate the model. The approximate element size is 5 m. The applied loads in the FEM model are hydrostatic pressure at upstream in red, tail water in yellow, potential seepage face in blue as shown in .
The model was configured as Saturated/Unsaturated as the material water content is not known, and SEEP/W requires the specification of water content for modeling saturated materials. As an alternative, matric suction was set to nearly zero (0.001 kPa) for all materials, as this closely approximates saturated conditions (SoilSensor, Citation2018).
Because the dam site’s base material is primarily formed of a thick layer of limestone, the hydraulic conductivity value for limestone as published in Linsley et al. (Citation1992) was chosen as the foundation’s typical hydraulic conductivity (Linsley et al., Citation1992). The hydraulic conductivity values for both the concrete wall on the upstream face and the RCC were derived from empirical findings as documented in Mesic, Beal, and Heywood (Citation1994) (Mesic, Beal, & Heywood, Citation1994). The hydraulic conductivity values were determined using test results from a mixture containing regular Portland cement for the concrete and test results from a mixture containing both regular Portland cement and fly ash for the RCC. The hydraulic conductivity value for the grout curtain was adopted from Allan and Philippacopoulos (Citation1999), where it was determined for a grout mix based on cement (Allan & Philippacopoulos, Citation1999).
The upstream curtain must be situated 0.1 times the length of the dam base from the dam heel, according to Chinese Standard DL5108–1999, whereas the downstream curtain can be located flexibly. Additionally, the standard specifies that the upstream curtain should have a minimum length of 40 m and a thickness of 5 m. In , the curtains are situated 15 m away from both the dam’s heel and toe, and they conform to the standard with dimensions of 40 m in length and 5 m in thickness. The upstream border was established at 181.6 m for normal water levels and 186.7 m for critical water levels, while the tail water boundary level was set at 30.5 m.
Seepage analysis results (pore water pressure)
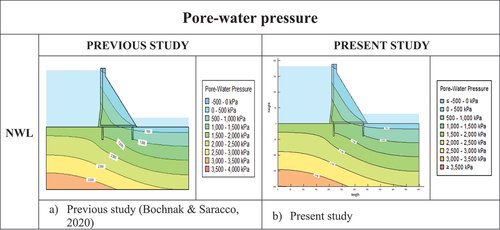
Longtan dam seepage analysis is done and calibrated from previous numerical work (Bochnak & Saracco, Citation2020). In the pore water pressure during NWL is presented. There was a great similarity in the results by comparing the pore water pressure results. On the right side of the color scale indicates the pressure corresponding to each contour. The pore-water pressure measures between 1,000 and 1,500 kPa beneath the dam’s foundation curtains.
Figure 4. Geometry of cross section (A-A) of longtan dam.
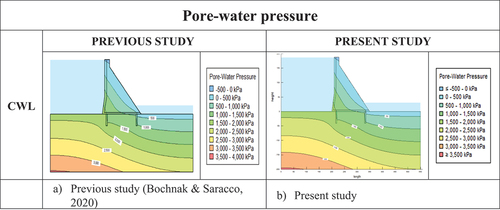
illustrates the pore-water pressure under CWL conditions. There was no significant difference in the results between the two cases. The pore-water pressure measures between 1,000 and 1,500 kPa beneath the dam’s foundation curtains. Between the curtains beneath the dam’s base, the pore-water pressure measures between 1,000 and 1,500 kPa.
Figure 5. Finite element mesh of longtan dam with geostudio.
Total head and flow net
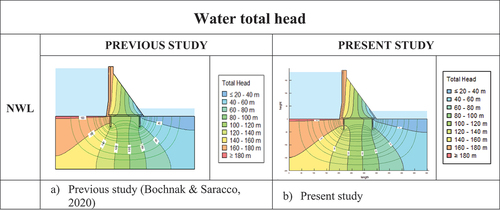
displays both the pressure head and the flow net under NWL (Normal Water Level) conditions. By studying flow lines that present in green lines and equipotential lines it is noted that the flow beneath the dam base is reduced duo to the presence of grout curtains. In , the color scale on the right indicates the total head corresponding to each color within the figure. The pressure head input is 181.6 meters under NWL (Normal Water Level) conditions upstream and 30.5 meters downstream under TWL (Tail Water Level) conditions.
Figure 6. The pore-water pressure during NWL condition.
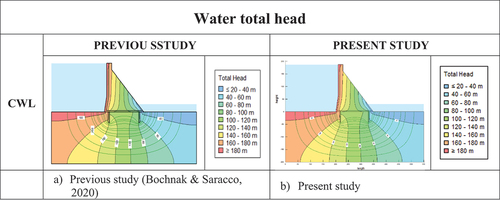
illustrates both the pressure head and the flow net under CWL conditions. The impact of the curtains becomes evident when examining the flow between the curtains alongside the equipotential lines representing the pressure head. One can notice that the existence of grout curtains results in a decrease in flow right under the base of the dam. Within , the color scale that display indicates the total head value corresponding to each color within the figure. Under CWL (critical water level) conditions, the pressure head measures 186.7 m upstream, and under TWL (tail water level) conditions, it measures 30.5 m downstream.
Figure 7. The pore-water pressure during CWL condition.
Seepage in Z-Y directions
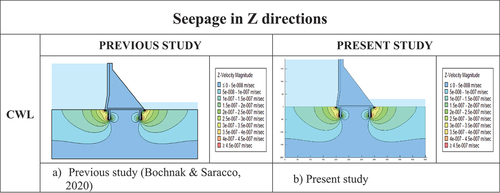
shows the Z-direction seepage velocity under NWL conditions. The color scale on the right side represents the velocity associated with each color in the figure. By comparing the outcomes with the prior outcomes, it is discovered that the peak velocity in Z-direction reach to 5* m/s which is concentrated at grout curtains that is the same in the present study when applying similar parameters and boundary conditions (Jauregui & Silva, Citation2011).
Figure 8. The total head and flow net during NWL condition.
depicts the Z-velocity magnitude under CWL conditions. Upon comparing these results with the previous findings, it is evident that the peak velocity in the Z-direction reaches 5* m/s and is concentrated around the grout curtains, which is consistent with the findings in the current study.
Figure 9. The total head and flow net (green lines) during CWL condition.
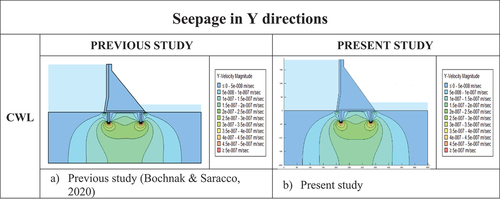
displays the magnitude of Y-velocity under NWL (Normal Water Level). Upon comparing the results, it is evident that they share the same value, with the peak velocity in the Y-direction reaching 4.5* meter/second, and this concentration occurs at the heel, toe, and curtains.
Figure 10. The seepage velocity in Y directions.
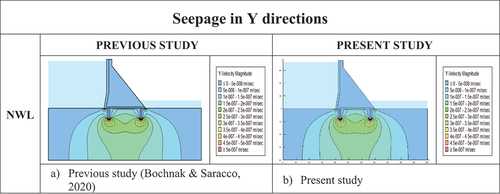
presents the Y-velocity magnitude under CWL conditions. Upon comparison, it becomes apparent that these results exhibit uniformity, with the peak velocity in the Y-direction consistently reaching 4.5* m/s, and this concentration is observed at the heel, toe, and curtains.
Figure 11. Y velocity magnitude.
Parametric study
Change in the rock foundation
Changes in the rock foundation material under a dam can have significant implications on dam safety and stability. The rock foundation provides the support and stability for the dam structure, and any alterations in its properties or behavior can potentially lead to dam failure or other serious issues. If there are changes in the permeability of the soil foundation, it can affect the seepage of water through the foundation. Excessive seepage can lead to internal erosion, where water creates channels and cracks within the stone mass, potentially compromising the dam’s integrity. Mudstone and limestone are common sedimentary rock types found in various parts of Egypt as shown in . These rocks have played significant roles in Egypt’s history, culture, and geology. In Egypt, mudstone is found in various geological formations (Shehata et al., Citation2021). One notable example is the “Mokattam Formation” a geological unit that consists of limestone and marl (a type of mudstone) (Jeans, Citation1978). The Mokattam formation is important because it houses the famous Moqattam Hills, which overlook Cairo. These hills are composed of limestone and mudstone layers (Davidovits et al., Citation2020). Certain regions of Egypt exhibit this type of soil formation, as seen in . In the present work, mudstone and sandstone are used beside the limestone in the geostudio model to show the changes that occurred.
Figure 12. The seepage velocity in Z directions.
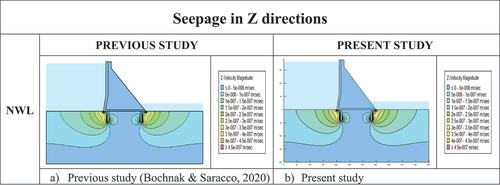
Figure 13. Z velocity magnitude.
changing in rock foundation conductivity
By taking the Hydraulic conductivity of mudstone 1.16* m/s,limestone 4.9e-7 and sandstone 1*
m/s in the Geostudio numerical model (El-Naqa, Citation2001; You et al., Citation2018). The pore water pressure at the line of intersection of the foundation and dam structure results in case of limestone and sandstone shows a sharp drop in value in certain spots. Differently, mudstone pore water pressure diagram shows approximately slight variation regard to the existence of grout curtains as described in . As shown the results of limestone and the sandstone are remarkably identical. This may explain why the hydraulic conductivity of mudstone 1.16e-11 m/s is almost null and close to curtain conductivity 1.6e-12 that is why it shows slight variation due to the presence of adapted curtains. However, the variation observed clearly in case of limestone and sandstone.
Figure 14. Soil formation in Egypt (Aly et al., Citation2014).
represents the water flow diagrams under the dam foundation in case of NWL with limestone, mudstone, and sandstone soil foundation, respectively. It shows that the flux is concentrated at the dam heel, toe, and two grout curtains. Changing the permeability of the soil foundation of a gravity dam can have significant effects on the water flux through the soil and, consequently, on the overall stability and performance of the dam. If the permeability of the soil foundation is increased, it allows water to flow more easily through the soil. This can result in a higher water flux or seepage through the foundation. This can lead to an increased rate of water flow into or through the stone foundation, which may cause undermining and piping. If the permeability of the soil foundation is decreased, it restricts the flow of water through the soil. This can lead to a lower water flux or seepage through the soil foundation. However, this situation can also case uplift pressure and saturation effects.
Figure 15. Mokattam formation geology (Elewa, Citation2004).
Degree of weathering
Certainly, the weathering of the stone foundation of a concrete gravity dam is an important aspect to consider for the stability and long-term performance of the dam structure. The soil foundation serves as the support system for the entire dam, and its deterioration due to weathering processes can have significant implications for the dam’s safety and structural integrity. Weathering of the rock foundation involves various natural and environmental factors that lead to changes in the physical, mechanical, and chemical properties of the underlying stone. Weathering can alter the physical properties of stone, making it more susceptible to erosion by seepage water. As soil particles become more dislodged or weakened due to weathering processes. Changes in stone permeability due to weathering can affect the velocity and pressure of seepage water (Jiang & Qiu, Citation2021).
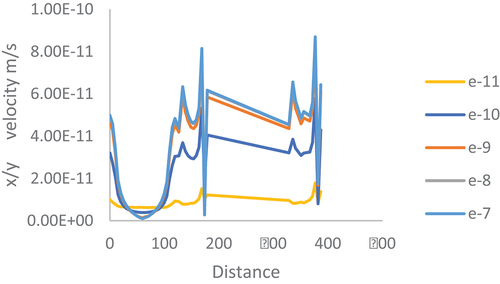
If seepage velocity increases due to altered permeability, it can enhance the transport of soil particles and contribute to internal erosion. When cracks and internal erosion increases in a dam’s rock foundation, it can lead to a series of detrimental consequences that pose significant risks to the overall stability and safety of the dam structure. Internal erosion, accompanied by an elevated water flux, signifies intensified internal erosion. This can lead to severe consequences for the dam’s stability and safety. Increased water flux can lead to the enlargement of seepage pathways and potentially create new exit points for the eroded weathered stone downstream of the dam. This can result in undermining and erosion at the exit point, increasing the risk of structural failure. shows the water flux of mudstone soil foundation during weathering simulation by increasing the hydraulic permeability by constant number from 1* m/s to 1*
m/s. As soil permeability gradually increases, we notice that the velocity graph lines begin to align with each other, leading to the phenomenon of piping, which can cause stone collapse.
Figure 16. Pore-water pressure along the dam base.
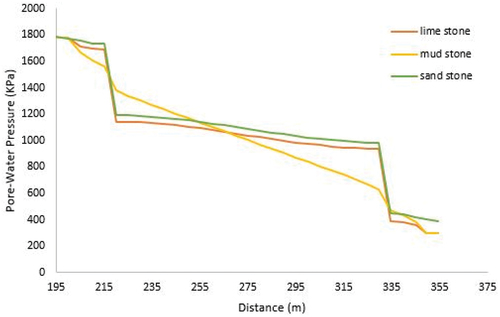
Figure 17. water flux through the soil dam foundation.
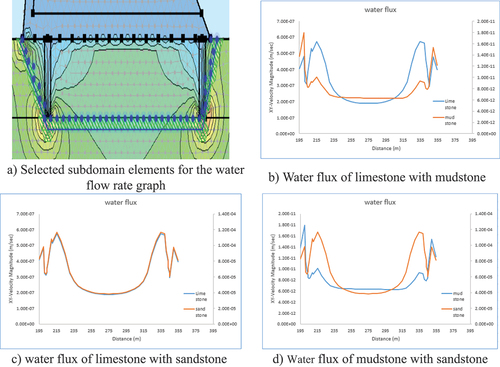
Figure 18. water flux through the soil dam foundation during weathering.
Conclusions
In this study, numerical analysis is done by using GEOSTUDIO (SEEP/W) program to Longtan dam in two cases at NWL and CWL. The seepage analysis is performed with change in rock foundation properties and weathering effect as a parametric study.
Based on the seepage results of non-overflow section of Longtan dam, there appear to be no notable threats to the dam’s stability arising from seepage. The outcomes reveal elevated seepage velocities close to the dam’s base and the grout curtains, while beneath the dam, the velocities are observed to be comparatively lower.
The parametric study has further illuminated the foundation’s response to different loading conditions and environmental factors. By exploring the impact of water flux, rock erosion, the study has shed light on the foundation’s ability to withstand these challenges and the potential vulnerabilities that may arise.
In summary, weathering can influence the potential for cracks and internal erosion through a dam’s stone foundation by altering erodibility, permeability, and flow pathways. Addressing these factors through careful material selection, design considerations, and appropriate engineering measures can help mitigate the risks associated with these phenomena and maintain the structural integrity of the dam. Addressing cracks and internal erosion through preventive measures, monitoring, and appropriate responses is essential to prevent catastrophic failures and ensure the integrity of the dam.
Ultimately, this parametric study serves as a valuable tool for dam engineers, providing insights into the behavior of a stone gravity dam foundation comprising limestone, mudstone, and gravel. The findings underscore the importance of considering the unique characteristics of each stone type in designing and managing dam structures. As a result, this study contributes to the broader body of knowledge concerning dam foundation behavior and offers guidance for ensuring the safety, stability, and longevity of such critical infrastructure projects.
Disclosure statement
No potential conflict of interest was reported by the author(s).
References
- ADC. (2015). Focus: Water – energy – food security nexus. 43(2009), 1–13. http://www.entwicklung.at/en/publications/strategies-for-implementing-and-focus-papers/
- Allan, M. L., & Philippacopoulos, A. J. (1999). Properties and performance of cement-based grout for geothermal heat pump applications. Washington, D.C. USA: United States Department of Energy.
- Aly, N., Gomez-Heras, M., Ahmed, A. H., Alvarez de Buergo, M., & Soliman, F. (2014). Describing differential decay in Mokattam formation limestone used in World Heritage Sites: the cases of the Great Sphinx–Giza and Historic Cairo, Egypt. In Egypt Proc. Int. Conf. Professionals’ Experiences in Cultural Heritage Conservation in America, Europe, and Asia YOCUCU (Agsu Azerbaijan).
- Barakat, S. A., Malkawi, A. I., & Omar, M. (2005). Parametric study using FEM for the stability of the RCC tannur dam. Geotechnical and Geological Engineering, 23(1), 61–78. doi:10.1007/s10706-003-4770-z
- Bochnak, P. L. A., & Saracco, M. E. C. (2020). Design of RCC gravity dam and FEM modelling in GeoStudio-Longtan dam. doi:10.13140/Tvvr20/5001
- Davidovits, J., & Dipayan, J. (2020). Giza pyramids and geopolymer limestone: Deep misleading analysis on the “lauer sample” by petrologists and geologists. A rebuttal of the articles published by Dipayan Jana and others. Archaeological Paper#L-Rebuttal-D Jana, May. doi:10.13140/RG.2.2.18423.04004
- Elewa, A. M. T. (2004). Quantitative analysis and palaeoecology of eocene ostracoda and benthonic foraminifera from Gebel Mokattam, Cairo, Egypt. Palaeogeography, Palaeoclimatology, Palaeoecology, 211(3–4), 309–323. doi:10.1016/J.PALAEO.2004.06.006
- El-Naqa, A. (2001). The hydraulic conductivity of the fractures intersecting cambrian sandstone rock masses, central Jordan. Environmental Geology, 40(8), 973–982. doi:10.1007/s002540100266
- ESDAC. (n.d). Geologic map of Egypt. - ESDAC - European commission. https://esdac.jrc.ec.europa.eu/content/geologic-map-egypt
- GIZ. (2016). Water, energy & food nexus in a nutshell. www.water-energy-food.org/fileadmin/%0Duser_upload/files/2016/documents/nexus-secretariat/nexus-dialogues/Water-Energy-Food_Nexus-DialogueProgramme_Phase1_2016-18.pdf
- Hällqvist, V., & Hy, H. (2016). Safety analysis of longtan high dam considering the construction process (pp. 100). UMEA university.
- Jauregui, R., & Silva, F. (2011). Numerical validation methods. Numerical Analysis—Theory and Application, 155–174.
- Jeans, V. C. (1978). The origin of the triassic clay assemblages of Europe with special reference to the Keuper Marl and Rhaetic of parts of England. Philosophical Transactions of the Royal Society of London. Series A, Mathematical and Physical Sciences, 289(1365), 549–636.
- Jiang, H., & Qiu, X. (2021). Performance assessment of a newly developed and highly stable grouting material for a completely weathered granite dam foundation. Construction and Building Materials, 299, 123956. doi:10.1016/j.conbuildmat.2021.123956
- Krahn, J. (2004). Seepage modeling with SEEP/W (seepage Mo, issue May). GEO-SLOPE International Ltd. http://www.geo-slope.com
- Linsley, R. K., Franzini, J. B., Freyberg, D., & Tchobanoglous, G. (1992). Water-resources engineering. New York: McGraw-Hill Inc.
- Mata, J., Tavares de Castro, A., & Sá da Costa, J. (2013). Time–frequency analysis for concrete dam safety control: Correlation between the daily variation of structural response and air temperature. Engineering Structures, 48, 658–665. doi:10.1016/J.ENGSTRUCT.2012.12.013
- Mesic, A., Beal, D., & Heywood, R. (1994). Measuring water permeability of concrete and its applications. Bridges-essential To Our Economy; Proceedings Of The Austroads Bridges Conference, February 16-18, 1994, Melbourne, Australia (Vol. 1, pp. AP 28/94).
- Novak, P., Moffat, A. I. B., Nalluri, C., & Narayanan, R. A. I. B. (2017). Hydraulic structures. CRC Press.
- Seid-Karbasi, M., & Byrne, P. M. (2004). Embankment dams and earthquakes. International Journal on Hydropower and Dams, 11(2), 96–102.
- Shehata, A. A., Kassem, A. A., Brooks, H. L., Zuchuat, V., & Radwan, A. E. (2021). Facies analysis and sequence-stratigraphic control on reservoir architecture: Example from mixed carbonate/siliciclastic sediments of raha formation, Gulf of Suez, Egypt. Marine and Petroleum Geology, 131, 105160. doi:10.1016/j.marpetgeo.2021.105160
- SoilSensor. (2018). Soil matric potential. https://soilsensor.com/articles/soilmatric-potential/(2019-10-21). https://soilsensor.com/articles/soil-matric-potential/
- Wei, Z., Xiaolin, C., Chuangbing, Z., & Xinghong, L. (2008). Failure analysis of high-concrete gravity dam based on strength reserve factor method. Computers and Geotechnics, 35(4), 627–636. doi:10.1016/j.compgeo.2007.10.005
- You, Y., Yan, C., Xu, B., Liu, S., & Che, C. (2018). Optimization of dewatering schemes for a deep foundation pit near the Yangtze river, China. Journal of Rock Mechanics and Geotechnical Engineering, 10(3), 555–566. doi:10.1016/j.jrmge.2018.02.002