
 ?Mathematical formulae have been encoded as MathML and are displayed in this HTML version using MathJax in order to improve their display. Uncheck the box to turn MathJax off. This feature requires Javascript. Click on a formula to zoom.
ABSTRACT
Groundwater is considered an important source of water supply in Iraq, but the poor quality of water makes it unsuitable for drinking purposes. To enhance the groundwater quality, River Bank Filtration (RBF) method was investigated. It is a natural process in which wells along a riverbank are pumped, causing some of the river water to flow toward these wells. With this technique, water coming from the river is filtrated by soil deposits and then mixed with groundwater, improving its quality. The purpose of this study is to evaluate the implementation of the RBF technique to improve the poor quality of groundwater and get potable water. A study area was selected in Al Hindiyah District within Kerbala City, Iraq. Four wells (W1, W2, W3, and W4) with different distances from the Euphrates River bank (450 m, 720 m, 800 m, and 1950 m), respectively, were selected to examine the groundwater quality. The results were then compared to those for the Euphrates River. In addition, two boreholes (B.H.1 and B.H.2) of about 15 m depth were drilled near the riverbank to assess the soil properties of the studied area. The results showed that the groundwater quality at a depth more than 12 m enhanced as the well’s distance from the river bank decreased and got closer to the river. It was found that the water quality at pumping wells (W1, W2, and W3) is slightly polluted, which makes this area more suitable for groundwater abstraction to provide the best water quality. The poorest water quality was for W4 at 1950 m from the riverbank, which indicates that at this distance the river bank filtration process is eliminated.
KEYWORDS:
Introduction
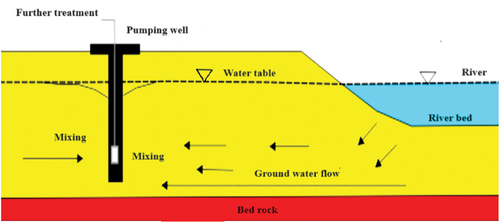
In developing countries, there is an increase in demand for drinking water, and water utilities are facing the difficulty of treating surface water that is often polluted (Alnasrawi et al., Citation2023). Furthermore, many cities in developing countries are investigating the feasibility of providing water supply networks for rural communities (Ray, Citation2008). Riverbank filtration is a natural process in which wells along a riverbank are pumped, causing some river water to flow toward them as illustrated in . This process is considered as a managed interaction between surface and groundwater in which surface water is induced into wells located along the banks of rivers. The subsurface movement of surface water through riverbed and aquifer material allows for a variety of natural treatment processes, such as: filtration, adsorption, biodegradation, and chemical precipitation that enhance water quality. Generally, groundwater wells located near a body of surface water (river or lake) can, over time, withdraw sufficient water from the flow system (Shamrukh, Citation2006). Among the primary benefits of RBF is its ability to reduce water treatment costs, with the exception of chlorination and other disinfectants. However, if the water obtained from RBF is further treated at an existing water treatment plant, the amount of chemicals required for coagulation and flocculation decreases (Ray et al., Citation2011). Because it is a natural process, bank filtration receives support from consumers who need safe, but not highly treated, drinking water supplies.
Figure 1. Cross sectional view for river bank filtration system (Mustafa et al., Citation2014).
Ground and surface water are strongly connected, representing part of the overall hydrological cycle. Given the monitoring difficulties, significant progress was made in recognizing the groundwater-surface water interaction. Most studies have explained and understood about spatial variability and temporal flux variation due to new techniques in use (Toran, Citation2019). Shallow groundwater levels are influenced by many factors, such as surface water level, cross-sectional depth in the river, high and low water-level cycles, local site topography, existing wastewater sources, year-on-year season, nature of land use and weather patterns of falling rain in the region (Al-Jabbari & Al-Enezy, Citation2014). The movement of groundwater through soil and sediments removes organic material, so it only requires disinfection unless it is extremely hard (Shamrukh, Citation2006; Sophocleous, Citation2002). The most factors that influence RBF performance are: aquifer thickness, hydraulic conductivity, flow velocity gradient, river discharge, and clogging of the riverbed (Gupta et al., Citation2015; Gutiérrez et al., Citation2017; Umar et al., Citation2017). The aquifer soil characteristics of a riverbank alluvial deposit are an important factor in determining the possibility of RBF investigation and application (Ibrahim et al., Citation2015). The quality of the filtrate water is the main issue in assessing of bank filtration adequacy in the drinking water treatment process (Derx et al., Citation2013; Holzbecher, Citation2006). The RBF technique provides multiple sustainability advantages over conventional treatment systems. This is because the RBF process uses natural filtration, requires less energy and resources, produces little to no chemical waste, has lower environmental impacts during construction and operation, and is more adaptable to changing water supply conditions as a result of climate change (Chen, Citation2001).
The principle of RBF started in the 1870s in Germany, and it has been a well-accepted technique for water production in Europe and the United States for many decades. Other countries like China, India, South Korea, Jordan, Egypt, and Malaysia have recently started implementing RBF for drinking water supply (Ray & Shamrukh, Citation2011; Umar et al., Citation2017).
Numerous studies have been conducted to evaluate the performance of RBF technology. Ghazali et al. (Citation2015) studied the effectiveness of RBF along the Langat River in Malaysia. They found that as river water flows through the aquifer, the majority of the turbidity and organic pollutants are removed by the bankside material and diluted with groundwater. The turbidity of the Langat River ranged from 52.1–62.3 NTU, with the Malaysian Drinking Water Standard value of 5 NTU. According to the results, RBF was capable of reducing turbidity from the range of (52.1 to 62.3) NTU in river water to (0.27 to 0.55) NTU in the test well. Additionally, there was a significant reduction in the concentration of total dissolved solids (TDS) from a range (149.5 to 137.2 mg/l) in the river water to a range of (43.6 to 83.9) mg/l in the test well. In Egypt, Ghodeif et al. (Citation2016) investigated the performance of the RBF technique at five sites along the Nile River and three sites along its main canals. The results indicated that Nile Valley has better hydrogeological conditions for applying RBF compared to the Nile Delta. Additionally, it was found that four RBF sites along the Nile River and two along the main canals have proven their ability to produce drinking water with more than 50% bank filtrate. On the other hand, two sites were found to have very low bank filtrate (less than 10%) due to their unsuitable hydrogeology conditions. At both failure sites, the filtration of surface water was limited by the existence of a clay layer with a low hydraulic conductivity under the riverbed, and the quality of pumped water from these sites was mainly groundwater. Zhu et al. (Citation2020) investigated the safety of riverbank filtration wells using field hydrogeological tests near Songhua River, China. They concluded that RBF can pre-treat river water for turbidity, trace organic substances, and major cations and anions (except for and
), with removal rates ranging from 29% to 95% for some water quality indicators. However, there was only a limited improvement in water quality for some inorganic contaminants (Fe, Mn, and
-N) because their background concentrations in groundwater were higher than in river water. In comparison to the river water, the quality of RBF well water was more stable, making it more favorable for the design of post-treatment processes and the long-term stable operation. Abd-Elaty et al. (Citation2021) developed numerical models to assess an existing RBF system on the Nile River in Embaba, Egypt, under different conditions. The RBF wells of the system was constructed by the Holding Company for Water and Wastewater (HCWW) in 2015 to increase the capacity of the Embaba drinking water treatment project near Giza. The site has a sand and gravel aquifer with a thickness of at least 50 m, making it suitable for RBF. The findings revealed that the optimal RBF operation requires a high water level in the river, high riverbed permeability, high aquifer hydraulic conductivity, and high abstraction rates. Furthermore, abstraction wells should be shallow and close to the river bank to reduce travel time, enhancing efficiency and decreasing high manganese concentrations in the pumped well. However, as long as there is hydraulic connection between the upper sand layer of aquifer and river, increasing the thickness of the clay cap has less effect on RBF than on travel times.
In Iraq, groundwater is considered a good source for water supply, but its poor quality makes it unsuitable for drinking purposes and other human uses. However, the good physical and chemical water quality of the Euphrates River makes it a suitable source for RBF. Therefore, river water can be exploited to improve groundwater quality. Additionally, the alluvial aquifer in the study area is hydraulically connected to the Euphrates River; therefore, it is a preferred site to apply the river bank filtration principle. Furthermore, because this aquifer is relatively shallow and close to customers, it enhances the water supply potential of the area. This sustainable method of providing portable water improves the environment. According to our current knowledge, this work is considered the first attempt to evaluate the RBF technique for the Euphrates River within Kerbala City, Iraq, using field data and laboratory tests. In this pilot experimental study, various distances from the river to the wells were selected to assess the impact of RBF on water abstraction in an alluvial deposit.
Methodology
The study area
In West Kerbala, Iraq, the quality of the groundwater is unsuitable for drinking purposes. To signify the applicability of RBF in the water supply scheme in the Euphrates portion of West Kerbala, a pilot study site evaluation is needed to get the required data. The studied site is located in Al-Hindiyah district (about 30 km from the center of Karbala) and along the Euphrates River. Al-Hindiyah is located in the middle of Iraq on the Euphrates River. It is surrounded by Karbala City from the west, Babylon from the east, Saddat Al-Hindiyah from the north, and Al-Haidariyah from the south. The study area is a portion of an alluvial plain, and is part of the Karbala-Najaf plateau. The water quality evaluation was based on the analysis of water samples taken from four wells (W1, W2, W3, and W4). These wells were drilled by the General Commission of Groundwater in Kerbala-Iraq. To identify the applicability of river bank filtration, a detailed soil site investigation of the targeted location is necessary. Two boreholes on the riverbank were drilled (BH1, and BH2). The land use for the study area is cultivated, and there are no industrial, commercial, or residential activities. Land cover includes orchards, farms, and waterbody (the Euphrates River and its canals). The study area location in relative to Iraq and wells site locations is illustrated in . presents detailed information about the wells and boreholes.
Figure 2. Locations of wells and bore holes in the study area.
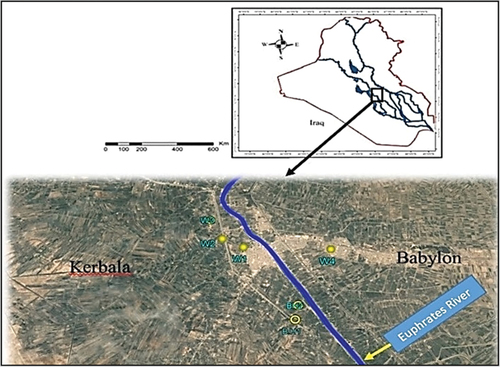
Table 1. Detailed information of the wells and boreholes.
Soil tests
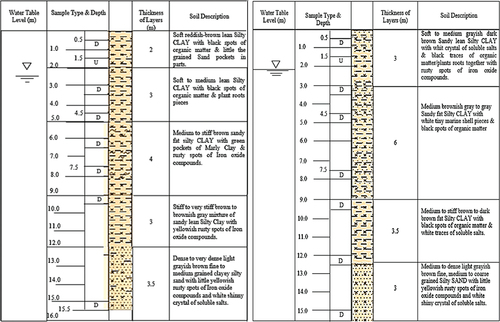
It is believed that the soil properties relate significantly to site suitability for the application of the RBF technique (Ghazali et al., Citation2016). Samples of soil were collected from two boreholes that were drilled near the Euphrates River bank to inspect the soil characteristics of Al Hindiya riverbanks. The maximum depth of both boreholes was about 15 m. shows a schematic for borehole logs that illustrates the composition of the soil strata. Soil samples were tested in the soil laboratory at the College of Engineering, University of Kerbala. The tests included sieve analysis, hydrometer tests, Atterberg limits, and permeability tests.
Figure 3. Schematic borehole logs for B.H.1 and B.H.2.
Sieve analysis and hydrometer test
This test was performed to determine the percentage of different grain sizes contained within the soil samples. In this work, particle size analysis was performed according to ASTM D-422 - Standard Test Method for Particle -Size Analysis of Soils. This test was performed by washing 500 g of oven-dried sample on sieve no. 200 (0.075 mm). The soil retained on this sieve was dried and weighed again, then passed through a set of sieves (openings 10 mm−0.075 mm) by using a sieve shaker for 10–15 min.
The weight of the retained soil on each sieve was recorded to get the percent finer of each diameter then draw the particle size distribution curve of the soil sample. A hydrometer test is used to obtain the particle size distribution of soil smaller than 0.075 mm. The soil passed through sieve #200 by washing, was dried in an oven, then a specimen of 50 g was taken for the hydrometer test. This specimen was treated by adding 125 ml of a dispersing agent with a concentration of 4% and left for 24 h. The mixture was then transferred to a graduated cylinder, called a sedimentation jar, after being mixed by high-speed stirrer for 3 to 5 min and filled with distilled water until it reached 1000 cc. A hydrometer of type 151 H was used in these tests to measure the weight of suspended soil particles. The test was conducted according to ASTM D7928.
Permeability test
Soil permeability is considered a measure of the soil’s ability to let water flow through its porous. Thus, it is an important parameter to measure the hydraulic conductivity of soil layers to predict the time needed for water to travel through the soil. In this study, falling head permeability test was conducted for the top layers of soil (from a depth 0.5–12.5 m). The constant head permeability test was performed for grained soils (depth under 12.5 m) to compute the hydraulic conductivity of the soil layers. The tests were performed according to American specifications, ASTM D 2434.
Atterberg limits
Liquid limit, plastic limit, and plasticity index were tested for clayey and silty soils for depths 0.5 m−12 m to investigate soil characteristics that represent the soil consistency of the alluvium riverbank soil. The test was run according to the American specifications ASTM D 4318.
specific gravity
To perform a grain size distribution test, it is required to measure the specific gravity of soil particles (Gs). Specific gravity is the ratio of the mass of unit volume of soil at a stated temperature to the mass of the same volume of gas-free distilled water at a stated temperature. The test was performed according to American specifications, ASTM D 854–00.
Water quality
Water Quality Index (WQI) is a mechanism for integrating multiple water quality parameters into a single accumulative value, which expresses a certain level of water quality. It is an understandable arithmetical indicator to simplify the state of water quality. Thus, water samples were collected from both the Euphrates River and pumping wells (W1, W2, W3, and W4), and tested according to the following parameters: pH, EC, TDS, ,
,
, and
.
Where: pH is a measure of the basicity or acidity of water sample; Ec is the electrical conductivity (μS/cm); TDS is the total dissolved solids (mg/l), and
are Calcium, Sodium, Magnesium, and Potassium cations (mg/l), respectively, and
,
are Chloride and Sulfate anions (mg/l), respectively.
To determine the wells and river water quality index, the method that was developed by the Ministry of Nature and Environment of Mongolia was adopted (Altansukh & Davaa, Citation2011). In this method, the number of parameters has been taken into account, and all the parameters have the same weight. This method computes WQI by summing the average quality rating, as shown in EquationEquation (1)(1)
(1) :
Where, is the concentration of the studied parameter,
represents the permissible level of
parameter, and
is the number of parameters. In this study, the standards of the World Health Organization (WHO) for drinking water were adopted. According to the Mongolia method, water quality is classified into six classes as listed in . In this classification, very clean quality is suitable for all types of water usage and no treatment is necessary, whereas clean quality can be used for drinking and food production after treatment.
Table 2. Classes of water quality index by Mongolia method.
Results and discussion
Results of soil characteristics
The obtained results for sieve and hydrometer analysis were expressed in terms of particle diameter and percent finer (%). show the soil’s particle size distribution curves at different depths for both B.H.1 and B.H.2, respectively. These figures give an indication of the type of soil and its gradation. The soil was classified according to the Unified Soil Classification System (USCS). The results of the river bank region showed that the soil from depth 0.5 m up to 12.5 m is low to high plasticity silty clay with a small portion of sand, while a soil beneath 12.5 m is poorly graded sand with some silty materials. explain in detail soil characteristics and soil classification, respectively.
Figure 4. Particle size distribution of soil for B.H 1.
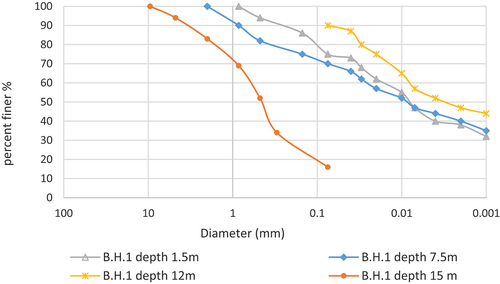
Figure 5. Particle size distribution of soil for B.H 2.
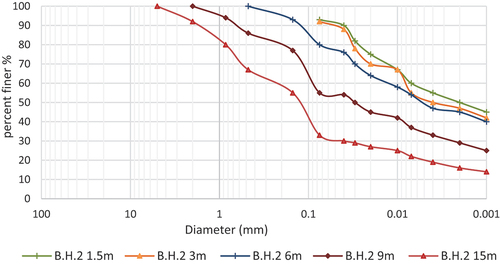
Table 3. Soil characteristics for B.H.1 and B.H.2.
Table 4. Soil classification for B.H.1 and B.H.2.
The soil characteristics shown in indicate that the soil deposits up to 12.5 m deep are alluvial with high plasticity. Furthermore, the permeability coefficient results show low values (about m/sec), indicating that this strata is mostly fine with low permeability. On the other hand, the soil deposits at depths below 12.5 are sandy, with a permeability coefficient value of about (
to
) m/sec. The data show that soil deposits below 12 m are composed of coarse materials with high permeability, acting as a filter for water flowing from the river toward the well. Thus, pumping wells should be deeper than 12 m to extract groundwater mixed with river water after filtration.
Results of water quality
The following parameters were considered for evaluating water quality index in the RBF process: pH, EC, TDS, ,
,
, and
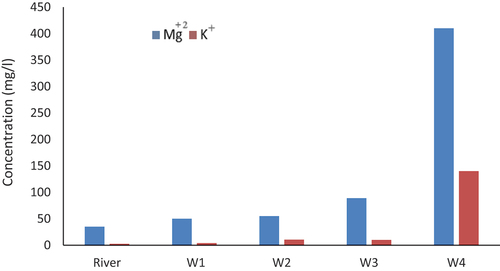
. These parameters were measured for water samples collected from the Euphrates River and four pumped wells located at various distances from the riverbank. illustrate the results of water quality parameters obtained from water analysis. The pH values for pumped well samples are nearly equivalent, ranging from 7.1 to 7.6, which are within the WHO recommended limit for drinking water (6.5–8.5). As shown in , the values of TDS range from 700 to 1900 mg/l in W1, W2, and W3, while these values become very high (more than 10,000 mg/l) in W4, which is located at a distance of 1950 m from the riverbank. illustrate the concentrations of
,
,
, and
. These figures clearly show that the farther the pumping wells are from the river bank, the higher the concentrations of these parameters in the water samples. Compared to W1, concentration of
,
,
, and
increased in W4 by about 430%, 650%, 370%, 420%, 720%, and 3000%, respectively.
Figure 6. pH values for pumped wells.
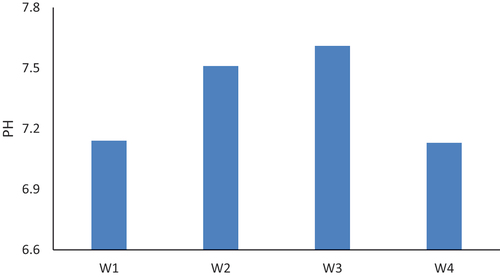
Figure 7. TDS and EC for Euphrates River and pumped wells.
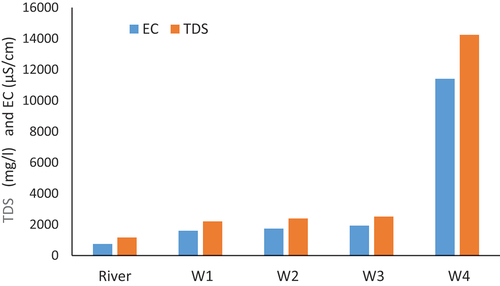
Figure 8. Concentrations of ,
,
for Euphrates River and pumped wells.
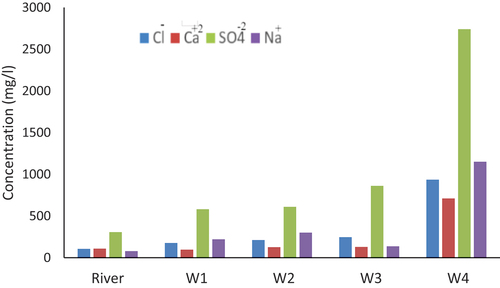
Figure 9. Concentrations of , and
for Euphrates River and pumped wells.
The Mongolia Water Quality Index (MWQI) for drinking purposes was developed based on various physiochemical parameters for the studied area of the Euphrates River and well sites. As listed in , the results of the MWQI method ranked the water quality of wells (W1, W2, and W3) within class III with slightly polluted water quality. On the other hand, the water quality of the well (W4) is classified in class VI, which is characterized as heavily polluted.
Table 5. Results of water quality by (MWQI) method.
clearly shows that the groundwater quality at W4 (at a distance of 1950 m from the river bank) is very poor and highly polluted. However, groundwater quality is enhanced as the distance from the river bank decreases. The water quality index according to the Mongolia method categorized the pumped water from W1, W2, and W3 as class III (slightly polluted), which indicates that there is a significant reduction in groundwater impurities as the distance gets closer to the river. So, it can be concluded that the water abstracted near the river bank (up to a distance of 800 m) is a mixture of river water and groundwater. As water flows from the river bed toward pumping wells, soil strata at depths below 12 m help to filtrate water and enhance groundwater quality. The hydrological cross section of the studied area showed that the depth of the pumping wells ranged from 12 to 13 m, and the dynamic water depth of the wells was about 10 m, while the average flow depth of the Euphrates River in that area is about 7 m. Thus, the bed level of the river is higher than the bed of the wells, so the seepage through the soil was from the river toward the wells due to the head difference. The flow of river water through the soil may improve water quality, based on the concept of river bank filtration. As a result, the concentration of pollutants in well water is reduced.
According to Ray et al. (Citation2002), typically, more time is required to benefit from the RBF technique when the well is located far from the river. Natural filtration wells should be dug at a site in such a way that the filtered water takes at least 50 days to reach the wells.
Conclusion and recommendations
This research investigated the applicability of implementing the RBF technique to improve the poor quality of groundwater in the studied area. To obtain the optimal distance for RBF along the Euphrates River, water quality was analyzed for four wells located at different distances from the river bank. In addition, two boreholes were drilled to determine the aquifer properties.
The results of the soil investigations in the studied area indicated that the soil at depths of 12.5 m and below is mostly sandy deposit with a high permeability. The results of river and groundwater analysis showed that there is a significant enhancement in groundwater quality as the well gets closer to the river, up to 800 m from the riverbank. Therefore, it can be concluded that abstracting water from wells near the river at depths greater than 12 m can induce a portion of river water to flow toward the wells. The water seepage direction is from the river bed toward pumping wells because of the head difference. Therefore, through this flow, water is infiltrated by soil deposits (the RBF process) and then mixed with groundwater, resulting in an improvement in groundwater quality. Therefore, the water quality is enhanced from heavily polluted (W4) to slightly polluted (W1, W2, and W3), which indicates that it needs just simple treatment for drinking purposes.
From this study, it is recommended that:
investigate the water quality at pumping wells at distances between (800 m and 1950 m) and compare them to the river water quality to get the exact distance from the riverbank where the filtration process is eliminated.
The abstraction well depth should be as deep as possible (deeper than 12.5 m) to benefit from the permeable soil deposit that infiltrates the water, thus improving its quality.
Acknowledgments
We would like to express our deepest gratitude and thanks to the Water Resources Directorate/General Commission of Groundwater in Karbala. We would also like to take the opportunity to express our special thanks to Dr Muthanna Mahmood Al-Shammari for providing the data.
Disclosure statement
No potential conflict of interest was reported by the author(s).
References
- Abd-Elaty, I., Saleh, O. K., Ghanayem, H. M., Grischek, T., & Zelenakova, M. (2021). Assessment of hydrological, geohydraulic and operational conditions at a riverbank filtration site at Embaba, Cairo using flow and transport modeling. Journal of Hydrology: Regional Studies, 37(8), 100900.. https://doi.org/10.1016/j.ejrh.2021.100900
- Al-Jabbari, M. H. A., & Al-Enezy, A. W. A. R. (2014). Surface and shallow groundwater inter-relationships within Eastern side of Shatt Al-Hilla, Babylon governorate, Iraq. Journal of University of Babylon, 22(2), 789–802.
- Alnasrawi, F. A. M., Kareem, S. L., & Mohammed Saleh, L. A. (2023). Adsorption of methylene blue from aqueous solution using different types of activated carbon. Journal of Applied Water Engineering and Research, 11(3), 370–380. https://doi.org/10.1080/23249676.2022.2120918
- Altansukh, O., & Davaa, G. (2011). Application of index analysis to evaluate the water quality of the Tuul River in Mongolia. Journal of Water Resource and Protection, 03(6), 398–414. https://doi.org/10.4236/jwarp.2011.36050
- Chen, X. (2001). Migration of induced-infiltrated stream water into nearby aquifers due to seasonal ground water withdrawal. Ground Water, 39(5), 721–729. https://doi.org/10.1111/j.1745-6584.2001.tb02362.x
- Derx, J., Blaschke, A. P., Farnleitner, A. H., Pang, L., Blöschl, G., & Schijven, J. F. (2013). Effects of fluctuations in river water level on virus removal by bank filtration and aquifer passage - a scenario analysis. Journal of Contaminant Hydrology, 147, 34–44. https://doi.org/10.1016/j.jconhyd.2013.01.001
- Ghazali, M. F., Adlan, M. N., & Abd Rashid, N. A. (2015). Riverbank filtration: Evaluation of hydraulic properties and riverbank filtered water at Jenderam Hilir, Selangor. Jurnal Teknologi, 74(11). https://doi.org/10.11113/jt.v74.4857
- Ghazali, M. F., Adlan, M. N., Shamsuddin, K. N., & Roslan, M. H. (2016). Alluvial soil characteristics and properties for riverbank filtration at Sungai Kerian, Lubuk Buntar, Kedah, Malaysia. International Journal of Scientific Research in Knowledge, 4(16), 11–20.
- Ghodeif, K., Grischek, T., Bartak, R., Wahaab, R., & Herlitzius, J. (2016). Potential of river bank filtration (RBF) in Egypt. Environmental Earth Sciences, 75(8), 1–13.. https://doi.org/10.1007/s12665-016-5454-3
- Gupta, A., Ronghang, M., Kumar, P., Mehrotra, I., Kumar, S., Grischek, T., Sandhu, C., & Knoeller, K. (2015). Nitrate contamination of riverbank filtrate at Srinagar, Uttarakhand, India: A case of geogenic mineralization. Journal of Hydrology, 531, 626–637. https://doi.org/10.1016/j.jhydrol.2015.10.065
- Gutiérrez, J. P., Van Halem, D., & Rietveld, L. (2017). Riverbank filtration for the treatment of highly turbid Colombian rivers. Drinking Water Engineering and Science, 10(1), 13–26. https://doi.org/10.5194/dwes-10-13-2017
- Holzbecher, E. (2006). Calculating the effect of natural attenuation during bank filtration. Computers & Geosciences, 32(9), 1451–1460. https://doi.org/10.1016/j.cageo.2006.01.009
- Ibrahim, N., Aziz, H. A., & Yusoff, M. S. (2015). Heavy metals concentration in river and pumping well water for river bank filtration (RBF) system: Case study in sungai kerian. Jurnal Teknologi, 74(11), 59–67. https://doi.org/10.11113/jt.v74.4861
- Mustafa, S., Bahar, A., Aziz, Z. A., & Suratman, S. (2014). Review of the role of analytical modelling methods in riverbank filtration system. Jurnal Teknologi, 71(1), 59–69. https://doi.org/10.11113/jt.v71.3055
- Ray, C. (2008). Worldwide potential of riverbank filtration. Clean Technologies and Environmental Policy, 10(3), 223–225. https://doi.org/10.1007/s10098-008-0164-5
- Ray, C., Jasperse, J., & Grischek, T. (2011). Bank filtration as natural filtration. Drinking Water Treatment, Strategies for Sustainability, Springer. https://doi.org/10.1007/978-94-007-1104-4_5
- Ray, C., Melin, G., & Linsky, R. B. (2002). Riverbank filtration: Improving source-water quality (43rd ed.). Springer Science & Business Media. https://doi.org/10.1007/0-306-48154-5
- Ray, C., & Shamrukh, M. (2011). Riverbank filtration for water security in desert countries. In NATO Science for Peace and Security Series-C: Environmental Security. Springer. https://doi.org/10.1007/978-94-007-0026-0
- Shamrukh, M. (2006). Assessment of river bank filtration for potable water supply in Upper Egypt. Journal of Engineering Sciences, 34(4), 1175–1184. https://doi.org/10.21608/jesaun.2006.110779
- Sophocleous, M. (2002). Interactions between groundwater and surface water: The state of the science. Hydrogeology Journal, 10(1), 52–67. https://doi.org/10.1007/s10040-001-0170-8
- Toran, L. (2019). Groundwater–surface water interaction. Encyclopedia of Water: Science, Technology, and Society, 1–12. https://doi.org/10.1002/9781119300762.wsts0027
- Umar, D. A., Ramli, M. F., Aris, A. Z., Sulaiman, W. N. A., Kura, N. U., & Tukur, A. I. (2017). An overview assessment of the effectiveness and global popularity of some methods used in measuring riverbank filtration. Journal of Hydrology, 550, 497–515. https://doi.org/10.1016/j.jhydrol.2017.05.021
- Zhu, Y., Zhai, Y., Teng, Y., Wang, G., Du, Q., Wang, J., & Yang, G. (2020). Water supply safety of riverbank filtration wells under the impact of surface water-groundwater interaction: Evidence from long-term field pumping tests. Science of the Total Environment, 711(1), 135141. https://doi.org/10.1016/j.scitotenv.2019.135141