
ABSTRACT
This overview paper summarises the ‘state of the art and of the science’ of eye-tracking, and its applications in map use research. Cartographic research is introduced, and its contemporary direction, which indicates that the main areas of such research are now focussed on human beings and their interaction with maps and geospatial displays, is stressed. A brief outline of several different methodologies for map use research is presented: observation, thinking loud, keyboard analysis, eye-tracking, and questionnaires. The role of eye-tracking as a major methodology for use, user, and usability investigation is explored; along with the possible choices for the researcher in the important areas of participant selection, eye-tracking equipment, set-up and use of the testing environment, and analysis of output data. Typical outcomes from eye tracking research are considered, with an assessment of its value in cartographic research in general. Future directions are suggested, along with the need for cartography to promote the valuable work done by researchers using eye-tracking for map use studies to the wider human-computer interaction community, expanding the scope of the geospatial-based stimuli in such experiments beyond maps, making use of the significant expertise and enthusiasm of cartographic researchers.
ABSTRAITE
Cet article de synthèse résume l'état de l'art et des connaissances sur le suivi oculaire et ses applications dans les recherches sur l'utilisation de carte. Nous présentons les recherches cartographiques et leurs directions actuelles, qui soulignent que les principaux domaines de recherche sont maintenant centrés sur les humains et leurs interactions avec les cartes et les représentations géospatiales. Un résumé bref de plusieurs méthodologies des recherches sur l'utilisation de carte est présenté : l'observation, la pensée à haute voix, l'analyse du clavier, l'analyse oculaire, et les questionnaires. Nous explorons le rôle de l'analyse oculaire comme méthodologie majeure pour les recherches sur l'utilisation, l'utilisateur et l'utilisabilité, ainsi que les choix possibles pour le chercheur sur les sujets importants de la sélection des participants, des équipements de suivi oculaire, de la mise au point et de l'utilisation de l'environnement de test et de l'analyse des données en sortie. Les résultats classiques des recherches en suivi oculaire sont examinés avec une vérification de leur valeur dans la recherche en cartographie en général. Des pistes de recherche sont suggérées, ainsi que la nécessité pour la cartographie de promouvoir le travail de qualité effectué par les chercheurs qui utilisent le suivi oculaire pour les recherches sur l'utilisation des cartes auprès de la communauté plus large qui travaille sur les interactions hommes-machines, élargissant ainsi la portée des stimuli sur le géospatial de ces expérimentations au-delà des cartes, s'appuyant sur l'importante expertise et l'enthousiasme des chercheurs en cartographie.
KEYWORDS:
1. Introduction
Research is an integral part of the development and promulgation of a discipline. Those practitioners and aficionados in any field of human endeavour who cultivate curiosity, enquiry and innovation, will be drawn to the investigation of the nature of the subject, determined to understand how the discipline works, how its practices can be improved, and how it contributes to human and physical realms. Cartography, as a discipline, has a wide scope, with varying practices, approaches, outcomes, effects and reactions. There is, therefore, a large number of potential research avenues to explore: research in cartography has a long and valid history, and an intriguing and valuable future. The aim of this paper is to provide an overview of one particular research methodology – the employment of eye-tracking techniques to examine how users interact with maps – and to place such methods within the overall context of cartographic research and its development in the past century.
1.1. The development of cartographic research
Defined as the study of maps and mapping (Fairbairn et al., Citation2021), cartography has been the focus of researcher-led investigation for over a century (although as a human activity, mapmaking has been practised for millennia). As the pioneering promoter of a scientific approach to the study of cartography, Eckert (Citation1907) suggested that there is a theoretical basis to the practice of cartography. As pointed out by Pápay (Citation2017), he was writing long before notions of aspects such as information theory, communication theory, and the theory of graphic variables were developed. Even so, the scientific approach to the interaction between mappable concepts/data, and the human practitioner, both the initiator and consumer of a map, was deemed worthy of study over 100 years ago. Since then, research in cartography has addressed technical issues such as improving map production flowlines, concepts of structuring and optimising the use of geospatial data in map and in database formats, relationships with other disciplines and human activities, and numerous aspects based on the application of mapping practices. But, in addition, the interaction between the map user and the map itself has been a logical prime area of interest and research focus for over 70 years since the publication of Robinson’s The Look of Maps (Citation1952).
1.2. Human aspects of research and map use investigation
Contemporary research in cartography addresses that human angle to a greater degree than at any previous time – as technical issues and geospatial data handling operations have been progressively and appropriately tackled by cartographic researchers throughout the twentieth century, it is timely that human-oriented research questions and activity now dominate research activity. The current focus of much cartographic research is on the interface between map user and map, examining the way in which human behaviour, map artefact design and creation, and uses of maps in an enormous range of human endeavours, can be directed, optimised, and evaluated.
The ways in which human beings interact with their environment and with objects in the environment are numerous and worthy of investigation. Disciplines ranging from ergonomics and behavioural psychology, to operational research and product design, have adapted studies of human beings in the context of investigations of users, uses and usability of artefacts, systems, and events. In cartography, research has been long-established into the users of maps and images, the uses to which such maps and images are applied, and the nature of the maps and images which allow for effective engagement with them.
Empirical evidence of how humans engage with maps and images can be obtained from such research, but although the focus of such research methods in use, user and usability investigation are the human and the social contexts, this form of cartographic testing has developed within the dominant paradigm of scientific research. Thus, inductive research approaches might suggest that we could sample a large number of map users, assess their interaction whilst they view particular maps or types of map, and derive some common, general conclusion (e.g. ‘text presented in sans serif typefaces on maps takes longer to read than that shown with serif typefaces’). By contrast, deductive approaches to research attempt to prove connections, causation, or general principles, by looking at case studies or by proposing relationships for testing (e.g. ‘what is the correlation between search time for a feature and number of visible layers on a map?’).
1.3. Purpose of map use research
In their comprehensive overview of such types of cartographic research, van Elzakker and Ooms (Citation2017) emphasise the importance of ‘scientific methods and techniques for user-centred design and evaluation’, which are regarded as the foundation for developing ‘usable cartographic products’, surely the aim of all cartographic activity. Such research can vary from basic understanding of map design – for example, Morita (Citation1987) assesses the relevance of Bertin’s visual variables in map symbology design, using eye-tracking techniques – to more complex considerations of design of user interfaces on small-screen displays of mobile devices (Medyńska-Gulij et al., Citation2022). van Elzakker and Ooms observe that there is an enormous range of such methods and techniques, eventually concluding that it is through a judicious combination of such research procedures that understanding of the central role of the human being in cartography will be gained.
It is suggested that cartographic user research can focus either on the usability aspects of particular products and displays, or on the perceptual and cognitive issues which pertain to the human user. Bleisch (Citation2011) presents these, respectively, as in vivo research which focuses on the ‘evaluation of specific applications through case studies, with a tendency to employ qualitative research methods’ (Ooms, Citation2016); and in vitro approaches which use quantitative research methods to undertake designed experiments whose outputs are statistically analysed. In fact, such a distinction is not always clear, and Ooms’ conclusion is that there is no prescriptive method for undertaking successful map use research, and that researchers should, in fact, make use of the wide array of techniques and approaches available. The examination of interactions, interactivity, reactions, opinions, effectiveness, efficiency, and several other aspects of cartographic user research, should be comprehensive in order to determine the meaning and impact of such research.
2. Methods of undertaking map-use research in cartography
As with any study of human activity and behaviour, and interaction between humans and their environment or artefacts and objects, there are significant difficulties in establishing a framework or protocol for any map use research. When the object (in this case, the map) exhibits variability itself, it is not easy to generalise human-object interaction behaviour. The human subject also exhibits widespread variation in characteristics, abilities, and intentions, added to which is the subconscious nature of much human-map interaction. Control over those variables tested or accounted for, whether on the map or pertaining to the human, can also be problematic when developing research testing. However, it is important that such testing is done realistically, in order to derive valuable and applicable outcomes. Scientific research attempts to develop general theories and concepts which are applicable to every situation, and repeated testing and multiple subjects are required: these can also be difficult to arrange.
2.1. Methodologies for assessing user experience
It is important to note, therefore, that user-oriented research can be undertaken in a variety of different ways, using differing technologies, often with varying products (Roth et al., Citation2017). As with all research methodologies, a range of choices are available to the researcher, and often alternative, or possibly multiply simultaneous, methodologies can be applied to the same research task.
The range of methodologies employed for user experience research has developed since early days of user observation and user questioning (Johnson & Onwuegbuzie, Citation2004). Initially, such methods were traditionally analogue, involving filling in observation forms or manually recording people’s comments as maps were being used. The utilisation of recording technology was a major advance, allowing for map users to speak their synchronous comments into a tape recorder, or video-recording the interaction between user and map. The developing digital nature of the map itself extended the monitoring of interaction further, with the ability to sample data contributed through keyboard presses, mouse movements and records of operations such as switching on and off layers, or panning and zooming. Further and more complex technologies which have been successively applied to user research include those which monitor eye movements, and brain-signal sampling instrumentation.
The several different methods available for examining map use vary in suitability, dependent on the map users themselves, the type of map product being engaged with, the resources and environment available for the investigation, and the methods chosen for data analysis. In cartographic research, the user could be an individual, or a collective group; they will have varying levels of expertise, interest, experience, and purpose in engaging with a map; their situation and focus (or lack thereof) can be highly variable; even their attitudes to the tasks of participating in a research study will not be uniform. The product itself being tested can vary significantly: a hard-copy paper map, a static image on a digital screen, an interactive map which allows for user modification or querying, a dynamic map loaded onto a mobile device, a projected image presented as part of an augmented- or virtual-reality scene.
It is possible to envisage the environment within which map use research is carried out as being at some distance from the researcher. ‘Unmoderated’ map use research involves no supervision of the actions undertaken by the user: thus, studies embedded in a stand-alone web page can still record valuable results, and there may even be set-ups whereby the user may be unaware that reactions and responses are being studied and recorded (Hertzum et al., Citation2015; Kettunen & Oksanen, Citation2018). However, most map use research studies have taken place using moderated methods, which themselves fall into a number of discrete categories.
Several methods for investigating how a single recipient/viewer/user or group interacts and uses a map can be identified, including observation, thinking aloud, keyboard analysis, eye-tracking, and questionnaires. These long-standing and widely used methods can be enhanced by other technologies e.g. contemporary developments in brain-scanning using EEG (Qin & Huang, Citation2022), as well as qualitative approaches typified by social researchers’ e.g. increasing use of focus groups (Cyr, Citation2019). The choice of method(s) and experimental design can significantly affect the interpretation and subsequently the results of a study, so it is important to consider the choices available in adopting one, or a combination, of such methods (Baxter et al., Citation2015; Ooms et al., Citation2012).
Observation can be regarded as a qualitative research method: a participant is given a task, and this is watched, witnessed, and reported on by the researcher. The users can be watched live, through a closed-circuit television facility, and/or recorded after the study has commenced. This is a low-cost method that requires little or no processing software. The purpose of such observation is to gather more reliable insight, in terms of what the participants do with the stimuli, compared to asking them to report on what they themselves think they are doing (Slocum et al., Citation2001). Observations can take place in natural and familiar environments with little discernible interference by the observer, resulting in the participant feeling at ease and acting ‘normally’ as they would if they were not being observed (Popelka et al., Citation2012). Data collected from observation includes simple details on a participant’s actions, such as whether they used certain tools and resources available to them. The end results are likely to offer a general overview with little chance of detailed analysis of specific actions and explanations.
Thinking aloud is a method of map use testing that was very popular in the 1990s; it works by the participants voicing their thoughts while considering a given problem. These responses are logged, transcribed, and then segmented and coded by two individuals working independently (Ericsson & Simon, Citation1993). The responses can be gathered in real-time, or post-hoc when participants reflect on their activity after the testing. The thinking aloud method is valuable to cartography as it helps understand the entire process of map use. It is, however, possible that the process of thinking aloud actually influences thought and behaviour beyond the research test, with participants speaking aloud what they feel the researchers want to hear, rather than what they are actually thinking. Therefore, careful planning must be implemented on how to articulate tasks (Cotton & Gresty, Citation2006). Overall, thinking aloud allows for users’ thoughts to be recorded whilst observing their behaviour, giving a deep insight into potential user experience problems.
Keyboard analysis is a method usually implemented in task-based visual search exercises: it examines how the available keys, mouse, touchpad, and any other interaction device, are used by the map user. Mouse tracking is one of the simplest methods implemented for the exploration of visual perception and cognition, allowing researchers to determine whether users perceive image structures, match structure to tasks, and reveal some subjective beliefs of individuals (Konovalov & Krajbich, Citation2020; Krassanakis & Kesidis, Citation2020). The technique involves processes associated with recording and analysing the trajectories produced by computer mouse movements (Kieslich et al., Citation2020). Keyboard analysis is usually low cost, with the main expenditure being the software. Furthermore, it can be easily embedded within websites for both moderated and unmoderated testing, which means there is the potential to have a very large sample size: effectively, every visitor to a map-enabled web site can be used in the analysis. However, if primarily using keyboard analysis, it means that there is no direct understanding of the individuals’ experience, or what cognitive processes have led to decisions being made and behaviour undertaken.
Eye-tracking records eye movement and provides information on what participants look at, which gives an insight into how people think. It shows where the highest level of vision is deployed; people will still ‘see’ other parts of the screen, but with less detail (Henderson & Ferreira, Citation2004). Eye-tracking is dependent on the theory that what the user fixates their eye on is synchronously related to what they are processing within the brain: this is defined as the ‘eye-mind hypothesis’ (Chekaluk & Llewellyn, Citation1992), the one simple psychophysical lead assumption being that eye movements provide evidence of overt visual attention. Thus, eye movements can help in studying human behaviour, understanding decision-making, and explaining cognitive processes (Koop & Johnson, Citation2011). Cartographic eye-tracking research tends to treat maps as the experimental stimuli and the map perception process as the reaction during the observation (Williams, Citation2007). Although there are many positives to eye-tracking there are some drawbacks: it is expensive, and usually must be conducted in a usability lab, rather than a participant’s natural environment. The potential of eye-tracking is also still constrained by the complexities of interpreting the data and finding value in the volume produced (Cairns & Cox, Citation2012), but Carter and Luke’s (Citation2020) overview shows that when effectively utilised it is an efficient, value-adding tool in use and user testing.
Questionnaires comprise a set number of questions that are designed to be answered by all participants within a study. They ensure distribution of users in different circumstances and with different characteristics to take part. Questionnaire design is very important as it is essential that the participant can easily understand, interpret, and if required, complete the questionnaire in an allocated time. There must be careful consideration of the question wording, types and ordering as this can have a significant impact on the data collected. Pilot studies can be conducted with a controlled group of participants to make sure that the questionnaire is fit for the intended purpose. Interviews and focus groups are also other methods closely linked to questionnaires. In focus groups, the views of one participant cannot be probed to the same degree as in an interview. The discussions facilitated in focus groups often result in useful data in a shorter space of time compared to one-on-one interviews (Cairns & Cox, Citation2012). A common approach used in cartography, related to but more simplified than a questionnaire, is a subjective evaluation, where a user or focus group is asked feedback on a particular product or visualisation, rather than questions throughout (Wielebski & Medyńska-Gulij, Citation2018). Subjective evaluation is highly dependent on the prejudice of the user and less suitable for any further interpretation because of its subjective character. In general, questionnaires and focus groups are useful methods to conduct usability testing, but they must be carefully planned, and value can be added by combining them with other methods and adopting a mixed-method approach (Mohd Said & Forrest, Citation2019).
Mixed-method approaches are very common in usability studies as they can strengthen findings by combining concepts, so different perspectives and information can come out of a single study. The mixed-method approach involves different techniques being combined, e.g. eye-tracking and mouse tracking, to allow for additional insight and a potential new perspective. For example, Keskin et al. (Citation2018) conducted usability research focusing on using eye-tracking, sketch maps and questionnaires: combining all these methods potentially brought advantages to the user study design in terms of methods, materials, and user needs. In addition, it also yielded additional insights about map users’ behaviours, demonstrating that a mixed-method approach is appropriate for a discipline such as cartography, due to the nature of how a map is interacted with and consumed by the user. Feedback can be given on the extent to which a map meets the purpose it was designed for, in terms of interactivity, interface design and ease of use. It must, however, be noted that, due to potential confusion, inconsistency and divergence in possible aims and objectives, as well as in the working methods themselves, mixed method approaches require firm pre-definition of purpose and intended outcomes.
Both the subject of the usability research (the map) and the methods of undertaking the research (engagement with the map user) have been subject to technological developments in recent years, and often it has been the study of the computer-science sub-discipline of human–computer interaction (HCI) which has helped to develop and evolve such technologies. Whilst the methods of undertaking research of this type do rely on scientific principles and quantitative and qualitative data handling, it is important to note that it is the characteristics, experience, behaviour, curiosity, and engagement of human beings which form the core of all user research in cartography.
2.2. Eye-tracking as a major methodology for use, user, and usability investigation
Each of the methods outlined above has been adopted in a large range of research studies on map use, map users, and map usability. The development and undertaking of such research tend to be time-consuming and yield interesting results, but it has long been recognised that whilst it is possible to design comprehensive and outcome-rich testing regimes, none of the individual methods described above will be fully representative of all map users in every real-life scenario of map use, for every type of map and image display (usability.gov, Citation2019).
Eye-tracking has as long a history of application in cartographic research as several of the other techniques mentioned in the previous section, the first study originating over 50 years ago (Merriam, Citation1971). Valuable overviews of the application and potential of eye-tracking in the discipline of cartography are available in a number of review articles published in the period since then (for example, Kiefer et al., Citation2017; Steinke, Citation1987). An attempt to summarise the expanding field of eye-tracking, and eye-movement, research studies in geospatial data handling is presented by Wang et al. (Citation2016) The expansion of interest and the demonstration of utility which such summaries provide have led to the widespread application of eye-tracking in cartographic research in a variety of different map use scenarios and with identifiable user groups (Çöltekin et al., Citation2009; Edler et al., Citation2020; Keskin et al., Citation2018; Krassanakis & Cybulski, Citation2019; Ooms et al., Citation2012; Popelka et al., Citation2012). The introduction of more complex visualisation technologies means that there has been an increase in cognitive load on those individuals interacting with visualisations, particularly when using maps in time-critical decision-making situations (Fuhrmann et al., Citation2015). When complex interpretation tasks take place, which may involve analysing a variety of information types, effective visualisations hold the solution for understanding the information, potentially lowering the cognitive load on decision-makers, leading to a more efficient recording of risks, responses to uncertainties and confidence in action (MacEachren & Kraak, Citation2001).
The ‘eye-mind hypothesis’ (Chekaluk & Llewellyn, Citation1992) suggests that recordings of eye movements can be a direct proxy for the current contents of conscious (i.e. cognitive) processing – although there are many who would suggest that the actual functioning of the gaze and its relationship with the brain is much more complex than this. The movement of the eyes can be defined and categorised by two main behaviours: fixations, where the eyes are generally still, and saccades, the fast movement between fixations. Fixations are one of the primary and most valuable eye functions for understanding how a user is interpreting and interacting with data: they show where a user looks and how long they look for. Fixation lengths tend to vary from about 100 to 600 milliseconds, and during this pause, the brain will process visual information which is received from the eyes. Most of the information acquired from any visual display is mainly attained during fixations (Holmqvist et al., Citation2011), although the complication of taking micro-saccades into account, and the discrete identification of when a fixation truly begins and ends, can be difficult, and relies on significant post-processing. Once established, the true length and the frequency of fixations are usually an indication of the user’s information processing or cognitive activities and mental abilities. An example of how fixations work is that common words used in text get shorter fixations (so less time looking at them) than less common words (Borys & Plechawska-Wójcik, Citation2017). Fixations are usually represented on visual output plots of eye-tracking by proportional symbols (), allowing for the representation of duration and location simultaneously.
Figure 1. (left) Raw eye-tracking data, with recorded saccades (vectors) and fixations (inflection points); and (right) processed path of eye-movement saccades (straight lines) and filtered fixation points (varying size circles), indicating location and duration of gazes (Popelka et al., Citation2012).
Note: This image is part of an eye-tracking research experiment: the caption reads ‘QUESTION In one of the maps find and mark the highest mountain by clicking.’
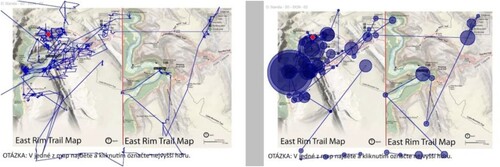
Saccades are defined as the movement from fixation to fixation and tend to occupy 20–40 milliseconds in time (Holmqvist et al., Citation2011). Information that can be interpreted from saccades includes an understanding of the order in which a participant is interpreting the stimuli presented to them, giving an indication of how they are subconsciously prioritising the interpretation and processing of the stimuli. The saccade pattern can reveal confusion on the part of the viewer and problems understanding information. Standard representation for a saccade is demonstrated in , usually depicted as a line between the fixations. Both saccades and fixations allow a variety of information to be collected about how the participant is using a stimulus to make decisions. It should be noted that such metrics may be confounded in dynamic displays, where the gaze and possible fixations may be on stimuli which are moving position (and this may well be the case when map displays are panned and zoomed), or in situations where the viewers themselves are moving, requiring efforts in controlling eye movements to ensure gaze continues to be aligned with points of interest.
2.3. Further issues related to data handling in eye-tracking research
Such basic metrics form an important element of eye-tracking research and can be used for derived indices which give further insight. Fixation durations, for example, give a good indication of the cognitive load being experienced by participants, with their length being associated with the attentional procedures and certain cognitive attributes of respondent behaviour (Holmqvist et al., Citation2011). Interpretation of such cognitive loading may, however, be difficult to confirm – are long fixations reflective of a user having difficulties extracting information, or is the user more engaged with interpreting a detailed representation? Just and Carpenter (Citation1976) suggest that distinguishing between the two is case-specific. Further, some eye-tracking equipment suffers from constraints on its measurement capability – for example in speed and frequency of data capture, or visual quality of the stimulus presented (Leube et al., Citation2017). The enhancement of eye-tracking data capture with other interaction sampling is characteristic of contemporary systems. The collection of data which monitors keyboard presses and mouse clicks is standard in commercial software for eye-tracking research. Also, inbuilt filters and optional settings in such software for handling raw data can help, for example in the sometimes difficult task of determining the uniformity of a fixation: these algorithmic filters calculate whether raw data points belong to the same fixation or not. The basic idea behind these algorithms is that if two gaze points are within a pre-defined minimum distance from each other or possess a speed between them below a certain threshold, then they should be allocated to the same fixation – in other words, the user has kept the eyes relatively still between the two sampling points (Olsen & Matos, Citation2012).
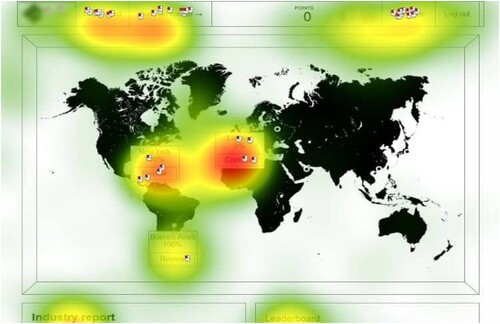
Standard eye-tracking software can output raw and processed data to the researcher. The most common visualisations are gaze plots () and heat maps (). A gaze plot overlays the stimulus with users’ fixations and saccades. As above, fixations are generally depicted as symbols proportionally sized to the duration, and they are numbered, allowing the interpreter to understand the order in which information was processed by the user. Multiple gaze plots from different users can be overlayed on the stimulus, allowing for comparisons among participants. As fixations are excellent measures of visual attention, clustering on a gaze plot denotes a period where the eyes are locked in and focussed, and the density of gaze points reveals areas which have received more visual attention. Although not indicating an order of interpretation or amount of time spent, ‘heatmaps’ are an alternative visualisation which are most effective in simultaneously showing aggregate data on fixations for large numbers of participants. Heatmap interpretation can be uncertain, but perhaps the most important overlooked conclusions relate to the interpretation of blank areas on the display, which gives information which can be equally valuable to any observed concentration on highlighted coloured zones, in terms of varying attention to stimuli across the image.
Figure 2. Example of a gaze plot (https://usabilitygeek.com/what-is-eye-tracking-when-to-use-it/).
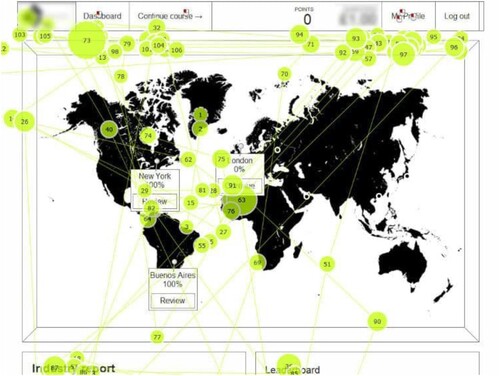
Figure 3. Example of heat map for visualising eye-tracking data (https://usabilitygeek.com/what-is-eye-tracking-when-to-use-it/).
There are other shortcomings in reliance on these graphical outputs: whilst they may tell us where, for how long, and how often parts of the map are viewed, they cannot tell us why, or for what purpose. For realistic insight, it is clear that outputs beyond the quantitative metrics and the output plots are required – a further reason why more supplementary research methods should be used alongside eye-tracking.
2.4. Practical eye-tracking experiments and choices in eye-tracking research
The development of research tasks involving eye-tracking relies on choices and decisions to be made in a number of aspects. Regarding the participants in map use studies, there are two key considerations: the number of participants, and the composition and sample typicality or variability of the participant group. The number of participants can impact the validity and conclusions that can be drawn from a study: a higher number of participants may cause a decrease in the number of issues revealed, due to alignment of common problems being found (Nielsen, Citation2012). The balance between ‘added-value’ of a study, in terms of gaining cogent conclusions, and size of target group, can be difficult to determine, as unpredictabilities can arise from both small and large samples. Whilst testing more users does not necessarily mean more insight, statistical significance of, and confidence in, results are maximised when the number of participants typically exceeds 20 (Nielsen, Citation1993).
Ensuring a representative group of participants is helped by adopting a range of recruitment strategies and by conducting pre-study surveys and questionnaires to collect relevant information on the characteristic of participants. Representation is important as the participant group should be representative of the users who will be using the map-based product that is being evaluated. The identification of participant characteristics is useful for later data analysis, when examination of variables for segmentation of user groups may be a fundamental emphasis of the investigation. In terms of numbers and promoting participation, recruits can be incentivised to take part with vouchers and tokens (for example, in research reported in Siegrist et al., Citation2019); other studies can rely on word-of-mouth and peer-influence; and it is possible to promote involvement as a component of a module on a university course to gain extra credit (as exemplified in research studies presented by Keskin et al., Citation2018). Much depends on the overall nature of the map and map use being examined – some studies will focus exclusively on specific user groups or specialist map use tasks for which certain characteristics of users are the main focus: recruitment methods may need to be finely targeted to achieve the ideal balance in the participant group.
It is also important to consider those individuals within a recruited participant group who may be unable to follow the instructions presented by the researcher. For eye-tracking, vision irregularities in participants can have an impact on the data collected and their data may have to be discarded. Fixed eye-trackers can work well even if participants wear glasses or contact lenses, but only if each lens is of the same prescription and the correction factor is low. Bi-focal and vari-focal lenses have a more complex influence on setting up an eye-tracker, so calibration becomes vitally important when users wear these. Physical characteristics such as colour blindness, droopy eyelids and small pupils can also negatively influence results, whilst wearing mascara and, depending on lighting conditions, even the presence of lenses themselves can also impact the operation of the eye-tracker. It is suggested that whilst most industry-standard eye-trackers work with most of the population, studies can expect to have some problems with about 5-10% of participants. Indeed, eye-tracking is used as a diagnostic tool for assessment of vision and cognitive deficits in several groups, including children and autistic people. For specific interaction with test participants, it is important to identify, and ask them to volunteer information about, visual problems, attention issues, dyslexia and known eye-tracking shortcomings (Valtakari et al., Citation2021).
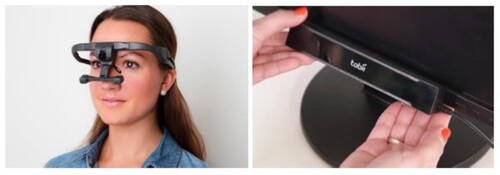
Choices are available in terms of the eye-tracking equipment available for research purposes: there is a variety of eye-trackers at a range of price points and with differing capabilities. The two main types are fixed (whereby the sensor is attached to a monitor on which the stimulus is displayed) and mobile (including sensors which can be worn close to the participants’ eyes, such as glasses) (). To sense where the participants are looking, most eye-trackers rely on infrared light being directed at the eyes to allow for pupil centre corneal reflection. A vector is calculated which is formed by the angle between the cornea and pupil reflections. The direction of this vector, combined with other geometric features of the reflections is applied to calculate the gaze direction and the location on the screen where the user is looking (Olsen & Matos, Citation2012). The frequency (Hz) of the tracker indicates how many recordings it can take per second; this can vary from 30Hz to 2000Hz, which determines what eye movements are measured, with what accuracy, and thus what specific tasks of gaze, focus and attention can be researched and reviewed during eye-tracking studies. Frequency is a limiting factor particularly if the research focus is related to cognition and fixation frequency: lower Hz trackers are not able to differentiate and identify some fixations which may be critical in addressing research objectives.
Figure 4. Mobile eye-tracker (https://www.ergoneers.com/en/mobile-eye-tracker-dikablis-glasses-3/) and fixed eye-tracker (https://www.tobiipro.com/product-listing/tobii-pro-x2-30/).
If mixed methods are being employed as the research strategy, eye-tracking data may be supplemented by data from other equipment, notably sensors measuring skin, brain, lung and muscle activity, and indeed eyes themselves. Galvanic skin response (GSR), for example, involves simultaneous tracking of electro-dermal activity, and other biodata related to brain and heart activity, such as EEG, ECG and heart rate variability (HRV), can also be collected alongside eye-tracking data. Pupil dilation measures can have value also, and can be sampled using the same hardware as the eye-tracking data itself (Bergstrom et al., Citation2014). Although useful supplementary data can be provided, matching of data sampling rates is required to ensure compatibility during subsequent analysis whilst different signal latency durations can be problematic (Ooms, Citation2016): such complex additions are not necessarily suitable or necessary for all cartographic research scenarios.
The choice of testing environment is usually defined by the resources available to the research. Many eye-tracking studies involving cartographic materials have taken place in usability labs (e.g. Brychtova & Çöltekin, Citation2016; Ooms et al., Citation2012; Popelka et al., Citation2012; Popelka et al., Citation2019; Scott et al., Citation2016; J. Wang et al., Citation2019), internal rooms specifically designed for ‘optimal’ eye-tracking, including being soundproofed to reduce any distractions. However, many research projects do not have access to such a room; and further, it is recognised that such locations tend not to be realistic environments for the majority of tasks which are being assessed. For cartographic research, it can be difficult to re-create and simulate the required stimuli and opportunities for anticipated behaviours in the sterile and constrained environment to which participants are exposed in such labs. An individual accustomed to making particular map-informed decisions in a noisy, open-plan office may experience a lack of realism in being asked to do so in a quiet, soundproofed, synthetic room. The alternative of presenting eye-tracking studies in situ is a more recent concept, with many researchers dismissing it due to the potential noise and interference. In-situ tests must be carefully designed to represent the scenario in which the task is usually being completed by a user, such as in an office, on an engineering site, or in the street (contemporary technology is making the use of portable eye-tracking devices a standard procedure: Gholami et al., Citation2021; Kiefer et al., Citation2017). The surrounding environment is therefore important, but also how the participant is immersed in the scenario has a potential impact on the value of the results achieved. The re-creation of situations familiar to the testing subjects may need to be extended to the use of their own regular desktop monitor, familiar mouse or other interaction devices including touchscreens, or peripheral work influences including listening to music whilst working, if this were something they would usually do in the decision-making scenario.
Raw eye-tracking data contains a series of time stamps and coordinates which correspond with the layout of the map or image stimulus. However, to have meaningful insights from this data, filters must be applied which categorise the raw data into fixations and saccades, as well as remove any noise. Noise often occurs in eye-tracking data when there are imperfections in the eye-tracking set-up, which includes influences and interferences from the experiment’s surrounding environment (Chen et al., Citation2008; Klingner et al., Citation2008). Within eye-tracking research, when the fixation is of interest, other minor eye movements, such as tremors and micro-saccades are also categorised as noise. The sampling frequency of the eye-tracking device can also have an impact on the noise detected. For example, the higher the sampling frequency, the finer the eye movements detected, some of which could, and often should, be classified as noise. The application of such noise filters can have a substantial impact on the results of an eye-tracker. As well as simplifying the data, micro-saccades can be removed, and data gaps are filled in. Different filters may be appropriate depending on the inherent tracking measuring frequency, and perhaps on the research objectives of the project.
Further refinement of the outputs from eye-trackers can be applied through the identification and interpretation of Areas of Interest (AOIs) specified within the whole stimulus. These are particularly appropriate in cartographic studies, as particular components of the map (e.g. legend, map face, scale bar, etc.) will have specific functions in user interaction. Creating AOIs allows for segmentation of results datasets with analysis being conducted on a user-defined sub-set of data outputs. In some cases, AOIs can be dynamic, for example legend position when the map is being scaled or panned. Often datasets are segmented also by time, and Times of Interest (TOIs) can be integrated with AOI data for detailed analysis. Timed studies, either in absolute or in relative terms, can be undertaken to investigate specific individual’s time-dependent responses to visual stimuli.
In addition to the quantitative data related to times, areas, speed of saccades, the density of gaze points, frequency of return visits, number of fixations, pupil dilation etc., the qualitative data associated with each participant needs to be integrated for added value from the research. Variables such as job role, age, level of education, level of experience, and potentially many others gleaned from the preliminary categorisation of the participants’ group, allow for fine-scale examination of results. It is important to note, of course, that fragmentation of the participants into smaller and smaller cohorts based on their characteristics can yield unreliable results due to small sample size and/or privacy concerns as individuals become more identifiable. Data aggregation may be needed, and such practices may depend on the aim of the study (Havelková & Gołębiowska, Citation2019). A common method for grouping participants in eye-tracking studies is based on them being identified as either an expert and a novice (Dogusoy-Taylan & Cagiltay, Citation2014; Keskin et al., Citation2020; Ooms et al., Citation2012), usually categorised on university qualification, such as a division based on undergraduate and postgraduate students. In some instances, answer time (Çöltekin et al., Citation2010) or correctness of response (Opach et al., Citation2014) have been used to determine groups post hoc, as well as being valid metrics for user performance studies in general (Šašinka et al., Citation2021). The main issue with such post-analysis grouping is the inability to know the number of participants who will fall into certain groups, and matching the numbers within groups required to allow for a statistically significant comparison between groups. Researchers seeking to categorise groups after data collection should also be cautioned to avoid grouping based on previous assumptions or prejudices. Such post hoc data analysis can lead to spurious and misleading outcomes.
3. Outcomes from eye-tracking research in cartography
Eye-tracking harnesses the power to understand how a user is looking at and relying on a map to make decisions. By analysing eye movements, we can gain an objective insight into the behaviour of a map user and what information is involved when they actually use a map for decision making and other applications. Eye-tracking research can be applied to a range of different areas of cartography, including (but not limited to) such decision making, for example in navigation and wayfinding; comparative map use, for example experts versus novices; map design, including layout, content and symbology; and comparison of media of delivery, for example printed maps versus digital displays. Understanding how users interact with spatial data can help indicate their requirements, improving maps for them to make effective and efficient decisions, with minimal cognitive overload.
The expert-novice map use dichotomy is a key area in which eye-tracking contributes to cartographic research. For such studies, participants must be grouped based on an initial questionnaire or pre-testing procedures, prior to testing of map interaction using eye-tracking. This is one example of the preferred ‘mixed-methods’ approach to user testing (Dogusoy-Taylan & Cagiltay, Citation2014; Keskin et al., Citation2020; Ooms et al., Citation2012; Ooms et al., Citation2014; Ooms et al., Citation2015). In a related study which concentrated more on differences in stimuli (in this case varying legend design) than on differences in user groups, Çöltekin et al. (Citation2017) identified that participants’ prior knowledge of soils and their varying map interpretation abilities led to interesting performance differences between two distinctly differently designed legend types, one based on named categories, the other based on perceptual colour spaces. The outcomes from this type of eye-tracking research can indicate whether and how different maps need to be designed for distinct user groups, what elements of the maps users from different backgrounds may struggle with, and how education in map use can be made more efficient.
3.1. Further applications of eye-tracking research
Eye-tracking has been used to investigate legend design and organisation of many different types of maps, including soil (Çöltekin et al., Citation2017), weather (Popelka et al., Citation2019) and engineering (Hepburn et al., Citation2021). Although legend design and symbology may also be subject to distinct personal preferences, map users often have to interact with legends and symbology designs which are beyond their control to edit or, indeed, visualise. Eye-tracking can utilise search-based tasks to understand how an individual deals with different legend and symbology designs when making a decision. In addition, the positioning of the legend can be investigated to understand how this can impact memory tasks (Edler et al., Citation2020). Popelka et al. (Citation2019) found that the searching was quicker in static menus that respondents did not have to switch on or off and that the graphic design significantly influenced respondents and their work with the web maps. In terms of symbology, Krassanakis and Cybulski (Citation2019) suggest that evaluation of map design is a prime driver of eye-tracking research in cartography. Brus et al. (Citation2019) assessed the most appropriate methods for designing point symbols for uncertainty visualisation, using eye-tracking as part of a mixed-method approach. They found that symbols which directly incorporate uncertainty in the visual variable work better than legends which separate the presentation of specific symbols and uncertainty of data. This is a valuable insight, in which eye-tracking helped reach an outcome that can aid both map designers and users in appreciating that symbology can have an impact on interpretation. The effectiveness of maps in conveying terrain information through cartographic symbology was the specific focus of research reported by Popelka and Brychtova (Citation2013) a decade ago, whilst the impact of such symbology on map use tasks, as measured by eye-tracking, was presented by Putto et al. (Citation2014).
Additional insight can be achieved by defining, applying, and assessing interaction with AOIs. Visual attention can be tracked when users view a map or image which has functional elements, such as legend, title, and scale bar, as well as variation in terms of density of detail, level of complexity, and items of specific and searchable interest on the map face. For example, Hepburn et al. (Citation2021) investigated how participants’ job roles with a civil engineering company influenced the amount of time they spent looking at the legend when making a decision. As they became more familiar with the information presented on the map stimuli (in this case, environmental impact assessment (EIA) maps), their use of the legend decreased, although new and unfamiliar information later introduced increased legend usage once more. All participants relied on the legend throughout each of the tasks and exercises, but the differences in approach to creating and viewing the map by switching layers on and off, and changing legend visibility prior to decision-making, revealed that there is little predictability in the attention of users to these functional map aids and tools.
For wayfinding research, mobile eye-trackers are the most appropriate equipment as these can track an individual subject as they complete a task outdoors if necessary. This can include investigating challenges when route planning, navigating and wayfinding (Koletsis et al., Citation2017), differences in spatial attention in 2D vs 3D maps (Lei et al., Citation2014), and the impact of gender and age on using indoor maps in wayfinding exercises (C. Wang et al., Citation2019). In addition, there can be a medical perspective whereby visual cues are assessed for wayfinding in early-stage Alzheimer’s disease (Davis & Sikorskii, Citation2020). The application of eye-tracking in wayfinding tasks is wide-ranging and evolving and the development of mobile eye-tracking technology will only increase the value and impact of this type of research.
The continuing use of eye-tracking research in cartography is related to contemporary interest in performing tasks and making decisions using maps. General outcomes can guide best practice in map creation and optimising the benefits of map interaction, whilst more specific advice on legends, marginal information and screen design can also be drawn from such research activity.
4. Conclusions and future approaches
From the overview of techniques, applications and experiences in eye-tracking research outlined in this paper, this concluding section highlights (in bold) specific recommendations and opportunities for the future of cartographic research using this methodology. Despite the extensive range of current research activity in cartography which uses eye-tracking methods, well summarised in overview papers by Kiefer et al. (Citation2017) and Krassanakis and Cybulski (Citation2021), there is little evidence in the wider human–computer interaction community of eye-tracking’s impact on cartography, nor of the contribution of cartographic research to general research advances in the field. None of the leading textbooks in the subject of eye-tracking, by Duchowksi (now in a comprehensive third edition, Citation2017), by Holmqvist et al. (Citation2011, and second edition, Holmqvist & Andersson, Citation2017), or by Burch (Citation2021), has a mention of cartography’s use of the technology, nor cartography’s contribution to it.
It is the unique nature of cartography which should perhaps be emphasised in future reporting of such research, and in promoting the contribution of cartography to further advances in eye-tracking research. Notably, the explicit role of the stimulus as a functional document should be stressed: the map is used for mission-critical decision-making, for the acquisition of important information relevant to a wide range of human behaviours, and for the exposition and sharing of common experiences and values. But it is not just about the overall stimulus, which provokes a generalised and predictable reaction in terms of measured eye movements: it is the specific components and parts of the map face which contribute the most ‘added-value’ to the viewer. Thus, the identification of Areas of Interest covering items such as the legend, the scale bar, the viewing controls for dynamic displays, and particular parts of the map face itself, which may dynamically alter, dependent on the field of view, scaling ratio, and content, is a vital part of the set-up of map-related eye-tracking studies. Contemporary technology allows for sophisticated identification, survey, and use of AOI data outputs, and cartographers can gain much insight from effective pre-processing of the stimulus and judicious interpretation of the outputs.
A further result of the extensive ‘modularisation’ of the map display is that peripheral vision becomes an important part of the interaction process. Many map users are well versed in determining, through glances (rather than gazes) and speedy sweeping of the display that, for example, there is a scale bar shown, which can be referred to later if necessary. The mechanics of sampling peripheral vision, in addition to foveal fixations, can be complex, but this is important especially when recognising the primacy of Areas of Interest: distinguishing foveal from peripheral vision when eye-tracking allows us to
consider certain regions in the image that will attract one’s attention. These regions may initially be perceived parafoveally, in a sense requesting further detailed inspection through foveal vision. In this sense, peripherally located image features may drive the attention in terms of ‘where’ to look next, so that we may identify ‘what’ detail is present at those locations. (Duchowski, Citation2017, p. 5)
Gaze plots show the saccades and fixations associated with standard data collection, but with increased precision in frequency measurements it is now possible to attempt some deeper analysis of the former. Previously thought to be involuntary and immutable, saccades have, in the past, held limited interest: the improved ability to measure direction, velocity, duration and amplitude of saccades may, however, yield new information about map-reading strategies, particularly the tasks of search, legend use, and subsequent use of display controls such as panning and zooming. Investigation of the varying length of saccades, and their trajectory may reveal that the duration of a saccade and its amplitude are not necessarily linearly correlated, and that saccades are not necessarily directly linear.
The improvement in latency and precision of eye-tracking data collection has also led to more detailed investigations of the definition of a fixation, and the link implied in the eye-mind hypothesis. Although low-cost eye-trackers are still widely used for cartographic research (Ooms & Krassanakis, Citation2018), some contemporary eye-tracking equipment can detect and identify possible time lags of smaller than 250 milliseconds between the cognitive focus and the visual focus – contradicting the hypothesised simultaneous matching of eye (visual attention) with mind (cognitive interpretation) (Cui, Citation2021). Research into the eye-tracking manifestation of such non-synchronicity is possible due to improved technical specifications of the data collection devices used.
Increasingly precise eye-tracking devices can also contribute to a closer alignment of eye-tracking with physiological sampling, in order to ascertain the link between visual attention and neuro-cognitive processes (Qin & Huang, Citation2022). Future eye-tracking research may focus on linking EEG-derived data (‘frequency-based features, time–frequency metrics, and cognitive affective metrics’) with eye-movement data (‘blink/fixation/saccade and pupil size metrics, as well as their spatio-temporal distribution’) (Qin & Huang, ibid.). Such data processing is challenging, but may well reveal valuable insights.
Changes of display and modification of the actual stimulus provided by maps on screen can be done wilfully by map users (Göbel & Kiefer, Citation2019), including those participating in eye-tracking research, but they can also be done under machine control. The role of technologies exemplified by Gazespeaker (gazespeaker.org) which uses integration with eye-tracking to predictively modify displays is worthy of investigation by cartographic researchers. This type of software can already be incorporated with Google Maps, and other web-based mapping systems, to effect automated panning and zoom level determination dependent on eye movements of users.
A further area of machine control, both now and in the future, is in applications involving immersive virtual reality (VR), and augmented reality (AR) displays on more conventional devices. Cartographers have long been interested in the potential of VR and AR in the handling of geospatial data, and indeed have initiated systems which demonstrate significant innovation in database design, data generalisation, integration of human actions and environmental scenes, map displays, and multi-participant VR spaces. Eye-tracking can play a central role in assisting navigation, designing levels of detail of geospatial data, and monitoring human behaviour, within such systems.
It has already been suggested that in cartographic research, eye-tracking can best be considered as one of a range of mixed methods, each of which reveals different types of results, which can be combined to characterise the interaction of map and user, the effectiveness of the map, the nature of the map user’s behaviour, and the efficiency of the map display. The application of such mixed methods (e.g. eye-tracking with participant profiling; eye-tracking with concurrent or retrospective thinking aloud recording; eye-tracking with analysis of keyboard and mouse controls) has matured as demonstrated in this overview. However, perhaps the most important potential for eye-tracking in cartographic research is in widening the scope of its application, analysis, and theorising. The ICA Commission on Maps and Spatial Data Use was initiated in 1987 by Judy Olson, and it is well over a decade since the formal re-establishment of a successor ICA Commission on ‘Use and Usability’ which, slightly re-named (now the Commission on User Experience), has broadened the scope of map use and user issues. Its current Terms of Reference promote a focus which ‘should not just be map use, but the scope should be broadened to the use and users of, for instance, hardware, software and information systems, interfaces, geographic data and databases.’ The rationale, justification and implications of that are set out in van Elzakker and Delikostidis (Citation2010) who embrace the broadest scope of geospatial data handling, including map displays: they suggest the direction of research efforts to determine the effectiveness, efficiency and user satisfaction of visual displays, tools, interfaces, and hardware of such data handling, along with the fundamental aspects of continuing perceptual and cognitive research, to explain how such data handling works. The wider realm of geospatial data interaction can benefit from the insights which eye-tracking research uncovers. Kiefer et al. (Citation2017) promote effective cognitively-engineered user interfaces to geographic information, informed by eye-tracking research, along with other GIS-oriented cognitive research (Montello, Citation2009). Eye-tracking has a central role in addressing this ongoing important mission, and in the wider areas of map use research in future. Cartographic research has achieved much with the adoption of eye-tracking methodologies, and the potential for further understanding of map use, users and usability is large.
Acknowledgements
The authors are grateful for the suggestions of the anonymous reviewers. The authors report there are no competing interests to declare. The work described in this paper was undertaken as part of research supported by the NERC Dream CDT PhD programme, United Kingdom Research and Innovation agency (UKRI).
Disclosure statement
No potential conflict of interest was reported by the author(s).
Correction Statement
This article has been corrected with minor changes. These changes do not impact the academic content of the article.
Additional information
Notes on contributors
David Fairbairn
David Fairbairn. Retiring recently after over 40 years as a cartographic educator and researcher at Newcastle University, David Fairbairn is now visiting fellow in the School of Engineering there. Having also engaged during his career with the wider cartographic community as office holder in the British Cartographic Society, GIS Research UK, and the International Cartographic Association, he maintains interests in research and outreach in cartography.
Jess Hepburn
Jess Hepburn. Jess Hepburn graduated with an undergraduate degree in Geographic Information Science from Newcastle University in 2017, and was awarded a PhD for her research thesis entitled ‘The role of geovisualisation to support decision-making in major engineering projects’ in 2022. Her wide-ranging commercial experience outside the academy (Ordnance Survey, Atkins) and interests in promoting and utilising geospatial data within (teaching assistant, GIS outreach), are now being enhanced in her role as research associate on a major project at the University of Glasgow involving the visualisation of public health data.
References
- Baxter, K., Courage, C., & Caine, K. (2015). Understanding your users: A practical guide to user research methods (2nd ed.). Morgan Kaufmann.
- Bergstrom, J., Duda, S., Hawkins, D., & McGill, M. (2014). Physiological response measurements. Ch. 4 In J. Bergstrom & A. Schall (Eds.), Eye tracking in user experience design (pp. 81–108). Amsterdam.
- Bleisch, S. (2011) Evaluating the appropriateness of visually combining abstract quantitative data representations with 3D desktop virtual environments using mixed methods, PhD thesis, City University, London, UK. https://openaccess.city.ac.uk/id/eprint/1092/
- Borys, M., & Plechawska-Wójcik, M. (2017). Eye-tracking metrics in perception and visual attention research. European Journal of Medical Technologies, 3(16), 11–23.
- Brus, J., Kučera, M., & Popelka, S. (2019). Intuitiveness of geospatial uncertainty visualizations: A user study on point symbols. Geografie-Sbornik CGS, 124(2), 163–185. https://doi.org/10.37040/geografie2019124020163
- Brychtova, A., & Çöltekin, A. (2016). An empirical user study for measuring the influence of colour distance and font size in map Reading using eye-tracking. Cartographic Journal, 53(3), 202–212. https://doi.org/10.1179/1743277414Y.0000000103
- Burch, M. (2021). Eye tracking and visual analytics. River.
- Cairns, P., & Cox, A. (2012). Research methods for human-computer interaction (2nd ed.). Cambridge University Press.
- Carter, B. T., & Luke, S. G. (2020). Best practices in eye-tracking research. International Journal of Psychophysiology, 155, 49–62. https://doi.org/10.1016/J.IJPSYCHO.2020.05.010
- Chekaluk, E., & Llewellyn, K. (Eds) (1992). The role of eye movements in perceptual processes, Advances in Psychology Book Series Vol. 88. Elsevier.
- Chen, J., Tong, Y., Gray, W., & Ji, Q. (2008). A robust 3D eye gaze tracking system using noise reduction. ETRA ‘08: Proceedings of the 2008 Symposium on Eye-Tracking Research and Applications, 189–196. https://doi.org/10.1145/1344471.1344518
- Cotton, D., & Gresty, K. (2006). Reflecting on the think-aloud method for evaluating e-learning. British Journal of Educational Technology, 37(1), 45–54. https://doi.org/10.1111/J.1467-8535.2005.00521.X
- Cui, W. (2021). A critique of Eye-tracking approach in translation process research. Journal of Literature and Art Studies, 11(3), 190–195. https://doi.org/10.17265/2159-5836/2021.03.010
- Cyr, J. (2019). Focus groups for the social science researcher. Cambridge University Press.
- Çöltekin, A., Brychtová, A., Griffin, A., Robinson, A., Imhof, M., & Pettit, C. (2017). Perceptual complexity of soil-landscape maps: A user evaluation of color organization in legend designs using eye-tracking. International Journal of Digital Earth, 10(6), 560–581. https://doi.org/10.1080/17538947.2016.1234007
- Çöltekin, A., Fabrikant, S. I., & Lacayo, M. (2010). Exploring the efficiency of users’ visual analytics strategies based on sequence analysis of eye movement recordings. International Journal of Geographical Information Science, 24(10), 1559–1575. https://doi.org/10.1080/13658816.2010.511718
- Çöltekin, A., Heil, B., Garlandini, S., & Fabrikant, S. (2009). Evaluating the effectiveness of interactive map interface designs: A case study integrating usability metrics with eye-movement analysis. Cartography and Geographic Information Science, 36(1), 5–17. https://doi.org/10.1559/152304009787340197
- Davis, R., & Sikorskii, A. (2020). Eye-tracking analysis of visual cues during wayfinding in early stage Alzheimer’s disease. Dementia and Geriatric Cognitive Disorders, 49(1), 91–97. https://doi.org/10.1159/000506859
- Dogusoy-Taylan, B., & Cagiltay, K. (2014). Cognitive analysis of experts’ and novices’ concept mapping processes: An eye-tracking study. Computers in Human Behavior, 36, 82–93. https://doi.org/10.1016/j.chb.2014.03.036
- Duchowski, A. T. (2017). Eye-tracking methodology: Theory and practice (3rd ed.). Springer. https://doi.org/10.1007/978-3-319-57883-5
- Eckert, M. (1907). Die Kartographie als Wissenschaft. In Zeitschrift der Gesellschaft für Erdkunde zu Berlin (pp. 213–227). Gesellschaft für Erdkunde.
- Edler, D., Keil, J., Tuller, M.-C., Bestgen, A.-K., & Dickmann, F. (2020). Searching for the ‘right’ legend: The impact of legend position on legend decoding in a cartographic memory task. Cartographic Journal, 57(1), 6–17. https://doi.org/10.1080/00087041.2018.1533293
- Ericsson, K. A., & Simon, H. A. (1993). Protocol analysis: Verbal reports as data. MIT Press.
- Fairbairn, D., Gartner, G., & Peterson, M. P. (2021). Epistemological thoughts on the success of maps and the role of cartography. International Journal of Cartography, 7(3). https://doi.org/10.1080/23729333.2021.1972909
- Fuhrmann, S., Holzbach, M. E., & Black, R. (2015). Developing interactive geospatial holograms for spatial decision-making. Cartography and Geographic Information Science, 42(1), S27–S33. https://doi.org/10.1080/15230406.2015.1059174
- Gholami, Y., Taghvaei, S., Norouzian-Maleki, S., & Sepehr, R. (2021). Identifying the stimulus of visual perception based on eye-tracking in Urban Parks: Case study of Mellat Park in Tehran. Journal of Forest Research, 26(2), 91–100. https://doi.org/10.1080/13416979.2021.1876286
- Göbel, F., & Kiefer, P. (2019). “POITrack: Improving map-based planning with implicit POI tracking”. ETRA ‘19: Proceedings of the 11th ACM Symposium on Eye-Tracking Research and Applications, 87, 1–9. https://doi.org/10.1145/3317959.3321491
- Havelková, L., & Gołębiowska, I. M. (2019). What went wrong for bad solvers during thematic map analysis? Lessons learned from an eye-tracking study. International Journal of Geo-Information, 9(1), https://doi.org/10.3390/ijgi9010009
- Henderson, J. M., & Ferreira, F. (2004). The interface of language, vision, and action: Eye movements and the visual world. Psychology Press.
- Hepburn, J., Fairbairn, D., James, P., & Ford, A. (2021). Do we need legends? An eye-tracking study. Proceedings of 29th Annual GIS Research UK Conference (GISRUK), https://doi.org/10.5281/zenodo.4665195
- Hertzum, M., Borlund, P., & Kristoffersen, K. B. (2015). What do thinking-aloud participants Say? A comparison of moderated and unmoderated usability sessions. International Journal of Human–Computer Interaction, 31(9), 557–570. https://doi.org/10.1080/10447318.2015.1065691
- Holmqvist, K., & Andersson, R. (2017). Eye tracking: A comprehensive guide to methods, paradigms, and measures. Lund Eye-Tracking Research Institute.
- Holmqvist, K., Nystrom, M., Andersson, R., Dewhurst, R., Jarodzka, H., & van de Weijer, J. (2011). Eye tracking: A comprehensive guide to methods and measures (1st ed.). Oxford University Press.
- Johnson, R. B., & Onwuegbuzie, A. J. (2004). Mixed methods research: A research paradigm whose time has come. Educational Researcher, 33(7), 14–26. https://doi.org/10.3102/0013189X033007014
- Just, M. A., & Carpenter, P. A. (1976). Eye fixations and cognitive processes. Cognitive Psychology, 8(4), 441–480. https://doi.org/10.1016/0010-0285(76)90015-3
- Keskin, M., Ooms, K., Dogru, A., & De Maeyer, P. (2020). Exploring the cognitive load of expert and novice map users using EEG and eye-tracking. International Journal of Geo-Information, 9(7), 429. https://doi.org/10.3390/ijgi9070429
- Keskin, M., Ooms, K., Dogru, A. O., & De Maeyer, P. (2018). Digital sketch maps and eye-tracking statistics as instruments to obtain insights into spatial cognition. Journal of Eye Movement Research, 11(3), 1–20. https://doi.org/10.16910/JEMR.11.3.4
- Kettunen, P., & Oksanen, J. (2018). Effects of unsupervised participation over the internet on a usability study about Map animation. Ch.7 In A. Robinson & A. Moore (Eds.), New directions in geovisual analytics: Visualization, computation, and evaluation (Proceedings of GVIZ 2018).
- Kiefer, P., Giannopoulos, I., Raubal, M., & Duchowski, A. (2017). Eye tracking for spatial research: Cognition, computation, challenges. Spatial Cognition and Computation, 17(1–2), 1–19. https://doi.org/10.1080/13875868.2016.1254634
- Kieslich, P. J., Schoemann, M., Grage, T., Hepp, J., & Scherbaum, S. (2020). Design factors in mouse-tracking: What makes a difference? Behavior Research Methods, 52(1), 317–341. https://doi.org/10.3758/s13428-019-01228-y
- Klingner, J., Kumar, R., & Hanrahan, P. (2008). Measuring the task-evoked pupillary response with a remote Eye-tracker. ETRA ‘08: Proceedings of the 2008 Symposium on Eye-Tracking Research and Applications: 69–72, https://doi.org/10.1145/1344471.1344489
- Koletsis, E., van Elzakker, C., Kraak, M.-J., Cartwright, W., Arrowsmith, C., & Field, K. (2017). An investigation into challenges experienced when route planning, navigating and wayfinding. International Journal of Cartography, 3(1), 4–18. https://doi.org/10.1080/23729333.2017.1300996
- Konovalov, A., & Krajbich, I. (2020). Mouse tracking reveals structure knowledge in the absence of model-based choice. Nature Communication, 11(1), 1893. https://doi.org/10.1038/s41467-020-15696-w
- Koop, G., & Johnson, J. (2011). Response dynamics: A new window on the decision process. Judgment & Decision Making, 6(8), 750–758. https://doi.org/10.1017/S1930297500004186
- Krassanakis, V., & Cybulski, P. (2019). A review on eye movement analysis in map Reading process: The status of the last decade. Geodesy and Cartography, 68(1), 191–209. https://doi.org/10.24425/gac.2019.126088
- Krassanakis, V., & Cybulski, P. (2021). Eye-tracking research in cartography: Looking into the future. International Journal of Geo-Information, 10(6), 411. https://doi.org/10.3390/IJGI10060411
- Krassanakis, V., & Kesidis, A. L. (2020). Matmouse: A mouse movements tracking and analysis toolbox for visual search experiments. Multimodal Technologies and Interaction, 4(4), 83. https://doi.org/10.3390/MTI4040083
- Lei, T.-C., Wu, S.-C., Chao, C.-W., & Lee, S.-H. (2014). Evaluating differences in spatial visual attention in wayfinding strategy when using 2D and 3D electronic maps. GeoJournal, 81(2), 153–167. https://doi.org/10.1007/S10708-014-9605-3
- Leube, A., Rifai, K., & Wahl, S. (2017). Sampling rate influences saccade detection in mobile eye-tracking of a Reading task. Journal of Eye Movement Research, 10(3), https://doi.org/10.16910/JEMR.10.3.3
- MacEachren, A. M., & Kraak, M.-J. (2001). Research challenges in geovisualization. Cartography and Geographic Information Science, 28(1), 3–12. https://doi.org/10.1559/152304001782173970
- Medyńska-Gulij, B., Gulij, J., Cybulski, P., Zagata, K., Zawadzki, J., & Horbinski, T. (2022). Map design and usability of a simplified topographic 2D Map on the smartphone in landscape and portrait orientations. International Journal of Geo-Information, 11(11), 577. https://doi.org/10.3390/ijgi11110577
- Merriam, M. (1971). The role of the user in the map communication process: Eye noise and map design. Cartographica, 8(2), 22–28. https://doi.org/10.3138/H545-71X2-47G6-L1UK
- Mohd Said, M. S. & Forrest, D. (2019). User preferences for bus map design: evidence from a map usability study. In Proceedings of ICA Vol. 2. Copernicus GmbH. https://doi.org/10.5194/ica-proc-2-88-2019
- Montello, D. (2009). Cognitive research in GIScience: Recent achievements and future prospects. Geography Compass, 3(5), 1824–1840. https://doi.org/10.1111/j.1749-8198.2009.00273.x
- Morita, T. (1987). Measurement of eye movements for map design evaluation. Proceedings of 13th International Cartographic Conference (Morelia, Mexico) Vol. 1. 578–590. International Cartographic Association.
- Nielsen, J. (1993). Usability engineering. Academic Press.
- Nielsen, J. (2012). How many test users in a usability study? User Testing. https://www.nngroup.com/articles/how-many-test-users/.
- Olsen, A., & Matos, R. (2012). Identifying parameter values for an I-VT fixation filter suitable for handling data sampled with various sampling frequencies. Proceedings of ETRA 12 Symposium on Eye-Tracking Research and Applications: 317–320, https://doi.org/10.1145/2168556.2168625
- Ooms, K. (2016). Cartographic user research in the 21st century: Mixing and interacting. Paper 38 In T. Bandrova & M. Konecny (Eds.), Proceedings of 6th international conference on cartography and GIS (pp. 367–377). Bulgarian Cartographic Association.
- Ooms, K., de Maeyer, P., & Fack, V. (2014). Study of the attentive behavior of novice and expert map users using eye-tracking. Cartography and Geographic Information Science, 41(1), 37–54. https://doi.org/10.1080/15230406.2013.860255
- Ooms, K., de Maeyer, P., & Fack, V. (2015). Listen to the Map user: Cognition, memory, and expertise. Cartographic Journal, 52(1), 3–19. https://doi.org/10.1179/1743277413Y.0000000068
- Ooms, K., de Maeyer, P., Fack, V., Van Assche, E., & Witlox, F. (2012). Interpreting maps through the eyes of expert and novice users. International Journal of Geographical Information Science, 26(10), 1773–1788. https://doi.org/10.1080/13658816.2011.642801
- Ooms, K., & Krassanakis, V. (2018). Measuring the spatial noise of a low-cost eye tracker to enhance fixation detection. Journal of Imaging, 4(8), 96. https://doi.org/10.3390/jimaging4080096
- Opach, T., Gołe¸biowska, I., & Fabrikant, S. I. (2014). How do people view multi-component animated maps? Cartographic Journal, 51(4), 330–342. https://doi.org/10.1179/1743277413Y.0000000049
- Pápay, G. (2017). Max Eckert and the foundations of modern cartographic praxis. Ch. 1 In A. Kent & P. Vujakovic (Eds.), The Routledge handbook of mapping and cartography (pp. 9–28). Routledge. https://doi.org/10.4324/9781315736822-2.
- Popelka, S., & Brychtova, A. (2013). Eye-tracking study on different perception of 2D and 3D terrain visualisation. Cartographic Journal, 50(3), 240–246. https://doi.org/10.1179/1743277413Y.0000000058
- Popelka, S., Brychtova, A., Brus, J., & Voženílek, V. (2012). Advanced map optimalization based on eye-tracking. Ch. 5 In A. Bateira (Ed.), Cartography - A tool for spatial analysis. https://doi.org/10.5772/46190
- Popelka, S., Vondrakova, A., & Hujnakova, P. (2019). Eye-tracking evaluation of weather Web maps. International Journal of Geo-Information, 8(6), 256. https://doi.org/10.3390/ijgi8060256
- Putto, K., Kettunen, P., Torniainen, J., Krause, C., & Sarjakoski, T. (2014). Effects of cartographic elevation visualizations and map-reading tasks on eye movements. Cartographic Journal, 51(3), 225–236. https://doi.org/10.1179/1743277414Y.0000000087
- Qin, T., & Huang, H. (2022). Visual attention and neuro-cognitive processes in map use. Abstracts of ICA, 5, 114. https://doi.org/10.5194/ica-abs-5-114-2022
- Robinson, A. (1952). The look of maps. University of Wisconsin Press.
- Roth, R., Çöltekin, A., Delazari, L., Fonseca Filho, H., Griffin, A., Hall, A., Korpi, J., Lokka, I., Mendonça, A., Ooms, K., & van Elzakker, C. (2017). User studies in cartography: Opportunities for empirical research on interactive maps and visualizations. International Journal of Cartography, 3(Supp.1), 61–89. https://doi.org/10.1080/23729333.2017.1288534
- Scott, N., Green, C., & Fairley, S. (2016). Investigation of the use of eye-tracking to examine tourism advertising effectiveness. Current Issues in Tourism, 19(7), 634–642. https://doi.org/10.1080/13683500.2014.1003797
- Siegrist, M., Ung, C.-Y., Zank, M., Marinello, M., Kunz, A., Hartmann, C., & Menozzi, M. (2019). Consumers’ food selection behaviors in three-dimensional (3D) virtual reality. Food Research International, 117, 50–59. https://doi.org/10.1016/J.FOODRES.2018.02.033
- Slocum, T. A., Blok, C., Jiang, B., Koussoulakou, A., Montello, D., Fuhrmann, S., & Hedley, N. (2001). Cognitive and usability issues in geovisualization. Cartography and Geographic Information Science, 28(1), 61–75. https://doi.org/10.1559/152304001782173998
- Steinke, T. (1987). Eye movement studies in cartography and related fields. Cartographica, 24(2), 40–73. https://doi.org/10.3138/J166-635U-7R56-X2L1
- Šašinka, Č, Stachoň, Z., Čeněk, J., Šašinková, A., Popelka, S., Ugwitz, P., & Lacko, D. (2021). Comparison of the performance on extrinsic and intrinsic cartographic visualizations through correctness, response time and cognitive processing. PLoS ONE. Public Library of Science, 16(4), 1–23. https://doi.org/10.1371/journal.pone.0250164
- usability.gov. (2019). Usability Testing | Usability.gov. Retrieved February 16, 2022. https://www.usability.gov/how-to-and-tools/methods/usability-testing.html.
- Valtakari, N., Hooge, I., Viktorsson, C., Nyström, P., Falck-Ytter, T., & Hessels, R. (2021). Eye tracking in human interaction: Possibilities and limitations. Behavioural Research, 53(4), 1592–1608. https://doi.org/10.3758/s13428-020-01517-x
- van Elzakker, C. P. J. M., & Delikostidis, I. (2010). Use, user, and usability research for mobile geo-applications for personal orientation and navigation. IEEE International Professional Communication Conference, 121–130. https://doi.org/10.1109/IPCC.2010.5529824
- van Elzakker, C. P. J. M., & Ooms, K. (2017). Understanding map uses and users. Ch. 4 In A. Kent & P. Vujakovic (Eds.), The Routledge handbook of mapping and cartography (pp. 55–67). Routledge. https://doi.org/10.4324/9781315736822-6
- Wang, C., Chen, Y., Zheng, S., & Liao, H. (2019). Gender and age differences in using indoor maps for wayfinding in real environments. International Journal of Geo-Information, 8(1), 11. https://doi.org/10.3390/ijgi8010011
- Wang, F. S., Wolf, J., Farshad, M., Meboldt, M., & Lohmeyer, Q. (2021). Object-Gaze distance: Quantifying near- peripheral gaze behavior in real-world application. Journal of Eye Movement Research, 14(1), https://doi.org/10.16910/jemr.14.1.5
- Wang, J., Antonenko, P., Celepkolu, M., Jimenez, Y., Fieldman, E., & Fieldman, A. (2019). Exploring relationships between Eye-tracking and traditional usability testing data. International Journal of Human–Computer Interaction, 35(6), 483–494. https://doi.org/10.1080/10447318.2018.1464776
- Wang, S., Chen, Y., Yuan, Y., Ye, H., & Zheng, S. (2016). Visualizing the intellectual structure of Eye movement research in cartography. International Journal of Geo-Information, 5(10), 168. https://doi.org/10.3390/ijgi5100168
- Wielebski, Ł, & Medyńska-Gulij, B. (2018). Graphically supported evaluation of mapping techniques used in presenting spatial accessibility. Cartography and Geographic Information Science, 46(4), 311–333. https://doi.org/10.1080/15230406.2018.1479311
- Williams, L. G. (2007). The role of the user in the map communication process: Obtaining information from displays with discrete elements. Cartographica, 8(2), 29–34. https://doi.org/10.3138/A724-2K5V-2887-P200