
ABSTRACT
The origin of nautical or portolan charts poses the greatest challenge of the history of cartography. Claims that the ‘big’ questions have been answered and research can therefore focus on filling in the details are unfounded. Majority opinion still holds that portolan charts are medieval creations. Although there is a complete absence of historical evidence that supports a medieval origin, evidence that contradicts such an origin does exist. In the absence of historical records, quantitative (cartometric) analysis is a relatively novel technique that can reveal new facts about these charts. Cartometric analysis has shown that portolan charts are composites of accurate regional charts. These regional charts agree surprisingly well with a modern map on the Mercator projection. Both their correspondence with this projection and their accuracy are incompatible with a medieval origin. This has revealed a conundrum that is still able to raise the temperature of any debate on this fascinating subject.
RÉSUMÉ
L'origine des cartes marines ou cartes portulans est le plus grand défi de l'histoire de la cartographie. Les affirmations selon lesquelles les grandes questions ont été résolues et que la recherche peut donc se concentrer sur les détails ne sont pas fondées. La majorité pense encore que les cartes portulans sont des créations médiévales. Pourtant il y a une totale absence de preuve historique qui permettrait de confirmer l'origine médiévale et à l'inverse des preuves qui contredisent l'origine médiévale existent. En l'absence de documents historiques, une analyse quantitative (cartométrique) est une technique relativement récente qui peut révéler de nouveaux faits sur ces cartes. L'analyse cartométrique a montré que les cartes portulans sont des composites de cartes régionales précises. Ces cartes régionales coïncident étonnement bien avec une carte moderne en projection Mercator. La correspondance autant avec la projection que sa précision est incompatible avec une origine médiévale. Cela fait émerger une énigme qui est encore capable de faire monter la température des débats sur ce fascinant sujet.
1. Introduction
On 25 September 2023, an article by J.F.F.A. Gaspar was published online in this journal (Gaspar, Citation2023). Gaspar’s article describes the so-called ‘origins problem’ of nautical charts as more or less done and dusted. It also severely criticises the author’s work on this subject (Nicolai, Citation2014). The purpose of the present article is to demonstrate that the question of the origins of nautical charts is more complex than Gaspar suggests. The results of the author's recent research are presented and Gaspar's claims and allegations related to the debate on this topic are discussed. It is the author's strong preference that such a debate takes place in a collegial spirit, avoiding personal qualifications.
The main bone of contention appears to be the author’s conclusion that portolan charts of the Mediterranean are geometrically too advanced to be medieval (Nicolai, Citation2014, p. 410). This refers to the sub-charts of which a portolan chart is composed and to the remarkably good agreement of the coastline geometry of each of these sub-charts with a modern map on the Mercator projection. This good agreement reflects a high accuracy. Because portolan charts cannot be forgeries from a later date, their source charts must originate from before the Middle Ages. Although this conclusion might have been considered acceptable enough until about the turn of the century, presently most researchers favour a medieval origin, even though ‘no written testimonies have survived containing any useful hints about their origin’ (Gaspar, Citation2023, p. 2).
After providing some relevant information on these charts, Sections 3 and 4 describe the cartometric method and its results, as applied to a sample of 10 charts. This includes an evaluation of the relationship between the tilt angle of the charts and magnetic declination, as well as a brief description of the author’s analysis on the close agreement of portolan sub-charts with the Mercator projection, two subjects that play a vital role in the origins debate. Section 5 presents a discussion of aspects of the hypothesis of a medieval origin that are relevant for the origins debate. Section 6 discusses the claims in (Gaspar, Citation2023) to place nautical chart origins in the early thirteenth century. This is done by comparing these claims with the results of recent research by the author. The (final) Section 7 discusses some relevant methodological issues.
2. Some relevant aspects of portolan charts
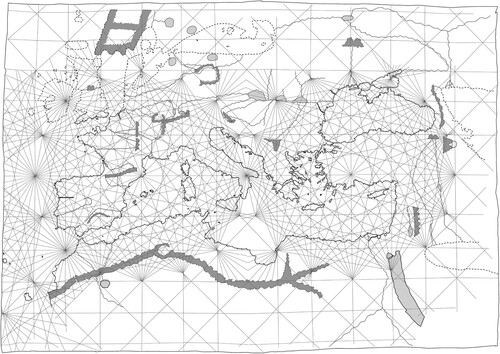
Portolan charts are the first ever nautical charts and they appeared suddenly, without any trace of a development path, as mature cartographic products in the thirteenth-century Mediterranean. The oldest surviving chart is known as the Carte Pisane,Footnote1 currently estimated to date from about 1270. Compared with other cartographic products of this period, portolan charts show a remarkably detailed and accurate image of the coastlines of the Mediterranean, the Black Sea and the Atlantic coast from about the latitude of the Canary Islands up to and including the south coast of England, which might be called their core area, as illustrated by a tracing of the portolan chart by Angelino Dulceti of 1339 ().
Figure 1. Tracing of the portolan chart of Angelino Dulceti (1339).
Equally remarkable as their sudden appearance is the lack of any significant improvement of the coastlines in this core area over time. Later charts are invariably copies of earlier ones, but not ‘slavish copies’ of a single prototype, as Adolf Nordenskiöld believed at the end of the nineteenth century (Nordenskiöld Citation1897(Citation2003): 18, 45). Although difficult to see with the naked eye, there are measurable differences between charts. Marelić demonstrated for the Adriatic Sea that the practice of copying continued at least until the late eighteenth century (Marelić, Citation2023a) and also found that Pietro Vesconte's charts made in 1311 and 1313 contain coastline segments which appear to have been copied from the same source as those on the Carte Pisane and the Cortona chart (Marelić, Citation2023b). Nevertheless, many shortcomings were faithfully copied from one chart to the next; there is no evidence of a progressive elimination of such defects.
The historical record is entirely barren of any evidence or even the slightest indication of how these charts were originally constructed and from what data. Scholarly literature on this subject merely reports that historical evidence is non-existent. For example (Campbell, Citation1987, p. 380): ‘In the absence of corroborating data they [hypotheses on portolan chart origins] often appear to be less explanations than creation myths’. To the best of the author’s knowledge, no dedicated research project aimed at finding medieval documents relating to the origins and construction method of portolan charts has ever been undertaken.
Since the end of the nineteenth century, it has been known that portolan charts exhibit scale variations and an anticlockwise tilt of the coastline image. But the most puzzling characteristic, at least to a geodesist such as the author, is the striking agreement of the coastline geometry of regional sub-charts with the Mercator projection. This appears to be an anachronism, as map projections were unknown in the Middle Ages and Gerard Mercator published the first world map on the projection that bears his name in 1569.
3. Cartometric analysis
In the absence of any historical evidence that might shed light on the construction of these remarkable charts, the only practical source of information are the charts themselves. What can the geometry of portolan charts tell us about their genesis? The term cartometric analysis refers to quantitative analysis of historical maps and charts and was coined by the German geographer Hermann Wagner at the end of the nineteenth century. He introduced this approach to counterbalance the endless, fact-free theorising about the charts’ properties that his colleagues were engaged in (Wagner Citation1896 (Citation1969), p. 695 (476)). Wagner showed that the scale of the Atlantic coasts on portolan charts is too small and that of the Black Sea too large. He concluded that portolan charts are composites of regional charts of the Atlantic coasts, the Mediterranean Sea, the Adriatic Sea, The Aegean Sea and the Black Sea. He also observed that the Adriatic Sea on the Carte Pisane ‘takes no part yet in the general turning of the axis of the Mediterranean’ and considered this strong evidence for his conclusion that ‘ … the Italians were in the possession of very ancient traditions, not only with respect to sailing directions, but also to maps’ (Wagner Citation1896 (Citation1969), p. 702 (483)). After Wagner’s initial work and that of his PhD student Steger it took about ninety years before another extensive cartometric research project was undertaken. Scott Loomer conducted a comparative analysis of twenty-six portolan charts against nine map projections. Using the Root Mean Squared Error (RMSE) of the least-squares fit as the criterion, he concluded that that the charts fitted the Mercator projection best and that ‘portolan charts were pieced together from charts of several individual basins that may have, in turn, been pieced together from smaller basins’ (Loomer, Citation1987, pp. 146, 164, 165). A brief review of cartometric studies up to 2014 is provided in (Nicolai, Citation2014, pp. 185–197). Recently, significant new cartometric work has been undertaken by Marelić (Citation2023a, Citation2023b, Citation2024a, Citation2024b), who also concluded that portolan charts are too advanced to be medieval.
The most sophisticated cartometric analysis techniques are based on georeferencing of the historical map. In the case of portolan charts, georeferencing consists of digitally overlaying the coastlines of a (modern) reference map with the coastlines of the portolan chart and computing the shift, rotation and scale difference to achieve a best fit with the reference map, usually by least-squares estimation. This requires discretising the chart by selecting pairs of common control points on the coastlines of the portolan chart and the reference map.
4. A new analysis of a sample of 10 portolan charts
A total of 10 portolan charts, listed in , were analysed as part of the research reported in this article. The cartometric method used by the author consisted of georeferencing the portolan charts by least-squares estimation. The distinguishing feature of the author’s analysis is its approach of the portolan charts as a composite of sub-charts, thus building on the findings of Wagner and Loomer.
Table 1. Portolan charts analysed.
The author’s earlier research, described in (Nicolai, Citation2014) was based on the five charts marked with asterisks in . Since 2014 the author analysed these charts again, as well as five more charts, using an improved cartometric model for all 10 charts. In Nicolai (Citation2014) a six-parameter affine transformation was used for the georeferencing of the portolan (sub-)charts, but this introduced some numerical instability in the calculation of the two rotation parameters involved. The new model uses a five-parameter affine transformation with only one rotation parameter instead of two, which solves the numerical instability issues. The new results agree with the results in Nicolai (Citation2014), but there are some differences in the coverage areas of the regional sub-charts. While this 2014 research showed for the first time that portolan charts are composites of a larger number of regional charts than Wagner had proposed, the new research enabled the coverage areas of these sub-charts to be determined with greater confidence.
4.1. Sub-chart identification
The starting point for the analysis was a crude division of the Mediterranean into its major basins: the western and eastern Mediterranean, the Adriatic and Aegean Seas, the Black Sea and the Atlantic coasts. The precise boundaries of these sub-charts, their geometric properties (tilt angle, scale and stretch) and their RMSE accuracy were computed simultaneously in an iterative georeferencing process per subset (sub-chart). Gaspar misunderstood this; he suggested that the author first established the coverage area of the sub-charts and then proceeded to do a planimetric accuracy assessment (Gaspar, Citation2023, p. 20). The boundaries of these sub-charts were established on the basis of the size of the control point residuals: where these systematically began to exceed a certain statistical threshold value, the next sub-chart was deemed to begin. The threshold value depended on the computed RMSE degree-of-fit of the sub-chart; for sub-charts with a larger RMSE the threshold was correspondingly higher. By including or omitting one control point at a time, the precise extent of the sub-chart could be determined iteratively. Occasionally the results indicated that what was initially assumed to be one sub-chart, more likely consisted of two or three sub-charts, for example the Atlantic coasts. The selection of a large number of control points, for some charts over one thousand, guaranteed an adequate number of points even in relatively small regional areas. This enabled reliable calculation of regional rotation and scale differences, as well as planimetric accuracy estimates. The latter were calculated from the residual errors of the control points after the best fit to the reference map. Although sub-charts have been mentioned from the beginning of this Section 4, cartometric analysis only permits the discovery of different coherent subsets of control points. Only upon inspection of the geometric properties of these point subsets can it be concluded whether these subsets correspond with regional sub-charts.
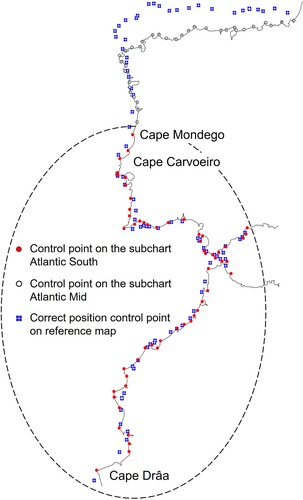
illustrates how the boundary between the two sub-charts ‘Atlantic South’ and ‘Atlantic Mid’, was determined on Angelino Dulceti’s chart. It can be seen that, whilst a best fit has been achieved for the Atlantic South points inside the dashed ellipse, from Cape Carvoeiro northward an increasing mismatch occurs between corresponding control points on Dulceti’s chart and the reference map. The mismatch is caused by an abrupt reduction of the north–south scale and a minor anticlockwise rotation north of Cape Carvoeiro, but the point residuals exceed the statistical threshold only north of Cape Mondego.
Figure 2. Boundary between the Atlantic South (inside the dashed ellipse) and the Atlantic Mid sub-charts on Dulceti’s chart, of which the coastline tracing is shown.
4.2. Sub-chart tilt and scale differences
The main results of the cartometric analysis are shown in , the rotation or tilt angles, which are all relative to the north direction of the wind rose on the relevant chart, and , the scale differences on and between charts. Considerable differences in tilt angle exist between different sub-charts. Additionally, there are significant differences in the tilt of the same sub-chart between different portolan charts, but there is surprisingly little variation in the overall tilt angle of the entire Mediterranean (, grey column).
Figure 3. Anticlockwise tilt angle of sub-charts in degrees. The mean magnetic declination for the year 1250 of the sub-charts is shown as small red circles. A proper representation of the spatial variation of the magnetic declination is provided in .
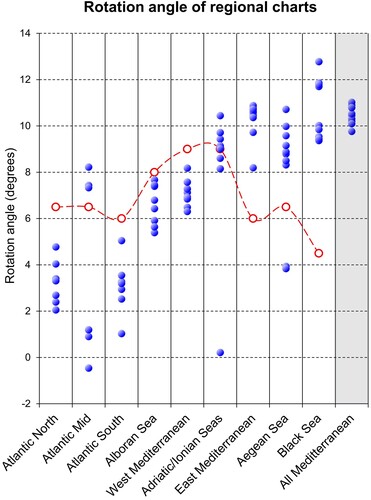
Figure 4. Scale differences of sub-charts, relative to the western Mediterranean on the same portolan chart.
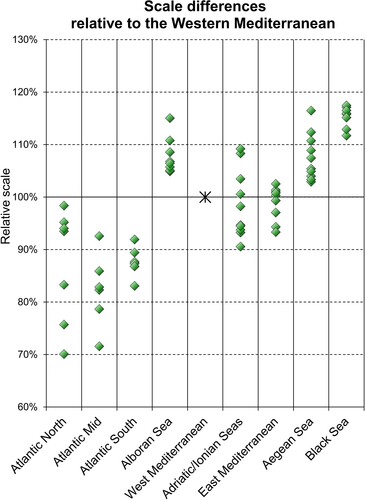
Only scale differences on the same portolan chart can be meaningfully evaluated. The western Mediterranean takes on the role of ‘reference’ sub-chart, which is shown as 100% (the asterisk) in . The scale values were corrected for stretch or shrink of the parchment, derived from the deformation of the circumscribed circles of the wind roses, which cover a significant part of the parchment sheets. The deformation of the wind roses was taken as a proxy for the deformation of the whole parchment. Seven of the 10 portolan charts have two wind roses, such as Dulceti’s chart in ; the remaining three only one. Large regional scale differences exist on the same portolan chart, but also large variations in the scale of the same region on different portolan charts.
4.3. Sub-chart stretch or compression
The five-parameter affine transformation used in the georeferencing results in a shift, one rotation and separate scale differences in east–west and north–south directions for each sub-chart. This revealed the existence of a different scale in the two principal directions of the sub-chart: north–south and east–west. This chart anisometry can be expressed as a ratio, that is, an east–west stretch or compression. East–west stretch is of course the same as north–south compression. It is stressed that this anisometry is not a property of the parchment, but of the chart image. The east–west stretch factors of all sub-charts are shown in .
Figure 5. Stretch (or compression) of sub-charts in east–west direction.
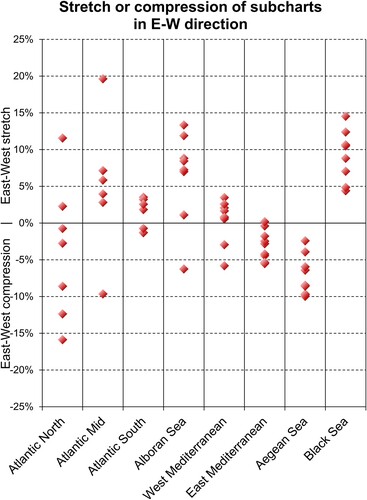
The existence of anisometry in sub-chart coastlines is visually illustrated by an east–west stretch of the Alborán Sea visible on Angelino Dulceti’s chart in and by a north–south compression of the western coast of the Iberian Peninsula in .
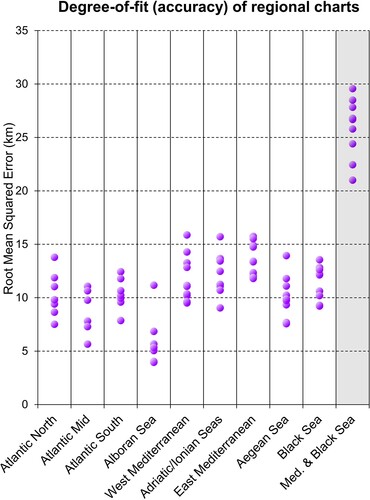
The planimetric accuracy of the sub-charts is shown in . These numbers were computed from the sum of the squares of the residuals after the least-squares fit with the reference Mercator map. The numbers thus represent how well the sub-charts fit a modern reference map on the Mercator projection. The details are explained in Nicolai (Citation2014, pp. 209–210). When copying a new portolan chart from an older one, cartographers made changes to the composite, but it appears they also made additional changes to the coastlines of a given sub-chart, as evidenced by the variations in the RMSE-values of a given sub-chart.
Figure 6. Degree-of-fit (planimetric accuracy) of sub-charts in kilometres. In the rightmost column (grey) the degree-of-fit is shown of the entire Mediterranean and Black Sea, excluding the Atlantic coasts.
The variations in tilt angles and scale, shown in and , are too large to be unintentional errors of the copying process, although some smaller differences may be just that. Therefore these results confirm that portolan charts are composites of sub-charts. The inference of these variations is that the medieval cartographers only knew the approximate orientation and scale of each sub-chart and were well aware of their lack of exact knowledge. The most likely explanation for these variations in scale and tilt angle is that cartographers tried to improve the overall composite chart.
4.4. The portolan mile
Further evidence that the cartographers did not know the exact dimensions of the regional areas is provided by an analysis of the length of the portolan mile. Every portolan chart has one or more scale bars, showing a unit that is peculiar to these charts and is known as the portolan mile. Its length can be deduced from the length of the scale bars in relation with each chart’s topography, which is now known from the georeferencing process.
shows that the lengths of the scale bars on a single chart vary considerably and that there are further differences between portolan charts. It also shows the mile lengths used in the Compasso de navegare, the oldest known portolan (c. 1250), which contains written sailing instructions and nautical information, and the Liber de existencia riverierarum et forma maris nostri mediterranei, a thirteenth-century document that will be discussed in Section 6 below.
Figure 7. Length of the portolan mile in kilometres, derived from the scale bars on 10 charts and the numerical data in the Compasso de Navegare and Liber de existencia riveriarum. Scale bars on the same chart are grouped and shown in the same colour. The mile values were corrected for deformation of the parchment and apply to the mid-latitude (40°N) of the western Mediterranean.
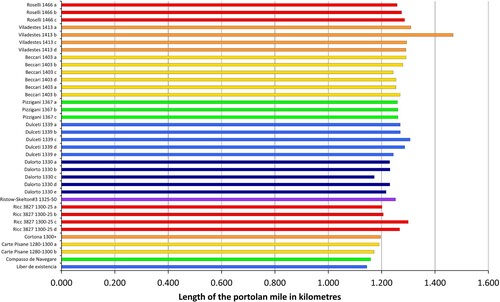
The various sources for the mile length are ordered chronologically from bottom to top in and this shows that the portolan mile tended to get a bit longer over time. thus underlines the conclusion that medieval cartographers had a very imperfect idea about the dimensions of the Mediterranean world; the variations in the mile length and its apparent increase over time make it clear that portolan charts were not constructed from the scale bars.
4.5. Results analysis
The geometric properties of the subsets of control points differ enough to acknowledge them as separate cartographic entities. The boundaries of the sub-charts are not identical on all portolan charts; there is some, but not much variation, except for the Atlantic North and Atlantic Mid sub-charts, for which shows only the ‘common denominator’ across the charts analysed. Their various cartographers appear to have struggled to include this area in the overall composite in a satisfactory manner: smaller sections of coastlines appear to have been rotated, shifted and scale-corrected.
Figure 8. Coverage areas of sub-charts
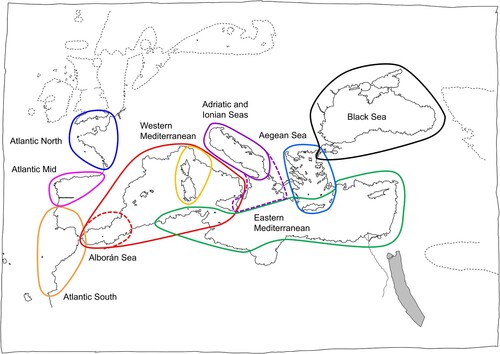
Many sub-charts have noticeable overlaps. An overlap zone shows up in the cartometric analysis as a coastal section of which the control point residuals remain within the statistical tolerance on both adjacent sub-charts. The largest overlap zone is between the western and the eastern Mediterranean and consists of a section of the North-African coast from Bejaia (Algeria) to Ras Kaboudia, between Sfax and Monastir (Tunisia). This suggests that the medieval cartographers might have created the composite chart by fitting overlapping stretches of coastline from the regional charts. Apparently, this was not clear-cut everywhere, as evidenced by the considerable changes in scale and tilt of Europe's Atlantic coast, where smaller stretches of coastline have been shifted, rotated and changed in scale, it seems, in as many attempts to improve the composite chart. This process also went awry with the Alborán Sea, which was enlarged and stretched, presumably to achieve a more satisfactory fit between the Atlantic South and western Mediterranean sub-charts. Therefore, the Alborán Sea appears to be rather an adaptation of the far western part of the western Mediterranean sub-chart than a separate sub-chart. It seems cartographers developed their own ideas about how to put these sub-charts together in the best possible way.
The results of the cartometric analysis described above contradict the hypothesis that these charts were novel medieval creations, constructed from navigation data collated by medieval sailors. It cannot be explained in any convincing way how those sailors, apparently navigating with such diligence, would have missed or not have cared about the significant orientation and scale differences between the sub-charts. Nor can the hypothesis of a medieval origin explain why the tilt angle and scale of the sub-charts vary from one portolan chart to another and why the sub-charts were stretched or compressed by variable amounts.
4.6. The validity of cartometric analysis of sub-charts
Gaspar considers the author’s explanation of the scale and tilt variations of the regional charts unsatisfactory (Gaspar, Citation2023, p. 20), but provides no explanation of his own for these characteristics (Gaspar, Citation2023, p. 16). Without mentioning the scale variations, he attempts to explain the tilt variations as resulting from ‘the less-than-perfect copying processes and the distortion of the parchments due to aging’ (Gaspar, Citation2023, p. 12). As mentioned above, the distortion of the parchment can be estimated from the deformation of the circumscribed circle(s) of the wind rose(s). The author’s results show that most charts have stretched (or shrunk) less than 1%, with a maximum of 3.5% (Carte Pisane and Dulceti’s chart). No significant shear deformation was evident (Nicolai, Citation2014, pp. 203–227). The tilt angles and scale figures in have been corrected for misalignment and stretch of the parchment respectively. These corrections are much smaller than the scale and tilt variations themselves. A ‘less-than-perfect copying process and the distortion of the parchments due to aging’ cannot therefore explain the tilt variations.
According to Gaspar, georeferencing of sub-charts is an invalid process, even a fallacy (Gaspar, Citation2023, p. 20). He suggests it involves ‘manipulating parts of the entire chart, so that they better conform to the Mercator projection, … assuming the component charts were originally oriented to geographic north and unaffected by any scale variations’. While there is nothing wrong in principle with questioning analysis methods, Gaspar's negative framing and the absence of supporting evidence undermine his claim. When a regional part of a chart is georeferenced, this partial map is not manipulated; georeferencing merely establishes its orientation and scale relative to the reference map. It cannot and does not imply any assumptions regarding the underlying reasons for orientation and scale differences. Hence, georeferencing does not assume that the component charts were originally oriented to geographic north and unaffected by scale variations, as Gaspar claims. Georeferencing of a partial map or chart is a perfectly valid process, provided enough control points were selected on the sub-chart to make the results significant. In addition to the author, several researchers have applied cartometric analysis in this manner: Wagner, who used analogue methods (Wagner, Citation1895: graphical appendix), Loomer and most recently Marelić (Citation2023a, Citation2023b, Citation2024b). It is worth noting that Gaspar discovered more or less the same sub-chart division using a different method (Gaspar, Citation2023, p. 18).
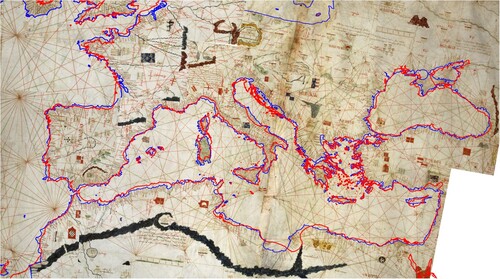
An important indicator of the validity of the sub-chart approach is the difference between the degree-of-fit of the entire chart of the Mediterranean and that of each regional sub-chart. This information can be found in , which shows that all sub-charts agree much closer with the reference map than the whole chart of the Mediterranean and the Black Sea: the degree-of-fit improves by a factor of two. Significantly, Marelić found the same degree of improvement (Marelić, Citation2023b, Citation2024a). Finally, the validity of the sub-chart approach is visually demonstrated by , a re-assembled composite of sub-charts, corrected for the tilt angle, scale difference and stretch calculated in the cartometric analysis.
Figure 9. Composite of rectified sub-charts of Angelino Dulceti’s portolan chart. Its coastal outlines have been traced in blue for better visibility; the coastlines on the Mercator reference chart are shown in red.
4.7. Magnetic declination and tilt angle
The new cartometric information has adverse consequences for the cornerstone of the hypothesis of a medieval origin, the relationship between the magnetic declination and the tilt angle of the charts’ coastline image (e.g. Pujades I Bataller, Citation2007, p. 510). Gaspar claims that ‘the … sub-charts were mounted in such way to make the tilt of the composite approximately match the average value of magnetic declination in the Mediterranean’ (Gaspar, Citation2023, p. 20). However, he presents no evidence to support this claim, which is even falsified by Figure 1 of his article (Gaspar, Citation2023, p. 6): the tilt of portolan charts, as estimated from a single line from Gibraltar to Antioch, is close to the maximum magnetic declination in the Mediterranean in the period 1200-1250.
The cartometric analysis described in the present article is based on a least-squares fit of many hundreds of points, which produces far more precise tilt values than those measured from a single line. The tilt angle of the entire Mediterranean is between 10° and 11° for all 10 charts analysed (, rightmost column). This exceeds the maximum magnetic declination in the Mediterranean world in the period 1220-1250, as estimated from the CALS3k.4 paleomagnetic model (Korte & Constable, Citation2011), which supersedes the model used in Gaspar (Citation2023). This tilt angle is therefore considerably larger than the average magnetic declination. Furthermore, Gaspar uses the term average loosely, as he does not provide a value or any indication of how to calculate it.
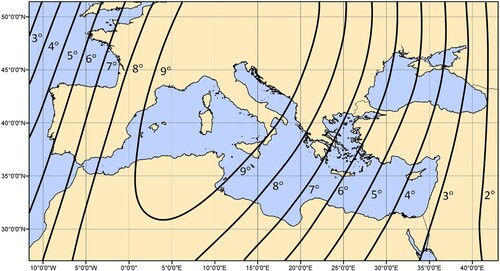
shows the spatial distribution of magnetic declination for the year 1250, calculated from this model. Additionally, for Gaspar’s claim to be true, the tilt angle of the sub-charts should agree with the average magnetic declination in the coverage area of that sub-chart. However, shows clearly that neither the tilt of the entire Mediterranean, nor the tilt angles of the individual sub-charts agree with the approximate average magnetic declination in 1250 in their respective coverage areas, with the exception of the Adriatic sub-chart. Furthermore, the tilt angle of each sub-chart ought to have been more or less constant from one portolan chart to another, which is not the case. Summarising, at best a weak correlation between the tilt characteristics of portolan charts and magnetic declination in the thirteenth century may be deduced, but correlation does not constitute causation.
Figure 10. Lines of equal magnetic declination in the Mediterranean of 1250.
4.8. The Mercator projection
One of the most puzzling characteristics of portolan charts is the excellent agreement of the sub-charts with the Mercator projection. This similarity is widely regarded as coincidental (Campbell, Citation1987, p. 385). Gaspar claims that ‘it is easy to demonstrate that a Mercator representation can be automatically constructed by simply using enough rhumb line tracks connecting places’ (Gaspar, Citation2023, p. 20). The author’s view is the opposite: it is far from easy to demonstrate whether the map projection is coincidental or not; this is the most complex issue related to portolan charts. Due to this complexity, the author's approach and results are only briefly described.
Medieval cartographers and pilots could not have been aware of the properties of the Mercator projection and their only option would have been to transfer measured distances to the parchment after a fixed scale correction to account for the nominal chart scale. Compass bearings would be transferred to the parchment as measured, because magnetic declination was unknown. This technique is known as plane charting. Its principle conflicts with the Mercator projection, of which the scale varies with latitude. Therefore the Mercator projection can never be an automatic product of plane charting. However, the question may be rephrased as follows: ‘Can a chart that is the product of plane-charting be sufficiently close to a Mercator map for the differences to be masked by random chart errors?’
The author addressed this question by mimicking the charting process as a hypothetical medieval cartographer might have done. This puts aside the question of whether medieval sailors could or did produce estimates of rhumb line distances and bearings. Using the actual coastal outlines of the Mediterranean and the Black Sea, a network of tracks was selected, consistent with trade routes and prevailing wind directions. Theoretical (error-free) magnetic bearings and rhumb-line distances were calculated for each line, the magnetic declination having been derived from the CALS3k.4 model for the year 1250. To honour the division into sub-charts, three separate networks were constructed, covering the western Mediterranean, the eastern Mediterranean and the Black Sea. The Adriatic and Aegean Seas were not evaluated. Next, each region was ‘charted’ (actually: calculated) by plane charting, mimicking how an imaginary medieval cartographer might have done this. The graphic resolution of data conflicts caused by ignoring the effects of earth curvature makes this an iterative process, aimed at minimising these errors. shows the network for the western Mediterranean.
Figure 11. Plane-charted network of rhumb lines in the western Mediterranean, used for simulating ‘medieval’ charting.
The key question is: are the shapes of these three plane-charted networks sufficiently close to the shapes of the corresponding sub-charts of a Mercator map, taking into account the planimetric accuracy of the portolan (sub-)chart? If the shape differences are small enough, it will probably not be possible to distinguish a plane-charted regional chart from a Mercator chart, but if it is large enough it might be possible to tell the two apart. But what is small enough or large enough, probably and may? These are statistical questions. The probability of the plane-charted network being indistinguishable from a Mercator chart can be computed using probability calculus. For the three networks together, this probability is almost zero, hence negligibly small. In other words, it is extremely unlikely that the good agreement of the sub-charts with the Mercator projection is coincidental or automatic. The implication is that the Mercator or a Mercator-like map projection was part of the design of the original sub-charts. This is incompatible with a medieval origin. A description of the statistical approach is available in Nicolai (Citation2016, pp. 324–367, 508–516) and in a later article, written for a mathematical audience (Nicolai, Citation2021).
5. The structure of the hypothesis of a medieval origin
A large majority of researchers of portolan charts favours a medieval origin, despite an absence of supporting evidence. Some of the assumptions on which this hypothesis is built can be evaluated in the light of the history of science and technology. Few writers have gone into the details of the supposed sequence of events that is assumed to underlie the creation of portolan charts, but the following assumed sequence of steps can be deduced from available literature.
Medieval Mediterranean seamen practised a disciplined, numerical form of navigation, continually measuring their course bearing and distance sailed during trade journeys.
At the end of a journey, they combined all course deviations into a single bearing and distance between departure and destination.
All such consolidated measurements were recorded and brought together at a single location.
Averages were calculated from the multiplicity of data for any given track.
These accurate averages were distributed in the form of portolans, written sailing instructions.
At some point, a cartographer had the innovative idea to represent that data in a novel way, in the form of a geometrically consistent chart: the portolan chart.
The steps are cumulative, that is, each next step depends on the previous one. However, this sequence of steps is an attempt at reverse engineering: a logical relation between the steps only exists when they are viewed in reverse, that is, when each step is viewed as the precondition for the next. However, when these steps are viewed in chronological order, the logic disappears, unless it is assumed that the construction of portolan charts was a massive, planned campaign involving the entire Mediterranean maritime community, which, given the historical context, would be an untenable proposition. Step 5 appears to have been abandoned by some researchers, after the author demonstrated that the bearings and distances in the Compasso de Navegare were scaled from a portolan chart (Nicolai, Citation2014, pp. 271–348).
5.1. The compass
The ship’s course would have been measured using a compass, but the question is whether the compass was available in time to have played a role in the putative construction of portolan charts. All references to the compass from the thirteenth century describe it as a primitive tool, consisting of a magnetised needle, stuck through a piece of cork that floated in a bowl of water. According to all descriptions it was used only when the sky was overcast. The bowl had no graduated edge, which would have been of no use anyway, as the needle would not have kept a position in the centre of the bowl. This was the earliest form of the compass and sailors referred to it as the needle. The next development stage was the so-called dry-pivot compass, described for the first time by Pierre de Maricourt (Petrus Peregrinus) in 1269. However, this instrument was intended for onshore astronomical use. Gaspar claims that ‘similar models were probably made for nautical use’ (Gaspar, Citation2023, p. 10), but there is no evidence at all that Peregrinus’ compass was used onboard ships. Pujades investigated the references to navigational aids including charts in notarial documents and found that the first use of the word bussola, which he associates with the dry-pivot compass, occurred in 1349. The appearance of the word bussola is commonly considered to mark the transition from a needle with a number of loose attributes to the compass as an integrated instrument (Ferro, Citation1996, p. 46; Pelham, Citation1980, p. 61; Pujades I Bataller, Citation2007, p. 444). Even allowing for the possibility that it had been in use for several decades, the compass was simply introduced too late into the Mediterranean maritime community. For a summary of the available research on the early history of the marine compass, see Nicolai (Citation2014, pp. 135–150).
5.2. Distance measurement
A very old method to get a subjective impression of the ship’s speed was to watch foam or seaweed floating by. However, this could not yield a quantitative speed estimate. Later, sailors tried to measure the speed of the ship, and thus the distance sailed, by having a sailor throw a wood chip into the water near the bow. The navigator, standing near the ship’s stern, would time the passage of the chip by taking his pulse, saying a ditty or rhyme, or counting the number of paces on deck. This was converted into a speed estimate and multiplied by the length of the watch interval, yielding an estimate of distance sailed. This method was dubbed the Dutchman’s log by the British nautical historian David W. Waters. Waters estimates it was probably introduced during the last quarter of the sixteenth century, although its first mention in literature occurs in 1623 (Waters, Citation1958, pp. 427, 428). In modern literature on portolan charts it is generally assumed that this is how medieval sailors measured distance sailed, although few authors are specific on how they believe it was done. For example, Gaspar merely states that distances were measured. However, there is no evidence at all that the Dutchman’s log was used as early as the thirteenth century and no alternative method has ever been suggested.
5.3. Medieval navigation
In the Middle Ages navigation was regarded as a craft, unworthy of scholarly attention (Freiesleben, Citation1983, p. 126). Very few written references to medieval sailing techniques and navigation exist and those that do are mainly found in fifteenth-century pilgrims’ reports. However, there is one exception: the report of the condettiere Roberto da Sanseverino of his journey to the Holy Land in 1458 contains extensive references to sailing and navigation. Tullio Vidoni, a retired merchant navy captain, analysed this journal in his dissertation. He summarises as follows (Vidoni, Citation1993, pp. 6–7).
Sanseverino gives a clear picture of how navigation was carried out on vessels of his time. Strict dependence on sails for voyages within the Mediterranean … , dominated by variable winds, demanded a style of navigation that left little or no room for scientific applications. In these areas the success of voyages depended solely on the masters’ correct interpretations of continually shifting wind patterns along circuitous routes that could not be predicted on charts. Apart from his lack of tools, it is highly doubtful that the average medieval master possessed the knowledge of arithmetic that would be necessary to solve navigational problems mathematically.
5.4. Averaging of measurement values
Despite a total lack of evidence, it is widely assumed that navigation data must have been brought together at some central location and that averages were computed from the multiplicity of data in order to improve the accuracy to that exhibited by portolan charts (e.g. Pujades I Bataller, Citation2007, p. 510), steps 3 and 4 of the above six-step process. However, studies in the history of statistics have shown that the technique of averaging was only applied in science from the end of the seventeenth century (Plackett, Citation1958, pp. 131, 132; Stigler, Citation1998, p. 16). Therefore it cannot be assumed that this technique was known in the thirteenth century. Gaspar considers this a ‘deceptive and anachronic argument, which implicitly assumes some kind of intellectual inferiority of medieval people’ (Gaspar, Citation2023, p. 20). His argument misses the mark completely, as it confuses intelligence with knowledge. Although it might be assumed that people in the Middle Ages were in principle as intelligent as people today, knowledge about the world has increased enormously since the Middle Ages. Knowledge is cumulative and can be transferred to other people; intelligence cannot. No intellectual inferiority of medieval people is implied by stating that they didn’t know things we now take for granted.
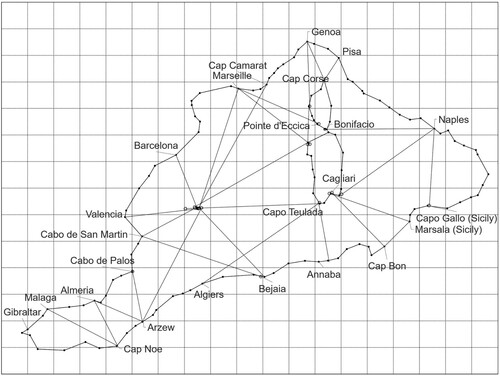
The realisation that medieval people could not have been aware of the benefits of averaging is a fly in the ointment for the hypothesis of a medieval origin. Without assuming some schema of accuracy improvement, it is difficult to explain how an accurate enough dataset could have existed from which a portolan chart might have been constructed. Gaspar proposes hypothetical averaging of charted points positions from many rhumb lines as an alternative to the averaging of multiple measurements of bearing and distance (Gaspar, Citation2023, p. 20). However, this shifts the problem of averaging from individual bearings and distances to charted positions, which would enormously increase the complexity of the proposed solution, because the order in which these individual measurements are used in charting is important. For example, if it is assumed that Livorno is charted from Genoa as a starting point, using 50 bearing-and-distance pairs measured from Genoa to Livorno, then a total of 50 positions could be drawn for Livorno. Assume that the next step would be the charting of Cap Corse, the northernmost point of Corsica, from Livorno, again using 50 bearing-and-distance pairs from Livorno to Cap Corse. Using Gaspar’s proposed method, this would result in 2500 possible positions for Cap Corse, plus 50 from Genoa if 50 bearing-and-distance pairs from there to Cap Corse are added. This example only covers three locations. A fourth point charted from Cap Corse and Livorno could be drawn in 130,000 possible positions. Charting the entire Mediterranean in this way would result in an astronomical number of possible solutions, which the cartographer would have to draw and then ‘average’ visually. Gaspar’s proposed solution simply is not viable. Another important question is by how much the accuracy of the bearings and distances would need to be improved to achieve the accuracy of portolan charts. Using 50 measurements would improve accuracy of the bearings and distances between locations by a factor of seven. However, an accuracy analysis performed in Nicolai (Citation2014, pp. 151–161) indicates that improvement by at least a factor of fifteen would have been needed, requiring 225 measurements for every rhumb line.
Summarising, no historical evidence exists for any part of the above six-step process. Available evidence from the history of science and technology makes it highly unlikely that medieval navigation and charting could have led to the creation of portolan charts.
6. The formative thirteenth century
While acknowledging the lack of evidence, Gaspar hypothesises that the origin of nautical charts lies in the early thirteenth century, suggesting ‘educated speculation’ might shed light on this formative period (Gaspar, Citation2023, pp. 2, 24). Developing this idea, he measured the bearing of a single line in the western Mediterranean from Cape Gata in Spain to Cape Passero on Sicily on some forty charts. This line runs approximately east–west, so measuring its bearing on a portolan chart yields the approximate tilt angle of the western Mediterranean of this chart. His Figure 2 (Gaspar, Citation2023, p. 11) reveals considerable variation in the values for this angle. Gaspar then arbitrarily divides these values into two sub-groups, one greater than and one smaller than eight degrees, and attributes different characteristics to each, suggesting that they may indicate two different ‘surveys’ of the Mediterranean, resulting in two ‘prototype’ portolan charts. The most important objection to this data splitting is that it is completely arbitrary: the data in his Figure 2 does not look like two datasets at all. The eight degrees is equally arbitrary; why not make the split at seven degrees, for example? Or why not split the data into three groups? Such an arbitrary approach to data analysis is incorrect. Another problem is, that a single line in the western Mediterranean is not representative for the western Mediterranean as a whole. For the Carte Pisane and Riccardiana chart the author found tilt values exactly one degree smaller than Gaspar’s and these values are accurate estimates, based on a least-squares fit of 176 and 221 points around the western Mediterranean respectively, instead of on one single line. These values were also corrected for misalignment of the digital scan’s axis and the north-direction of the portolan chart. It is unclear whether Gaspar made a similar correction to the values in his Figure 2 and whether he used the exact bearing of this line or assumed it to run due east–west. The mean difference between the tilt values of his two ‘prototypes’ (Gaspar, Citation2023, p. 12) is one degree, even less than one degree if the smaller values calculated by the author are used. This implies that sailors would have produced two almost identical charts of the western Mediterranean, but rotated with respect to one another by (less than) one degree. Could the sailors have achieved this (less than) one-degree difference using a magnetised needle in a water-filled bowl without graduation, while being tossed about by the waves? Even a superficial analysis of the achievable accuracy makes it clear that this is a wholly unrealistic scenario. This is not educated speculation, but imagining evidence that does not exist.
Furthermore, Gaspar conjectures the existence of a ‘proto-portolan chart’, which might have been available to the author of the Liber de existencia riveriarum, an early thirteenth-century document (Gaspar, Citation2023, pp. 12–13). As evidence he refers to his analysis of directions of the approximately 150 tracks with directional information in the Liber. In his original article, he states that ‘two distinct types of directions can be distinguished: those not affected by magnetic declination, … probably determined by astronomical methods, and those affected by systematic errors that could only have originated in observations made with a marine compass’. Gaspar claims the evidence for the use of the magnetic compass is notably evident in the central Mediterranean (Gaspar, Citation2019, pp. 1, 13). This raises the question of how distinct these two datasets are. The author also performed a numerical analysis of the data in the Liber, not yet published, and this yielded the plot of directional errors shown in .
Figure 12. Bearing errors as a function of longitude in the Liber de existencia riveriarum in degrees. The horizontal red line indicates the mean error of 0.7°.
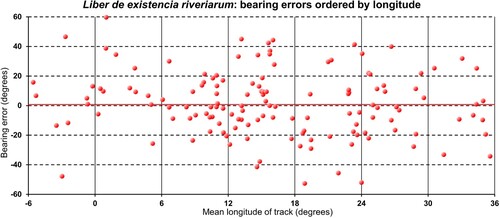
This figure enables a straightforward answer to this question to be given: there simply are no two ‘distinct’ datasets; there is only a single dataset with a considerable spread and it happens to have a mean error of 0.7°. What it shows is randomness. Seeing two distinct datasets in this data is trying to extract more information than the dataset contains. This is another case of imagining evidence that just isn’t there.
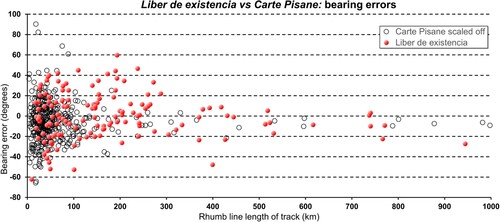
The data in the Compasso de Navegare showed clear evidence of scaling from a portolan chart, partly because short routes have larger relative errors than longer routes, an effect caused by the exaggeration of coastal features on portolan charts. The author showed this pattern to be consistent with bearings and distances scaled from the Carte Pisane (Nicolai, Citation2014, pp. 321–325), although this does not suggest the author(s) of the Compasso used the actual Carte Pisane. The same ‘short-route effect’, with similar characteristics, is visible in the Liber data (), suggesting that most or all of the numerical data in the Liber also was scaled from a chart with the characteristics of a portolan chart. This is not disputed; Gautier Dalché mentions several other clues in the Liber that point to a chart as the source of the written information (Gautier Dalché, Citation1995).
Figure 13. Bearing errors in the Liber de existencia against the background of bearing errors of tracks, scaled from the Carte Pisane.
Gaspar conjectures that the chart from which the data was scaled must have been a primitive and crude predecessor of the portolan charts we know, because, so he claims, it was based on astronomical directions, expressed in the 16-point system of the Liber, instead of the 32-point system used in the Compasso and on all portolan charts. He calls this a ‘proto-portolan chart’ and writes that the subsequent adoption of Petrus Pereginus’ dry-pivot compass for marine navigation ‘would explain the superior accuracy and precision of the directions in the Compasso de Navegare and Carte Pisane when compared with those of the Liber’ (Gaspar, Citation2019, p. 15). This claim raises the question of how superior the accuracy of the data in the Compasso is, compared to that in the Liber.
The figures for both datasets from the author’s analysis are listed in and demonstrate that the accuracy of the Compasso data is not at all superior to that in the Liber; both are of comparable (poor) accuracy. and eliminate any justification for the conjectured existence of a cruder and simpler ‘proto-portolan chart’. Rather, they indicate that the author of the Liber had available a portolan chart not dissimilar to the Carte Pisane. It may have had a 16-point wind rose, but it does not appear to have been significantly cruder or simpler than the Carte Pisane. However, one very important difference would have been that the chart used by the Liber’s author lacked (most of) the anticlockwise tilt of the Carte Pisane, given the mean value of 0.7° of the bearing errors (). Gaspar argues that the absence of this tilt ‘can only mean that they were measured by astronomical means … ’ (Gaspar, Citation2023, p. 13), but that is unlikely. The rough estimation of the ship’s course from the sun or stars with the naked eye hardly deserves the name ‘astronomic navigation’. One cannot just assume that this was a numerical measurement process of which the outcomes were documented.
Table 2. Comparison of the accuracy (standard deviations) of the data in the Liber de existencia riveriarum and the Compasso de Navegare.
The existence of a transitional period in the thirteenth century, during which ‘traditional astronomical methods … were slowly replaced by the new marine compass’ is argued in Gaspar (Citation2019, p. 16). However, in support of that claim only imagined evidence is presented. This takes us back to square one: the assumption of a medieval origin cannot explain the sudden appearance and maturity of portolan charts. What has been gained is the insight that a portolan chart, probably of comparable quality to the Carte Pisane, was available to the author of the Liber and that the map image on this chart lacked a pronounced tilt. It is highly unlikely that such a chart could have been constructed without the aid of any instruments, as Gaspar suggests.
7. The importance of method and some concluding remarks
A subject that rarely gets attention in scientific or scholarly research is research methodology. This also holds for the research into the origins of portolan charts. Nevertheless, some relevant aspects associated with this topic are worth discussing.
A scientific process that aims for confirmation of a hypothesis will always be flawed. This is the essence of the philosophy of Karl Popper, one of the most influential philosophers of science of the twentieth century. Rather than trying to confirm the hypothesis of a medieval origin, the author adopted Popper’s approach and subjected the hypothesis of a medieval origin to testing. Testing implies that not only evidence is sought that corroborates or confirms the hypothesis, but also evidence that contradicts the hypothesis. In contrast, the starting point of most researchers is the a priori assumption that portolan charts are medieval creations. As a result, existing research has tended to focus on finding corroborating evidence for this hypothesis, at the expense of evidence that contradicts a medieval origin.
The author has been unable to find any corroborating evidence for a medieval origin, but evidence that contradicts a medieval origin is described in this article. This led to the rejection of the hypothesis of a medieval origin as it was formulated in Section 5.
Many scholars interested in this topic see this as an unsatisfactory conclusion: they want to know where portolan charts come from, not where they do not come from. This sentiment is expressed in a review of the author’s book: ‘Largely he [Nicolai] proves negatives, rather than building up an interpretation or explanation’ and ‘It’s all very well to say that the medieval sailors and navigators did not create these charts; but who did?’ (Cormack, Citation2019; see also Nicolai, Citation2020). Gaspar clearly disagrees with the author’s conclusion, as he claims that the author concluded that the regional charts, of which portolan charts are composites, were ‘made by an older civilization’, asserting that the author does not provide ‘a single piece of positive evidence’ (Gaspar, Citation2023, pp. 3, 4). However, the author never made such a conclusion, precisely because no evidence pointing to the origins of the charts has ever been found, despite our fervent desire to identify those origins. Moreover, the question: ‘Where do these charts come from?’ is an entirely different one than the question the author asked, namely: ‘Are portolan charts medieval creations?’ The evidence, presented as an answer to the second question does not contribute at all to a possible answer to the first. This is similar to the situation in a criminal trial: the evidence that provides an alibi for the innocent suspect says nothing about the actual perpetrator of the crime. Presently no evidence that allows the origin of nautical charts to be positively identified is known to exist. However, linking one question to the other might lead to the entirely incorrect idea that there is no evidence either for the author’s conclusion regarding a medieval origin. This is incorrect because the evidence contradicting a medieval origin remains valid regardless of the question of the actual origin of nautical charts.
Gaspar warns that ‘mathematical methods are not magical boxes from which historical truth can be read, as conclusions derived from quantitative analysis and modelling techniques must be carefully scrutinized and validated by historical evidence and common sense’ (Gaspar, Citation2023, p. 4 – italicised by the author). The author agrees fully with the first part of the sentence, but disagrees strongly with the italicised part. The results of sound cartometric analysis and any justified conclusions it leads to, should not be rejected, discarded or altered when these results conflict with either historical evidence or common sense. Common sense refers to what most people believe to be correct. This belief changes over time, varies across different communities and has been shown to be an entirely inadequate foundation for truth claims. That is why the world needs science and its rigorous methods for the discovery of new knowledge. When new evidence, provided it is valid, conflicts with theory or common sense, it is the theory or common sense that must be modified, not the evidence or the conclusions drawn from that evidence. A broad consensus that portolan charts are medieval creations indeed appears to exist, but the fact that a large majority of cartographic historians believes this to be true does not make it true. Majority voting has a role to play in politics, but not in science. Gaspar’s warning reads like a license to ignore or discard evidence that conflicts with this common-sense view. His response to the author’s conclusion that the technique of averaging cannot be assumed to have been known in the thirteenth century is a case in point. So is Campbell’s reaction to the sub-charts that were identified by the author’s cartometric analysis: he simply rejects these findings in their entirety because they are contrary to his common-sense ideas (Gaspar, Citation2023, p. 17, citing Campbell). Both writers refer to the author’s methods in negative terms. However, in the absence of evidence or convincing arguments, these qualifications appear to be a justification for their rejection of the author’s results rather than objective attempts to criticise his methods (see also the section The validity of cartometric analysis of sub-charts).
The rejection of the hypothesis of a medieval origin understandably leads to feelings of dissatisfaction, as it does not help to positively identify the origin of nautical charts. However, rejecting sound evidence and clinging to an explanation that has been shown to be inadequate is not the answer. Perhaps it is best to adopt an attitude of suspending judgment until positive evidence becomes available. Neither speculation nor consensus will solve the conundrum of the origins of nautical charts.
Disclosure statement
No potential conflict of interest was reported by the author(s).
Additional information
Notes on contributors
Roel Nicolai
Roel Nicolai is former Principal Geodesist with Shell International. He graduated in 1978 with an MSc in geodesy from Delft University, Netherlands and worked at the Hydrographic Service of the Royal Netherlands Navy and the Department of Public Works before joining Shell in 1984, where he worked in a variety of roles and locations until his retirement at the end of 2016. In 2014, he was awarded a PhD at Utrecht University, The Netherlands on the subject of the origin of portolan charts, having conducted his research in his spare time. He approached this subject from his own field of expertise, geodesy, applying mathematical, geodetic and statistical techniques to the analysis of the geometric properties of portolan charts. Recently he extended his interest to cover nautical cartography of the Age of Discovery. He continues his work on historical nautical charts as an independent researcher associated with Utrecht University.
Notes
1 Bibliothèque nationale de France, département Cartes et plans, GE B-1118 (RES). https://gallica.bnf.fr/ark:/12148/btv1b52503226n?rk=21459;2
References
- Campbell, T. (1987). Portolan charts from the late thirteenth century to 1500. In J. B. Harley, & D. Woodward (Eds.), The history of cartography, volume 1 – cartography in prehistoric, ancient and medieval Europe and the Mediterranean (pp. 371–463). University of Chicago Press.
- Cormack, L. (2019). Book review of Roel Nicolai, ‘The enigma of the origin of portolan charts: A geodetic analysis of the hypothesis of a medieval origin’. Isis, 110(2), 394–395https://doi.org/10.1086/703643
- Ferro, G. (1996). The Genoese cartographic tradition and Christopher Columbus (A. Heck & L. F. Farina, Trans.). Instituto Poligrafico e Zecca della Stato, Libreria della Stato.
- Freiesleben, H. C. (1983). The still undiscovered origin of portolan charts. Journal of Navigation, 36(1), 124–129. https://doi.org/10.1017/S0373463300028630
- Gaspar, J. A. (2019). The Liber de existencia riveriarum (c.1200) and the Birth of Nautical Cartography. Imago Mundi, 71(1), 1–21. https://doi.org/10.1080/03085694.2019.1529898
- Gaspar, J. A. (2023). The origin of nautical cartography: Certitudes, doubts, and perplexities. International Journal of Cartography, 1–30. https://doi.org/10.1080/23729333.2023.2240902
- Gautier Dalché, P. (1995). Carte marine et portulan au XIIe siècle: Le ‘Liber de existencia riveriarum et forma maris nostri mediterranei’ (Pise, circa 1200). Collection de l’École française de Rome.
- Korte, M., & Constable, C. (2011). Improving geomagnetic field reconstructions for 0-3 ka. Physics of the Earth and Planetary Interiors, 188(3-4), 247–259. https://doi.org/10.1016/j.pepi.2011.06.017
- Long, P. O., McGee, D., & Stahl, A. M. (2009). The book of Michael of Rhodes. A fifteenth-century maritime manuscript, volume 2: Transcription and translation. The MIT Press.
- Loomer, S. A. (1987). A cartometric analysis of Portolan Charts: A search for methodology [PhD thesis, University of Wisconsin, Madison].
- Marelić, T. (2023a). Geometric stalemate and de-evolution of Adriatic Sea representations on early modern age nautical charts. The Cartographic Journal, 60(3), 216–229. https://doi.org/10.1080/00087041.2023.2172533
- Marelić, T. (2023b). Traces of the common origin of Carte Pisane, Cortona chart, and Pietro Vesconte’s charts. KN - Journal of Cartography and Geographic Information. https://doi.org/10.1007/s42489-023-00154-6
- Marelić, T. (2024a). Correction to: Traces of the common origin of Carte Pisane, Cortona Chart, and Pietro Vesconte’s Charts. KN - Journal of Cartography and Geographic Information. https://doi.org/10.1007/s42489-024-00164-y
- Marelić, T. (2024b). Certain arguments against the hypothesis that portolan charts were genuine late-medieval cartographic products. International Journal of Cartography, 10(1), 94–117. https://doi.org/10.1080/23729333.2022.2163146
- Nicolai, R. (2014). A critical review of the hypothesis of a medieval origin for portolan charts [Dissertation, Uitgeverij Educatieve Media]. https://dspace.library.uu.nl/handle/1874/291367
- Nicolai, R. (2016). The enigma of the origin of Portolan charts. A geodetic analysis of the hypothesis of a medieval origin. Brill.
- Nicolai, R. (2020). Letter to the Editor. Isis, Vol. 111, Nr. 1, 138.
- Nicolai, R. (2021). The map projection of portolan charts. Nieuw Archief voor Wiskunde, 5/22(1), 33–41. https://www.nieuwarchief.nl/serie5/pdf/naw5-2021-22-1-033.pdf
- Nordenskiöld, A. E. (1897(2003)). Periplus. The early history of charts and sailing directions (A. Francis & P. A. Bather, Trans.). Norstedt, Facsimile reprint: Martino Publishing.
- Pelham, P. T. (1980). The Portolan Charts: Their Construction and Use in the Light of Contemporary Techniques of Marine Survey and Navigation [Master’s thesis, Victoria University of Manchester].
- Plackett, R. L. (1958). Studies in the history of probability and statistics: VII. The principle of the arithmetic mean. Biometrika, 45(1-2), 130–135. https://doi.org/10.1093/biomet/45.1-2.130
- Pryor, J. H. (1992). Geography, technology and war. Studies in the maritime history of the Mediterranean, 649-1571. Cambridge University Press.
- Pujades I Bataller, R. J. (2007). Les cartes portolanes: la representació medieval d’una mar solcada (R. Rees, Trans.). Lunwerg Editores.
- Stigler, S. M. (1998). The history of statistics. The measurement of uncertainty before 1900, 7th edition. The Belknap Press of Harvard University Press.
- Vidoni, T. (1993). The Journal of Roberto da Sanseverino (1417-1487). A study on navigation and seafaring in the fifteenth century [Dissertation, University of British Columbia]. https://open.library.ubc.ca/soa/cIRcle/collections/ubctheses/831/items/1.0086443
- Wagner, H. (1895). Das Rätsel der Kompasskarten im Lichte der Gesamtentwickelung der Seekarten. In Verhandlungen des elften deutschen Geographentages (1896) (pp. 65–87). Geographische Verlagshandlung Dietrich Reimer.
- Wagner, H. (1896 (1969)). The origin of the medieval Italian nautical charts. In: Report on the Sixth International Geographical Congress, 1895, 695-702, London. Reprinted. Acta Cartographica, 5, 476–483.
- Waters, D. W. (1958). The art of navigation in England in Elizabethan and early Stuart Times. Hollis and Carter.