
ABSTRACT
Our research has established the extent to which extreme heat disproportionately impacts manufactured and mobile home communities (MMHC), posing challenges in achieving both targets of Sustainable Development Goal (SDG) 3 of ‘good health and wellbeing’ and SDG 13 of ‘urgent action to combat climate change impacts’. In Maricopa County, Arizona, USA, an alarming statistic of annually 30–40% indoor heat-related mortality occurs within a mere 5% of local housing stock dedicated to MMHC. Effectively addressing the multifaceted nexus of heat vulnerability and housing precarity necessitates the availability of geospatial microdata. Yet, given the idiosyncratic nature of ownership tenure within MMHC communities, sufficient microdata at the household unit level remain notably elusive through conventional tax records or other publicly available sources. In this paper, we assess how employing MapSwipe, a crowdsourcing application affiliated with the Missing Maps initiative, improves the completeness and precision of existing MMHC cartographic data inventory. Our approach harnesses MapSwipe’s micro-tasking methodology to identify absent MMHC locations within the state of Arizona. The contribution of this research is to present a viable methodology that organizes geospatial microdata around SDG initiatives and web-based volunteer mapping to effectively target the resources required to address the heat vulnerability of MMHC.
RÉSUMÉ
Notre recherche a montré jusqu'à quel point la chaleur extrême a un impact disproportionné sur les communautés vivant dans les maisons préfabriquées et mobiles (MPM), ce qui est un défi pour atteindre les objectifs de développement durable (ODD) 3 « Bonne santé et Bien-être » et 13 « Mesures relatives à la lutte contre les changements climatiques ». Dans le comté de Maricopa, en Arizona (USA), une statistique alarmante de 30 à 40% mortalité liée à la chaleur à l'intérieure se produit chaque année dans seulement 5% du parc de logement de type MPM. Traiter de façon efficace le lien multi facette entre la vulnérabilité à la chaleur et l'habitat précaire requiert la disponibilité de micro-données géospatiales. Pourtant en raison de la nature idiosyncratique du régime de propriété dans la communauté des MPM, il est difficile d'obtenir des micro-données suffisantes au niveau des ménages par le biais des registres fiscaux conventionnels ou d'autres sources accessibles au public. Dans cet article, nous évaluons comment l'utilisation de MapSwise, une application de saisie participative associée à l'initiative Cartes Manquantes, améliore la complétude et la précision de l'inventaire des données cartographiques des logements MPM existants. Notre approche exploite la méthodologie de micro-tâches pour identifier les emplacements des MPM manquantes à l'intérieur de l'état de l'Arizona. La contribution de cette recherche est de présenter une méthodologie viable qui organise les micro-données géospatiales autour des initiatives des ODD et de la cartographie web participative pour obtenir de façon efficace les ressources permettant de remédier à la vulnérabilité à la chaleur des maisons préfabriquées et mobiles.
1. Introduction
In Maricopa County, Arizona, the US’s largest and fastest growing metropolis built in the middle of the Desert Southwest, an alarming statistic of annually 30% or more of indoor heat-related mortality occurs in Manufactured and Mobile home Communities (MMHC) while these dwellings only account for 5% of local housing stock. This means that MMHC residents in Arizona experience heat-associated mortality rates about six times greater than individuals residing in other types of housing within the state. In 2023, Maricopa County shattered climate records and had 31 consecutive days in summer when the temperature was higher than 110 °F or about 43.3 °C (2023 National Climate Report). Maricopa County Public Health Department (MCPHD, Citation2024) confirmed 645 heat-related deaths in 2023 with a 52% increase compared to the previous year.
MMHC often face elevated risks during extreme heat events, impacting the well-being of residents and exacerbating existing health disparities (Phillips et al., Citation2021; Solís et al., Citation2023). MMHC with inadequate heat mitigation (e.g. lack of tree cover or shade and poor building insulation and worn-out materials) get hotter faster than regular houses and many of their residents experience the same temperature inside and outside (Gabbe & Pierce Citation2020). About 58% of MMHC residents experience some form of energy insecurity (Brown et al. Citation2020) meaning that they could not afford to pay the electricity bills to consistently run air conditioning. Mobile homes are affordable housing options mostly occupied by elderly, lower-income and less educated residents known as key heat-sensitive groups of people. Based on ‘2023 heat-related death report’ by Maricopa County Public Health Department (MCPHD), 95% of all indoor heat deaths happened among individuals aged 50 years or older. According to Household Pulse Survey (U.S. Census Bureau, Citation2022), about one third of the mobile home residents are aged 65 and over. These statistics reinforce the explanation for the higher heat mortality rate among mobile home residents compared to other housing types.
The intersection of heat vulnerability among MMHC residents and the Sustainable Development Goals (SDGs), particularly Goal 3 – Good Health and Well-Being, and Goal 13 – Climate Action (United Nations, Citation2015), underscores the critical need for targeted interventions at the nexus of public health and environmental resilience where people experience extreme heat – their home residences. Achieving Goal 3 necessitates addressing the health implications of climate change, with a focus on vulnerable populations. Simultaneously, Goal 13 emphasizes the urgency of taking robust measures to combat climate change and its impacts. Indicator 13.1.1 specifically monitors the number of deaths and people directly affected by climate. Tracking such data is crucial for understanding the vulnerabilities to set effective strategies but collecting this data is a challenging step. In order to deploy certain solutions, it is imperative to have data regarding the precise number and geographical distribution of mobile homes and their corresponding jurisdictions. By making this population more visible on maps, policymakers can better allocate state and federal funds for weatherization initiatives, health outreach programs, housing sector improvements, and other essential interventions. This targeted approach ensures that resources are directed where they are most needed, fostering a comprehensive strategy aligned with the SDGs and promoting the health and resilience of mobile home communities. Effectively addressing the multifaceted challenges of MMHC communities necessitates the availability of geospatial parcel-level data which is crucial in tracking the SDG initiatives.
Yet, there is a notable gap in a complete and up to date inventory of MMHC. The open data available for MMHC (HIFLD, Citation2023) reveals inadequacies at the state level. Lack of comprehensive parcel-level data poses a significant obstacle in addressing context-specific heat vulnerabilities of MMHC residents. Given the idiosyncratic nature of ownership tenure within these communities, their parcel data remains notably elusive through conventional tax records or other publicly available sources. Many residents own their own home units (many of which are far from ‘mobile’) while they rent the land in a park that has a landlord owner, in a category that is unique to the US housing context, but resonates with marginalized housing situations in other parts of the world, such as ‘caravans’ and informal urban settlements, where make-shift or low-quality home structures likewise put populations at risk to hazards, including extreme heat. However, unlike many other locations, the tenure power relationships are unique in the US context, where the landlord owner is almost always visible in terms of parcel and tax data, but the legally rightful individual unit owners, and thus individual households, are often only partially or not at all represented in existing datasets, or even cartographies which often show a single polygon for many units under the park ownership. Our research has shown the many ways in which not being specifically visible has precipitated MMHC households from being left out of traditional solutions to heat vulnerability, such as utility assistance, tree programs, and public health outreach campaigns (Kear, et al., Citation2020; Phillips et al., Citation2021; Phillips & Guardaro, Citation2022). Therefore, there is an essential need to boost the speed and efficiency of humanitarian mapping workflows to identify and label MMHC on the map.
Volunteered geographic information (VGI) and machine learning models are candidates to revolutionize the manual process of detecting and classifying geographic features like individual household units in satellite imagery, significantly reducing human effort, and minimizing classifying errors compared to the traditional manual approach (Chen & Zipf, Citation2017; Chen et al., Citation2018; Kurath et al., Citation2017; Li, Herfort, Lautenbach, et al., Citation2022a; Pisl, Citation2021) VGI and machine learning can either collaborate synergistically or operate independently but the choice between leveraging these techniques hinges on the presence of a comprehensive and diverse initial dataset with ground truth data required for training the models (Chen et al., Citation2018; Li, Zech, Hong, et al., Citation2022b). Especially in scenarios where complexity, diversity and novelty of the objects are high, tremendous initial ground truth data is crucial to establish a foundational understanding of the objects and attributes.
MMHC cartographic attributes are complex and the layout of them are diverse that makes the classification particularly challenging. For example, MMHC is a cluster of buildings-either RVs or manufactured housing—where the number of units on a parcel can range from about ten to hundreds; Sometimes in satellite imagery they can look like to regular housing or warehouses; Sometimes the units are separated by distinct parcels, each with its own designated space and sometimes they are clustered closely together within a single parcel; The locations of MMHC within a region because of the potential of mobility or going inactive, are dynamic and subject to change in comparison to regular objects such as regular residential buildings. At the same time, there is a lack of significant labeled data for training machine learning models to generate reliable data for MMHC. Labeled data consist of images paired with corresponding labels or categories indicating the object each image represents. These labeled data are crucial to train the machine learning models for the accurate MMHC classification process. Due to the inherent variability of the appearance of MMHC that are less characteristic compared to the well-defined objects and, considering the absence of a ground truth dataset representing diverse examples of MMHC, our goal in this study is to measure the utility of VGI and crowdsourcing to bootstrap the MMHC ground truth generation.
2. Literature review
This study aims to measure how VGI could accelerate augmenting the existing rare MMHC cartographic detail available to ensure that marginalized populations are visible to solutions by way of cartographically making physical attributes of housing visible and more appropriately represented in maps. We evaluate how using MapSwipe – the Missing Maps crowdsourcing app – impacts the completeness and accuracy of MMHC map data. Our method initially uses MapSwipe’s micro-tasking approach to label MMHC (i.e. selecting the image tiles containing one or more MMHC) and then validates the labeled records of MapSwipe with other reference data. This study in particular addresses the question, could MapSwipe help us obtain a more complete dataset, quickly and accurately? Discovering MMHC data with this methodology could make it easier for National Statistics Offices (NSOs) to identify precise cost and locations of where to support SDG initiatives addressing extreme heat among housing precarious, less-visible populations.
MapSwipe is a unique mobile cartographic application that enables volunteers to learn quickly to contribute to mapping projects by swiping through satellite imagery and tagging features of interest. By leveraging the collective power of a diverse non-expert user base, MapSwipe seeks to support humanitarian efforts and development initiatives in vulnerable regions. As an innovative mobile volunteered mapping application designed at the University of Heidelberg’s Institute of Geoinformation Technology in collaboration with Missing Maps, the consortium of OSM users in the broader International Red Cross Red Crescent community (Betts, Citation2016; GIScienceblog, Citation2016; Scholz et al., Citation2018), MapSwipe aims to harness the power of crowdsourcing remotely to address local mapping challenges in disaster-prone areas.
To better understand how our use of MapSwipe fits into the landscape of research around the tool, we systematically searched for peer-reviewed articles over the period from 2016 to 2023 in academic databases, including PubMed, Google Scholar, and our own university library interface. This overview is thus relatively comprehensive and encompasses what we believe are nearly all studies conducted from the inception of MapSwipe in July 2016 until the present and given that the first published articles began appearing in 2016. To provide a framework of the key themes covered in the literature, we only included articles that referenced the actual MapSwipe tool, and not the word components in the name (for example, of course excluding articles about the visual swipe function when creating story maps). The literature can be categorized into four general areas of interest, which coincide with our own range of interests in utilizing this cartographic tool: (1) designing MapSwipe as a crowdsourcing technology, (2) developing spatial participation methods or crowd engagement with MapSwipe, (3) assessment of data quality from MapSwipe contributions and (4) conducting MapSwipe campaigns for end use humanitarian, disaster or development applications, including SDGs.
2.1. Designing MapSwipe as a crowdsourcing technology
Several studies have articulated the innovative design of MapSwipe for crowdsourcing in generating and analyzing geographic information. This set of articles discusses the ever-evolving technical characteristics for contributing data and improving mapping tools based on novel image classification techniques, sampling strategies, text, and labeling methods (Aggarwal, Citation2022; Archambault et al., Citation2019; Fraisl et al., Citation2022; Janik & Sankaran, Citation2022; Mocnik et al., Citation2019; Yang et al., Citation2018). As previewed by, some of the opportunities and challenges for remote sensing and machine learning have opened up new lines of research around MapSwipe focused on automatic feature detection and deep learning and neural networks (Chen et al., Citation2018; Kurath et al., Citation2017; Li, Herfort, Lautenbach, et al., Citation2022a; Li, Zech, Hong, et al., Citation2022; Li, et al. Citation2019; Pisl, Citation2021; Pisl et al., Citation2021). Recently, Li, Zech, Hong, et al. (Citation2022b) closed the loop studying how, in turn, VGI data created can be used as training data for new models. This technical design thread in the literature on MapSwipe also delves into user motivation strategies, such as gamification (Ulla, Lautenbach, Herfort, Schorlemmer, Citation2023; Watkinson et al., Citation2023) and methods for improving usability, integration and efficiency and to leverage the collective intelligence of the crowd (Khidhayir-Greco & Karlin, Citation2022; Lang et al., Citation2020; Oliveira et al., Citation2023; Popelka et al., Citation2022; Vargas Munoz et al., Citation2021).
2.2. Developing crowd engagement with MapSwipe
While much has been written about the OpenStreetMap ecosystem and volunteer mapping communities in general, only a few studies have made more than a brief mention of MapSwipe itself except as part of the evolution of the digital platform (Herfort et al., Citation2021). This category of the literature we review explores the advantages of mobile crowds in crowdsourcing geographic information, given MapSwipe as a uniquely mobile tool. The earliest such article we found by developers Albuquerque, Herfort, & Eckle (Citation2016) situated this tool within the larger OSM landscape, highlighting in particular early challenges of MapSwipe on engagement, related to tasking and task topologies, that continued to evolve in ensuing years as seen as both macro-tasks and micro-tasks (Prutzer, Citation2019; Sveen et al., Citation2020).
A surge of studies on spatial participation soon followed after MapSwipe’s broad adoption within the OSM community, largely centered on questions about its general engagement of individuals and communities (Dittus, Citation2017) and the way this unique socio-spatial online participation (Griesbaum et al., Citation2017) aims to make communities more visible (Schaad, Citation2017). The nature of MapSwipe as a remote and rapid cartographic tool elicited interesting research related to the context of open mapping (Herfort & Zipf, Citation2018; Müller et al., Citation2018), its community-led governance structure (Park et al., Citation2020) and the variable epistemologies of users in real-world, real-time contexts (Antoniou & Vassilakis, Citation2019; Fast, Citation2017; see also Solís & DeLucia, Citation2019).
2.3. Assessment of data quality from MapSwipe contributions
Making open mapping even more broadly available to mobile-phone-based users and easier to participate via its quick-learn approach, MapSwipe’s ‘democratization’ of the sources of humanitarian data contributions quickly raised concerns about data quality for real-world end uses (Herfort et al., Citation2017). This includes attention to assessing the results obtained for image classification (Herfort, Reinmuth, Albuquerque, & Zipf Citation2017; Herfort, Citation2018) as well as the spatial accuracy (Herfort et al., Citation2019) and feature completeness in an area of interest (Ullah et al., Citation2023). Because it also matters who makes maps in understanding dimensions of the interpretive quality of open spatial data (Solís et al., Citation2019), other researchers have asked insightful questions all along about the dynamic nature of internet access and the digital divide (Herfort et al., 2022; Thomas, Citation2017). The always-evolving technology landscape of open mapping tools implies that the question of data quality, in terms of completeness, consistency, and reliability of crowdsourced data, is mixed, and will also continue to evolve and grow, such as interpreting the quality of GeoAI as explainable (e.g. Morrison et al., Citation2023) and as trustworthy (Solís et al., Citation2020).
2.4. Conducting MapSwipe campaigns for end-use applications
Given its development as a way to ‘map the most vulnerable’ faster and more broadly, it is no surprise that in the limited literature dedicated to MapSwipe that several articles have explored the utility of this tool in disaster response and humanitarian aid operations, and these range across many goals of the SDGs. These studies showcase the potential of the application to rapidly assess affected areas, identify infrastructure damage, and even facilitate resource allocation. Research consistently emphasizes the importance of integrating MapSwipe with existing humanitarian platforms for efficient coordination and decision-making especially for rapid damage assessment, disaster risk reduction, and improving situational awareness in crisis situations (Badea et al., Citation2017; Danylo et al., Citation2018; Groß et al., Citation2023; Makri, Citation2017; Matin & Pradhan, Citation2021; McCosker et al., Citation2022). This same application in not-so-urgent contexts of climate change, conservation, citizen science and provision of public services among other uses has quickly become a subject of applied studies for MapSwipe (Alonso & Masot, Citation2018; Amerson, Citation2021; Bakos & Ballatore, Citation2017; Fritz et al., Citation2022; Keeley et al., Citation2017; Lopes, Citation2018; Moghadas et al., Citation2022; Mooney et al., Citation2018; Moorthy et al., Citation2019).
In our own use of the MapSwipe tool, we are interested in advancing some of the above literature and extending it in terms of data quality and trustworthiness (Solís et al., Citation2020), especially being able to evaluate the added value contribution of ‘data fusion’ (Karagiannopoulou et al. Citation2022), where we triangulate with other datasets to understanding how to complete missing data instead of assessing how complete the data would be in our area of interest (Ullah et al., Citation2023). We aim for a better understanding of the types and ranges of cartographic errors that need to be addressed in our application context. Further, we consider this the first published article on the engagement of MapSwipe with YouthMappers as a vibrant VGI community. YouthMappers are university students who are organized in campus-based chapters, creating new spatial data for humanitarian and development purposes (www.youthmappers.org; see Brovelli et al., Citation2019). As such, we hope to provide a unique example of a flipped contribution to the SDGs (Charley et al., Citation2022), where the end-use data in a high-GDP country is enhanced by the cartographic talents of volunteers from developing nations and beyond, and their insights and contributions are valued in a post-colonial context. Most importantly, we contribute to the literature on end-use cases for disaster applications, since we found no other studies that address extreme heat climate action as one of the hazard mitigation and response deployment capabilities for MapSwipe.
3. Case study
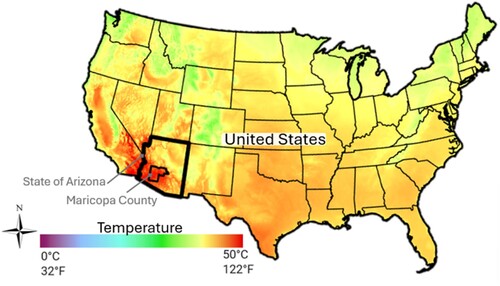
This study focuses on Arizona as a state renowned for the heat and desert environment where the intensity and frequency of extreme heat are increasing annually. Heat was responsible for 2429 mortality cases in Arizona between 2010 and 2020 (ADHS, Citation2023) and the number of heat deaths has increased annually. illustrates the mean daily maximum air temperature during the warmest month over a 30-year period from 1981 to 2010 in the United States. As shown on the map, Arizona’s extensive region experiences temperatures that frequently soar to 112°F (about 44.4°C), with occasional recordings of even higher temperatures, up to 119°F (about 48.3°C). also shows the position of Maricopa County within the state of Arizona encompassing the highest temperature compared to the northern part of the state. Maricopa County is an important region within Arizona, as it accounts for over half of the state’s population (about 4.5 million) residing in this hotspot. It is the nation’s fourth most populated and the fastest-growing county in the USA for the past decade (Census, Citation2024). For health-related data, Maricopa County provides accessible and reliable data generalizable into overall heat-related health challenges at the state level, in the absence of accessible data from other counties of the state, and other states in the USA.
Figure 1. Arizona, a hotspot known for intense heat within the U.S, 2023, showing mean daily maximum air temperature of the warmest month, 1981–2010. Arizona, United States (Source: Climatologist at High Resolution for the Earth’s Land Surface Areas (CHELSA)).
In a project focused on analyzing utility assistance networks and indoor heat death in Maricopa County, Arizona, it came to our attention that a substantial number of mobile home residents are not amongst the recipients of utility assistance. This raises a public health concern given that the noteworthy proportion of indoor heat deaths occur in that area. To reduce health risks associated with extreme heat, identifying the locations of mobile homes as the most vulnerable dwellings is critical. The existing public records and official documents related to mapping and zoning regulations do not provide complete data on the locations of MMHC. Mapping the locations of MMHCs is critical in order to identify the most vulnerable MMHCs and prioritize resource allocation for weatherization treatments and other assistance.
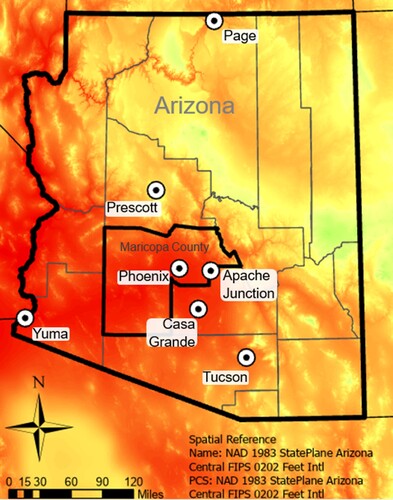
This study examines the effectiveness of employing a crowdsourcing approach through the MapSwipe app in identifying MMHC within the state of Arizona. For this study, we selected seven areas with high population density, geographically distributed across the entire state and located in areas with high heat exposure. As illustrated in , these urban areas include Phoenix, Apache Junction, Tucson, Casa Grande, Yuma, Page, Prescott.
Figure 2. Selected urban areas with high population density and high heat exposure, Arizona (CHELSA).
4. Datasets
We collected our data from (1) MapSwipe records (tiles estimated to contain MMHC); (2) HIFLD (Homeland Infrastructure Foundation-Level Data, a national-level open data repository for MMHC) and (3) high-resolution satellite imagery.
4.1. MapSwipe aggregated data
To collect data for MMHC, the mobile home project on MapSwipe app platform was initiated through collaboration between the authors and MapSwipe team. It is important to again emphasize that there is no predefined data available for MMHC on MapSwipe. To collect data for MMHC, we employed the MapSwipe platform to compile crowdsourced aggregated data through the contribution of thousands of volunteer mappers. So, the MapSwipe data collection relies on two key steps: (1) defining the MMHC project on the app and (2) a widespread call for the participation of volunteer mappers.
In this study, we defined seven individual projects on MapSwipe, each corresponding to one of the seven selected case studies within Arizona (illustrated in ). To collect data for each individual project, we called for the participation of 400+ YouthMappers chapters with over 5000 university student mappers in 75 countries (current extent at the time of manuscript submission). The number of contributors to each project ranged between 708 to 1,198. Further information about YouthMappers is provided in Section 2.4, (Conducting MapSwipe campaigns for end-use applications) of this study. To optimize the quality of data collection, as MapSwipe users are volunteer mappers with divergent levels of mapping skills and different knowledge about mobile homes, we provided a tutorial on MapSwipe to help them identify MMHC through satellite images. Doing so, we reviewed MMHC-related academic literature, commercial websites, and satellite imagery of the state of Arizona and sorted the examples for tutorials which cover the most common attributes entailing shape, size, orientation, density, and roof color.
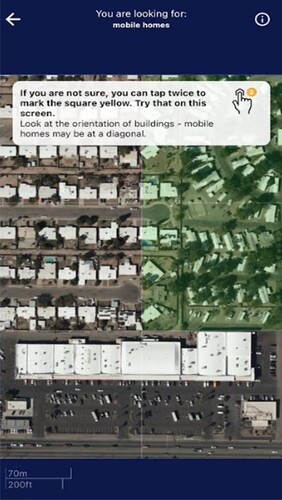
Through the smartphone app, users swipe the tiles of satellite images and tap the tiles where they recognize an MMHC. Data collected through the MapSwipe app is organized in the form of ‘tiles’ (also called ‘tasks’). MapSwipe divides satellite images into tiles of 256*256 pixels (about 24,000 m2), with a spatial resolution of 150 m. In total, these seven projects include 2,195,933 tiles. MapSwipe provides results at the tile level, where each individual tile receives contributions from at least three different users who classified them as ‘yes’ or ‘maybe’, or ‘no’. These individual contributions are aggregated using a majority voting approach. For example, if three out of five volunteer mappers classified a tile as ‘yes’, the aggregated class would be considered ‘yes’. As shown in , in other words, if they mark this tile green, the tile will generate aggregated data.
Figure 3. Mobile Home Project Interface on MapSwipe platform. The image shows the tutorial, where volunteer users are trained to distinguish MMHC from regular buildings and mark it green if it contains MMHC.
The aggregated data from all seven projects consists of 11,586 ‘polygons’, accessible in GeoJSON format from the MapSwipe website titled ‘HOT Tasking Manager geometries’ containing polygons that are ready to use in ArcGIS. Each polygon represents an outline or boundary of a set of tiles when at least 35% of users agreed to classify the tile as ‘YES’ and ‘Maybe’.
One of the challenges is to integrate MapSwipe aggregated data with HIFLD parcel-level data. MapSwipe-generated data is in the form of polygons and aggregated, meaning each polygon includes a range of zero to few MMHCs and does not necessarily correspond to an individual MMHC. In the data preparation section, we clarify how to address this heterogeneity between the format and granularity of MapSwipe and reference dataset.
4.2. HIFLD (reference dataset)
Homeland Infrastructure Foundation-level Data (HIFLD) also known as Homeland Security Infrastructure Program (HSIP) includes more than 455 National foundation-level geospatial data layers that cover national critical infrastructure for the USA and USA territories. The data layers support homeland security, homeland defense and their partners (including Federal Emergency Management Agency (FEMA) National Interagency Fire Center, etc.) for community resilience, response and recovery decision-making. At the moment of conceiving this project, HIFLD hosted the most complete and up to date open access feature class/shapefile containing locations of mobile home parks (equal to MMHC in this study) within the Continental United States and Alaska. In this study, we used the available version of data published on 17 September 2018, and updated on 26 May 2022, in the processing environment of Version 6.2 (Build 9200); Esri ArcGIS 10.8.1.14362. This file geodatabase feature class consists of 53,432 ‘points’ (not boundaries). Each point represents the approximate access location for a Mobile Home Park.
4.3. Satellite imagery
To validate the MapSwipe records and HIFLD records with ground truth data, we used high-resolution imagery available as a basemap in ArcGIS Pro 3.0.3.
5. Methodology
5.1. Data pre-processing
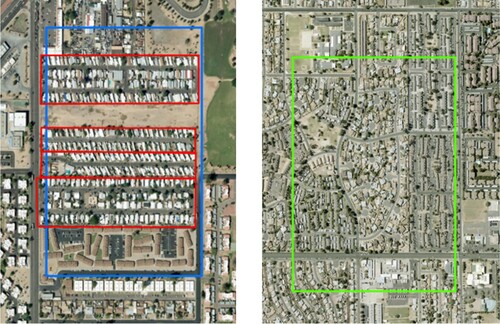
The workflow we describe in this section addresses the challenges of triangulating between crowdsourced data and other available datasets to generate high-quality MMHC cartographies. We first crosschecked the aggregated data of MapSwipe (11,586 GeoJSON polygon geometries) with the high-resolution satellite images in ArcGIS Pro to denote true-positive and false-positive polygons. As illustrated in , true-positive polygons refer to those set of tiles containing actual MMHC and false-positive polygons are misclassified tiles that do not include any actual MMHC. It is important to note that, in this study, to evaluate the accuracy of MapSwipe performance, we limit crosschecking to areas inside the MapSwipe-generated polygons, even if the reference dataset or basemap includes MMHCs outside of these polygons.
Figure 4. In the left picture, the blue polygon represents a true-positive result generated by MapSwipe. Inside the blue polygon, the red polygons indicate actual MMHCs (Mobile and Manufactured Home Communities) that the authors identified and digitized during crosschecking with the ArcGIS basemap. The right picture illustrates an example of a false-positive polygon generated by MapSwipe.
Considering that the goal of this study is to examine the performance of MapSwipe in identifying MMHC, we should be able to evaluate the data collected from MapSwipe against the reference dataset. To achieve this, it is necessary to equalize the granularity of both datasets, ensuring that they are at the same level of detail. This process allows for an accurate comparison between the two datasets and helps to assess the reliability and effectiveness of MapSwipe in identifying MMHCs. Moreover, by crosschecking the HIFLD data with satellite imagery, the study aimed to ensure the reliability and accuracy of the MMHC locations in HIFLD as the reference dataset. This validation step is crucial for confirming the quality of the dataset and enhancing the credibility of the study's findings. In this step, one of the authors validates the aggregated results of MapSwipe by manually crosschecking each MapSwipe-generated polygon with the ArcGIS basemap. If the author identifies a mobile home park within or intersecting the MapSwipe polygons, they digitize its boundaries. The result of this crosschecking process prepares a parcel-level dataset for MMHCs, which is comparable in granularity to the HIFLD dataset. The MapSwipe-generated polygons in this study cover approximately 20% of the original study area. Consequently, the total time required for crosschecking and preparing a clean parcel-level dataset from the aggregated results has been about 20% of the time needed for manual mapping of the entire study area in the absence of MapSwipe.
5.2. Data evaluation
We evaluated our method in generating MMHC data through comparing the quality of MapSwipe data against the HIFLD reference data. Initially, we derived a confusion matrix to measure false-positive (FP), false-negative (FN), true-positive (TP) and true-negative (TN) values. TP and TN indicate that there is an agreement between the selected and actual classes while FP and FN refer to disagreement between selected and actual classes. In this study, MapSwipe data show an imbalance in the proportion of false positives and true positives, with a higher prevalence of false positives. This result was expected, as our tutorial aimed to ensure that no mobile home park was missed. We encouraged volunteer mappers to mark every potential MMHC, even in cases where they were uncertain. It is to note that the results of using MapSwipe for MMHC detection have to be discussed under a premise that detecting MMHC due to variability in their appearance is a harder task for volunteers compared to base mapping (e.g. finding a building or a road within a tile of satellite imagery), which is the original intent of MapSwipe. Thus, we were expecting a relatively high prevalence of false positives in the results.
We evaluated the performance of crowdsourced classification using usual metrics in image classification including Sensitivity (SNS), Accuracy (ACC), and F1 score. Sensitivity measures the ability of MapSwipe to identify all true positives within the area of study, making it a key metric in this study. Sensitivity is the ratio of correctly classified positives (TP) to all actual positive observations (TP+FN). We used F1 in this study to ensure we consider both true positives and false negatives. Measure F1 is the harmonic mean between Sensitivity (ratio of TP to ‘actual’ positives) and Precision (ratio of TP to ‘predicted’ positives). Considering that F1 score focuses more on classification successes, not errors, we also used Accuracy (ACC), which is the ratio of both TP and TN to all predictions to have a more comprehensive understanding of overall performance of MapSwipe in MMHC detection.
shows the descriptions of metrics and how they are formulated. SNS, ACC and F1 are scaled between 0 and 1 and they are used to compare the results of MapSwipe with the reference data and ground truth checks by authors in the previous step. MCC serves as a quality indicator for classification ability. In this study we expected to see the MCC result exclusively in the areas where negative results were identified in the comparison between MapSwipe and the reference dataset.
Table 1. Metrics to assess MapSwipe performance.
6. Results
6.1. Performance assessment
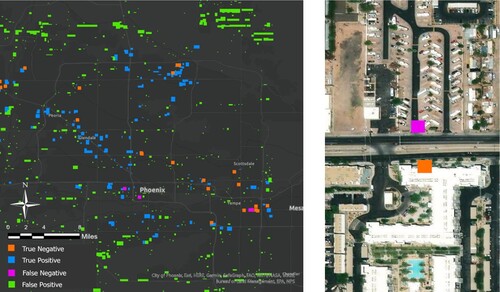
In this study, we had to deal with imbalanced proportions of high positive results obtained from MapSwipe and low true-negative instances from the only available reference dataset as it is supposed to contain only positive results. highlights the spatial distribution of the confusion matrix on the map for Phoenix city serving as a representative example for all seven selected urban areas. The higher proportion of blue and green squares compared to pink and orange squares confirms the imbalanced characteristic of the dataset. The right picture of shows false-negative instances (pink squares), where MapSwipe failed to recognize an existing Mobile Home Community (MMHC), and true-negative instances (orange squares), where MapSwipe correctly disregarded the absence of an MMHC due to changes in land use.
Figure 5. Spatial distribution of a confusion matrix in the city of Phoenix. The colored square on the right picture from the HIFLD dataset shows examples of true-negative (orange color) and false-negative (pink color) results of MapSwipe.
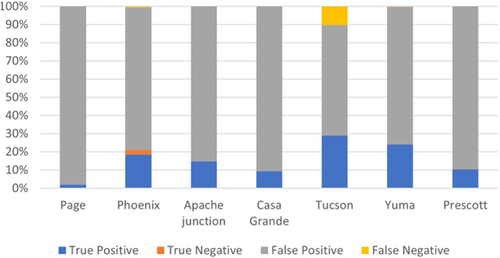
As illustrated in , the spatial representation of the confusion matrix individually for each seven projects depicts an imbalanced dataset with the positive results significantly dominating negative results.
Figure 6. Distribution of confusion matrix over seven urban areas.
shows the results of MapSwipe performance evaluations for each of the seven urban areas within Arizona for all seven case studies, MapSwipe performed best with respect to Sensitivity. the sensitivity is remarkably high (83.6-100%) meaning that the MapSwipe results were able to correctly capture most ground truth (MMHC-included tiles) and positive outcomes of reference data. The accuracy or true-positive rate (9–28%) as expected by the spatial distribution of the confusion matrix, confirms that the false positives are the major performance drawback of MapSwipe that needs to be improved. It means that on average 9–28% of all selected tiles by the users include actual mobile home parks. This result could be improved by adjusting the threshold of agreement of the users to a higher degree or improvements in the tutorial.
Table 2. MapSwipe classification performance results.
F1 score (0.04–0.44) confirms that MapSwipe users were more likely to select tiles which do not include MMHC (false positives), than to miss a mobile home. However, the results suggest that the reliability of the F1 score is more significant in urban areas with a better balance between positive and negative instances (TP and FN). This metric also shows notably higher F1 scores in the larger and more populated urban areas (e.g. Tucson, Phoenix and Yuma). Respectively, Page, Casa Grande and Prescott with lower populations containing extended unoccupied desert show the lower F1 score. This is a noteworthy result that needs to be investigated further, particularly to understand the effect of spatial and non-spatial characteristics of urban areas on the rate of false-positive misclassification. In general, the results show a reasonable performance.
6.2. MapSwipe data fusion
This section evaluates the overall contribution of our approach to identifying MMHC and assesses the proportion of data that MapSwipe could add to the existing repository. In data preparation step (section 5.1), to address the heterogeneity issue of datasets, the authors digitized the boundaries of each individual MMHC identified by MapSwipe aggregated results. Some of these identified MMHC were already present in the reference data, while others were added to the MMHC repository which represents a significant outcome of this study.
Within the seven case studies, MapSwipe detected 1350 MMHC while HIFLD identified 1043 MMHC and the common MMHC in both datasets equals 977 MMHC. MapSwipe's coverage overlaps by 94% with HIFLD's MMHC meaning that MapSwipe has successfully identified the majority of MMHC already present in the HIFLD dataset. Crosschecking with satellite imagery revealed that from 6% of HIFLD data that MapSwipe failed to detect, about half of them were inactive mobile home parks transformed to vacant lands and other land uses or it was due to redundancy (i.e. when two points were used to represent a singular Mobile home park) in HIFLD. This result validates the true positives and true-negative results of MapSwipe respectively. Moreover, by identifying 373 additional MMHCs not previously included in HIFLD, MapSwipe significantly enhances the MMHC repository.
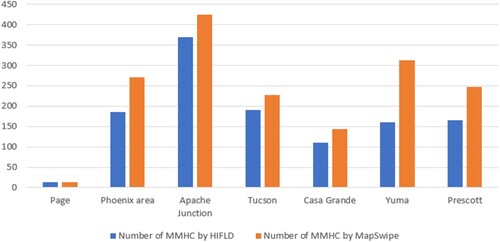
displays the number of MMHC identified by MapSwipe and HIFLD individually for each case study. This graph shows that in all case studies except for the city of Page (in Page MMHC identified by both datasets are equal), MapSwipe added to the number of existing MMHC. It highlights that MapSwipe added the most to the existing MMHC repository, in the city of Yuma. This is an interesting result because the form of many MMHC in Yuma differs slightly from those in other case studies, with many MMHC in the city of Yuma being notably larger. This result points out the importance of including local variations of MMHC in future classification models’ training to accurately capture the diversity of MMHC across different regions.
Figure 7. Number of MMHC identified by MapSwipe and HIFLD individually for each case study.
7. Discussion
The classification performance of MapSwipe in this study achieved high sensitivity and moderately low accuracy derived from a dataset characterized as imbalanced. The low-to-medium level of accuracy in this study was expected, due to the level of complexity of locating MMHC compared to finding a single building. In addition, the results show a high rate of false positives. However, these false positives could serve as additional data to address an existing data gap in using machine learning techniques to identify MMHC. This data augmentation resulted from leveraging MapSwipe in MMHC detection in our study, positively impacting the training of the machine learning models, which accelerated the process of identifying vulnerable communities susceptible to extreme heat. We identified a lower error coefficient in the most populated urban areas (Phoenix and Tucson) where MMHC morphologies closely resemble the tutorial provided for the volunteer users. False positives are observed higher in the areas where the project is less occupied (Page, Prescott, Casa Grande). Moreover, the completion time of each project (each project refers to each of the urban areas defined as an individual project on MapSwipe) is significantly shorter between the first and last project. The novelty of this approach lies in its ability to speed up completing MMHC map datasets in the absence of adequate reliable ground truth and addressing the complexity associated with MMHC detection. Unlike manually investigating satellite images covering an entire urban area, MapSwipe filters the area into smaller and more manageable tiles of satellite imagery. This segmentation allows for a more focused and efficient process of MMHC detection. As a result, the approach facilitates the utilization of crowdsourced methods into existing incomplete MMHC dataset to generate comprehensive MMHC maps and accelerating the mapping and cartography processes. The results of this project confirm that a substantial number of mobile and manufactured home communities were absent from HIFLD, which is considered the most comprehensive, up-to-date, and reliable open data source for mobile homes.
This study reveals that leveraging MapSwipe speeds up the process of identifying missing MMHC on the map and saves a considerable time compared to manual digitization approaches. Crowdsourcing covers detecting the entire state while the authors only validate the results from MapSwipe, which is about 10–25% of the entire state. Considering that each project takes between 8 and 15 h for crosschecking per experienced mapper, the total hours for cleaning up the results of seven projects were about 80 h on average. The cleaning and validation process confirms that MapSwipe contributions speed up these cartographic tasks to 4–10 times the number of hours required for manual mapping and validation methods.
8. Conclusion
As demanded by the 2030 Agenda for Sustainable Development, member states need to undertake new data acquisition and integration approaches to generate high-quality, timely, reliable, and disaggregated data. The United Nations has recognized that baseline data for many targets remains unavailable and they call for increased support to data collection in Member States (United Nations, Citation2015). We add that spatial data itself, how it was collected, and the cartographic representations of that data, matter a great deal. Our study that makes visible the prevalence of heat-related illnesses and deaths in manufactured and mobile home communities in Maricopa County, Arizona, USA presents significant public health concerns where we need to act quickly, and we do not want to miss anyone at risk. In the context of a warming climate, this case will certainly resonate with other places of the world experiencing extreme heat at the same time as populations are suffering from insufficient housing to provide cool shelter. MapSwipe has proven to be a useful ancillary tool for fusing accurate and context-specific data of MMHC, particularly when our goal is to incorporate the most vulnerable and exposed populations, previously invisible, into new climate solutions.
As the first study to use MapSwipe as a tool in the case of heat resilience, our research underscores the value of employing crowdsourcing methods to address the challenges associated with incomplete and heterogeneous geospatial data in humanitarian and disaster research. We aim in future research to deploy the results of this study to train the deep learning models where a large amount of classified data are needed to measure heat vulnerability and level of connectivity of MMHC to heat mitigation solutions, advancing the SDGs 3 and 13. This experience of classifying MMHC data of the state of Arizona, could be generalized to other areas of housing precarity (informal settlements in cities where extreme heat is a climate peril) and be directly applied as training data in semi-automated models for classifying the MMHC of other states of the USA and other countries of the world which are expected to increasingly experience high temperatures as climate change progresses. Moreover, results could train deep learning models where a large amount of classified data is needed to measure heat vulnerability and level of connectivity of MMHC to the locations where heat mitigation solutions should be prioritized. Considering the needs of international humanitarian organizations in getting information on missing vulnerable communities for which no other reliable data sets exist, our approach could be adapted in real practice for any communities around the world experiencing risks of a changing climate. Comparing different sites around the globe, and the cartographic representation of informal settlements, caravan parks, or other housing that is insufficient to protect from extreme heat, can also illustrate the range of risks as well as the range of necessary solutions. The crowdsourcing dimension of our work, including the extensive network of YouthMappers in 75 countries, could generate optimal initial datasets required to train machine learning models to identify and classify vulnerable communities with unique and complex spatial and non-spatial characteristics.
Revised Manuscripts_2nd version_tracked changes.docx
Download MS Word (5 MB)Respond to the comments_2nd.docx
Download MS Word (24.2 KB)Authors bio.docx
Download MS Word (14.6 KB)Acknowledgements
The ASU Knowledge Exchange for Resilience is supported by Virginia G. Piper Charitable Trust. Piper Trust supports organizations that enrich health, well-being, and opportunity for the people of Maricopa County, Arizona. The conclusions, views and opinions expressed in this article are those of the authors and do not necessarily reflect the official policy or position of the Virginia G. Piper Charitable Trust.
The United States Agency for International Development supports the YouthMappers program through a grant from the USAID GeoCenter under Award #AID-OAA-G-15-00007 and Cooperative Agreement Number: 7200AA18CA00015. Views expressed in this article do not necessarily reflect the policies and viewpoints of the agency or its employees. YouthMappers® is a registered trademark [Reg. No. 5.203.611, U.S. Patent and Trademark Office, Class 41, Ser. No. 87-165,163, 2033.]
Disclosure statement
No potential conflict of interest was reported by the author(s).
Additional information
Funding
Notes on contributors
Maryam Shafiee Shakib
Maryam Shafiee Shakib is a graduate research assistant of the Knowledge Exchange for Resilience at Arizona State University. She is a PhD student in Geography at School of Geographical Sciences and Urban Planning, Arizona State University. She earned her BA in Architecture and MA in Urban Design from Iran and MA in Urban and Environmental Planning from Arizona State University. Maryam Shakib’s research explores geographic information sciences and geospatial information processing with a focus on water-energy nexus and community resilience.
Patricia Solís
Patricia Solís is Executive Director of the Knowledge Exchange for Resilience at Arizona State University, an interdisciplinary effort to link multi-sector community needs with research innovations around resilience to economic shocks, social disruption, and environmental threats. She is an Associate Research Professor of Geography in the School of Geographical Sciences and Urban Planning. Her expertise centers on the application of participatory geospatial technologies for humanitarian, environment and development needs and to address the impacts of climate change on vulnerable communities, especially at the intersection of extreme heat, precarious housing, and health. She is co-founder and director of YouthMappers, a consortium of student-led humanitarian mapping chapters on 388 university campuses in 74 countries. The program creates and uses open, volunteered spatial data in collaboration with USAID. Solís also serves a diplomatic appointment as President of the PanAmerican Institute of Geography and History of the Organization of American States, and was on the Fulbright Roster of Experts. She earned her BA in German, BS in Physics and MA in Geography from Kansas State University and her PhD in Geography from the University of Iowa with a Presidential Fellowship.
Kate Varfalameyeva
Kate Varfalameyeva is a research specialist at Knowledge Exchange for Resilience at Arizona State University. With a background in Urban and Environmental Planning from the School of Geographical Sciences and Urban Planning, her research focus on climate change and affordable housing.
References
- ADHS. (2023). All-hazard emergency response plan by Arizona Department of Health Services Preparedness Office. https://www.azdhs.gov/documents/preparedness/emergency-preparedness/response-plans/all-hazard-erp-2023.pdf.
- Aggarwal, S. (2022). SATLAB – an end to end framework for labelling satellite images.
- Albuquerque, J. P. D., Herfort, B., & Eckle, M. (2016). The tasks of the crowd: A typology of tasks in geographic information crowdsourcing and a case study in humanitarian mapping. Remote Sensing, 8(10), 859.
- Alonso, G. C., & Masot, A. N. (2018). Herramientas SIG Web como medio de difusión turística. Sistemas de información geográfica y teledetección: aplicaciones en el análisis territorial ISBN 9788409037490.
- Amerson, R. (2021). Striving to meet global health competencies without study abroad. Journal of Transcultural Nursing, 32(2), 180–185. https://doi.org/10.1177/1043659620953194
- Antoniou, V., & Vassilakis, E. (2019). Diffusion of geo-environmental datasets through online interactive and real-time applications. Case study: The tatura GR2440006 protected area. Annals of Geographical Studies, 2(1), 8–16.
- Archambault, D., Nabney, I., & Peltonen, J. (2019). Interpreting black-box semantic segmentation models in remote sensing applications. https://bit.ly/3XOVmrg.
- Arizona Republic. (2020). Self-isolating from COVID-19 in a mobile home? That could be deadly in Arizona. Solís P, Kear M, Wilder M, Hondula D, & Bernstein M. https://bit.ly/2WsytKN.
- Badea, A. C., Badea, G., Iliescu-Cremeneanu, A., & Vasilca, D. (2017). Webapp for highlight changes due to natural disasters. International Multidisciplinary Scientific GeoConference: SGEM, 17, 861–866.
- Bakos, G., & Ballatore, A. (2017). Estimating population distribution with landsat imagery & volunteered geographic information, University of London. https://bit.ly/3pK5wNh.
- Betts, B. (2016). Software reviews: Mapping the mobile. Engineering & Technology, 11(9), 82–83. https://doi.org/10.1049/et.2016.0927
- Brovelli, M. A., Ponte, M., Shade, S., & Solís, P. (2019). Citizen science in support of digital earth. In H. Guo, M. Goodchild, & A. Annoni (Eds.), Manual of digital earth (pp. 593–622). International Society for Digital Earth. Springer. https://doi.org/10.1007/978-981-32-9915-3
- Brown, M. A., Soni, A., Lapsa, M. V., Southworth, K., & Cox, M. (2020). High energy burden and low-income energy affordability: Conclusions from a literature review. Progress in Energy, 2(4), 042003.
- Census. (2024). Maricopa County quick facts. United States Census Bureau. https://www.maricopa.gov/3598/County-Quick-Facts.
- Charley, E., Varfalameyeva, K., Alsanad, A., & Solís, P. (2022). Mapping for resilience: Extreme heat deaths and mobile homes in Arizona. In Open Mapping towards sustainable development goals: Voices of youthmappers on community engaged scholarship (pp. 241–249). Springer International Publishing.
- Chen, J., Zhou, Y., Zipf, A., & Fan, H. (2018). Deep learning from multiple crowds. IEEE Transactions on Geoscience and Remote Sensing, 57(3), 1713–1722. https://doi.org/10.1109/TGRS.2018.2868748
- Chen, J., & Zipf, A. (2017). DeepVGI: Deep learning with volunteered geographic information. In Proceedings 26th International Conference on WWW Companion, 771–772.
- Danylo, O., Moorthy, I., Sturn, T., See, L., Laso Bayas, J.-C., Domian, D., Fraisl, D., Giovando, C., Girardot, B., & Kapur, R. (2018). The picture pile tool for rapid image assessment: A demonstration using hurricane Matthew. ISPRS Annals of the Photogrammetry, Remote Sensing and Spatial Information Sciences, 4, 27–32.
- Dittus, M. S. (2017). Analysing volunteer engagement in humanitarian crowdmapping [PhD dissertation]. University College London https://core.ac.uk/download/pdf/141199794.pdf
- Fast, L. (2017). Diverging data: Exploring the epistemologies of data collection & use among those working on & in conflict. International Peacekeeping, 24(5), 706–732. https://doi.org/10.1080/13533312.2017.1383562
- Fraisl, D., See, L., Sturn, T., MacFeely, S., Bowser, A., Campbell, J., Moorthy, I., Danylo, O., McCallum, I., & Fritz, S. (2022). Demonstrating the potential of picture pile as a citizen science tool for SDG monitoring. Environmental Science & Policy, 128, 81–93. https://doi.org/10.1016/j.envsci.2021.10.034
- Fritz, O., Marx, S., Herfort, B., Kaiser, S., Langer, M., Lenz, J., Thiel, C., & Zipf, A. (2022). Das Potenzial von Citizen Science für die Kartierung von Landschaftsveränderungen in arktischen Perma-frostregionen. AGIT-J Angwt Geoinformatik, 8, 30–40.
- Gabbe, C. J., & Pierce, G. (2020). Extreme heat vulnerability of subsidized housing residents in California. Housing Policy Debate, 30(5), 843–860. https://doi.org/10.1080/10511482.2020.1768574
- Giscienceblog. (2017). https://bit.ly/43nwtUM.
- Griesbaum, L., Eckle, M., Herfort, B., Raifer, M., & Zipf, A. (2017). Online participation in geoinformation technology: The example of OpenStreetMap. HMD Praxis der Wirtschaftsinformatik, 54(4), 563–574. https://doi.org/10.1365/s40702-017-0331-4
- Groß, S., Herfort, B., Marx, S., & Zipf, A. (2023). Exploring MapSwipe as a crowdsourcing tool for (rapid) damage assessment: The case of the 2021 Haiti earthquake. AGILE: GIScience Series, 4, 1–11. https://doi.org/10.5194/agile-giss-4-5-2023
- Herfort, B. (2018). Understanding MapSwipe: Analysing data quality of crowdsourced classifications on human settlements (Master's thesis). https://doi.org/10.11588/heidok.00024257
- Herfort, B., Eckle, M., Reinmuth, M., deWitte, P., & Masters, P. (2017). The democratisation of humanitarian mapping: insights into the MapSwipe app & data quality. F1000Research 6.893.
- Herfort, B., Reinmuth, M., De Albuquerque, J. P., & Zipf, A. (2017). Towards evaluating crowdsourced image classification on mobile devices to generate geographic information about human settlements. Proceedings of the 20th AGILE, 1–7.
- Herfort, B., Lautenbach, S., Porto de Albuquerque, J., Anderson, J., & Zipf, A. (2021). The evolution of humanitarian mapping within the OpenStreetMap community. Scientific Reports, 11(1), 3037. https://doi.org/10.1038/s41598-021-82404-z
- Herfort, B., Li, H., Fendrich, S., Lautenbach, S., & Zipf, A. (2019). Mapping human settlements with higher accuracy & less volunteer efforts by combining crowdsourcing & deep learning. Remote Sensing, 11(15), 1799. https://doi.org/10.3390/rs11151799
- Herfort, B., & Zipf, A. (2018, December 15). Enhancing crowdsourced classification on human settlements utilizing logistic regression aggregation & intrinsic context factors. Absts 21th AGILE Conference.
- HIFLD. (2023). Mobile home parks open data, homeland infrastructure foundation-level data. https://hifld-geoplatform.opendata.arcgis.com/datasets/geoplatform::mobile-home-parks/about.
- Janik, A., & Sankaran, K. (2022). Sampling strategy for fine-tuning segmentation models to crisis area under scarcity of data. arXiv preprint arXiv:2202.04766.
- Karagiannopoulou, A., Tsertou, A., Tsimiklis, G., & Amditis, A. (2022). Data fusion in earth observation and the role of citizen as a sensor: A scoping review of applications, methods and future trends. Remote Sensing, 14(5), 1263.
- Keeley, K., Kurtz, E., Li, L., Waisanen, E., Xin, Y., & Zhang, F. (2017). Supporting conservation & decision-making in the Northwoods [MS Thesis]. University of Michigan. https://hdl.handle.net/2027.42/136554
- Khidhayir-Greco, S., & Karlin, A. (2022). GIS tips & tricks – visualizing two raster layers simultaneously is just A swipe away. Photogrammetric Engineering & Remote Sensing, 88(8), 498–499.
- Kurath, S., Gupta, R. D., & Keller, S. (2017). OSMDeepOD-Object detection on orthophotos with & for VGI. GI Forum, 2(2), 173–188.
- Lang, S., Füreder, P., Riedler, B., Wendt, L., Braun, A., Tiede, D., Schoepfer, E., Zeil, P., Spröhnle, K., & Kulessa, K. (2020). Earth observation tools & services to increase the effectiveness of humanitarian assistance. European Journal of Remote Sensing, 53(2), 67–85. https://doi.org/10.1080/22797254.2019.1684208
- Li, H., Herfort, B., Lautenbach, S., Chen, J., & Zipf, A. (2022a). Improving OpenStreetMap missing building detection using few-shot transfer learning in sub-Saharan Africa. Transactions in GIS, 26(8), 3125–3146. https://doi.org/10.1111/tgis.12941
- Li, H., Herfort, B., & Zipf, A. 2019. Estimating OpenStreetMap missing built-up areas using pre-trained deep neural networks. Proceedings of 22nd AGILE Conference, 17–20.
- Li, H., Zech, J., Hong, D., Ghamisi, P., Schultz, M., & Zipf, A. (2022b). Leveraging OSM & multimodal remote sensing data with joint deep learning for wastewater treatment plants detection. International Journal of Applied Earth Observation and Geoinformation, 110, 102804.
- Lopes, F. V. (2018). A informação internacional em sistemas integrados: reflexões sobre a Tríplice Fronteira Amazônica. 129 f. Dissertação (Mestrado em Sociedade e Cultura na Amazônia) – Universidade Federal do Amazonas, Manaus.
- Makri, A. (2017). Emergency mapping app finds vulnerable faster. SciDev.net.
- Maricopa County Public Health Department (MCPHD), Division of Epidemiology and Informatics. (2024). 2023 Heat Related Deaths Report https://www.maricopa.gov/ArchiveCenter/ViewFile/Item/5796.
- Matin, S. S., & Pradhan, B. (2021). Earthquake-induced building-damage mapping using explainable AI (XAI). Sensors, 21(13), 4489. https://doi.org/10.3390/s21134489
- McCosker, A., Shaw, F., Calyx, C., Kang, Y. B., & Albury, K. (2022). Mapping community resources for disaster preparedness: Humanitarian data capability & automated futures. Analysis & Pol Observation, https://doi.org/10.25916/dpb7-5118
- Mocnik, F. B., Ludwig, C., Grinberger, A. Y., Jacobs, C., Klonner, C., & Raifer, M. (2019). Shared data sources in the geographical domain. ISPRS International Journal of Geo-Information, 8(5), 242. https://doi.org/10.3390/ijgi8050242
- Moghadas, M., Rajabifard, A., Fekete, A., & Kötter, T. (2022). A framework for scaling urban transformative resilience through utilizing volunteered geographic information. ISPRS International Journal of Geo-Information, 11(2), 114. https://doi.org/10.3390/ijgi11020114
- Mooney, P., Crompvoets, J., & Lemmens, R. (2018). Crowdsourcing in national mapping. European Spatial Data Research Network Workshop Report https://bit.ly/3Of0MJ1.
- Moorthy, I., Sturn, T., Batic, M., See, L., Milčinski, G., & Fritz, S. (2019). Improving cloud detection in satellite imagery using a citizen science approach. In Digital earth observation.
- Morrison, K., Shin, D., Holstein, K., & Perer, A. (2023). Evaluating the impact of human explanation strategies on human-AI visual decision-making. Proceedings of the ACM Human-Computer Interaction, 7CSCW1.Jan-37.
- Müller, S. K., Tekin, C., van der Schaar, M., & Klein, A. (2018). Context-aware hierarchical online learning for performance maximization in mobile crowdsourcing. IEEE/ACM Transactions on Networking, 26(3), 1334–1347. https://doi.org/10.1109/TNET.2018.2828415
- Oliveira, E., Carvalho, D., Ramos, F., Pedro, L., Antunes, M. J., Almeida, M., & Tymoshchuk, O. (2023). Prototyping a digital platform to promote (hyper)mediation practices in the territory. Government, Technology & Sustainability, 163–180.
- Park, C. H., Longo, J., & Johnston, E. W. (2020). Exploring non-state stakeholder & community-led open governance. Public Performance & Management Review, 43(3), 587–612.
- Phillips, L. A., & Guardaro, M. (2022). Mobile homes have a major climate change problem. Slate http://bit.ly/3hxJvfS.
- Phillips, L. A., Solís, P., Wang, C., Varfalameyeva, K., & Burnett, J. (2021). Engaged convergence research: An exploratory approach to heat resilience in mobile homes. The Professional Geographer, 73(4), 619–631. https://doi.org/10.1080/00330124.2021.1924805
- Pisl, J. (2021). Automatic detection of human settlements in rural sub-Saharan Africa from satellite imagery with convolutional neural networks & OpenStreetMap. http://urn.fi/URN:NBN:fi:aalto-202103212388.
- Pisl, J., Li, H., Lautenbach, S., Herfort, B., & Zipf, A. (2021). Detecting OpenStreetMap missing buildings by transferring pre-trained deep neural networks. AGILE: GIScience Series, 2, 1. https://doi.org/10.5194/agile-giss-2-39-2021
- Popelka, S., Burian, J., & Beitlova, M. (2022). Swipe versus multiple view: A comprehensive analysis using eye-tracking to evaluate user interaction with web maps. Cart & GIScience, 49(3), 252–270.
- Prutzer, N. (2019). The mapping crowd: Macrotask crowdsourcing in disaster response. Macrotask Crowdsourcing: Engaging the Crowds to Address Complex Problems, 253–275. https://doi.org/10.1007/978-3-030-12334-5_10
- Schaad, R. (2017). Visible communities: Designing a socio-spatial map [MS Thesis]. MIT https://bit.ly/3rjD4C8
- Scholz, S., Knight, P., Eckle, M., Marx, S., & Zipf, A. (2018). Volunteered geographic information for disaster risk reduction. Remote Sensing, 10(8), 1239. https://doi.org/10.3390/rs10081239
- Solís, P., & DeLucia, P. (2019). Exploring the impact of contextual information on student performance & interest in open humanitarian mapping. The Professional Geographer, 71(3), 523–535. https://doi.org/10.1080/00330124.2018.1559655
- Solís, P., Li, W., Amresh A., & Turega P. K. (2020). Trustworthy GeoAI for resilience: A multi-sector conceptual framework & research agenda [White Paper). ASU-KER. bit.ly/trustworthygeoai.
- Solís, P., Varfalameyeva, K., & Hernandez, C. A. (2023). Heat resilience among mobile home owners in Arizona: towards a multi-scale approach to address spatial incongruence and accountable decision making. GeoJournal, 88(5), 4991–5012. https://doi.org/10.1007/s10708-023-10896-5
- Solís, P., Warren, S., Harris, T. M., Goodchild, M. F., & Solís, P. (2019). Commentaries on “evaluating the geographic in GIS”. Geographical Review, 109(3), 308–320. https://doi.org/10.1111/gere.12359
- Sveen, A. F., Erichsen, A. S. S., & Midtbø, T. (2020). Micro-tasking as a method for human assessment and quality control in a geospatial data import. Cartography and Geographic Information Science, 47(2), 141–152. https://doi.org/10.1080/15230406.2019.1659187
- Thomas, C. (2017). Evaluating ICT usage in humanitarian response [MS Thesis]. California State Univ. scholarworks.calstate.edu for the website.
- Ullah, T., Lautenbach, S., Herfort, B., Reinmuth, M., & Schorlemmer, D. (2023). Assessing completeness of OpenStreetMap building footprints using MapSwipe. ISPRS International Journal of Geo-Information, 12(4), 143. https://doi.org/10.3390/ijgi12040143
- Ullah, T., Lautenbach, S., Herfort, B., & Schorlemmer, D. (2023). Assessing completeness of OpenStreetMap building footprints using a gamification approach in MapSwipe. ISPRS International Journal of Geo-Information, 12(4), 143.
- United Nations. (2015). Resolution adopted by the general assembly on 25 September 2015.
- United Nations. (2015). Transforming our world: The 2030 agenda for sustainable development https://sdgs.un.org/sites/default/files/publications/21252030%20Agenda%20for%20Sustainable%20Development%20web.pdf.
- U.S. Census Bureau. (2022). Household pulse survey data. https://www.census.gov/programs-surveys/household-pulse-survey/data/tables.2022.html#list-tab-404305343.
- Vargas Munoz, J. E., Tuia, D., & Falcão, A. X. (2021). Deploying machine learning to assist digital humanitarians. Intl J of GIScience, 35(9), 1725–1745.
- Watkinson, K., Huck, J. J., & Harris, A. (2023). Using gamification to increase map data production during humanitarian volunteered geographic information (VGI) campaigns. Cart & GIScience, 50(1), 79–95.
- Yang, L., MacEachren, A. M., Mitra, P., & Onorati, T. (2018). Visually-enabled active deep learning for (geo) text & image classification. ISPRS International Journal of Geo-Information, 7(2), 65. doi:10.3390/ijgi7020065