
Abstract
Background
COVID-19 has a most variable prognosis. Several risk factors for an unfavourable outcome have been identified including extensive lung involvement on chest CT and high viral load estimated by RT-PCR cycle threshold (Ct) values. We investigated Ct value for outcome prediction, relation between Ct value and extent of lung involvement on chest CT and the combination of Ct value and chest CT lung involvement to predict outcome in COVID-19.
Methods
Population-based retrospective study on all patients (n = 286) hospitalised for COVID-19 in Örebro Region, Sweden, between 1 March and 31 August 2020. Nasopharyngeal samples and chest CT at hospital admission were evaluated in relation to outcome of COVID-19.
Results
Both Ct value and chest CT lung involvement were independently associated with risk for ICU admission or death. Lung involvement was superior as a single parameter, but addition of Ct value increased the prediction performance. Ct value was especially useful to identify patients with high risk for severe disease despite limited lung involvement.
Conclusions
The addition of RT-PCR Ct value to the assessment of lung involvement on chest CT adds valuable prognostic information in COVID-19. We believe that this information can be used to support clinical decision-making when managing COVID-19 patients.
Introduction
The ongoing coronavirus disease 2019 (COVID-19) pandemic, caused by severe acute respiratory syndrome coronavirus 2 (SARS-CoV-2), poses great challenges to public health as well as for the health care system. One specific challenge is the wide spectrum of disease severity [Citation1,Citation2] and especially in situations where health care resources are stressed, there is a need for robust methods to predict a severe outcome of COVID-19 for individual patients.
Although COVID-19 is a novel disease, substantial research has already been undertaken to identify risk factors that could be used for such risk stratification. Baseline factors that have been associated with an unfavourable outcome include high age, male sex, immunosuppression and comorbidities such as cardiovascular disease, diabetes, obesity, chronic kidney disease or chronic lung disease [Citation3–5]. In addition, the predictive value of clinical data gathered at the time of hospital admission to hospital have been explored. Several studies have focussed on blood biomarker profiles including C-reactive protein [Citation6], D-dimer [Citation7] and lymphocyte count [Citation6,Citation8], and complex models that combine several variables have also been constructed [Citation9–11].
We have previously demonstrated that the degree of lung involvement on computed tomography (CT) images at hospital admission is associated with hospital length of stay as well as intensive care unit (ICU) admission or death [Citation12]. Others have published similar findings [Citation13–16] indicating that chest CT seems to be a valuable tool for outcome prediction. Yet another parameter that has been suggested for this purpose is viral load. Viral load can be estimated based on the reverse transcriptase polymerase chain reaction (RT-PCR) cycle threshold value (Ct value), most often measured in samples from the upper airways, and a low Ct value indicates a high viral load. Ct values are generally provided in routine laboratory testing for SARS-CoV-2. Since patients with suspected COVID-19 who present to the emergency department are often subjected to RT-PCR testing for SARS-CoV-2 as clinical routine, Ct values will be available without the need for additional sampling or laboratory processing. A number of studies on viral load dynamics in COVID-19 have demonstrated peak levels around symptom onset [Citation17–21] and although viral RNA has been detected for weeks or even months after symptom onset [Citation20,Citation22] findings of culturable virus beyond day nine after symptom onset are rare [Citation20,Citation22,Citation23]. Viral load has further been studied in relation transmissibility [Citation18,Citation24,Citation25], vaccination status [Citation26], and a number of previous publications have reported an association with disease severity (for example [Citation27–31]). However, the literature on its value for outcome prediction is not unequivocal; there are examples of studies where no such association could be demonstrated [Citation32–36]. Regarding the relation between viral load and degree of lung involvement as well as combining these two parameters for prediction, the literature is limited.
We performed a population-based retrospective observational study on all patients hospitalized for COVID-19 between 1 March and 31 August 2020 in Örebro Region, Sweden. The aims were to assess the predictive value of RT-PCR Ct value in nasopharyngeal samples obtained from COVID-19 patients at admission from the emergency department, to investigate the relation between Ct value and extent of lung involvement on chest CT images and to explore if a combination of these variables could give additional predictive information regarding a severe outcome in COVID-19.
Materials and methods
Ethics
The study protocol was approved by the Swedish Ethical Review Authority (reference number 2020-02515) and the informed consent requirement was waived based on to the retrospective study design.
Study population and setting
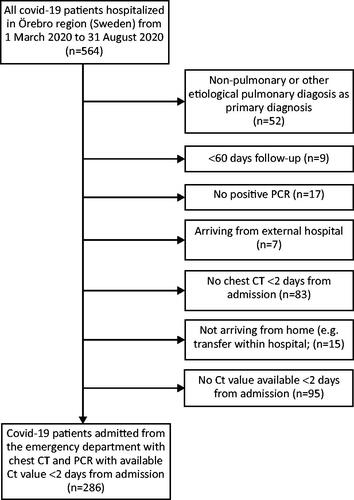
See for an overview of the inclusion. All COVID-19 patients ≥18 years admitted from the emergency departments to inpatient wards in any of the three hospitals in Örebro Region, Sweden (one university hospital and two smaller associated hospitals) between 1 March and 31 August 2020 were considered for inclusion. Patients were retrospectively identified via discharge ICD-10 (International Classification of Diseases) coding and only patients with a primary laboratory-confirmed COVID-19 diagnosis, or a laboratory-confirmed secondary COVID-19 diagnosis in combination with a non-etiological pulmonary diagnosis as primary diagnosis (for example acute respiratory failure or unspecified viral pneumonia) could be included. Further, a requirement for inclusion was available RT-PCR data with Ct value and chest CT images within two days from admission. Patients arriving from external hospitals outside the Örebro Region and patients not admitted from the emergency department (for example transferred from another ward) were excluded.
Figure 1. Overview of the inclusion process. After exclusion, 286 patients remained that fulfilled the inclusion criteria and with data available. CT: computed tomography; Ct: cycle threshold.
The study period approximately corresponded to the first wave of the pandemic. Several viral variants were circulating in Sweden during this period, but the most common were B.1 and B.1.1 ([Citation37,Citation38]. The guidelines for management of COVID-19 patients recommended hospitalisation if one or more of the following criteria were met: respiratory rate >24/minute after repeated measurements, oxygen saturation <93% on room air, acute organ dysfunction, or general deterioration. Patients with an oxygen saturation <93% who did not reach satisfactory oxygen saturation with 1 L oxygen/minute were switched to high flow nasal cannula in general wards up to a limit of fraction of inspired oxygen (FiO2) of 50% and a flow rate of 40 L/minute. Patients requiring more intense high flow nasal cannula treatment or with multiple organ failure were usually transferred to the ICU unless end-of-life decisions had been made. In addition to oxygen therapy, no pharmacological treatments were routinely administered in line with guidelines at the time [Citation39,Citation40]. However, prophylactic low-molecular-weight heparin was used. Throughout the study period, clinicians had access to chest CT scores automatically but Ct values only on demand.
Data collection overview
Data on patient age, sex, comorbidities, symptom duration at admission, hospitalization routes, ICU admission, death during or after hospitalization, chest CT reports, SARS-CoV-2 RT-PCR analyses and blood biomarkers were automatically and manually extracted from the electronic health records.
Chest CT
According to the clinical routine at the study site, the visual extent of the COVID-19 pneumonia in chest CT images were reported using the Örebro COVID-19 scale (ÖcoS), which has been described previously [Citation12]. Using the ÖCoS structured report, the visual extent was reported as no involvement, <10% involvement, 10–25% involvement, 25–50% involvement, 50–75% involvement or >75% parenchymal involvement. The scale was implemented in clinical routine for all COVID-19 patients in Örebro Region, Sweden, on April 1 2020. Around 30 different radiologists and residents provided clinical scores throughout the study period. For the cases where no clinical ÖCoS CT scoring was available, due to night-time overseas teleradiological reading or imaging before 1 April, a separate scoring for study purposes was performed by a radiology resident (MW) blinded to all clinical information.
RT-PCR and Ct values
All samples were handled as routine clinical samples in the clinical microbiology laboratory, department of laboratory medicine, Örebro university hospital, Sweden. Nasopharyngeal specimens were collected using flocked swabs and transported in Virocult® (Copan, Italy), Eswab® (Copan, Italy) or 0.9% NaCl. Samples were transported to the laboratory within 12 h. Samples analyzed by in-house RT-PCR or the Allplex assay (see below) were heat inactivated. RNA was extracted using the TANbead nucleic acid extraction kit (Taiwan Advanced Nanotech, Taiwan) on Maelstrom (Taiwan Advanced Nanotech, Taiwan) or Maglead (PSS BioSystem, Japan). Initially, samples (approximately 94% of all samples used in this study) were analyzed using an in-house real-time RT-PCR (adapted from the protocol recommended by World health organisation [Citation41] targeting the E gene (followed by verification of the presence of the RdRp-gene) or targeting the RdRp gene directly. Ct values <40 were considered positive. Later during the study period commercial assays became available and the in-house RT-PCR was replaced by the Allplex SARS-CoV-2 assay (Seegene, Seoul, South Korea), targeting the N, E and RdRp genes (only around 1% of the samples). The reaction was run 40 cycles and Ct values <40 were considered positive. Additionally, approximately 5% of the samples were analyzed with the cartridge-based Xpert Xpress SARS-CoV-2 test in the GeneXpertDx system (Cepheid, CA, USA). This method targets both the N2 and the E genes and the reaction was run 45 cycles. Ct values <45 were considered positive. As a surrogate for viral load, Ct values provided by the respective RT-PCR method were used. For the in-house RT-PCR the Ct value of the E gene was used and for the Xpert Xpress SARS-CoV-2 and Allplex SARS-CoV-2 tests, the mean Ct value of the genes detected was used. If a patient had multiple positive tests, the one closest to admission was used. Only tests performed within two days of admission were included.
Comorbidities and blood biomarkers
For comorbidities, four different disease categories of interest were identified; malignant tumours, type 1 and type 2 diabetes mellitus, chronic kidney disease, or previous stroke/plegia (hemiplegia, paraplegia or tetraplegia). Study individuals were considered to have one or more of these conditions if they had an ICD code corresponding to the aforementioned categories going back five years. For blood biomarkers, routine analyses of C-reactive protein (CRP), white blood cell count (WBC), lymphocyte count, ferritin, lactate dehydrogenase (LDH) and D-dimer closest in time to hospital admission (never >2 days) were used.
Statistics
Matlab R2020a (Mathworks, United States) was used for all statistics. An alpha level for statistical significance of 0.05 was chosen.
The primary outcome was a binary composite measure comprising ICU admission or the competing event of death, both within 60 days following first hospital admission. A combination of the two was chosen to account for patients that were not eligible for ICU admission due to end-of-life decisions. A multiple logistic regression model was built with age, blood biomarkers, symptom duration and Ct value treated as continuous variables and CT score, sex and comorbidities treated as categorical variables. First, a full model with all extracted parameters was run and subsequently a stepwise approach was used to identify the factors with the strongest effect on the outcome. ROC curves were calculated for Ct value, CRP and CT score, separately and in combination. Since the regression analysis showed similar effects for 0%, <10% and 10-25% visual CT involvement and for 50-75% and >75% involvement, the visual CT scores were in the regression analysis grouped on a three-point scale: <25% involvement, 25-50% involvement and >50% involvement.
To investigate possible factors affecting the nasopharyngeal Ct value at admission, a multiple linear regression model with Ct value as the outcome measure was also performed. For this, age and symptom duration were treated as continuous variables whereas sex and comorbidities were treated as categorical variables.
Results
Patient characteristics and background variables’ effect on Ct value at admission
The inclusion process is depicted in . In total, 286 patients were available for analyses. Patient characteristics are shown in .
Table 1. Patient characteristics.
The effect of background variables (age, sex, comorbidities) and symptom duration on Ct value at admission was analyzed. Of these, only symptom duration significantly affected the Ct value, in the direction that the shorter the symptom duration, the lower the Ct value (regression coefficient 0.41; p < .001; Supplementary table 1).
Risk factors for ICU admission or death
In univariate analysis there was a significant effect of Ct value at hospital admission on the combined endpoint of ICU admission or death within 60 days (; p < .001). A larger proportion of patients with a low Ct value, corresponding to a high viral load, had an unfavourable outcome. In the full multiple model including all extracted potential risk factors for severe COVID-19, Ct value (p < .001), lung involvement (p = .032 for 25–50% and p < .001 for >50%) and symptom duration (p = .0058) were significantly associated with the combined endpoint of ICU admission or death (). With a simplified stepwise approach, predictive variables were Ct value (p < .001), lung involvement (p < .001), age (p = .049) and CRP (p = .0037). That is, lower Ct value, more extensive infiltrates, higher age, and higher CRP at hospital admission were all associated with an unfavourable outcome (). By converting the regression coefficients to clinical data, the relative importance of the variables remaining in the stepwise model can be demonstrated. This shows that if a patient has a CT score of 25–50% instead of <25%, it is comparable to an 11 cycles lower Ct value, an increase of approximately 75 years of age or a 230 mg/L higher CRP value, regarding the risk for ICU admission or death.
Table 2. Association between extracted variables and ICU admission or death.
Relation between Ct values and chest CT scores
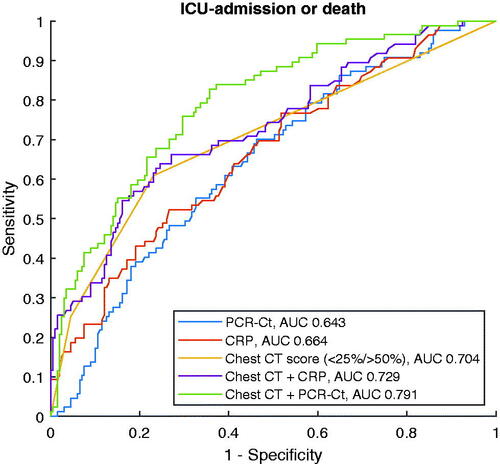
A secondary objective was to explore the relation between Ct values and lung involvement during the same phase of the disease. Visually, overall degree of lung involvement as evaluated by the ÖCoS CT scoring showed a weak association with Ct values as demonstrated in . Separate analyses of the predictive value of Ct value for different CT scores were conducted. These demonstrated that Ct value significantly predicted ICU admission or death in patients with less extensive lung involvement (<25% and 25–50%; p < .001 and p = .001, respectively; ). In more advanced stages of lung involvement (>50%), there was no significant predictive role of Ct value (p = .534; ). ROC curves were also created as an illustration of how different explanatory factors relate to each other. As single parameters, extent of lung involvement was superior to Ct value or CRP (AUC 0.704, 0.643 and 0.664, respectively). When combined, Ct value added more to CT score than CRP (AUC 0.791 and 0.729, respectively, ).
Figure 2. Relation between degree of lung involvement on chest CT images (x axis) and Ct value at admission (y axis). Boxes show median and interquartile range, whiskers represent range. Abbreviations: CT = computed tomography, Ct = cycle threshold.
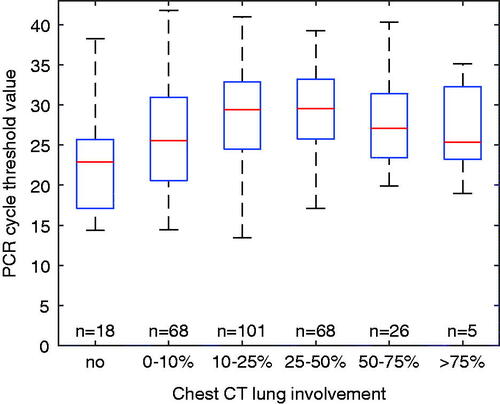
Figure 3. Univariate regressions with proportion of patients reaching the outcome ICU admission or death within 60 days as dependent variable (y axis) and Ct value as independent variable (x axis), for all patients (a) and in groups based on degree of lung involvement (b–d). Regarding b-d, a significant association was demonstrated for <25% (b) and 25–50% (c) but not for >50% (d). Abbreviations: ICU = intensive care unit, Ct = cycle threshold.
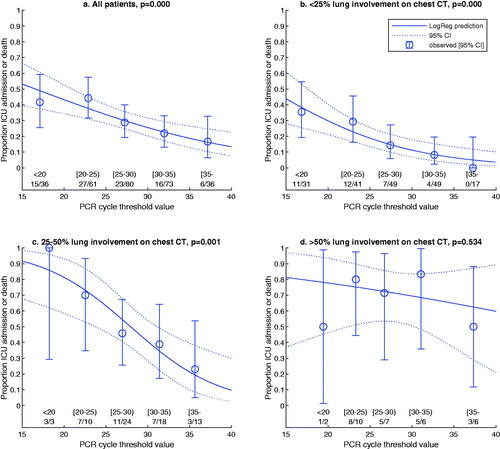
Figure 4. ROC curves for the outcome ICU admission or death 60 days post hospital admission. Explanatory variables are Ct value, CRP, degree of lung involvement in chest CT images or combinations of the latter with either Ct value or CRP. The y axis represents sensitivity and the x axis 1-specificity. ICU: intensive care unit; Ct: cycle threshold; CRP: C-reactive protein; CT: computed tomography.
Discussion
In this population-based observational study of 286 COVID-19 inpatients in Örebro Region, Sweden, it was found that higher viral load estimated by lower Ct value in nasopharyngeal samples and more extensive lung infiltrates on chest CT images were associated with risk for ICU admission or death. We have previously demonstrated the role of chest CT imaging for outcome prediction and in the current study it was shown that Ct value both has independent explanatory value and can improve prediction when combined with chest CT scoring. In contrast, addition of CRP did not notably improve prediction when added to the model based on CT scoring. Ct value was especially useful to identify patients with high risk despite less extensive lung involvement.
As demonstrated in , the combination of Ct value and chest CT score at hospital admission provides an estimated risk for ICU admission or death. In our data, a patient with <25% CT score and a Ct value of 25 was equal in terms of risk for an unfavourable outcome to a patient with 25–50% CT score and a Ct value of 35 – both having approximately 20% risk. Similarly, the estimated risk is approximately 50% for a patient with a Ct value of 28 and 25–50% CT score, and for a patient with Ct value 13 and <25% CT score, while all patients with >50% CT score have more than 50% risk irrespective of Ct value, see .
To put the current findings in context, a systematic literature search was done (supplementary file) and 25 studies were retrieved in which the association between nasopharyngeal viral load and outcome in adult COVID-19 patients seeking care at the emergency department had been evaluated. The vast majority of the studies (17/25) found that viral load, in most cases based on Ct value, was significantly associated with negative outcome. Among the five studies with the largest sample sizes (n > 500), the results were consistent in the direction of worse outcome with higher viral load (Choudhuri et al. [Citation27], Magleby et al. [Citation28], Pujadas et al. [Citation29], Westblade et al. [Citation30] and Miller et al. [Citation31]). That fact that the all five major studies point in the same direction, despite using three different RT-PCR platforms and including several others variables for adjustment, strengthens the notion that the Ct value is important, in keeping with our results. Regarding the relation between nasopharyngeal Ct value and lung involvement on chest CT images, none of these five large studies addressed this question. Another study identified in the search, by Yagci et al. did however focus on the relation between Ct values and chest CT scores based on percentage of each lobe affected [Citation42]. They found that the viral load in nasopharyngeal samples was significantly lower in both hospitalized patients and outpatients who had more severe lesions on chest CT but symptom duration was not included in the statistical model [Citation42]. In contrast to the current study, Yagci et al. found that viral load was not significantly associated with mortality and no analyses regarding the value of viral load estimation in groups based on extent of lung involvement were done [Citation42].
Theoretically, at least two explanations can be thought of as to why a higher nasopharyngeal viral load would be associated with worse outcome. First, it could be that patients who will later end up in the ICU or die seek healthcare earlier, for example fragile patients who both have a hard time managing symptoms at home and have a high risk for severe disease. As mentioned in the introduction, the viral load peak tends to occur early, in keeping with our results showing that shorter symptom duration was associated with lower Ct values. However, viral load had independent prediction value also with symptom duration included in the statistical model in our study, and three of the five large similar studies discussed above [Citation28,Citation30,Citation31] also included this variable, indicating that earlier contact with health care is not the sole explanation. However, worth keeping in mind is that symptom duration is a subjective measure reported by the patient in the emergency room. It could be that some explanatory value is lost by unreliable patient recall, and that Ct value is in fact a more accurate measure of infection duration. Second, sustained high viral loads may be a relevant trigger for the immune pathology leading to severe lung disease as it is shown that the abundance of virus in the lower airways is predictive of mortality [Citation43]. However, it is still unclear if high viral load at hospital admission is caused by having very high peak viral load at disease onset or if a dysregulated host response impairs viral clearance. Diminished or delayed antiviral responses (interferon I and III) together with high levels of pro-inflammatory cytokines and macrophage attracting chemokines are found to be associated with COVID-19 induced immune pathology of the lung [Citation44–46]. However, host-related factors cannot be the only explanatory factor of the dysregulated immune response in COVID-19 as it is shown that virally coded proteins also can attenuate the antiviral interferon responses [Citation47,Citation48]. Other factors apart from symptom duration that have been associated with higher viral load include comorbidity, age and sex [Citation28,Citation30,Citation49]. Neither of these turned out significant in the current study but especially regarding comorbidities our results have to be interpreted with caution; the list of extracted comorbidities represents a selection of background diagnoses and most categories included few individuals. It could be that our sample size was too small to detect minor effects on the viral load. Finally, when studying more closely the nasopharyngeal viral load in relation to the lung involvement in CT images, Ct value from hospital admission seemed especially valuable as a tool in patients with less extensive infiltrates. Since it was shown also that the extent of lung involvement in itself is an important factor to predict ICU admission or death, our interpretation is that patients with extensive lung involvement as a group already have a high probability for unfavourable outcome, and Ct value does therefore not add significant value.
Some limitations of this study should be mentioned, in addition to those addressed above. First, the analyses were done retrospectively and therefore it could not be evaluated whether the information on nasopharyngeal Ct value actually was of worth for the clinicians. Second, Ct value is only a surrogate for viral load and several drawbacks of this raw measure have been raised, primarily interpretation difficulties due to the diversity in sampling and laboratory processing [Citation50–52]. Instead, more sophisticated alternatives have been proposed [Citation50–52]. Third, only hospitalized adult patients were included and therefore no conclusions can be drawn regarding non-admitted patients or those <18 years. Regarding the latter, very few children sought care at the emergency department and even fewer were admitted or went through a chest CT during this phase of the pandemic, preventing further analyses for this group. Fourth, the study population only represents the first outbreak wave in the area. Different circulating viral variants, new treatment options and both previous COVID-19 infection and vaccination status could potentially affect applicability of the results. Finally, as mentioned above, clinicians had access to chest CT scores automatically, and thus this information is more likely to have influenced decisions regarding ICU admission compared to Ct values which were only available on demand. The study also has several strengths. It is a population-based study where all admitted patients in Örebro region who met the inclusion criteria were included. To have a non-selected population increases the likelihood that results are generalizable. Further, although several previous studies have evaluated viral load as a predictive marker, few have described this parameter in relation to chest CT findings. Moreover, for both chest CT scoring and Ct values, the processes included some diversity, in that several different radiologists scored the images and different RT-PCR platforms and protocols were used. This could be considered a strength as well as a drawback of the study. It may result in less clear data due to larger variation. However, real-life clinical data also means that the results are more easily implemented in routine practice and that the findings are solid enough to be demonstrated even without perfectly controlled conditions.
In conclusion, lower Ct value in nasopharyngeal samples obtained from COVID-19 patients at hospital admission and higher degree of lung involvement on chest CT were separately and in combination associated with an increased risk for ICU admission or death. Lung involvement was superior as a single parameter but addition of Ct value increased the prediction performance and this information seemed to be especially useful to identify patients with high risk despite less extensive lung involvement. Although no easily defined cut-offs exist for these two prognostic variables, our study showed that they contribute with valuable information and can, together with other patient data, inform and support decision-making. Future studies should validate these findings in other cohorts, including vaccinated individuals and different outbreak waves with other predominant viral variants. Further, prospective approaches could be aimed at determining the actual clinical value of having access to Ct values and chest CT scores in addition to other clinical parameters to guide treatment or intensity of patient monitoring.
Supplemental Material
Download MS Word (44 KB)Disclosure statement
The authors report no conflict of interest.
Additional information
Funding
References
- Wu Z, McGoogan JM. Characteristics of and important lessons from the coronavirus disease 2019 (COVID-19) outbreak in China: Summary of a report of 72 314 Cases From the Chinese Center for Disease Control and Prevention. JAMA. 2020;323(13):1239–1242.
- Fried MW, Crawford JM, Mospan AR, et al. Patient characteristics and outcomes of 11 721 patients with coronavirus disease 2019 (COVID-19) hospitalized across the United States. Clin Infect Dis. 2021;72(10):e558–e565.
- Kim L, Garg S, O'Halloran A, et al. Risk factors for intensive care unit admission and in-hospital mortality among hospitalized adults identified through the US coronavirus disease 2019 (COVID-19)-associated hospitalization surveillance network (COVID-NET). Clin Infect Dis. 2021;72(9):e206–e214.
- Jackson BR, et al. Predictors at admission of mechanical ventilation and death in an observational cohort of adults hospitalized with COVID-19. Clin Infect Dis. 2020;73(11):e4141–e4151.
- Docherty AB, Harrison EM, Green CA, ISARIC4C investigators, et al. Features of 20 133 UK patients in hospital with covid-19 using the ISARIC WHO Clinical Characterisation Protocol: prospective observational cohort study. BMJ. 2020;369:m1985.
- Tan C, Huang Y, Shi F, et al. C-reactive protein correlates with computed tomographic findings and predicts severe COVID-19 early. J Med Virol. 2020;92(7):856–862.
- Berger JS, Kunichoff D, Adhikari S, et al. Prevalence and outcomes of D-Dimer elevation in hospitalized patients with COVID-19. ATVB. 2020;40(10):2539–2547.
- Huang I, Pranata R. Lymphopenia in severe coronavirus disease-2019 (COVID-19): systematic review and Meta-analysis. j Intensive Care. 2020;8(1):36.
- Wu G, Yang P, Xie Y, et al. Development of a clinical decision support system for severity risk prediction and triage of COVID-19 patients at hospital admission: an international multicentre study. Eur Respir J. 2020;56(2):2001104.
- Liang W, Liang H, Ou L, China Medical Treatment Expert Group for COVID-19, et al. Development and validation of a clinical risk score to predict the occurrence of critical illness in hospitalized patients with COVID-19. JAMA Intern Med. 2020;180(8):1081–1089.,
- Garibaldi BT, Fiksel J, Muschelli J, et al. Patient trajectories among persons hospitalized for COVID-19 : A Cohort Study. Ann Intern Med. 2021;174(1):33–41.
- Ahlstrand E, Cajander S, Cajander P, et al. Visual scoring of chest CT at hospital admission predicts hospitalization time and intensive care admission in covid-19. Infect Dis (Lond)). 2021;53(8):622–632.
- Colombi D, Bodini FC, Petrini M, et al. Well-aerated lung on admitting chest CT to predict adverse outcome in COVID-19 pneumonia. Radiology. 2020;296(2):E86–E96.
- Guillo E, Bedmar Gomez I, Dangeard S, et al. COVID-19 pneumonia: Diagnostic and prognostic role of CT based on a retrospective analysis of 214 consecutive patients from Paris, France. Eur J Radiol. 2020;131:109209.
- Raoufi M, et al. Correlation between chest computed tomography scan findings and mortality of COVID-19 cases: a cross sectional study. Arch Acad Emerg Med. 2020;8(1):e57.
- Ufuk F, Demirci M, Sagtas E, et al. The prognostic value of pneumonia severity score and pectoralis muscle area on chest CT in adult COVID-19 patients. Eur J Radiol. 2020;131:109271.
- Zou L, Ruan F, Huang M, et al. SARS-CoV-2 viral load in upper respiratory specimens of infected patients. N Engl J Med. 2020;382(12):1177–1179.
- He X, Lau EHY, Wu P, et al. Temporal dynamics in viral shedding and transmissibility of COVID-19. Nat Med. 2020;26(5):672–675.
- Young BE, et al. Viral dynamics and immune correlates of COVID-19 disease severity. Clin Infect Dis. 2020;73(9):e2932–e2942.
- Cevik M, Tate M, Lloyd O, et al. SARS-CoV-2, SARS-CoV, and MERS-CoV viral load dynamics, duration of viral shedding, and infectiousness: a systematic review and Meta-analysis. Lancet Microbe. 2021;2(1):e13–e22.
- Wolfel R, et al. Virological assessment of hospitalized patients with COVID-2019. Nature. 2020;581(7809):465–469.
- Perera RAPM, Tso E, Tsang OTY, et al. SARS-CoV-2 virus culture and subgenomic RNA for respiratory specimens from patients with mild coronavirus disease. Emerg Infect Dis. 2020;26(11):2701–2704.
- van Kampen JJA, van de Vijver DAMC, Fraaij PLA, et al. Duration and key determinants of infectious virus shedding in hospitalized patients with coronavirus disease-2019 (COVID-19). Nat Commun. 2021;12(1):267
- Kawasuji H, Takegoshi Y, Kaneda M, et al. Transmissibility of COVID-19 depends on the viral load around onset in adult and symptomatic patients. PLoS One. 2020;15(12):e0243597
- Bullard J, Dust K, Funk D, et al. Predicting infectious severe acute respiratory syndrome coronavirus 2 from diagnostic samples. Clin Infect Dis. 2020;71(10):2663–2666.
- Levine-Tiefenbrun M, Yelin I, Katz R, et al. Initial report of decreased SARS-CoV-2 viral load after inoculation with the BNT162b2 vaccine. Nat Med. 2021;27(5):790–792.
- Choudhuri J, Carter J, Nelson R, et al. SARS-CoV-2 PCR cycle threshold at hospital admission associated with patient mortality. PLoS One. 2020;15(12):e0244777.
- Magleby R, et al. Impact of SARS-CoV-2 viral load on risk of intubation and mortality among hospitalized patients with coronavirus disease. Clin Infect Dis. 2019;73(11):e4197–e4205.
- Pujadas E, Chaudhry F, McBride R, et al. SARS-CoV-2 viral load predicts COVID-19 mortality. Lancet Respir Med. 2020;8(9):e70.
- Westblade LF, Brar G, Pinheiro LC, et al. SARS-CoV-2 viral load predicts mortality in patients with and without cancer who are hospitalized with COVID-19. Cancer Cell. 2020;38(5):661–671 e2.
- Miller EH, Zucker J, Castor D, et al. Pretest symptom duration and cycle threshold values for severe acute respiratory syndrome coronavirus 2 Reverse-Transcription polymerase chain reaction predict coronavirus disease 2019 Mortality. Open Forum Infect Dis. 2021;8(2):ofab003
- Sanchez-Pina JM, Rodríguez Rodriguez M, Castro Quismondo N, et al. Clinical course and risk factors for mortality from COVID-19 in patients with haematological malignancies. Eur J Haematol. 2020;105(5):597–607.
- Kashiwagi K, Maeda T, Yoshizawa S, et al. Comparison of IgG antibodies, SARS-CoV-2 load, and prognostic indicators in patients with severe and mild COVID-19 in Japan. J Nippon Med Sch. 2021;88(4):380–383.
- Le Borgne P, Solis M, Severac F, CRICS TRIGGERSEP Group (Clinical Research in Intensive Care and Sepsis Trial Group for Global Evaluation and Research in Sepsis), et al. SARS-CoV-2 viral load in nasopharyngeal swabs in the emergency department does not predict COVID-19 severity and mortality. Acad Emerg Med. 2021;28(3):306–313.,
- Fajnzylber J, Regan J, Coxen K, et al.; Massachusetts Consortium for Pathogen Readiness. SARS-CoV-2 viral load is associated with increased disease severity and mortality. Nat Commun. 2020;11(1):5493.,
- Lesho E, et al. Temporal, spatial, and epidemiologic relationships of severe acute respiratory syndrome coronavirus 2 (SARS-CoV-2) gene cycle thresholds: a pragmatic ambi-directional observation. Clin Infect Dis. 2020;73(9):e3133–e3135.
- Helgenomsekvensering av svenska SARS-CoV-2 som orsakar covid-19, delrapport 2, 2020. 2020 [cited 2020; Available from: https://www.folkhalsomyndigheten.se/contentassets/eda7d448e17f48cf81229200e4d8437f/helgenomsekvensering-svenska-sars-cov-2-orsakar-covid-19-del-2.pdf
- Helgenomsekvensering av svenska SARS-CoV-2 som orsakar covid-19, delrapport 3, 2020. 2020 [cited 2020; Available from: https://www.folkhalsomyndigheten.se/contentassets/088dbf03a535495ba9df441577eea7ec/helgenomsekvensering-svenska-sars-cov-2-orsakar-covid-19-del-3.pdf
- Bhimraj A, et al. Infectious diseases society of America guidelines on the treatment and management of patients with COVID-19. Clin Infect Dis. 2020:ciaa478.
- Alhazzani W, Møller MH, Arabi YM, et al. Surviving sepsis campaign: Guidelines on the management of critically ill adults with coronavirus disease 2019 (COVID-19)). Crit Care Med. 2020;48(6):e440–e469.
- Diagnostic detection of Wuhan coronavirus 2019 by real-time RTPCR. Available from: https://www.who.int/docs/default-source/coronaviruse/wuhan-virus-assay-v1991527e5122341d99287a1b17c111902.pdf?sfvrsn=d381fc88_2.
- Karahasan Yagci A, Sarinoglu RC, Bilgin H, et al. Relationship of the cycle threshold values of SARS-CoV-2 polymerase chain reaction and total severity score of computerized tomography in patients with COVID 19. Int J Infect Dis. 2020;101:160–166.
- Sulaiman I, Chung M, Angel L, et al. Microbial signatures in the lower airways of mechanically ventilated COVID-19 patients associated with poor clinical outcome. Nat Microbiol. 2021;6(10):1245–1258.,
- Blanco-Melo D, Nilsson-Payant BE, Liu W-C, et al. Imbalanced host response to SARS-CoV-2 drives development of COVID-19. Cell. 2020;181(5):1036–1045 e9.
- Trouillet-Assant S, Viel S, Gaymard A, COVID HCL Study group, et al. Type I IFN immunoprofiling in COVID-19 patients. J Allergy Clin Immunol. 2020;146(1):206–208 e2.,
- Hadjadj J, Yatim N, Barnabei L, et al. Impaired type I interferon activity and inflammatory responses in severe COVID-19 patients. Science. 2020;369(6504):718–724.
- Thoms M, Buschauer R, Ameismeier M, et al. Structural basis for translational shutdown and immune evasion by the Nsp1 protein of SARS-CoV-2. Science. 2020;369(6508):1249–1255.
- Xia H, Cao Z, Xie X, et al. Evasion of type I interferon by SARS-CoV-2. Cell Rep. 2020;33(1):108234
- Mahallawi WH, et al. Association of viral load in SARS-CoV-2 patients with age and gender. Front Med (Lausanne). 2021;8:608215.
- Miranda RL, Guterres A, de Azeredo Lima CH, et al. Misinterpretation of viral load in COVID-19 clinical outcomes. Virus Res. 2021;296:198340
- Dahdouh E, Lázaro-Perona F, Romero-Gómez MP, et al. Ct values from SARS-CoV-2 diagnostic PCR assays should not be used as direct estimates of viral load. J Infect. 2021;82(3):414–451.
- Han MS, Byun J-H, Cho Y, et al. RT-PCR for SARS-CoV-2: quantitative versus qualitative. Lancet Infect Dis. 2021;21(2):165.