
Abstract
Background
Staphylococcus aureus is a common cause of infectious diseases in humans. It has become resistant to many antibacterial agents making management of infections difficult. A better understanding of differences among S. aureus strains that are sensitive and resistant to antibiotics may offer insights into the resistant phenotype and identify new antimicrobial targets. This study aimed at comparing general differences in lipid profiles among clinical strains of S. aureus sensitive and resistant to antibiotics. The cell wall thickness and cell surface charge were also compared.
Methods
Five methicillin sensitive (MSSA) and five methicillin resistant (MRSA) S. aureus strains were compared both individually and as MSSA and MRSA groups in the absence of antibiotics. Lipids were compared by ultra-performance liquid chromatography-mass spectrometry, cell wall thickness was compared by scanning transmission electron microscopy and whole-cell surface charge was compared using a cytochrome c binding assay.
Results
Twenty-two lipid species were identified in all ten strains of S. aureus. The abundance of three lipid species (two lysyl-phosphatidylglycerol and one diglycosyldiacylglycerol) were found to be different between MSSA and MRSA. Differences in cell wall thickness were identified between strains but not between MSSA and MRSA. No difference in whole-cell surface charge was observed between MSSA and MRSA.
Conclusion
This study shows differences in membrane lipids between antibiotic sensitive and antibiotic resistant clinical strains of S aureus that may affect resistance mechanisms related to cell membrane structure and fluidity. Further research on these differences may identify new drug targets against resistant strains.
Introduction
Staphylococcus aureus is a Gram-positive cocci bacterium that can be found as a commensal on human skin and nares in approximately 30% of the population. However, it can also cause a variety of infections including impetigo, sepsis and pneumonia [Citation1]. These infections can be more dangerous when caused by antibiotic resistant strains such as methicillin resistant S. aureus (MRSA) as they are resistant to many common antibiotic therapies thereby complicating treatment. It has been reported that as many as 60% of clinically isolated strains of S. aureus are resistant to methicillin [Citation2]. Resistance to other antibiotics including penicillin and last resort antibiotics such as vancomycin and daptomycin have also been reported. Increasing resistance to various antibiotics in MRSA is limiting the therapeutic options and necessitating researchers to look for new targets for effective antimicrobial treatments.
Antibiotic resistance in S aureus has been attributed to many factors. The main difference between antibiotic resistant and sensitive strains is the presence of mecA gene in the resistant strains which provides resistance to methicillin. Other differentiating factors between antibiotic resistant and sensitive strains are related to proteins that are responsible for virulence and pathogenicity [Citation3–6]. While the role of genes and proteins in antibiotic resistance of S. aureus are well characterised, differences in other cellular components such as cell membrane and cell wall between antibiotic resistant and sensitive strains are less well understood.
The bacterial cell membrane is responsible for regulation of passage of substances into the cell, generation of ATP, and cell-to-cell communications [Citation7]. The cell membrane of S. aureus is made up of a variety of phospholipids and glycolipids including phosphatidylglycerols (PG), lysyl-phosphatidylglycerols (Lys-PG) monoglycosyldiacylglycerols (MGDG), diglycosyldiacylglycerols (DGDG), and cardiolipins (CL). The makeup of the membrane can change in response to external stimuli such as antibiotics, temperature, and pH [Citation8].
Past studies have shown that antibiotic resistance in S aureus can be related to differences in lipid content. Different lipid species may play different roles in antibiotic resistance. For example, PG’s are negatively charged while Lys-PG’s are positively charged, and their altered abundances can make the cell membrane more positively or negatively charged affecting resistance (such as in bacteria resistant to cationic antimicrobial peptides (CAMPs)) [Citation9]. MGDG’s are non-bilayer forming and DGDG’s are bilayer forming and therefore are responsible for the stability and fluidity of the membrane and may change the permeability of the cell to antibiotics [Citation10]. CL’s have been shown to stabilise liposomes against osmotic stress and to contribute to resistance to daptomycin by preventing membrane permeabilization [Citation8,Citation11]. Lipidomic differences observed in a previous study between clinical isolates of methicillin sensitive S. aureus (MSSA) and MRSA indicate that antibiotic susceptibility may be associated with the lipid composition of the bacterial cell membrane [Citation12]. There is still limited knowledge on the lipidomic differences between antibiotic sensitive and resistant strains of S. aureus.
Some studies show that antibiotic resistance in S aureus can also be associated with changes in the cell wall. The bacterial cell wall is responsible for maintaining cell shape and it consists of a thick layer of peptidoglycan with lipopolysaccharides and wall teichoic acids in Gram positive bacteria [Citation2]. Thickening of the cell wall in S. aureus has been associated with reduced susceptibility to vancomycin and daptomycin [Citation13,Citation14]. It has also been associated with adaptive resistance to amikacin in MRSA [Citation15]. Alterations to the cell wall can therefore be important in antibiotic resistant strains of S. aureus.
In order to understand MSSA and MRSA better, many past studies have shown general differences in virulence factors, protein profiles, biofilm formation and clinical outcomes between MRSA and MSSA strains [Citation5,Citation6,Citation16,Citation17], but there is paucity of data on differences in the lipid profiles of methicillin sensitive and resistant strains. Our study therefore characterised and compared lipid profiles of clinical strains of MSSA and MRSA to better understand general differences between them. Our study was guided by many other reports in literature comparing non-isogenic strains of MRSA and MSSA isolated from patients and their samples. The lipid profiles were taken in the absence of antibiotic stress so that baseline measurements could be taken. In addition to cell membrane lipids, our study also compared cell wall thickness and cell surface charge between methicillin sensitive and resistant strains of S aureus. Successful identification of such differences between MSSA and MRSA strains may help in exploring potential drug targets as well as the ability to better tailor antimicrobial therapy based on cellular characteristics.
Materials and methods
Bacterial isolates and growth conditions
Ten clinical strains of S aureus (five MSSA and five MRSA) () were obtained from Dr Iain Gosbell (Liverpool Hospital, NSW, Australia) whose lab had characterised the strains including typing and antibiotic resistance. The strains are described in literature [Citation18,Citation19] and used in our previous study [Citation20]. Each strain was grown overnight on lysogeny broth (LB) agar plates at 35 ± 2 °C before each experiment. 2-3 colonies were suspended into Mueller-Hinton Broth (MHB) to OD595 0.09 (≈1 × 10⁸ colony forming unit/mL (CFU/mL) matching a 0.5 McFarland turbidity standard). These cells were then diluted to 1 × 10⁷ CFU/mL and appropriate volumes were used to have 0.5 × 10⁵ CFU/mL in the experiments.
Table 1. Characteristics of methicillin-sensitive and methicillin-resistant strains of Staphylococcus aureus used in the experiments.
Lipid analysis
Lipid extraction
Whole lipid extracts were obtained using a Bligh and Dyer method modified from Hewelt-Belka et al. [Citation12]. In brief, the OD adjusted cells suspended in MHB were incubated on a shaker (20 h, 35 °C, 100 rpm), pelleted and suspended in the UPLC grade solvent mixture (chloroform-methanol 1:2 v/v). The suspension was incubated on a vortex mixer (30 min, room temperature, 1000 rpm) to disrupt cells. Chloroform and Milli-Q water (1:1.5 v/v) were added and the solution centrifuged (9,000 rcf, 10 min) to separate into layers. The lower organic phase containing the membrane lipids was transferred to a glass chromatography vial and stored at −20 °C prior to analysis by UPLC-MS.
Ultra-Performance liquid chromatography – mass spectrometry for lipidomics
The whole lipid extracts were analysed by UPLC-MS using a method modified from Damen et al. [Citation21]. UPLC was conducted using a Waters Acquity UPLC System fitted with a binary solvent manager and mass spectrometric detection was conducted using a Waters Xevo QToF-MS quadrupole time of flight mass spectrometer, fitted with an electrospray source. Separation consisted of two mobile phases. Mobile Phase A (10 mM ammonium acetate with 0.1% formic acid in Milli-Q water-acetonitrile (ACN) (40:60, v/v)), and Mobile Phase B (10 mM ammonium acetate with 0.1% formic acid in ACN-isopropanol (IPA) (10:90, v/v)). The weak wash consisted of ACN-Milli-Q water-IPA (30:30:40, v/v/v) and the strong wash consisted of IPA and 0.1% formic acid. Elution was applied at a flow rate of 0.2 mL/min through an Acquity UPLC HSS C18 column (2.1 mm x 150 mm) thermostatted to 45 °C with each sample run taking 20 min. The gradient was 0 min 40% B; 2 min; 43% B; 2.1 min 50% B; 11 min 54% B; 11.1 min 70% B; 17 min 99% B; 17.1 min 40% B and 20 min 40% B. Samples were diluted two-fold in IPA-ACN-Milli-Q water (2:1:1) and 5 µL was injected for each run. Data was obtained in technical triplicate.
Mass spectrometry was conducted with a capillary voltage of ± 0.6 kV and a sampling cone voltage of ± 30 V for both positive and negative ion mode electrospray ionizations. A desolvation nitrogen gas flow of 700 l/h and a desolvation temperature of 450 °C were used. Data acquisition was conducted over the mass to charge range of 50–1,200. Mass accuracy was obtained using a lockspray solution consisting of 200 ng/mL leucine encephalin in 50% aqueous ACN with 0.1% formic acid. The solution was infused at 5 µL/min and the lockmass correction updated every 30 s.
Lipid identification and analysis
Lipid species and their relative abundances were identified by a targeted lipid search using ion adduct masses on the total ion chromatograms (TICs) generated by the above UPLC-MS. This was done in Waters MassLynx v4.1. Ion adduct masses were calculated from a list of neutral masses of membrane phospholipids and glycolipids from the classes diacylglycerol (DAG), DGDG, MGDG, PG, CL and Lys-PG acquired from Hewelt-Belka et al. [Citation22]. Protonated, ammoniated, sodiated and potassiated ion adducts were calculated by adding the mass of a hydrogen ion, ammonium ion, sodium ion and potassium ion respectively. After putative identification of a lipid species, its relative abundance was calculated from the area under the curve of the extracted ion chromatographic peak. Comparisons were made between the MSSA group and MRSA group by a Welch two sample t-test in R at a significance of p ≤ .05.
Determination of cell wall thickness
Cell wall thickness was measured using a method modified from Kawai et al. [Citation23]. The cells were washed three times with 0.1 M Na-phosphate buffer (pH 7.4) and incubated (overnight, 4 °C) in the primary fixative (2.5% glutaraldehyde in 0.1 M Na-phosphate buffer). Cells were washed three times with Na-phosphate buffer and incubated (room temperature, 2 h) in the secondary fixative (1% osmium tetroxide). The cells were washed three times with Milli-Q water and dehydrated in an ethanol series (30%, 50%, 70%, 95%, and 100%) with the 100% ethanol step repeated three times. Cells were then dehydrated again with 100% acetone twice, pelleted and a loopful streaked directly into resin (10 g ERL 4221, 6 g Der 732, 26 g nonenyl succinic anhydride, 0.4 g dimethylaminoethanol) in a vertical plastic micromold. The resin was placed in an oven to polymerise and harden (overnight, 60 °C).
The resin blocks were sectioned (Leica EM UC7 ultramicrotome with a glass blade) into ultrathin slices (90 nm) and mounted on a 200-mesh copper grid.
Cells were examined by STEM (Zeiss Merlin FE-SEM) at 30 kV with an aperture size of 20 µm and at a working distance of 2.7 mm. The cell wall of 20 cells were imaged per strain and the cell wall thickness was measured at four points using ImageJ. A one-way ANOVA was conducted in R at a significance of p ≤ .05 to compare the average cell wall thickness of the MSSA group and MRSA group and a pairwise comparison of means was conducted in R at a significance of p ≤ .05 to compare the cell wall thickness of each strain.
Analysis of Whole-Cell surface charge by cytochrome C assay
Whole cell surface charge was determined using a cytochrome c biding assay based on Matsuo et al. [Citation24] and Meehl et al. [Citation25]. In brief, cells were incubated overnight in MHB on a shaking incubator (100 rpm, 35 °C) to a final concentration of ≈109 CFU/mL. The cells were pelleted and washed twice in 20 mM morpholinepropanesulfonic acid (MOPS), pH 7, resuspended in 0.25 mg/mL cytochrome c, in MOPS and incubated in the dark at room temperature for 10 min. The cells were centrifuged and the amount of cytochrome c in the supernatant determined at OD530 using a standard curve. Three independent experiments were run for all ten strains. The percent bound cytochrome c was compared between the MSSA group and MRSA group using a Welch Two Sample t-test conducted in R at a significance of p ≤ .05 and between each strain using a one-way ANOVA at a significance of p ≤ .05.
Results
Lipidomics
In this study, 22 lipid species were putatively identified in all ten strains of S. aureus and included members of the classes DAG, DGDG, PG, and Lys-PG. The relative abundance of each lipid was calculated by the area under the curve of the extracted ion chromatographic peak and from this the average abundance in the MSSA group and the MRSA group determined ().
Table 2. Lipid species identified in all ten S. aureus strains.
A Welch Two Sample t-test in R at a significance of p ≤ .05 looking for a statistically significant difference between the average abundances of each lipid species in the MSSA group and MRSA group identified three lipid species present at significantly different abundances between the MSSA group and MRSA group. The three lipid species were DGDG (34:0) (p = .003428), Lys-PG (32:0) (p = .000003282) and Lys-PG (38:0) (p = .0041). All three lipid species were present at higher abundances in the MSSA group ().
Cell wall thickness
The sectioned cells of each strain appeared healthy in the electron micrographs (). The average cell wall thickness was determined from 20 individual cells measured at four points for each strain and ranged from 20.185 nm to 31.546 nm. (). The cell walls in order from thinnest to thickest were MSSA 2, MRSA 8, MSSA 4, MRSA 1, MSSA 1, MRSA 13, MSSA 8, MRSA 2, MRSA 9 and MSSA 6. No clear pattern in cell wall thickness and antibiotic susceptibility is evident from this order ().
Figure 1. Scanning transmission electron micrographs of S. aureus cells embedded in resin and sectioned on an ultramicrotome. Cells imaged using a Zeiss Merlin FE-SEM at 30 kV and a working distance of 2.7 mm. (A) MSSA 1. (B) MSSA 2. (C) MSSA 4. (D) MSSA 6. (E) MSSA 8. (F) MRSA 1. (G) MRSA 2. (H) MRSA 8. (I) MRSA 9. (J) MRSA 13.
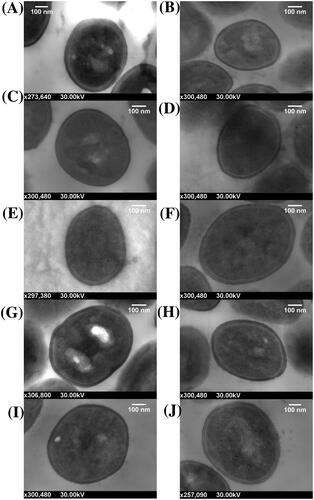
Figure 2. Average cell wall thickness S. aureus cells with standard deviation of the mean error bars. (A) Cell wall thickness of all ten strains. (B) Cell wall thickness of the MSSA group and MRSA group.
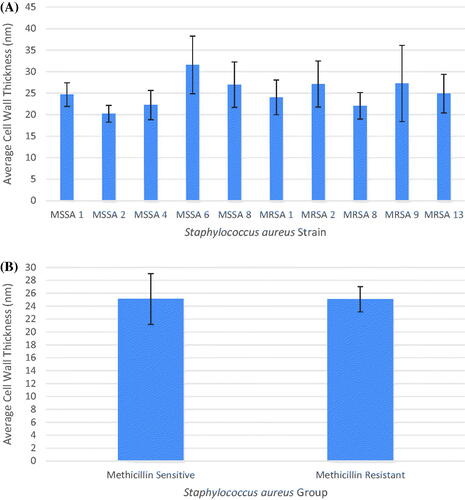
A one-way ANOVA conducted in R at a significance of p ≤ .05 and the calculated p-value of 2.24 × 10⁻¹⁰ indicated there was a significant difference between strains. A pairwise comparison of means conducted in R determined how strains differed from each other. MSSA 2 was thinner than MRSA 2, MRSA 9, MSSA 6 and MSSA 8. MSSA 6 was thicker than MSSA 2, MSSA 4, MRSA 1, MRSA 8 and MRSA 13. MRSA 9 was thicker than MRSA 8. All significant strain pairs had a p-value < .01 except for MRSA 9/MRSA 8 which had a p-value of 0.0480 ().
Table 3. S. aureus strain pairs with significant difference in cell wall thickness.
In addition to comparing the average cell wall thickness of each strain individually, the average cell wall thickness of the MSSA group and MRSA group were also compared (). A Welch Two Sample t-test was conducted in R at a significance of p ≤ .05 looking for a statistically significant difference between the averages of the resistant strains and the sensitive strains. The calculated p-value for this test was 0.9502 and indicated no significant differences in cell wall thickness between the MSSA group and MRSA group.
Whole-Cell surface charge
The average percent bound cytochrome c from three independent cytochrome assay experimental runs were used to compare the whole-cell surface charge of each strain. The average percent bound cytochrome c ranged from 28.231% to 40.460%. The percent bound cytochrome c in each strain from least to most were MRSA 1, MSSA 4, MSSA 2, MSSA 8, MSSA 6, MRSA 2, MSSA 1, MRSA 13, MRSA 9 and MRSA 8. From this it seems that the MSSA strains were less negatively charged compared to the MRSA strains (). A one-way ANOVA conducted in R at a significance of p ≤ .05 and the determined p-value of 0.875 indicated there was no significant difference between the whole-cell surface charge of each strain and therefore there was no need to conduct a pairwise comparison of means.
Figure 3. Average percent binding of cytochrome c to S. aureus cells with standard deviation of the mean error bars. (A) Percent binding of cytochrome c to all ten strains. (B) Percent binding of cytochrome c to the MSSA group and MRSA group.
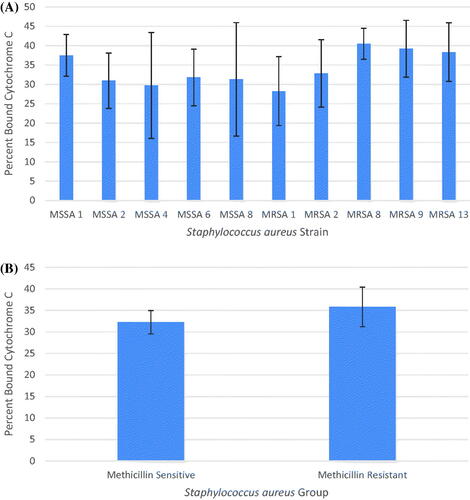
The average percent bound cytochrome c in the MSSA group and MRSA group was determined from the three independent cytochrome assay experimental runs (). A Welch Two Sample t-test conducted in R at a significance of p ≤ .05 looking for a statistically significant difference between the average percent bound cytochrome c in each group and the calculated p-value of 0.3437 indicated there was no significant difference in the whole-cell surface charge between the MSSA group and MRSA group.
Discussion
As a common cause of infectious disease in hospitals and the community, S. aureus and its resistance to antibiotics is of considerable concern. While the role of genes in methicillin resistance in MRSA is well described, the roles of other cell components are not as well characterised in this context. This study exploring the lipid profile, cell wall thickness and whole-cell charge of S aureus clinical strains, identified differences in two cell membrane lipids, Lys-PG and DGDG, between antibiotic sensitive and antibiotic resistant S aureus strains but did not observe differences in cell wall thickness and surface charge between the two groups.
The bacterial cell membrane acts as a selectively permeable barrier, maintaining appropriate concentrations of nutrients and waste inside the cell as well as protecting the cell from the entry of harmful substances such as antibiotics. The cell membrane of S. aureus is complex and contains a variety of straight chain and branched chain fatty acids. These fatty acids can be odd or even numbered and the location of the branch varies. This branching diversity and the existence of odd and even numbered fatty acids can lead to isobaric overlap between fatty acids. This overlap can make it difficult to identify individual lipid species during mass spectrometry experiments [Citation26]. Additional complexity in the S. aureus cell membrane arises through the fatty acids combining into the lipid species PG, Lys-PG, MGDG, DGDG and CL. The abundance of these lipids in the membrane has been shown to vary in antibiotic strains [Citation27]. This study, looking at differences in the lipid species in S. aureus strains using chromatographic peaks and parent ion mass is in support of the hypothesis that there are lipids that are different in abundance between antibiotic sensitive and resistant bacteria. Some previous studies have also shown differences in lipid content between antibiotic sensitive and antibiotic resistant strains of S aureus. For example, a higher level of PG has been reported for methicillin-susceptible strains in comparison with methicillin resistant strains of S. aureus [Citation28]. Ratio of PG to Lys-PG has been associated with resistance to antibiotic fusidic acid in S. aureus [Citation29]. Differences in PG and Lys-PG contents have also been reported in S. aureus strains susceptible and resistant to daptomycin, gentamycin and vancomycin [Citation30,Citation31].
This study identified three lipid species at significantly different abundances between antibiotic sensitive and antibiotic resistant strains of S aureus. These species were a DGDG (DGDG (34:0)) and two Lys-PG’s (Lys-PG (32:0) and Lys-PG (38:0)), all three present at higher abundance in MSSA compared to MRSA. Lys-PG and DGDG are known to be constituents of the cell membrane. The observed differences in lipid contents of Lys-PG and DGDG between antibiotic sensitive and antibiotic resistant S. aureus strains may offer insights into the resistance mechanisms that are related to the cell membrane structure and its fluidity. Lys-PG is an important cell membrane lipid in S aureus and changes in its amount are correlated with change in membrane fluidity [Citation32]. It is also notable that lipids in the class Lys-PG contribute a positive charge to the membrane to balance the negative charge contributed by the cell wall and negatively charged membrane lipid PG [Citation9]. A higher abundance of Lys-PG with no apparent change in the negatively charged lipids (such as PG) may indicate that the membrane of the sensitive strains may be positively charged with partial neutralisation of the cell surface than the resistant strains. An increase in Lys-PG is also associated with resistance to positively charged antibacterial compounds such as CAMPs as well as the antibiotic daptomycin [Citation9]. Therefore, the tested MRSA strains may be more susceptible to CAMPs and daptomycin than the MSSA strains. Further testing on this would help in determining the effectiveness of available antibiotics against these strains. Lipids in the class DGDG, along with MGDG lipids play a role in maintaining the fluidity and stability of the membrane [Citation10]. In our study, a higher abundance of one DGDG with no change in MGDG shows that the fluidity of the sensitive strains may be different from the resistant strains. This may play a role in affecting the entry of antibiotics into the cell [Citation12]. Further studies expanding on the lipid identification described here and on the fluidity of the membrane will help to confirm this result and determine its effect on the entry of antibiotics.
In addition, the ratio of straight chain and branched chain fatty acids in the S. aureus membrane affects membrane fluidity. Branched chain fatty acids increase membrane fluidity while straight chain fatty acids reduce fluidity [Citation33]. Therefore, characterising the ratio of the straight chain and branched chain fatty acids in S. aureus and how these may differ in antibiotic resistance bacteria can allow for insights into cell membrane properties and may assist in identifying effective antibacterial therapy. This was however beyond the scope of this current project.
Lipid identification in this study was done manually and this may have limited the number of lipids identified making it difficult to conclusively state the effect of differences in lipid abundances on the methicillin resistance. However, this study does show that the lipid extraction process is effective and that differences do exist between the membrane lipids in S. aureus strains. The data can also serve as a baseline for future research using tandem mass spectrometry in a more targeted search of lipids with altered abundances in sensitive and resistant strains of S. aureus. In addition, recent work has identified a methodology to distinguish lipids containing one, two or no branched chain fatty acids [Citation26]. Such a methodology would be useful in our future experiments for further categorising the differences in S. aureus membranes in the context of antibiotic resistance. Whether differences in lipid abundances are influenced by the presence of antibiotics will also need to be investigated in the context of identifying differences between antibiotic sensitive and resistant strains of S. aureus. Further research is also needed to determine if these differences impact the strains’ ability to survive or cause infection. This research, therefore, brings to attention the benefits of a deeper understanding of differences between antibiotic sensitive and resistant strains beyond the differences in genes. Furthermore, characterisation of lipids present and their abundance in clinically relevant strains would allow for more effective tailoring of antibacterial therapy. For example, if a particular strain has a lower amount of positively charged lipids (such as Lys-PG) it may be more susceptible to CAMPs and daptomycin and thus these may be a better treatment method. Past work has also identified that the growth medium used to culture bacteria has an effect on the ratio of branched chain and straight chain fatty acids. This may serve as another area to investigate in our future research [Citation33].
The cell wall of staphylococci is reported to range from 20 nm to 40 nm in thickness [Citation34]. The results presented here coincide with this with no cell wall below 20 nm in thickness and none above 32 nm. Acquisition of methicillin resistance allows S. aureus to continue cell wall synthesis using PBP2A [Citation35]. This alteration in the cell wall synthesis machinery may impact the cell wall itself. Thickening of cell wall is indeed linked with antibiotic resistance in S. aureus [Citation13,Citation14]. In this study, the comparisons of the thickness of the cell walls of MSSA and MRSA strains indicated significant difference between the individual strains, but not between the MSSA group and the MRSA group. The lack of any significant difference may be because the cells were grown in the absence of methicillin resulting in PBP2A not being used, or there being no difference between the cell wall thickness of MSSA and MRSA as groups. Further studies testing the first hypothesis may help in confirming or rejecting the second. Future studies may also involve examining cell wall thickness as a function of resistance after exposing sensitive strains to sublethal concentration of antibiotics until resistance is developed [Citation15].
Due to the presence of teichoic acids in the cell wall, the overall surface charge in Gram-positive bacteria is negative. Bacterial cell surface charge is known to affect susceptibility to positively charged antimicrobial agents [Citation24]. The cytochrome c assay used in this study showed that the negative charge did not vary significantly between the ten strains. The difference in cell surface charge between the MSSA group and MRSA group was also not significant. The lack of a difference may have been due to the lack of antibiotic challenge or that alterations to cell surface charge may not assist in methicillin resistance and so was not developed in MRSA strains. This second hypothesis is supported by methicillin being a non-charged molecule. Future experiments involving a charged antimicrobial can identify if exposure to sublethal concentrations can induce changes in the whole-cell surface charge and affect resistance.
Conclusions
In conclusion, this study shows differences in cell membrane lipids between methicillin sensitive and methicillin resistant strains of S. aureus that may affect the resistance mechanism of bacteria by altering membrane structure and fluidity. These differences highlight the potential for research into characteristics of bacteria beyond known resistance mechanisms. Future work would benefit from characterising these changes in isogenic strains, in the presence of antibacterial compounds and by inducing resistance in sensitive strains and comparing them before and after development of resistance.
Author contributions
PN conducted the experiments, analysed the results and wrote the manuscript. PM conceptualised the project, designed methodology, supervised and administered the project, and helped in the writing and revising the manuscript. DH assisted in the ultra-performance liquid chromatography-mass spectrometry experimental design and execution, and helped revise the manuscript. JW helped in revising the manuscript. All authors read and approved the final manuscript.
Acknowledgements
The authors thank Dr Richard Wuhrer, Western Sydney University, Advanced Materials Characterisation Facility (AMCF), for training on scanning electron microscopy and the use of their facilities; Meena Mikhael, Western Sydney University, Mass Spectrometry Facility for assistance in ultra-performance liquid chromatography; and Tony Romeo, University of Wollongong, for training and use of their ultramicrotome.
Disclosure statement
Author report no conflict of interest.
References
- Rojo P, Barrios M, Palacios A, et al. Community-associated Staphylococcus aureus infections in children. Expert Rev anti Infect Ther. 2010;8(5):541–554.
- Romaniuk JAH, Cegelski L. Bacterial cell wall composition and the influence of antibiotics by cell-wall and whole-cell NMR. Phil Trans R Soc B. 2015;370(1679):20150024.
- Enright MC. The evolution of a resistant pathogen – the case of MRSA. Curr Opin Pharmacol. 2003;3(5):474–479.
- Liu GY. Molecular pathogenesis of Staphylococcus aureus infection. Pediatr Res. 2009;65(5 Pt 2):71R–77R.
- Liu C, Chen Z, Sun Z, et al. Molecular characteristics and virulence factors in methicillin-susceptible, resistant, and heterogeneous vancomycin-intermediate Staphylococcus aureus from Central-Southern China. J Microbiol Immunol Infect. 2015;48(5):490–496.
- Enany S, Yoshida Y, Yamamoto T. Exploring extra-cellular proteins in methicillin susceptible and methicillin resistant Staphylococcus aureus by liquid chromatography-tandem mass spectrometry. World J Microbiol Biotechnol. 2014;30(4):1269–1283.
- Hurdle JG, O'Neill AJ, Chopra I, et al. Targeting bacterial membrane function: an underexploited mechanism for treating persistent infections. Nat Rev Microbiol. 2011;9(1):62–75.
- Ohniwa RL, Kitabayashi K, Morikawa K. Alternative cardiolipin synthase Cls1 compensates for stalled Cls2 function in Staphylococcus aureus under conditions of acute acid stress. FEMS Microbiol Lett. 2013;338(2):141–146.
- Slavetinsky C, Kuhn S, Peschel A. Bacterial aminoacyl phospholipids - Biosynthesis and role in basic cellular processes and pathogenicity. Biochim Biophys Acta Mol Cell Biol Lipids. 2017;1862(11):1310–1318.
- Andrés E, Martínez N, Planas A. Expression and characterization of a Mycoplasma genitalium glycosyltransferase in membrane glycolipid biosynthesis: Potential target against mycoplasma infections. J Biol Chem. 2011;286(41):35367–35379.
- Zhang T, Muraih JK, Tishbi N, et al. Cardiolipin prevents membrane translocation and permeabilization by daptomycin. J Biol Chem. 2014;289(17):11584–11591.
- Hewelt-Belka W, Nakonieczna J, Belka M, et al. Untargeted lipidomics reveals differences in the lipid pattern among clinical isolates of Staphylococcus aureus resistant and sensitive to antibiotics. J Proteome Res. 2016;15(3):914–922.
- Cui L, Tominaga E, Neoh HM, et al. Correlation between reduced daptomycin susceptibility and vancomycin resistance in vancomycin-intermediate Staphylococcus aureus. Antimicrob Agents Chemother. 2006;50(3):1079–1082.
- Falcón R, Martínez A, Albert E, et al. High vancomycin MICs within the susceptible range in Staphylococcus aureus bacteraemia isolates are associated with increased cell wall thickness and reduced intracellular killing by human phagocytes. Int J Antimicrob Agents. 2016;47(5):343–350.
- Yuan W, Hu Q, Cheng H, et al. Cell wall thickening is associated with adaptive resistance to amikacin in methicillin-resistant Staphylococcus aureus clinical isolates. J Antimicrob Chemother. 2013;68(5):1089–1096.
- Ghasemian A, Peerayeh SN, Bakhshi B, et al. Comparison of biofilm formation between methicillin-resistant and methicillin-susceptible isolates of Staphylococcus aureus. Iran Biomed J. 2016;20(3):175–181.
- Inoue S, Moriyama T, Horinouchi Y, et al. Comparison of clinical features and outcomes of Staphylococcus aureus vertebral osteomyelitis caused by methicillin-resistant and methicillin-sensitive strains. Springerplus. 2013;2(1):283.
- Gosbell IB. Epidemiology, clinical features and management of infections due to community methicillin-resistant Staphylococcus aureus (cMRSA). Intern Med J. 2005;35(s2):S120–S135.
- Turnidge J, Coombs G, Daley D, et al. Australian group on antimicrobial resistance (AGAR) participants, 2000–14. In: MRSA: a tale of three types 15 years of survey data from AGAR. Sydney, NSW: Australian Commission on Safety and Quality in Health Care; 2016. Available from: https://www.safetyandquality.gov.au/sites/default/files/2020-09/mrsa_-_a_tale_of_three_types.pdf
- Nikolic P, Mudgil P, Whitehall J. The in vitro antibacterial effect of permethrin and formaldehyde on Staphylococcus aureus. Microbiologyopen. 2020;9(8):e1054
- Damen CW, Isaac G, Langridge J, et al. Enhanced lipid isomer separation in human plasma using reversed-phase UPLC with ion-mobility/high-resolution MS detection. J Lipid Res. 2014;55(8):1772–1783.
- Hewelt-Belka W, Nakonieczna J, Belka M, et al. Comprehensive methodology for Staphylococcus aureus lipidomics by liquid chromatography and quadrupole time-of-flight mass spectrometry. J Chromatogr A. 2014;1362:62–74.
- Kawai M, Yamada S, Ishidoshiro A, et al. Cell-wall thickness: possible mechanism of acriflavine resistance in meticillin-resistant Staphylococcus aureus. J Med Microbiol. 2009;58(Pt 3):331–336.
- Matsuo M, Oogai Y, Kato F, et al. Growth-phase dependence of susceptibility to antimicrobial peptides in Staphylococcus aureus. Microbiology. 2011;157(Pt 6):1786–1797.
- Meehl M, Herbert S, Gotz F, et al. Interaction of the GraRS two-component system with the VraFG ABC transporter to support vancomycin-intermediate resistance in Staphylococcus aureus. Antimicrob Agents Chemother. 2007;51(8):2679–2689.
- Freeman C, Hynds HM, Carpenter JM, et al. Revealing fatty acid heterogeneity in staphylococcal lipids with isotope labeling and RPLC-IM-MS. J Am Soc Mass Spectrom. 2021;32(9):2376–2385.
- Hines KM, Waalkes A, Penewit K, et al. Characterization of the mechanisms of daptomycin resistance among gram-positive bacterial pathogens by multidimensional lipidomics. mSphere. 2017;2(6):e00492–17.
- Pisano MA, Ball DJ, Eriquez L. Temperature-related variations in the lipid composition of methicillin-resistant and methicillin-susceptible Staphylococcus aureus strains. J Clin Microbiol. 1983;17(6):1170–1172.
- Chopra I. Mechanisms of resistance to fusidic acid in Staphylococcus aureus. J Gen Microbiol. 1976;96(2):229–238.
- Mishra NN, Bayer AS. Correlation of cell membrane lipid profiles with daptomycin resistance in methicillin-resistant Staphylococcus aureus. Antimicrob Agents Chemother. 2013;57(2):1082–1085.
- Nishi H, Komatsuzawa H, Fujiwara T, et al. Reduced content of lysyl-phosphatidylglycerol in the cytoplasmic membrane affects susceptibility to moenomycin, as well as vancomycin, gentamicin, and antimicrobial peptides, in Staphylococcus aureus. Antimicrob Agents Chemother. 2004;48(12):4800–4807.
- Jones T, Yeaman MR, Sakoulas G, et al. Failures in clinical treatment of Staphylococcus aureus infection with daptomycin are associated with alterations in surface charge, membrane phospholipid asymmetry, and drug binding. Antimicrob Agents Chemother. 2008;52(1):269–278.
- Sen S, Sirobhushanam S, Johnson SR, et al. Growth-environment dependent modulation of Staphylococcus aureus branched-chain to straight-chain fatty acid ratio and incorporation of unsaturated fatty acids. PLoS One. 2016;11(10):e0165300.
- Dmitriev BA, Toukach FV, Holst O, et al. Tertiary structure of Staphylococcus aureus cell wall murein. J Bacteriol. 2004;186(21):7141–7148.
- Brown S, Xia G, Luhachack LG, et al. Methicillin resistance in Staphylococcus aureus requires glycosylated wall teichoic acids. Proc Natl Acad Sci USA. 2012;109(46):18909–18914.