
Abstract
Background
SARS-CoV-2 in exhaled aerosols is considered an important contributor to the spread of COVID-19. However, characterizing the size distribution of virus-containing aerosol particles has been challenging as high concentrations of SARS-CoV-2 in exhaled air is mainly present close to symptom onset. We present a case study of a person with COVID-19 who was able to participate in extensive measurements of exhaled aerosols already on the day of symptom onset and then for the following three days.
Methods
Aerosol collection was performed using an eight-stage impactor while the subject was breathing, talking and singing, for 30 min each, once every day. In addition, nasopharyngeal samples, saliva samples, room air samples and information on symptom manifestations were collected every day. Samples were analyzed by RT-qPCR for detection of SARS-CoV-2 RNA.
Results
SARS-CoV-2 RNA was detected in seven of the eight particle size fractions, from 0.34 to >8.1 µm, with the highest concentrations found in 0.94–2.8 µm particles. The concentration of SARS-CoV-2 RNA was highest on the day of symptom onset, and declined for each day thereafter.
Conclusion
Our data showed that 90% of the exhaled SARS-CoV-2 RNA was found in aerosol particles <4.5 µm, indicating the importance of small particles for the transmission of COVID-19 close to symptom onset. These results are important for our understanding of airborne transmission, for developing accurate models and for selecting appropriate mitigation strategies.
Introduction
The aerodynamic size of the aerosol particles containing SARS-CoV-2 is key to understanding their transport behavior in air, their deposition mechanisms in the respiratory tract upon inhalation and type of personal protective equipment and mitigation strategies that would be efficient to minimize exposure. The importance of different particle sizes’ contribution to the spread of COVID-19 has been widely debated during the pandemic; however, the existing data are still scarce. A handful of studies have presented size-resolved information on SARS-CoV-2 RNA in exhaled aerosols; however, most of them with only two or three size fractions [Citation1–3]. Others have collected size-segregated aerosol samples from hospital air and detected SARS-CoV-2 RNA; however, the sources of aerosolization, such as coughing or medical procedures, were not well defined [Citation4–7]. Taken together, these findings have identified SARS-CoV-2 RNA in aerosol particles ranging from <0.25 µm to >10 µm, but the size resolution and information on relative concentrations are limited. Furthermore, there is no data on changes in the size of exhaled virus-containing aerosol particles during the course of the COVID-19 infection.
In this case study, we found a person with confirmed COVID-19 already on the day of symptom onset, who was able to participate in extensive measurements. Thus, we performed detailed characterization of the exhaled SARS-CoV-2-containing aerosol particle size distribution during breathing, talking and singing, from the day of symptom onset and then daily for a total of four days.
Materials and methods
Measurements were performed in February 2022 on the exhaled air from a COVID-19 subject on the first four days of symptoms. The subject had been exposed to SARS-CoV-2 two days prior to symptom onset and was screened positive by PCR test for SARS-CoV-2. The subject, a healthy 33 year old man, was fully vaccinated (three doses, last dose six weeks earlier) and without previously known COVID-19.
Aerosol and patient sample collection
On each day, the subject was breathing, talking and singing for 30 min each into the opening of a funnel from which exhaled aerosol was sampled (). A silica dryer removed moisture from the exhaled air to guarantee that the particles were measured at their dry size as is standard for comparison of aerosol size distributions. Thereafter, the exhaled air was directed to a next generation impactor (NGI, Copley Scientific) used for virus analysis and an aerodynamic particle sizer (APS, model 3321, TSI Inc.) for overall aerosol size distribution in the range 0.5–20 µm. The NGI was operated during 30 min for each sample at an airflow rate of 60 L min−1, separating particles in the following eight size fractions: >8.1 µm, 8.1–4.5 µm, 4.5–2.8 µm, 2.8–1.7 µm, 1.7–0.94 µm, 0.94–0.55 µm, 0.34–0.55 µm and 0.14–0.34 µm [Citation8]. A new NGI collection plate was used for each of the breathing, talking and singing exercises.
Figure 1. Schematic picture of the exhaled aerosol collection setup. The subject was standing with the face in the opening of a funnel for sampling of the exhaled aerosol. The aerosol was first dehumidified by the dryer and then sampled by the next generation impactor (NGI) and the aerodynamical particle sizer (APS).
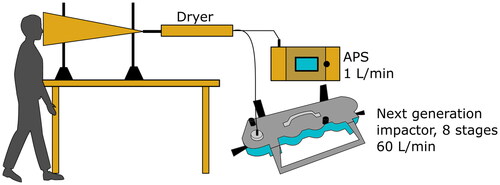
Measurements took place in the subject’s home and therefore, measurements of existing SARS-CoV-2 in the room air was performed every day starting simultaneously with the exhaled aerosol measurements using a liquid cyclone, the Coriolis µ (Bertin Technologies) as described in [Citation9].
On each sampling day, the subject answered a questionnaire about perceived symptoms, and in addition, a nasopharyngeal swab sample and a saliva spit sample, intended to represent the hypopharyngeal region closer to the vocal cords (hereafter referred to as saliva), were collected.
Sample preparation and analysis
The NGI collection plates were sealed and stored at room temperature (<48 h) until transported to the laboratory where each impactor stage was swabbed with a wetted flocked nylon swab (UTM swabs, Copan Diagnostics). The swab was then placed in 1 mL universal transport media (UTM), vortexed and stored at −80 °C. RNA was extracted using the MagNA Pure 96 DNA and Viral NA Small Volume Kit (Roche Molecular Systems Inc.).
The Coriolis room air samples were stored at 4 °C (<48 h) until transported to the laboratory and then stored at −80 °C. The sample was concentrated to 140 µL using Amicon Ultra-15 centrifugal filter units (50 kDa cutoff, Merck Millipore). RNA from room air, nasopharyngeal and saliva samples were extracted using the QIAamp Viral RNA Mini kit (Qiagen). The nasopharyngeal sample from the day of symptom onset was analyzed by PCR for variant-specific mutations in the spike region.
All samples were analyzed by reverse transcription quantitative polymerase chain reaction (RT-qPCR) using the qPCRBIO Probe 1-step virus detect kit (PCR Biosystems) with the CDC N1 and N2 primers and probes (impactor samples) [Citation10] or with the WHO E-gene primers and probes (nasopharyngeal, saliva and room air samples). All samples were run in duplicates and samples with at least one Ct-value ≤40 were considered positive.
Results
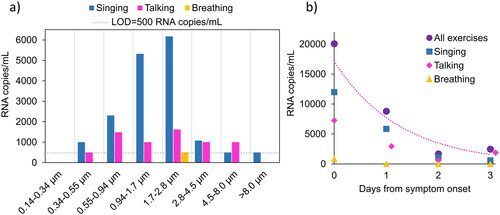
SARS-CoV-2 RNA was detected in seven particle size fractions from 0.34 to >8.1 µm, but not in the eighth and smallest size fraction, 0.14–0.34 µm (). The highest RNA concentrations were found in particles sized 0.94–2.8 µm during singing and talking. For all days and exercises, 90% of the SARS-CoV-2 RNA was detected in aerosol particles <4.5 µm. The concentration of SARS-CoV-2 RNA was highest at the day of symptom onset and declined for each day thereafter (). There were similar numbers of SARS-CoV-2 positive size fractions during singing (n = 12) and talking (n = 10), but only one size fraction was positive for breathing throughout the four days of measurements (collected on the day of symptom onset).
Figure 2. (a) SARS-CoV-2 RNA concentrations from each exercise on all four days (added together) in the eight impactor stages. The dashed line indicates the limit of detection (LOD) concentration for one sample. (b) The concentrations of SARS-CoV-2 RNA on the day of symptom onset (day 0) and the following three days (all particle size fractions added together). An exponential trend line was fitted to the ‘All exercises’ data series.
The same data as in are presented in , separated for each day from symptom onset (breathing, talking and singing added together). The majority of SARS-CoV-2 RNA was found in particles <4.5 µm on all days (day 0: 90%, day 1: 93%, day 2: 68% and day 3: 100%).
Figure 3. (a) SARS-CoV-2 RNA concentrations from all exercises (added together) on each day in the eight impactor stages. The dashed line indicate the limit of detection (LOD) for one sample. (b) RNA concentration in nasopharyngeal and saliva samples on the day of symptom onset (day 0) and the following three days (note the logarithmic scale).
The subject was infected with SARS-CoV-2 omicron BA.2. Both the nasopharyngeal and saliva samples had lower RNA concentrations on the day of symptom onset compared to on day 1 and thereafter RNA levels decreased again (). Thus, the highest concentrations in exhaled aerosols preceded the peak concentrations in nasopharynx and saliva with one day.
The subject had cough and congested nose from the day of symptom onset and the three following days. Other symptoms were runny nose (day 0), sore throat (day 0), myalgia (day 1–2) and fatigue (day 2). The case fully recovered from the infection within one week.
Three of four room air samples were negative as well as the negative control collected in outdoor air. The room air sample collected on day 0 was positive, close to the detection limit, corresponding to 200 RNA copies m−3 air.
Particle size and concentration data obtained from the APS were analyzed; however, the high sampling airflow rate through the funnel, 61 L min−1 compared to the lower normal exhalation airflow rate, ∼10 L min−1, made the exhaled particle concentrations indistinguishable from the background concentration. Thus, the APS data were not considered further.
Discussion
We present the to date most detailed size distribution of SARS-CoV-2 RNA containing aerosol particles from the exhaled air that we collected from one person with COVID-19 on the day of symptom onset and the three following days. SARS-CoV-2 RNA was found in seven of the eight aerosol particle size fractions, from 0.34 to >8.1 µm (). The size of an aerosol particle is important as it determines its aerodynamic behavior, meaning how long it can remain airborne and how and where it deposits on surfaces or in our respiratory tract. Thus, it is crucial to understand in what particle sizes SARS-CoV-2 exist, in order to design appropriate protection equipment and mitigation strategies such as ventilation and respiratory masks.
Previous studies have detected exhaled SARS-CoV-2 RNA in two [Citation1,Citation2], three [Citation3] or five size fractions [Citation11]. Adenaiye et al. found 50% more positive samples <5 µm than >5 µm during breathing, talking and singing combined [Citation1]. Coleman et al. found 85% of all RNA gene copies <5 µm (15% in >5µm), mainly during talking and singing [Citation2]. In a previous study, we detected SARS-CoV-2 RNA in seven samples <4 µm (three samples <1 µm and four samples 1–4 µm) and two samples >4 µm during breathing, talking and singing combined [Citation3]. These findings agree with the results in the present study, showing that 90% of the airborne SARS-CoV-2 RNA exhaled during vocalization is present in aerosol particles <4.5 µm. As is standard, the aerosol particles were measured at their dry size. The original droplet size can be assumed to be up to 5 times larger in diameter considering that, for instance, saliva contains around 99% water. This water will, however, evaporate within a few seconds and almost always before the particles deposit on the ground.
Lednicky et al. detected more SARS-CoV-2 RNA in the size fraction 0.25–0.5 µm than in the other four size fractions together (<0.25, 0.5–1.0, 1.0–2.5 and 2.5–10 µm) [Citation11]. However, the patient was not talking or singing, which could be the reason for finding less SARS-CoV-2 RNA in the 1–3 µm where this study detected the highest RNA levels. Studies on non-infectious exhaled aerosol particles have shown increased concentrations of aerosol particles in the size range 1–3 µm during talking and singing compared to breathing [Citation12,Citation13]. The sampling procedure in a car cabin, by Lednicky et al. may also be favorable to smaller accumulation mode particles that deposit less efficiently.
The concentration of SARS-CoV-2 RNA declined by 50% from the day of symptom onset to the day after and continued to decline rapidly the following two days (). Previous studies have also seen an association between short time from symptom onset and SARS-CoV-2 detection in exhaled aerosols [Citation2,Citation3,Citation14]. Thus, available data indicate that aerosol transmission is more prone to happen close to symptom onset than later during the course of the infection.
Any influence on the impactor measurements from existing SARS-CoV-2 in the room air was minor on day 0 and undetectable on days 1–3. The SARS-CoV-2 RNA collected in the room air sample corresponded to 2% of the RNA collected by the impactor on day 0; hence, we consider the background negligible.
Nasopharyngeal and saliva samples followed the same pattern with the highest concentrations on the day after symptom onset, however, in discordance with the pattern of exhaled aerosol samples where the highest levels were found on day 0. This is interesting, as COVID-19 has been dominated by presymptomatic transmission [Citation15]. Since this is a one-subject observation, more data are needed to verify the results with statistical significance.
Three studies have cultivated SARS-CoV-2 from size-segregated aerosol samples, both being successful only with samples containing sub-micrometer particles [Citation1,Citation5,Citation11]. In this study, we did not cultivate the samples due to suboptimal sample handling for that purpose; however, we saw a rapid decline in the sub-micrometer particles’ RNA concentrations after symptom onset (). Combined with epidemiological studies showing that most COVID-19 transmission occurs close to symptom onset [Citation16], it is likely that sub-micrometer particles are important for the spread of COVID-19.
SARS-CoV-2 in aerosol particles smaller than 1 µm could explain why facemask protection only partly reduces COVID-19 spread [Citation17]. A study testing particle trapping efficiencies of surgical facemasks showed a 2.8 fold reduction of viral copy numbers in fine particles exhaled from patients and a 25 fold reduction of coarse particles [Citation18]. Nonetheless, wearing a facemask reduces both emissions and the inhaled dose in case of presence of infectious aerosols and is, thus, a useful tool for minimizing spread of COVID-19.
This case study only investigate a single subject. There are known interindividual variations in viral load [Citation19], aerosol emissions [Citation2,Citation12,Citation13,Citation18], infectiousness [Citation20] and symptom manifestations in between cases of COVID-19. Though considering that our findings are in line with both SARS-CoV-2 RNA emissions and non-infectious respiratory aerosol emissions, and corresponds well to COVID-19 transmission primarily occurring close to symptom onset [Citation16], the generalizability of our results is strong despite being a case study. Extensive SARS-CoV-2 aerosol emissions close to symptom onset caused by vocalization (talking and singing) can explain the significant contribution of COVID-19 spread originating from super-spreading events [Citation21,Citation22].
Conclusions
By intense sampling in a single patient, we provide detailed information on the distribution of SARS-CoV-2 RNA in different aerosol particle sizes on the day of symptom onset and the following three days. SARS-CoV-2 RNA was detected in seven size fractions from 0.34 to >8.1 µm with the highest concentrations found in particles sized 0.94–2.8 µm. We found 90% of the SARS-CoV-2 RNA in particles <4.5 µm, which can stay airborne for hours, deposit in all parts of the lung upon inhalation and they easily follow air movements. Our results indicate that these small particles are of high importance for the spread of COVID-19, especially close to symptom onset.
Ethical approval
The study was conducted in accordance with the Declaration of Helsinki and approved by the Swedish Ethical Review Authority (2020-07103, approved 2021-01-25).
Informed consent
Informed consent was obtained from all subjects involved in the study. Written informed consent has been obtained from the patient(s) to publish this paper.
Author contributions
Conceptualisation, MA, DN, C-JF and JL; methodology, MA, DN, ST, PM, JL, data curation, MA; writing – original draft preparation, MA; writing – review and editing, MA, DN, ST, C-JF, PM and JL. All authors have read and agreed to the published version of the manuscript.
Acknowledgments
The authors thank Sviataslau Sasinovich and Tommy Göransson for skilled laboratory assistance and the COVID-19 subject for cooperation.
Disclosure statement
No potential conflict of interest was reported by the author(s).
Additional information
Funding
References
- Adenaiye OO, Lai J, de Mesquita PJB, et al. Infectious SARS-CoV-2 in exhaled aerosols and efficacy of masks During early mild infection. Clin Infect Dis. 2021;75(1):e241–e248.
- Coleman KK, Tay DJW, Sen Tan K, et al. Viral load of SARS-CoV-2 in respiratory aerosols emitted by COVID-19 patients while breathing, talking, and singing. Clin Infect Dis. 2021;74(10):1722–1728.
- Alsved M, Nygren D, Thuresson S, et al. SARS-CoV-2 in exhaled aerosol particles from covid-19 cases and its association to household transmission. Clin Infect Dis. 2022;75(1):e50–e56.
- Liu Y, Ning Z, Chen Y, et al. Aerodynamic analysis of SARS-CoV-2 in two wuhan hospitals. Nature. 2020;582(7813):557–560.
- Santarpia JL, Herrera VL, Rivera DN, et al. The size and culturability of patient-generated SARS-CoV-2 aerosol. J Expo Sci Environ Epidemiol. 2022;32(5):706–711.
- Stern RA, Al-Hemoud A, Alahmad B, et al. Levels and particle size distribution of airborne SARS-CoV-2 at a healthcare facility in Kuwait. Sci Total Environ. 2021;782:146799.
- Stern RA, Koutrakis P, Martins MAG, et al. Characterization of hospital airborne SARS-CoV-2. Respir Res. 2021;22(1):73.
- Marple VA, Olson BA, Santhanakrishnan K, et al. Next generation pharmaceutical impactor (a new impactor for pharmaceutical inhaler testing). Part II: archival calibration. J Aerosol Med. 2003;16(3):301–324.
- Thuresson S, Fraenkel C-J, Sasinovich S, et al. Airborne SARS-CoV-2 in hospitals–effects of aerosol-generating procedures, HEPA-filtration units, patient viral load and physical distance. Clin Infect Dis. 2022;75(1):e89–e96.
- Petrillo S, Carra G, Bottino P, et al. A novel multiplex qRT-PCR assay to detect SARS-CoV-2 infection: high sensitivity and increased testing capacity. Microorganisms. 2020;8(7):1064.
- Lednicky JA, Lauzardo M, Alam MM, et al. Isolation of SARS-CoV-2 from the air in a car driven by a COVID patient with mild illness. Int J Infect Dis. 2021;108:212–216.
- Alsved M, Matamis A, Bohlin R, et al. Exhaled respiratory particles during singing and talking. Aerosol Sci Technol. 2020;54(11):1245–1248.
- Gregson FKA, Watson NA, Orton CM, et al. Comparing aerosol concentrations and particle size distributions generated by singing, speaking and breathing. Aerosol Sci Technol. 2021;55(6):681–691.
- Leding C, Skov J, Uhrbrand K, et al. Detection of SARS-CoV-2 in exhaled breath from non-hospitalized COVID-19-infected individuals. Sci Rep. 2022;12(1):11151.
- Johansson MA, Quandelacy TM, Kada S, et al. SARS-CoV-2 transmission from people without COVID-19 symptoms. JAMA Netw Open. 2021;4(1):e2035057.
- Ge Y, Martinez L, Sun S, et al. COVID-19 transmission dynamics among close contacts of index patients With COVID-19: a population-based cohort study in Zhejiang province, China. JAMA Intern Med. 2021;181(10):1343–1350.
- Talic S, Shah S, Wild H, et al. Effectiveness of public health measures in reducing the incidence of covid-19, SARS-CoV-2 transmission, and covid-19 mortality: systematic review and meta-analysis. BMJ. 2021;375:e068302.
- Milton DK, Fabian MP, Cowling BJ, et al. Influenza virus aerosols in human exhaled breath: particle size, culturability, and effect of surgical masks. PLoS Pathog. 2013;9(3):e1003205.
- Yang Q, Saldi TK, Gonzales PK, et al. Just 2% of SARS-CoV-2-positive individuals carry 90% of the virus circulating in communities. Proc Natl Acad Sci U S A. 2021;118(21):e2104547118.
- Jones TC, Biele G, Muhlemann B, et al. Estimating infectiousness throughout SARS-CoV-2 infection course. Science. 2021;373(6551):eabi5273.
- Greenhalgh T, Jimenez JL, Prather KA, et al. Ten scientific reasons in support of airborne transmission of SARS-CoV-2. Lancet. 2021;397(10285):1603–1605.
- Adam DC, Wu P, Wong JY, et al. Clustering and superspreading potential of SARS-CoV-2 infections in Hong Kong. Nat Med. 2020;26(11):1714–1719.