
Abstract
Background
Rifampicin, a key drug against tuberculosis (TB), displays wide between-patient pharmacokinetics variability and concentration-dependent antimicrobial effect. We investigated variability in plasma rifampicin concentrations and the role of SLCO1B1, ABCB1, arylacetamide deacetylase (AADAC) and carboxylesterase 2 (CES-2) genotypes in Ethiopian patients with TB.
Methods
We enrolled adult patients with newly diagnosed TB (n = 119) who had received 2 weeks of rifampicin-based anti-TB therapy. Venous blood samples were obtained at three time points post-dose. Genotypes for SLCO1B1 (c.388A > G, c.521T > C), ABCB1 (c.3435C > T, c.4036A > G), AADACc.841G > A and CES-2 (c.269-965A > G) were determined. Rifampicin plasma concentration was quantified using LC-MS/MS. Predictors of rifampicin Cmax and AUC0–7 h were analysed.
Results
The median rifampicin Cmax and AUC0–7 were 6.76 µg/mL (IQR 5.37–8.48) and 17.05 µg·h/mL (IQR 13.87–22.26), respectively. Only 30.3% of patients achieved the therapeutic efficacy threshold (Cmax>8 µg/mL). The allele frequency for SLCO1B1*1B (c.388A > G), SLCO1B1*5 (c.521T > C), ABCB1 c.3435C > T, ABCB1c.4036A > G, AADAC c.841G > A and CES-2 c.269-965A > G were 2.2%, 20.2%, 24.4%, 14.6%, 86.1% and 30.6%, respectively. Sex, rifampicin dose and ABCB1c.4036A > G, genotypes were significant predictors of rifampicin Cmax and AUC0–7. AADACc.841G > A genotypes were significant predictors of rifampicin Cmax. There was no significant influence of SLCO1B1 (c.388A > G, c.521T > C), ABCB1c.3435C > T and CES-2 c.269-965A > G on rifampicin plasma exposure variability.
Conclusions
Subtherapeutic rifampicin plasma concentrations occurred in two-thirds of Ethiopian TB patients. Rifampicin exposure varied with sex, dose and genotypes. AADACc.841G/G and ABCB1c.4036A/A genotypes and male patients are at higher risk of lower rifampicin plasma exposure. The impact on TB treatment outcomes and whether high-dose rifampicin is required to improve therapeutic efficacy requires further investigation.
Introduction
Whilst effective tuberculosis (TB) treatment has been available for the past seven decades, the latest 2022 WHO Annual Global Tuberculosis Report highlights that TB remains a leading cause of death from an infectious disease worldwide [Citation1]. Considerable success have been achieved in treatment outcomes since the introduction of rifampicin in 1970. However, the global increase in HIV incidence, poor adherence to 6-month therapy and suboptimal drug concentrations due to interindividual pharmacokinetic variations of first-line antitubercular drugs have contributed to the emergence of resistance to TB drugs [Citation2–4]. Drug-resistant TB is a concern in East African countries [Citation5]. Ethiopia is among the top 30 countries with the highest TB and TB-HIV burden with an incidence of 119 cases per 100,000 people in 2021 [Citation1].
A combination of rifampicin with isoniazid is the backbone of modern anti-TB therapy. Rifampicin has concentration-dependent bactericidal activity [Citation6]. The microbial killing of rifampicin was linked to the ratio of the area under the concentration-time curve and the minimum inhibitory concentration (AUC/MIC) and the maximum concentration (Cmax)/MIC (Cmax/MIC) ratio. Rifampicin prevents resistance to itself and attains sufficient bactericidal effect at a free Cmax/MIC ratio of ≥175 [Citation7,Citation8]. A rifampicin Cmax between 8 and 24 µg/mL is considered optimal and Cmax below 4 µg/mL is a risk factor for treatment failure [Citation9].
Rifampicin undergoes hepatic metabolism by genetically polymorphic carboxylesterases (CES) and arylacetamide deacetylase (AADAC), a serine esterase to 25-deacetylrifampicin [Citation10]. Rifampicin pharmacokinetics and treatment outcomes display wide between-patient variations [Citation11,Citation12]. Genetic variation in enzymes and transporter proteins relevant to rifampicin disposition may influence the variability of plasma rifampicin exposure. Previous studies in various populations investigated the impact of genetic variation in AADAC and CES on rifampicin plasma exposure with varying results [Citation13–16]. Rifampicin is a substrate and inducer of the organic anion transporter polypeptide 1B1 (OAT1B1) encoded by the SLCO1B1 gene [Citation17] and P-glycoprotein (P-gp) encoded by the ABCB1 gene [Citation18]. OAT1B1 mediates hepatocellular uptake of rifampicin while P-gp mediates drug efflux. Both SLCO1B1 and ABCB1 genes are genetically polymorphic displaying wide between-population variation in enzyme activity and variant allele frequency distributions. In the few published studies investigating the effect of the SLCO1B1 and ABCB1 gene polymorphism on rifampicin pharmacokinetics, the result is inconclusive [Citation16,Citation19–22].
The pharmacokinetics and pharmacogenetics of rifampicin display wide between-race and between-population variations, highlighting the need for investigation in different geographic locations where the burden of TB is high. The effect of pharmacogenetic variability in rifampicin pharmacokinetics using a targeted candidate gene approach has been explored in various Asian and Caucasian populations [Citation22–24], but data from sub-Saharan Africa remain scarce. Ethiopia is the seventh top high-TB burden country globally [Citation1]and the second most populous nation in Africa. The pharmacogenetics of SLCO1B1 and ABCB1 in Ethiopians differs from that of other black African populations and inhabitants of European origin [Citation23,Citation25,Citation26]. In this study, we examined the variability in rifampicin Cmax and AUC0–7 in Ethiopian TB patients in relation to the recommended target concentration for optimal therapeutic efficacy and the impact of common functional genetic variants in SLCO1B1 (rs2306283 and rs4149056), ABCB1 (rs1045642 and rs3842), CES 2 (rs4783745) and AADAC (rs1803155) on between-patient variability in rifampicin plasma concentration.
Methods
Study participants and settings
The study participants were newly diagnosed adults aged 18–65 years with either pulmonary or extrapulmonary drug-sensitive Mycobacterium tuberculosis attending TB clinics in Addis Ababa (Beletshachew, Teklehymanote, Kazanchis, Woreda 2 and Areda Health Centre). The study was conducted from October 2019 to November 2021.
Blood sample collection
Blood samples were obtained 2 weeks after treatment initiation during the intensive phase of TB therapy. Following overnight fasting, participants received drugs under direct observation in the morning. A total of 351 venous blood samples were collected in EDTA tubes, with three samples taken at different times from 113 subjects and two times from 6 subjects. The blood sampling points ranged from 1 to 7 h post-dose, with the majority of subjects sampled at 1, 2, 4, or 2, 4, or 6 h post-dose. Plasma was separated immediately and stored at −80 °C at the Department of Pharmacology and Clinical Pharmacy, Addis Ababa University until transported to Karolinska Institutet, Stockholm, Sweden for analysis.
Ethical approval
Ethical approval was obtained from the Institutional Review Board of the College of Health Sciences at Addis Ababa University and the National Research Ethics Review Committee. All patients were informed about the purpose of the study and those willing to participate and who provided written informed consent were enrolled. The study was conducted following the ethical principle of the Helsinki Declaration.
Treatment
Study participants received a standard daily dose of rifampicin in combination with isoniazid, pyrazinamide and ethambutol according to the Ethiopian treatment guidelines [Citation27]. Patients with a body weight above 55kg received four fixed-dose combinations (FDC) tablets daily. Patients with a body weight between 40 and 55 kg received three FDC tablets daily and those below 40 kg received two FDC tablets daily. Each FDC tablet contains 150, 75, 400 and 275 mg of rifampicin, isoniazid, pyrazinamide and ethambutol, respectively. Treatment was given as directly observed therapy at a primary health care facility in Addis Ababa, Ethiopia.
DNA extraction and genotyping
Genomic DNA was extracted from whole blood samples using the QIAmp DNA Blood Midi Kit (QIAGEN GmbH, Hilden, Germany) following the manufacturer’s instructions. Common functional variant alleles in the black African population relevant to rifampicin disposition were selected for genotyping. Genotyping was performed using TaqMan® drug metabolism assay reagents for allelic discrimination (Applied Biosystems Genotyping Assays) as described previously [Citation28] with the following ID numbers: C___8911003_1 for AADAC2 (c.841G > A,rs1803155), C__31760486_10 for CES2 (c.269-965A > G, rs4783745), C___7586657_20 for ABCB1 (3435 C > T, rs1045642), C__11711730_20 for ABCB1 (c.193A > G, rs3842), C___1901697_20 for SLCO1B1 (c.388A > G, rs2306283) and C__30633906_10 for SLCO1B1 (c.521T > C, rs4149056).
The final volume for each reaction was 10 µL, consisting of 1 µL genomic DNA and 9 µL of TaqMan® fast advanced master mix (Applied Biosystems, Waltham, MA, United States), DNA/RNA free water, TaqMan 40X for SLCO1B1, ABCB1 and TaqMan 20× for AADAC2 and CES2 drug metabolism genotyping assays mix (Applied Biosystems). Genotyping was performed by real-time qPCR (Applied Biosystems) equipped with 7500 software V2.3 (Life Technologies Corporation) for allelic discrimination.
Quantification of rifampicin plasma concentrations
To determine rifampicin plasma concentrations, blood samples were collected 2 weeks after treatment initiation during the intensive phase of TB therapy. After overnight fasting, study participants received drugs under direct observation in the morning. Venous blood was taken in EDTA tubes at three time points from 1 to 7 h post-dose. Plasma was separated immediately and stored at −80 °C at the Department of Pharmacology and Clinical Pharmacy, Addis Ababa University until transported to Karolinska Institutet, Stockholm, Sweden for analysis.
Rifampicin plasma concentrations were determined using a liquid chromatography-tandem mass spectrometry (LC-MS/MS) as described previously [Citation11]. The method was validated according to the European Medicines Agency guidelines [29]. The LC-MS/MS system consisted of an Acquity Ultra Performance LC-system coupled to a Xevo TQ-S Micro (Waters, Milford, MA, USA) and aYMC-ultraHT hydrosphere C18, 2 µm, 100 × 2 mm, reversed-phase column (Waters) was used. Sample preparation consisted of protein precipitation with acetonitrile containing deuterated rifampicin as an internal standard. In brief, 100 µL plasma samples were diluted with a 300 µL solution containing the internal standards dissolved in acetonitrile. After shaking for 30 s and 5 min of centrifugation, 150 µL of the supernatant was transferred to another plate. The supernatant dried for 30 min at 35 °C and the dried sample was re-suspended with 15 µL methanol and 275 µL 0.1% formic acid for injection. The mobile phase gradient of 0.1% formic acid in Milli-Q pure water, 100% methanol:methanol/Milli-Q pure water:formic acid (10:90:0.1), methanol:Milli-Q pure water:isopropanol:formic acid (70:20:10:0.1), methanol:Milli-Q pure water (10:90). Rifampicin concentrations were calculated by linear regression from a six-point calibration curve. The limits of the quantitation range for rifampicin were 0.1 and 40 µg/mL.
Pharmacokinetic and statistical analyses
Study participants’ sociodemographic and baseline clinical parameters are summarised as the median and interquartile range (IQR) or as frequency and percentages. The rifampicin Cmax was determined from the available plasma concentrations. The highest concentration observed was taken as Cmax. AUC0–7 h calculation was performed using the trapezoidal rule. GraphPad Prism was used to calculate AUC0–7 h.
The Shapiro–Wilk test was used to determine the normality of pharmacokinetics data. Non-normally distributed data are presented as median (IQR) and normally distributed as mean (standard deviations [SD]). The chi-square test was used to assess correlations between the observed and expected genotype frequencies according to the Hardy–Weinberg equilibrium. All plasma concentration data were log 10 transformed before conducting statistical analyses [Citation29]. The association of each genotype with between-patient variability in Cmax and AUC0–7 was analyzed using a one-way analysis of variance, comparing the geometric mean of log-transformed concentration data [Citation30]. Predictors of Cmax and AUC0–7 h of rifampicin were subjected to further analysis through univariate followed by multivariate regression analysis, incorporating study participant characteristics and genotypes as potential predictors. Variables with p value <0.2 from the univariate analysis were included in the multivariate regression analysis. Data were analyzed using SPSS version 25 and a p value ≤0.05 was considered to indicate statistical significance.
Results
Study participants characteristics
Of the 119 study participants, consisting of 62 males and 57 females, 78 were diagnosed with pulmonary TB and 41 had extrapulmonary TB. The median body weight was 54.8 kg (IQR, 48.0–61.7), and the median age was 28 years (IQR, 22 – 35). The mean dose of rifampicin was 9.39 mg/kg (SD = 0.98). The prevalence of cigarette, khat and alcohol use was 13.4%, 18.5% and 16.8%, respectively. Notably, a lower percentage of patients with extrapulmonary TB reported cigarette, khat and alcohol use compared to those with pulmonary TB. Furthermore, patients with extrapulmonary TB showed higher rifampicin Cmax (p = 0.07) and AUC0–7 (p = 0.23) values but the differences were not statistically significant. The sociodemographic characteristics of the participants are presented in .
Table 1. Sociodemographic and clinical characteristics of 119 Ethiopian tuberculosis patients.
Genotype and allele frequency
Study participants were genotyped for SLCO1B1c.388A > G, SLCO1B1 c.521T > C, ABCB1 c.3435C > T, ABCB1 c.4036A > G, AADAC c.841G > A and CES-2 c.269-965A > G. The observed genotype and allele frequency distributions among patients are shown in . There were no significant differences between observed and expected genotype frequencies according to Hardy–Weinberg equilibrium. The variant allele SLCO1B1c.388A > G was frequent (62.2%), while the defective variant allele SLCO1B1c.521T > C (*5) was less frequent (20.2%). The minor variant allele frequency for ABCB1 c.3435T and ABCB1 c.4036G were 24, 4%, and 14.6%, respectively. The variant AADAC c.841A variant allele had a much higher frequency (86.1%), whereas the CES-2 c.269-965G allele occurred in 30.6%.
Table 2. Genotype and variant allele frequency of SLCO1B1, ABCB1, AADAC and CES-2.
Rifampicin pharmacokinetics
There was high between-patient variability in rifampicin Cmax (range 1.90–18.57 µg/mL) and AUC0–7 (range 3.61–47.1 µg × h/mL). The median rifampicin Cmax was 6.76 µg/mL (IQR 5.33–8.49). Only 30.3% (n = 36) of participants achieved the target plasma concentration (> 8 µg/mL) for optimal therapeutic efficacy [Citation31]. Cmax <4 µg/mL, which is associated with risk for treatment failure, was observed in 5 (4.2%) patients. The median AUC0–7 h was 17.1 µg × h/mL (IQR 13.9–22.3).
Effect of genotype on rifampicin pharmacokinetics
A comparison of the median and geometric mean of rifampicin Cmax and AUC0–7 h between the different genotypes using one-way analysis of variance is presented in . Although no significant influence of SLCO1B1*1B and SLCO1B1*5 genotype on variation in rifampicin Cmax and AUC0–7 h was found, patients homozygous for SLCO1B*5/*5 (C/C) had a Cmax below the target concentration. No significant difference in Cmax and AUC0–7 was observed in ABCB1 c.3435C > T and CES 2 c.269-965A > G genotype groups.
Table 3. Effects of SLCO1B1, ABCB1, AADAC and CES-2 genotype on rifampicin Cmax and AUC0–7 h in Ethiopian TB patients (n = 119).
Significant variability in rifampicin Cmax (p = 0.018) and AUC0–7 h (0.02) between the ABCB1 c.4036A > G genotype groups was observed. The geometric mean of Cmax and AUC0–7 h was significantly higher among patients homozygous for the variant allele ABCB1c.4036G/G than heterozygous A/G or homozygous wild type (A/A)(). A further post hoc analysis using Bonferroni correction indicated significant differences in Cmax (p = 0.036) and AUC0–7 h (p = 0.023) between homozygous ABCB1 c.4036 A/A and homozygous wild-type (G/G) groups. The comparison of Cmax and AUC0–7 h between the different ABCB1 c.4036A > G genotype groups is presented in . No significant difference in Cmax and AUC0–7 was observed in the different ABCB1 c.3435C > T genotype groups.
Figure 1. Comparison of rifampicin Cmax and AUC0–7 h in the ABCB1 c.4036A > G (right) and AADAC2 c.841G > A (left) genotypes. The box plots show the median ± interquartile range, whereas whiskers denote the minimum and maximum values.
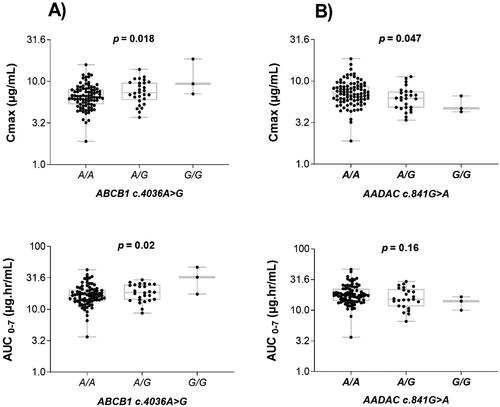
Furthermore, a significant association of AADAC c.841G > A genotype with rifampicin Cmax (p = 0.047) and a similar trend for AUC0–7 (p = 0.16) was observed and was lower in the wild type (G/G) genotype than heterozygous (A/G) or homozygous for A variant allele (A/A) (). However, a post hoc test showed no significant variation for AUC0–7 among the pairs of all three genotypes of AADAC c.841G > A. There was no significant association of CES 2 c.269-965A > G genotype with rifampicin Cmax and AUC0–7 h.
Predictors of rifampicin pharmacokinetics
A univariate followed by a multivariate analysis was conducted to identify predictors of Cmax and AUC0–7 h using log10 transformed concertation data. shows the results of univariate and multivariate analyses of associations between variables and rifampicin Cmax and AUC0–7 h. In univariate analysis, ABCB1 c.4036A > G, AADAC c.841G > A genotypes and rifampicin dose were significant predictors of rifampicin Cmax (p ≤ 0.05), and a nearly significant effect was observed for sex (p = 0.06). All variables with p value <0.2 were further tested in the multivariate regression model. In multivariate analysis, sex, rifampicin dose, ABCB1 c.4036A > G and AADAC c.841G > A genotypes remained independent predictors of rifampicin Cmax.
Table 4. Univariate and multivariate linear regression analysis of factors associated with rifampicin log10Cmax and log10AUC0–7 h in Ethiopian adult tuberculosis patients.
ABCB1 c.4036A > G and drug dose were significant predictors for rifampicin AUC0–7 h in both univariate and multivariate analysis. In multivariate analysis, sex was also a predictor of rifampicin AUC0–7 h. Overall, females had higher exposure to rifampicin compared to males. Age, alcohol, cigarette and khat use, SLCO1B1c.388A > G, SLCO1B1c.521T > C, ABCB1 c.3435C > T, CES-2 c.269-965A > G genotypes and days on drug therapy did not predict rifampicin exposure (Cmax and AUC0–7 h).
The stepwise multivariate regression analysis demonstrated that ABCB1 c.4036A > G genotypes independently accounted for 5.8% of the variability in rifampicin Cmax. Combining AADAC c.841G > A and ABCB1 c.4036A > G genotypes increased the explained variability to 10.8%. Additionally, 14% variability in rifampicin Cmax was observed when the drug dose (mg) was added to the two genotypes. The overall variability in rifampicin Cmax explained by the two genotypes, drug dose and sex was 17.2%. Similarly, ABCB1 c.4036A > G genotypes explained 6.1% of the variability in rifampicin AUC0–7 explained by. With the sequential addition of sex, drug dose and AADAC c.841G > A to the model, the variability in rifampicin AUC0–7 increased to 10.1%, 15.8%, and 19.3%, respectively. These findings underscore the significant roles of AADAC c.841G > A and ABCB1 c.4036A > G genotype, along with sex and drug dose in predicting rifampicin Cmax and AUC0–7 among the variables examined.
Discussion
The study is the first to examine the relationship between genetic polymorphism and rifampicin pharmacokinetics in the Ethiopian population. We investigated the between-patient variability of rifampicin pharmacokinetics parameters (Cmax and AUC0–7 h) in Ethiopian adults commencing TB treatment and the role of pharmacogenetic variations in drug transporter proteins (SLCO1B1 and ABCB1) and metabolising enzymes relevant for rifampicin disposition (AADAC2 and CES2). There were several notable findings. First, there was substantial between-patient variability in rifampicin plasma concentrations. Second, a majority (70%) of patients had rifampicin plasma concentrations below the recommended target (≥8 µg/mL). Third, rifampicin dose, ABCB1c.4036A > G and AADACc.841G > A genotypes and to some extent, sex were independent predictors of rifampicin Cmax and AUC0–7 h.
Two weeks after treatment initiation, a 2-h post-dose plasma sample is recommended for therapeutic drug monitoring to predict TB treatment outcomes. Rifampicin Cmax should exceed 8 mg/L for optimal therapeutic efficacy [Citation32–34]. This peak concentration was not attained in about 70% of our patients who received the standard rifampicin dose. Our finding is in line with previous studies reporting that many patients receiving first-line anti-TB therapy do not achieve the rifampicin Cmax target concentration, but the proportion varies between populations [Citation16,Citation34–36]. To the best of our knowledge, the proportion of TB patients below the target 8 mg/mL in this study is one of the highest. This finding is of concern since subtherapeutic levels are associated with unfavorable outcomes and risk for development of drug resistance [Citation9,Citation37]. Indeed, drug-resistant TB is an increasing concern in Ethiopia [Citation5,Citation38,Citation39]. A higher dose of rifampicin or therapeutic drug monitoring in selected patients could be beneficial as suggested previously [Citation9,Citation40]. Whether high doses of rifampicin are safe and more effective than the standard dose is studied in clinical trials to shorten treatment duration and increase efficacy. The trial results indicated that a higher dose of rifampicin led to faster sputum sterilisation while maintaining a comparable level of toxicity to the standard dose [Citation41–44]. Therefore, an increase in the dose of rifampicin in Ethiopian population may be warranted.
Several factors could contribute to the observed low rifampicin plasma concentrations in Ethiopian patients including genetic variations, malnutrition and HIV infection, which are quite prevalent in East Africa including Ethiopia [Citation1,Citation45,Citation46]. However, compared to the 70% observed in this study, only 35% of Tanzanian TB patients had a rifampicin Cmax below 8mg/L [Citation47]. The low rifampicin concentrations in Ethiopian TB patients could be due to either higher rifampicin metabolising enzyme activities or increased autoinduction due to pharmacogenetic variations [Citation23,Citation25,Citation26,Citation48,Citation49]. Lower plasma drug concentrations have been reported in earlier studies of antiretrovirals due to higher drug-metabolising enzyme activity and unique pharmacogenetic variation in Ethiopians compared to other populations, including Tanzanians [Citation23,Citation25,Citation26,Citation50]. Our study highlights the existence of substantial differences in rifampicin pharmacokinetics between populations in sub-Saharan Africa and findings from one population may not be directly extrapolated to others on the continent. Recently we reported high plasma isoniazid concentrations and a high prevalence of slow N-acetyltransferase 2 (NAT2) acetylators in Ethiopian TB patients [Citation51].
There have been inconsistent results about the effects of SLCO1B1 genetic variation on rifampicin exposure. Previous studies in South African and Ugandan patients reported an association of the SLCO1B1 genotype with variability in rifampicin pharmacokinetics [Citation21,Citation22,Citation52]. However, this finding was not replicated in many studies [Citation11,Citation15,Citation53,Citation54]. Likewise, we found no significant impact of SLCO1B1 c.388A > G and SLCO1B1 c.521T > C on rifampicin Cmax and AUC0–7 h. SLCO1B1*1B and SLCO1B1*5 are missense mutations, involving the change of asparagine to aspartic acid at position130 and valine to alanine at position 174, respectively (). The variant alleles SLCO1B1*1B and SLCO1B1*5 were associated with increased and decreased transporter activity of OATP1B1, respectively. SLCO1B1*1B, which is associated with higher transporter activity, occurs at a higher frequency (62.2%) in Ethiopians and Tanzanians (86.8%) than in Europeans (34.2%) [Citation23]. On the other hand, the defective SLCO1B1c.521T > C variant allele caused reduced enzyme activity occurs at a lower frequency among Ethiopians (2.8%) than Tanzanians (4.7%) or Europeans (8%) [Citation23,Citation25,Citation26].
Rifampicin is a substrate and inducer of P-gp which is a product of the ABCB1 gene [Citation40,Citation55]. Few studies have evaluated the effect of ABCB1 gene polymorphism on rifampicin pharmacokinetics. Huerta-García et al. reported that patients with CC or CT genotypes of ABCB1 (c.3435C > T) had lower Cmax and AUC24 than those with a TT genotype [Citation56]. The TT homozygous genotype had significantly lower P-gp expression in the small intestine and showed the highest plasma concentrations of some drugs after oral administration [Citation24]. However, we found no significant variation in rifampicin Cmax and AUC0–7 h for ABCB1 c.3435C > T. The ABCB1c.4036A > G genotype, which is in linkage disequilibrium with c.3435C > T, significantly influenced between-patient variability of rifampicin Cmax and AUC0–7 h. Rifampicin AUC0–7 h was significantly higher in homozygous variant genotype (GG) carriers compared to the homozygous wild-type A/A (). Nevertheless, the homozygous variant genotype (GG) occurs at a low frequency in our study population, consistent with findings from a previous report [Citation49].
Few studies have investigated the impact of AADAC and CES genetic polymorphism on rifampicin pharmacokinetics. The association of CES-2 c.-2263A > G (rs3759994) in the promotor region and closely linked to c.269-965A > G (rs4783745) and c.1612 + 136 G > A with increased rifampicin exposure is reported [Citation13]. Patients who carry the CES2 (rs8192925) G versus A allele had a 17.2% increase in rifapentine AUC0–24 (14). In our study, there was no significant association of CES2 c.269-965A > G genotypes with rifampicin Cmax and AUC0–7 h. Likewise, no significant effect of CES-2 on rifampicin exposure variability was observed in Ghanaian children [Citation16]. AADAC and CES-1 genotypes were not associated with rifampicin pharmacokinetics in Malawian TB patients [Citation15].
We found a significant association between AADAC c.841G > A genotype and rifampicin Cmax, which was significantly higher in carriers of the mutant variant allele (A/A, G/A) than in those with wild-type G/G genotype (). Our result is consistent with previous reports [Citation3,Citation14]. Francis et al. reported that patients with A/A genotype had a lower rifapentine clearance. Similarly, a previous study found an association of AADAC c.841G variant allele with low rifapentine AUC, particularly in black patients [Citation14]. However, this finding was not observed in Malawian adult TB patients [Citation15]. The low frequency of a wild-type (GG) genotype in Malawians may have contributed to the differing results. Indeed, the frequency distribution of AADAC*2 (c.841G > A) exhibits considerable variability across races and populations. Notably, the reported allele frequencies of AADAC*2 among European American, African American, Japanese and Korean populations were around 60%, contrasting with the 99.9% prevalence in Peruvian TB patients [Citation57] where the wild-type variant is almost missing. Our study among Ethiopian TB patients reveals AADAC*2 allele frequencies of 86%, and the wild-type G variant was less prevalent with only three individuals exhibiting homozygosity for G/G genotype. This underscores the need for further investigation in populations where the AADAC c.841G variant occurs at higher frequencies to replicate and confirm our findings.
In addition to genetic polymorphism, other predictors such as age, sex, duration of therapy with rifampicin, drug dose and substance use were tested in univariate followed by multivariate analyses. Sex and drug dose were significantly associated with rifampicin Cmax and AUC0–7 h in multivariate analysis. Females had higher rifampicin exposure (higher Cmax and AUC0–7 h) than males. This is consistent with previous studies where male sex was associated with lower rifampicin exposure [Citation35,Citation36,Citation52,Citation58].
Our study presents the first insight into the extent of variability in rifampicin exposure (Cmax and AUC0–7) and the impact of genetic variation in drug transporters and metabolising enzymes in Ethiopian TB patients. However, it is imperative to acknowledge certain limitations in our study. The estimation of rifampicin pharmacokinetics in our study relied on three sampling time points within 7 h post-dose, adhering to the recommended approach for therapeutic drug monitoring [Citation31]. A 2-h post-dose sample approximates the Cmax for most TB drugs and adding a 6-h sample allows the clinician to distinguish between delayed absorption and malabsorption [Citation31,Citation32,Citation34]. Nevertheless, although the spare sampling strategy is useful for capturing the AUC0–24 h [Citation59], the three time point concentration dataset in our study may not entirely capture the AUC accurately. Nevertheless, it is crucial to underscore that obtaining multiple blood samples solely for the study’s objectives from newly diagnosed TB-infected patients undergoing an intensive phase of treatment is impractical and raises ethical concerns.
Furthermore, in our study population, the occurrence of the wild-type AADAC c.841 G/G and the variant ABCB1 c.4036 G/G genotype occurred at a lower frequency, potentially influencing the association of rifampicin Cmax and AUC0–7 h with the investigated genotypes. It is noteworthy that globally, and particularly within Africa, G variant alleles exhibit lower frequencies for both AADAC c.841G > A and ABCB1 c.4036A > G. The frequency of ABCB1 c.4036A > G varies among black Africans, ranging from 29% in Tanzanians [Citation60] to 18% in Ethiopians [Citation28]. Considering these variations, future large-sample studies across diverse populations in high TB-burden areas, including Africa, where rifampicin is a cornerstone of TB therapy, are recommended to validate and replicate our findings.
In conclusion, we report low rifampicin exposure and high variability in rifampicin Cmax and AUC0–7 in about two-thirds of Ethiopian TB patients. Rifampicin exposure varied with sex, dose, ABCB1 c.4036A > G and ADAC c.841G > A genotypes. AADAC c.841GG and ABCB1 c.4036A > GAA genotype groups and male patients had a higher risk of low rifampicin plasma exposure than females. SLCO1B1 c.388A>, SLCO1B1 c.521T > C, ABCB1 c.3435C > T and CES2 c.269-965A > G genotypes did not affect rifampicin exposure. The impact of low rifampicin exposure on treatment outcomes needs further investigation in Ethiopian TB patients. Our findings may have important clinical implications and warrant studies on whether high-dose rifampicin improves therapeutic efficacy.
Transparency declarations
None to declare.
Acknowledgments
The authors thank all study participants and staff of health centres involved in patient recruitment and sample collection. A.Z. acknowledges support from the EU-EDCTP-funded PANDORA-ID-NET program. A.Z. is in receipt of a UK National Institute for Health Research Senior Investigator Award.
Disclosure statement
The authors declare that there is no conflict of interest.
Additional information
Funding
References
- WHO. Global Tuberculosis Report 2022. Geneva: World Health Organization; 2022.
- Sloan DJ, Davies GR, Khoo SH. Recent advances in tuberculosis: new drugs and treatment regimens. Curr Respir Med Rev. 2013;9(3):200–210. doi: 10.2174/1573398x113099990017.
- Francis J, Zvada SP, Denti P, et al. A population pharmacokinetic analysis shows that arylacetamide deacetylase (AADAC) gene polymorphism and HIV infection affect the exposure of rifapentine. Antimicrob Agents Chemother. 2019;63(4):e01964-18. doi: 10.1128/AAC.01964-18.
- Chakaya J, Khan M, Ntoumi F, et al. Global Tuberculosis Report 2020 – reflections on the global TB burden, treatment and prevention efforts. Int J Infect Dis. 2021;113(Suppl 1):S7–S12. doi: 10.1016/j.ijid.2021.02.107.
- Molla KA, Reta MA, Ayene YY. Prevalence of multidrug-resistant tuberculosis in East Africa: a systematic review and meta-analysis. PLoS One. 2022;17(6):e0270272. doi: 10.1371/journal.pone.0270272.
- Diacon AH, Patientia RF, Venter A, et al. Early bactericidal activity of high-dose rifampin in patients with pulmonary tuberculosis evidenced by positive sputum smears. Antimicrob Agents Chemother. 2007;51(8):2994–2996. doi: 10.1128/AAC.01474-06.
- Gumbo T, Louie A, Deziel MR, et al. Concentration-dependent Mycobacterium tuberculosis killing and prevention of resistance by rifampin. Antimicrob Agents Chemother. 2007;51(11):3781–3788. doi: 10.1128/AAC.01533-06.
- Niward K, Davies Forsman L, Bruchfeld J, et al. Distribution of plasma concentrations of first-line anti-TB drugs and individual MICs: a prospective cohort study in a low endemic setting. J Antimicrob Chemother. 2018;73(10):2838–2845. doi: 10.1093/jac/dky268.
- Ramachandran G, Chandrasekaran P, Gaikwad S, et al. Subtherapeutic rifampicin concentration is associated with unfavorable tuberculosis treatment outcomes. Clin Infect Dis. 2020;70(7):1463–1470. doi: 10.1093/cid/ciz380.
- Nakajima A, Fukami T, Kobayashi Y, et al. Human arylacetamide deacetylase is responsible for deacetylation of rifamycins: rifampicin, rifabutin, and rifapentine. Biochem Pharmacol. 2011;82(11):1747–1756. doi: 10.1016/j.bcp.2011.08.003.
- Mukonzo JK, Kengo A, Kutesa B, et al. Role of pharmacogenetics in rifampicin pharmacokinetics and the potential effect on TB-rifampicin sensitivity among Ugandan patients. Trans R Soc Trop Med Hyg. 2020;114(2):107–114. doi: 10.1093/trstmh/trz108.
- Sileshi T, Tadesse E, Makonnen E, et al. The impact of first-line anti-tubercular drugs’ pharmacokinetics on treatment outcome: a systematic review. Clin Pharmacol. 2021;13:1–12. doi: 10.2147/CPAA.S289714.
- Song SH, Chang HE, Jun SH, et al. Relationship between CES2 genetic variations and rifampicin metabolism. J Antimicrob Chemother. 2013;68(6):1281–1284. doi: 10.1093/jac/dkt036.
- Weiner M, Gelfond J, Johnson-Pais TL, et al. Decreased plasma rifapentine concentrations associated with AADAC single nucleotide polymorphism in adults with tuberculosis. J Antimicrob Chemother. 2021;76(3):582–586. doi: 10.1093/jac/dkaa490.
- Sloan DJ, McCallum AD, Schipani A, et al. Genetic determinants of the pharmacokinetic variability of rifampin in Malawian adults with pulmonary tuberculosis. Antimicrob Agents Chemother. 2017;61(7):e00210-17. doi: 10.1128/AAC.00210-17.
- Dompreh A, Tang X, Zhou J, et al. Effect of genetic variation of NAT2 on isoniazid and SLCO1B1 and CES2 on rifampin pharmacokinetics in Ghanaian children with tuberculosis. Antimicrob Agents Chemother. 2018;62(3):e02099-17. doi: 10.1128/AAC.02099-17.
- Tirona RG, Leake BF, Wolkoff AW, et al. Human organic anion transporting polypeptide-C (SLC21A6) is a major determinant of rifampin-mediated pregnane X receptor activation. J Pharmacol Exp Ther. 2003;304(1):223–228. doi: 10.1124/jpet.102.043026.
- Williamson B, Dooley KE, Zhang Y, et al. Induction of influx and efflux transporters and cytochrome P450 3A4 in primary human hepatocytes by rifampin, rifabutin, and rifapentine. Antimicrob Agents Chemother. 2013;57(12):6366–6369. doi: 10.1128/AAC.01124-13.
- Thomas L, Sekhar Miraj S, Surulivelrajan M, et al. Influence of single nucleotide polymorphisms on rifampin pharmacokinetics in tuberculosis patients. Antibiotics (Basel). 2020;9(6):307. doi: 10.3390/antibiotics9060307.
- Sileshi T, Mekonen G, Makonnen E, et al. Effect of genetic variations in drug-metabolizing enzymes and drug transporters on the pharmacokinetics of rifamycins: a systematic review. Pharmgenomics Pers Med. 2022;15:561–571. doi: 10.2147/PGPM.S363058.
- Chigutsa E, Visser ME, Swart EC, et al. The SLCO1B1 rs4149032 polymorphism is highly prevalent in South Africans and is associated with reduced rifampin concentrations: dosing implications. Antimicrob Agents Chemother. 2011;55(9):4122–4127. doi: 10.1128/AAC.01833-10.
- Weiner M, Peloquin C, Burman W, et al. Effects of tuberculosis, race, and human gene SLCO1B1 polymorphisms on rifampin concentrations. Antimicrob Agents Chemother. 2010;54(10):4192–4200. doi: 10.1128/AAC.00353-10.
- Aklillu E, Habtewold A, Ngaimisi E, et al. SLCO1B1 gene variations among Tanzanians, Ethiopians, and Europeans: relevance for African and worldwide precision medicine. OMICS. 2016;20(9):538–545. doi: 10.1089/omi.2016.0119.
- Ameyaw MM, Regateiro F, Li T, et al. MDR1 pharmacogenetics: frequency of the C3435T mutation in exon 26 is significantly influenced by ethnicity. Pharmacogenetics. 2001;11(3):217–221. doi: 10.1097/00008571-200104000-00005.
- Mugusi S, Habtewold A, Ngaimisi E, et al. Impact of population and pharmacogenetics variations on efavirenz pharmacokinetics and immunologic outcomes during anti-tuberculosis Co-therapy: a parallel prospective cohort study in two Sub-Sahara African populations. Front Pharmacol. 2020;11:26. doi: 10.3389/fphar.2020.00026.
- Aklillu E, Mugusi S, Ngaimisi E, et al. Frequency of the SLCO1B1 388A > G and the 521T > C polymorphism in Tanzania genotyped by a new LightCycler®-based method. Eur J Clin Pharmacol. 2011;67(11):1139–1145. doi: 10.1007/s00228-011-1065-9.
- EFMOH (Ethiopia Federal Ministry of Health). Guidelines for clinical and programmatic management of TB, TB/HIV, DR-TB and leprosy in Ethiopia. 2021. Available from: http://repository.iphce.org/xmlui/handle/123456789/1662
- Chala A, Tadesse BT, Chaka TE, et al. Predictors of efavirenz plasma exposure, auto-induction profile, and effect of pharmacogenetic variations among HIV-Infected children in Ethiopia: a prospective cohort study. J Pers Med. 2021;11(12):1303. doi: 10.3390/jpm11121303.
- FDA. Statistical approaches to establishing bioequivalence. Guidance for industry. 2001. Available from: https://www.fda.gov/media/70958/download
- Dunvald AD, Iversen DB, Svendsen ALO, et al. Tutorial: statistical analysis and reporting of clinical pharmacokinetic studies. Clin Transl Sci. 2022;15(8):1856–1866. doi: 10.1111/cts.13305.
- Alsultan A, Peloquin CA. Therapeutic drug monitoring in the treatment of tuberculosis: an update. Drugs. 2014;74(8):839–854. doi: 10.1007/s40265-014-0222-8.
- Chawla PK, Udwadia ZF, Soman R, et al. Importance of therapeutic drug monitoring of rifampicin. J Assoc Physicians India. 2016;64(8):68–72.
- Peloquin CA. Therapeutic drug monitoring in the treatment of tuberculosis. Drugs. 2002;62(15):2169–2183. doi: 10.2165/00003495-200262150-00001.
- Prahl JB, Johansen IS, Cohen AS, et al. Clinical significance of 2 h plasma concentrations of first-line anti-tuberculosis drugs: a prospective observational study. J Antimicrob Chemother. 2014;69(10):2841–2847. doi: 10.1093/jac/dku210.
- Trentalange A, Borgogno E, Motta I, et al. Rifampicin and isoniazid maximal concentrations are below efficacy-associated thresholds in the majority of patients: time to increase the doses? Int J Antimicrob Agents. 2021;57(3):106297. doi: 10.1016/j.ijantimicag.2021.106297.
- van Crevel R, Alisjahbana B, de Lange WC, et al. Low plasma concentrations of rifampicin in tuberculosis patients in Indonesia. Int J Tuberc Lung Dis. 2002;6(6):497–502. doi: 10.5588/09640569513002.
- Niward K, Ek Blom L, Davies Forsman L, et al. Plasma levels of rifampin correlate with the tuberculosis drug activity assay. Antimicrob Agents Chemother. 2018;62(5):e00218-18. doi: 10.1128/AAC.00218-18.
- Asgedom SW, Teweldemedhin M, Gebreyesus H. Prevalence of Multidrug-Resistant tuberculosis and associated factors in Ethiopia: a systematic review. J Pathog. 2018;2018:7104921–7104928. doi: 10.1155/2018/7104921.
- Mehari K, Asmelash T, Hailekiros H, et al. Prevalence and factors associated with multidrug-resistant tuberculosis (MDR-TB) among presumptive MDR-TB patients in Tigray region, Northern Ethiopia. Can J Infect Dis Med Microbiol. 2019;2019:2923549. doi: 10.1155/2019/2923549.
- Stott KE, Pertinez H, Sturkenboom MGG, et al. Pharmacokinetics of rifampicin in adult TB patients and healthy volunteers: a systematic review and meta-analysis. J Antimicrob Chemother. 2018;73(9):2305–2313. doi: 10.1093/jac/dky152.
- Garcia-Prats AJ, Svensson EM, Winckler J, et al. Pharmacokinetics and safety of high-dose rifampicin in children with TB: the Opti-Rif trial. J Antimicrob Chemother. 2021;76(12):3237–3246. doi: 10.1093/jac/dkab336.
- Velásquez GE, Brooks MB, Coit JM, et al. Efficacy and safety of high-dose rifampin in pulmonary tuberculosis. A randomized controlled trial. Am J Respir Crit Care Med. 2018;198(5):657–666. doi: 10.1164/rccm.201712-2524OC.
- Cao Y, Wang T, He K, et al. High-dose rifampicin for the treatment of tuberculous meningitis: a meta-analysis of randomized controlled trials. J Clin Pharm Ther. 2022;47(4):445–454. doi: 10.1111/jcpt.13555.
- Onorato L, Gentile V, Russo A, et al. Standard versus high dose of rifampicin in the treatment of pulmonary tuberculosis: a systematic review and meta-analysis. Clin Microbiol Infect. 2021;27(6):830–837. doi: 10.1016/j.cmi.2021.03.031.
- Polasa K, Murthy KJ, Krishnaswamy K. Rifampicin kinetics in undernutrition. Br J Clin Pharmacol. 1984;17(4):481–484. doi: 10.1111/j.1365-2125.1984.tb02377.x.
- Ramachandran G, Kumar AK, Kannan T, et al. Low serum concentrations of rifampicin and pyrazinamide associated with poor treatment outcomes in children with tuberculosis related to HIV status. Pediatr Infect Dis J. 2016;35(5):530–534. doi: 10.1097/INF.0000000000001069.
- Tostmann A, Mtabho CM, Semvua HH, et al. Pharmacokinetics of first-line tuberculosis drugs in Tanzanian patients. Antimicrob Agents Chemother. 2013;57(7):3208–3213. doi: 10.1128/AAC.02599-12.
- Aklillu E, Zumla A, Habtewold A, et al. Early or deferred initiation of efavirenz during rifampicin-based TB therapy has no significant effect on CYP3A induction in TB-HIV infected patients. Br J Pharmacol. 2021;178(16):3294–3308. doi: 10.1111/bph.15309.
- Ngaimisi E, Habtewold A, Minzi O, et al. Importance of ethnicity, CYP2B6 and ABCB1 genotype for efavirenz pharmacokinetics and treatment outcomes: a parallel-group prospective cohort study in two sub-Saharan Africa populations. PLoS One. 2013;8(7):e67946. doi: 10.1371/journal.pone.0067946.
- Aklillu E, Djordjevic N, Carrillo JA, et al. High CYP2A6 enzyme activity as measured by a caffeine test and unique distribution of CYP2A6 variant alleles in Ethiopian population. OMICS. 2014;18(7):446–453. doi: 10.1089/omi.2013.0140.
- Sileshi T, Telele NF, Burkley V, et al. Correlation of N-acetyltransferase 2 genotype and acetylation status with plasma isoniazid concentration and its metabolic ratio in Ethiopian tuberculosis patients. Sci Rep. 2023;13(1):11438. doi: 10.1038/s41598-023-38716-3.
- Gengiah TN, Botha JH, Soowamber D, et al. Low rifampicin concentrations in tuberculosis patients with HIV infection. J Infect Dev Ctries. 2014;8(8):987–993. doi: 10.3855/jidc.4696.
- Naidoo A, Chirehwa M, Ramsuran V, et al. Effects of genetic variability on rifampicin and isoniazid pharmacokinetics in South African patients with recurrent tuberculosis. Pharmacogenomics. 2019;20(4):225–240. doi: 10.2217/pgs-2018-0166.
- Medellin-Garibay SE, Huerta-Garcia AP, Rodriguez-Baez AS, et al. A population approach of rifampicin pharmacogenetics and pharmacokinetics in Mexican patients with tuberculosis. Tuberculosis. 2020;124:101982. doi: 10.1016/j.tube.2020.101982.
- Sissung TM, Baum CE, Kirkland CT, et al. Pharmacogenetics of membrane transporters: an update on current approaches. Mol Biotechnol. 2010;44(2):152–167. doi: 10.1007/s12033-009-9220-6.
- Huerta-García AP, Medellín-Garibay SE, Salazar-González RA, et al. Anthropometric and genetic factors associated with the exposure of rifampicin and isoniazid in Mexican patients with tuberculosis. Ther Drug Monit. 2019;41(5):648–656. doi: 10.1097/FTD.0000000000000631.
- Levano KS, Jaramillo-Valverde L, Tarazona DD, et al. Allelic and genotypic frequencies of NAT2, CYP2E1, and AADAC genes in a cohort of Peruvian tuberculosis patients. Mol Genet Genomic Med. 2021;9(10):e1764.
- McIlleron H, Rustomjee R, Vahedi M, et al. Reduced antituberculosis drug concentrations in HIV-infected patients who are men or have low weight: implications for international dosing guidelines. Antimicrob Agents Chemother. 2012;56(6):3232–3238. doi: 10.1128/AAC.05526-11.
- Cojutti P, Giangreco M, Isola M, et al. Limited sampling strategies for determining the area under the plasma concentration-time curve for isoniazid might be a valuable approach for optimizing treatment in adult patients with tuberculosis. Int J Antimicrob Agents. 2017;50(1):23–28. doi: 10.1016/j.ijantimicag.2017.01.036.
- Maganda BA, Minzi OM, Ngaimisi E, et al. CYP2B6*6 genotype and high efavirenz plasma concentration but not nevirapine are associated with low lumefantrine plasma exposure and poor treatment response in HIV-malaria-coinfected patients. Pharmacogenomics J. 2016;16(1):88–95. doi: 10.1038/tpj.2015.37.