
Abstract
Background
SARS-CoV-2, which causes COVID-19, has killed more than 7 million people worldwide. Understanding the development of postinfectious and postvaccination immune responses is necessary for effective treatment and the introduction of appropriate antipandemic measures.
Objectives
We analysed humoral and cell-mediated anti-SARS-CoV-2 immune responses to spike (S), nucleocapsid (N), membrane (M), and open reading frame (O) proteins in individuals collected up to 1.5 years after COVID-19 onset and evaluated immune memory.
Methods
Peripheral blood mononuclear cells and serum were collected from patients after COVID-19. Sampling was performed in two rounds: 3-6 months after infection and after another year. Most of the patients were vaccinated between samplings. SARS-CoV-2-seronegative donors served as controls. ELISpot assays were used to detect SARS-CoV-2-specific T and B cells using peptide pools (S, NMO) or recombinant proteins (rS, rN), respectively. A CEF peptide pool consisting of selected viral epitopes was applied to assess the antiviral T-cell response. SARS-CoV-2-specific antibodies were detected via ELISA and a surrogate virus neutralisation assay.
Results
We confirmed that SARS-CoV-2 infection induces the establishment of long-term memory IgG+ B cells and memory T cells. We also found that vaccination enhanced the levels of anti-S memory B and T cells. Multivariate comparison also revealed the benefit of repeated vaccination. Interestingly, the T-cell response to CEF was lower in patients than in controls.
Conclusion
This study supports the importance of repeated vaccination for enhancing immunity and suggests a possible long-term perturbation of the overall antiviral immune response caused by SARS-CoV-2 infection.
Introduction
Severe acute respiratory syndrome coronavirus 2 (SARS-CoV-2), which causes coronavirus disease 2019 (COVID-19), was discovered at the end of 2019 [Citation1]. The virus has spread rapidly around the world, and the pandemic was declared by the World Health Organisation in March 2020 [Citation2]. More than 772 million people were infected by December 2023 [Citation3]. SARS-CoV-2, a member of the Coronaviridae family, is a virus with an envelope containing membrane (M), envelope (E), and spike (S) proteins. The nucleocapsid inside the virion is composed of nucleoprotein (N) in complex with a positive single-stranded RNA genome (reviewed in [Citation4]).
The innate immune system recognises the virus early in infection, leading to the production of interferons (IFNs) and subsequent activation of the adaptive immune response. As SARS-CoV-2 has adapted to its host, mechanisms for evading immune recognition have emerged. SARS-CoV-2 can inhibit IFNs production, thereby prolonging the time necessary for activation of the adaptive immune response [Citation5]. Nevertheless, most patients with COVID-19 can manage the infection effectively, resulting in mild [Citation6] or asymptomatic disease [Citation7]. Successful infection control is accompanied by the differentiation and massive proliferation of antigen-specific B cells and the activation of CD4+ and CD8+ T cells. These cells are fundamental for the development of immune memory, a crucial process for effective virus clearance upon repeated virus exposure [Citation8, Citation9].
Antiviral T-cell levels correlate with the expression levels of viral proteins, mainly S, M, and N, which can be considered the most immunodominant antigens [Citation10]. Approximately 80% of the newly identified epitopes were SARS-CoV-2 specific [Citation10]. Thus, naive SARS-CoV-2-specific T cells (CD62L+ CD45RO−) are activated mainly during primary SARS-CoV-2 infection. After viral clearance, the contraction phase of the immune response begins, when most effector T cells (Teff; CD62L− CD45RO−) undergo apoptosis [Citation9, Citation11]. A subset of Teffs survive and differentiate into memory T cells, which are characterised by the expression of CD45RO [Citation12]. During the secondary anti-SARS-CoV-2 immune response, antiviral CD8+ and CD4+ memory T cells retain the capacity to produce IFN-γ [Citation13]. CD4+ memory T lymphocytes specific for SARS-CoV-2 are more abundant than CD8+ memory T cells and have a predominantly Th1 phenotype [Citation13]. Both CD4+ and CD8+ virus-specific memory T lymphocytes differentiate into two subsets: central memory (Tcm) and effector memory (Tem) cells. In addition, CD4+ T cells can also differentiate into follicular helper T cells (Tfh) and regulatory T cells (Treg; reviewed in [Citation11]).
Tfh cells are required for the differentiation of SARS-CoV-2-specific B cells [Citation13–15]. Upon activation, virus-specific B cells undergo clonal expansion, leading to the development of antibody-secreting cells (ASCs). Differentiation and further affinity maturation, characterised by genetic alterations of the variable parts of the B-cell receptor, are necessary for the development of high-affinity B-cell receptors [Citation14]. After viral clearance, affinity maturation also continues with the differentiation of a subset of activated ASCs into memory B cells in long-lived germinal centres [Citation13, Citation16]. With further somatic hypermutation, B cells have greater affinity and neutralisation capacity for the S antigen and its receptor binding domain (RBD; [Citation17]). In addition to resting memory B cells, antibodies are also present in the circulation. They are secreted by long-lived plasma cells located in the bone marrow. Circulating antibody levels are relatively high after infection but decrease over time [Citation18].
At the end of 2020, vaccines against the SARS-CoV-2 S protein were introduced to the market. After immunisation (2 vaccine doses), the adjusted mRNA vaccine efficacy was estimated to be approximately 90% [Citation19]. One dose of an mRNA vaccine has been shown to induce the development of a strong and diverse memory T-cell pool comparable to that produced by the response to the S antigen after natural infection and to reduce the risk of long COVID [Citation20, Citation21]. Due to the relatively easy spread of SARS-CoV-2 in the population, many people were infected before they had the opportunity to be vaccinated. The combination of infection and vaccination leads to the development of so-called hybrid immunity. There is increasing evidence that hybrid immunity provides a more robust immune response with a greater degree of protection against hospitalisation or severe disease than does immunity from vaccination or infection alone [Citation22]. Many studies have analysed the acute immune response, but fewer studies have analysed the longevity and mechanisms of immune memory, focusing on all branches of immune memory in individuals with hybrid immunity.
In our study, we monitored the memory immune response of patients with hybrid immunity developed by overcoming COVID-19 and vaccination against SARS-CoV-2. This study revealed both the specificity and common characteristics of the anti-SARS-CoV-2 response and immune memory response in different individuals. Our findings also suggested a possible long-lasting perturbation of the general antiviral immune response caused by SARS-CoV-2 infection.
Materials and methods
Study population
During 2020 and 2021, 108 unvaccinated individuals (patients) who previously had COVID-19 with disease severity from G1 to G6 () were enrolled in this study. The mean age of the patients was 54.5 years (age range 22-99). Of the enrolled patients, 63.9% were men (69/108) with a mean age of 58.8 years (age range 26-99), and 36.1% were women (39/108) with a mean age of 46.9 years (age range 22-78). In addition, 55 anti-N SARS-CoV-2-negative blood donors tested with Elecsys® Anti-SARS-CoV-2 (Roche, Basel, Switzerland) were enrolled as controls between 2020 and 2021. The controls were not vaccinated against SARS-CoV-2. The mean age of the controls was 43.1 years (age range 24-63). Among the controls, 58.2% (32/55) were men with a mean age of 43.1 years (age range 24-62), and 41.8% (23/55) were women with a mean age of 43.2 years (age range 26-63). All study participants signed an informed consent form, and the study was approved by the Ethics Committee of the Military University Hospital on 3 June 2020, with reference number 108/15-20/2020. Sampling at the first time point (T1; n = 108) was performed 3 to 6 months after the PCR test was positive (median 4 months). Sampling at the second time point (T2; n = 63) was performed approximately 1 year later (median 11 months after T1). The majority of patients who returned for the second sampling were vaccinated (82.5%, 52/63). Most patients (74.6%, 47/63) were vaccinated with the Comirnaty vaccine (Pfizer/BioNTech). Of those vaccinated by Comirnaty, 2.1% (1/47) received one dose, 59.6% (28/47) received two doses, and 40.4% (19/47) received three doses. The remainder patients were vaccinated with three doses of Spikevax (Moderna; 1.6%, 1/63), one dose of Janssen (Johnson & Johnson; 4.8%, 3/63), or two doses of Comirnaty followed by the third dose of Spikevax (1.6%, 1/63). The study population is described in detail in Supplementary Table S1. Only individuals with sufficient isolated peripheral blood mononuclear cells (PBMCs; 7 × 10⁶) were further examined by the methods described below. To avoid possible bias, comparisons of the distributions of S, NMO, CEF, rS, and rN at time T1 between people who came for sampling at T2 and those who did not were conducted. An unpaired t test showed no statistically significant difference in any of the analysed parameters.
Table 1. Description of the COVID-19 severity.
PBMCs and serum preparation
Blood was collected at the Military University Hospital in Prague to BD Vacutainer® tubes (BD Biosciences, Franklin Lakes, New Jersey, USA) for serum preparation or in tubes with sodium heparin for isolation of peripheral blood mononuclear cells (PBMCs). For serum preparation, the tubes were centrifuged at 3000 × g for 10 min at 10 °C, and the serum was aliquoted into microtubes and stored at −80 °C. Noncoagulable blood in sodium heparin tubes was processed according to the ImmunoSpot® protocol (ImmunoSpot®, Shaker Heights, Cleveland, USA) with modifications to the use of SepMateTM PBMC isolation tubes (StemCell® Technologies, Vancouver, British Columbia, Canada) with Ficoll-Paque Plus (GE Healthcare, Chicago, Illinois, USA). Isolated PBMCs were counted using the CTL-LDC™ Live/Dead Cell Counting Kit (ImmunoSpot®) and the ImmunoSpot® Analyser S6 Ultimate M2 (ImmunoSpot®) according to the manufacturer’s instructions. The cells were frozen in aliquots at −80 °C using the CTL-CryoTM ABC Media Kit (ImmunoSpot®) according to the ImmunoSpot® protocol and stored in liquid nitrogen.
Reconstitution of peptides and recombinant proteins
The lyophilised peptide pools, the SARS-CoV-2 S-defined peptide pool (MabTech, Nacka Strand, Sweden), the SARS-CoV-2 NMO-defined peptide pool (MabTech), and the PepMix CEF Pool (extended) (JPT Peptide Technologies, Berlin, Germany) were used. The S peptide pool consists of immunodominant epitopes of the SARS-CoV-2 spike protein; the NMO peptide pool contains peptides derived from nucleoprotein (N), membrane protein (M) and open reading frame proteins (O; ORF1, nsp3, ORF-3a, ORF-7a, and ORF-8); and the CEF peptide pool consists of immunodominant epitopes from influenza A virus (IAV), human cytomegalovirus (HCMV), and Epstein–Barr virus (EBV), which are highly prevalent in the human population [Citation23–25]. Peptide pools were reconstituted according to the manufacturer’s instructions, aliquoted into Protein LoBind® tubes (Eppendorf, Barkhausenweg, Hamburg, Germany) and stored at −80 °C. The recombinant SARS-CoV-2 Nucleocapsid (R203K, G204R) His-tag Protein (rN; R&D Systems, Minneapolis, Canada) and Spike His-tag Protein (rS; R&D Systems) were reconstituted according to the manufacturer’s instructions, aliquoted, and stored at −80 °C.
T-ELISpot
Analysis of the T-cell response was performed with a Human IFN-γ Single-Colour ELISPOT (ImmunoSpot®) according to the manufacturer’s instructions. Briefly, the plate was activated with 70% ethanol, coated with the anti-IFN-γ capture antibody (cAb) and incubated overnight at 4 °C in a wet chamber. After incubation, the frozen PBMCs were thawed using 20× CTL-Anti-Aggregate WashTM Supplement (ImmunoSpot®) according to the ImmunoSpot® protocol. The cells were counted and resuspended in CTL-TestTM Medium (ImmunoSpot®) supplemented with 2 mM L-glutamine (Biosera, Cholet, France), 100 U/mL penicillin, and 100 μg/mL streptomycin (Sigma–Aldrich, St. Louis, Missouri, USA) at a concentration of 2 × 10⁶ live PBMCs/mL. Aliquots of the S, NMO, and CEF peptide pools were tempered. The S and NMO peptide pools were diluted at a 1:3 ratio in CTL-TestTM medium to obtain diluted triplicates with concentrations of 2 μg/mL, 0.5 μg/mL, and 0.12 μg/mL, as described previously [Citation26]. The CEF peptide pool was prepared at a concentration of 2 μg/ml only (in duplicates). Media-only wells with PBMCs in triplicate were used as negative controls. PBMCs (2 × 10⁵ in 100 μl) were added to the wells containing peptide pool solutions. Mixing PBMCs and peptide solutions at a 1:1 ratio resulted in final peptide concentrations of 1 μg/mL, 0.25 μg/mL, and 0.06 μg/mL. The PBMCs were stimulated in an incubator with 7% CO2 at 37 °C for 20 h. Visualisation of the T-cell response in the form of spot-forming units (SFUs) was performed. The number of SFUs was counted with ImmunoSpot® Analyser S6 Ultimate M2 (ImmunoSpot®) and ImmunoSpot® ELISPOT Enzymatic Software (ImmunoSpot®).
Flow cytometry
PBMCs from 6 patients were thawed as described above for T-ELISpot but were resuspended at a concentration of 20 × 106 cells/mL in RPMI 1640 containing HEPES, 2-β-mercaptoethanol and 10% FBS. For cell stimulation, the same diluted peptide pools as those used for T-ELISpot were used but only at the highest final concentration of 1 μg/mL. PBMCs incubated with an anti-CD3 antibody (mouse IgG2a isotype; MabTech) served as a positive control, and unstimulated cells were used as a negative control. The solutions of the peptide pools, anti-CD3 antibody or medium were pipetted onto a U-bottom 96-well plate and incubated at 37 °C for 10 min. A total of 2 × 10⁶ live PBMCs were added to each well, incubated for 20 h in an incubator with 7% CO2 at 37 °C, and stained with previously titrated antibodies (). Briefly, PBMCs were washed with FACS buffer (1% BSA, 0.1% sodium aside, 200 μg/mL human IgG [KIOVIG, Baxalta Belgium Manufacturing SA, Lessines, Belgium] and 1 mM EDTA in PBS) and incubated for 30 min with an antibody cocktail for surface marker staining. After washing with PBS, the cells were incubated with the LIVE/DEADTM Fixable Blue Dead Cell Stain Kit (Invitrogen) for 20 min and then permeabilized with the eBioscienceTM Foxp3/Transcription Factor Staining Buffer Set (Thermo Fisher, Waltham, Massachusetts, USA) according to the manufacturer’s instructions. Then, the cells were incubated with FoxP3 antibody for 30 min and washed. The stained PBMCs were resuspended in 200 μl of BD® CellWASH (BD Biosciences). Flow cytometry was performed using a CyTEKTM Aurora (Cytek Biosciences, Fremont, California, USA) instrument equipped with 5 lasers, and the results were analysed using FlowJo software v10.8.1 (BD Biosciences). T cells were gated on live cells after debris and cell doublet exclusion. CD4+ and CD8+ cells were gated on CD3+ CD56− cells. Before defining the CD4+ subpopulations, T regulatory cells (Tregs) were gated out. The final phenotypes of the T cells were defined as shown in . Differences in the response of PBMCs to peptide pools were analysed according to the percentage of activation of these cells. The combination of the CD69, CD134, and CD137 markers was used to determine the activation status of CD4+ T cells, and CD137+ cells represented activated CD8+ cells. Differences between each analysed T-cell population and changes between T1 and T2 were estimated by two-way ANOVA (Prism software, version 8; GraphPad Software, San Diego, CA, USA).
Table 2. Antibodies used for flow cytometry.
Table 3. Markers for the definition of the T-cell phenotype.
B-ELISpot
For the B-cell response analysis, the Human IgA/IgG Double-Colour ELISpot Kit (ImmunoSpot®) was used according to the manufacturer’s instructions. Briefly, the PBMCs were thawed, and the cell pellets were resuspended in medium (RPMI 1640 supplemented with 10% FCS, 8 mM HEPES, 50 μM 2-mercaptoethanol, 2 mM L-glutamine, 100 U/mL penicillin and 100 μg/mL streptomycin). The PBMCs from each sample were divided into 2 groups, unstimulated cells and cells stimulated with the B-Poly-STM polyclonal B-cell stimulator (ImmunoSpot®), and incubated for 5 days in an incubator with 7% CO2 at 37 °C. A 48-well plate was seeded with 0.7 × 10⁶ to 1.5 × 10⁶ cells in 400 μL per well. One day before the experiment, the plates with PVDF membranes were coated with a capture antibody (cAb) against a constant region of human antibodies and recombinant SARS-CoV-2 spike or nucleocapsid proteins (R&D Systems) at a concentration of 10 μg/mL. The plates were incubated overnight in a wet chamber at 4 °C. After 5 days of stimulation, the PBMCs were diluted at a 1:2 ratio and seeded onto the coated plate at a density of 200,000 PBMCs/well, 66,667 PBMCs/well and 22,222 PBMCs/well [Citation27]. Unstimulated cells served as a negative control and were seeded at 200,000 PBMCs/well in duplicate for each antigen. For the wells coated with cAb, further dilution was performed, and 7,407 PBMCs/well were added. The PBMCs were incubated in an incubator with 7% CO2 at 37 °C for 6 h. After the incubation, the PBMCs were discarded, and the B-cell response was visualised as SFUs according to the manufacturer’s instructions. SFUs were counted using ImmunoSpot® Analyser S6 Ultimate M2 (ImmunoSpot®) and ImmunoSpot® Double-Colour ELISPOT Enzymatic Software (ImmunoSpot®).
ELISpot data processing
The mean of the SFU count for the negative control for each sample and antigen was subtracted from each well. The cut-off point for positivity/negativity determination was calculated separately for each sample by adding 3 standard deviations (SDs) to the mean SFU count of the negative control wells. Samples were considered positive if there were two or more positive wells with different cell or peptide dilutions for B- or T-cell ELISpot, respectively. Samples with SFU counts below the cut-off point for both antigens (S and NMO or rS and rN) and control CEF or cAb were excluded from the analysis due to uncertainty in PBMC functionality. The statistical analysis of the different antigen dilutions and comparisons of the anti-CEF responses shown in were performed via one-way ANOVA (Prism software, version 8). An unpaired t test (Prism software, version 8) was used to compare the responses between patients and controls. Multiplicative differences between patients and controls were calculated as the ratio of the mean value of patients/controls. A paired t test (Prism software, version 8) was used to test differences between samples at T1 and T2. To assess multiplicative changes between T1 and T2, the median of T2/T1 ratio (computed from individual samples) was evaluated.
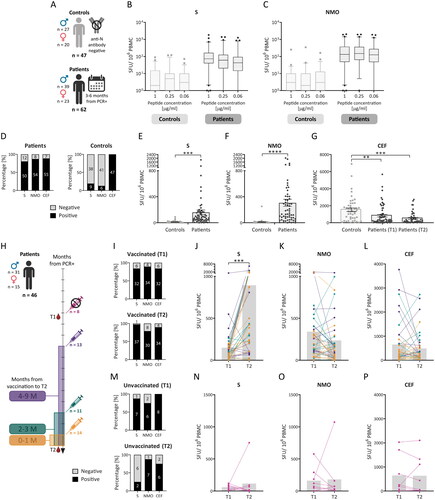
Figure 1. Memory T-cell response after SARS-CoV-2 infection and vaccination. Peripheral blood mononuclear cells (PBMCs) from 62 previously infected individuals (patients) isolated 3 to 6 months after a positive PCR test (T1) and 1 year apart (T2) and 47 controls (A) were analysed via the IFN-γ ELISPOT assay. PBMCs were incubated with SARS-CoV-2-specific peptide pools (S and NMO) at concentrations of 0.06 μg/mL, 0.25 μg/mL, or 1 μg/mL or with 1 μg/mL of the control CEF peptide pool. The results are expressed as the number of spot-forming units (SFUs) per 1 × 10⁶ PBMCs and are shown as medians (lines in the boxes), 25-75% percentiles (dotted boxes), 5-95% percentiles (whiskers), and outliers for all peptide dilutions (B, C). Comparisons between the different antigen dilutions were performed by one-way ANOVA, with no statistically significant results. Samples were considered positive if there were two or more positive wells with peptide dilutions (according to the used algorithm; D). A further comparison of the SARS-CoV-2-specific response was performed only as a response to 1 µg/mL of the peptide pools (E, F). These data were analysed by an unpaired t test. A comparison of the response to CEF between controls and patients at T1 and T2 was also performed (G). The dotted bars express the means with individual values and SEMs (E-G). Sample positivity and response level to the S, NMO, and CEF pools were individually compared between the two time points (H) in vaccinated (I-L) and unvaccinated patients (M-P). The gray bars express the median values (J-l, N-P). These data were statistically analysed using paired t tests. SEM – standard error of the mean; *p < 0.05, **p < 0.01, ***p < 0.001, ****p < 0.0001.
ELISA
Serum samples obtained from patients attending both sampling events were examined for the presence of anti-N IgG, anti-S1 IgA and anti-S1 IgG antibodies using Anti-SARS-CoV-2 NCP ELISA (IgG), Anti-SARS-CoV-2 ELISA (IgA) and Anti-SARS-CoV-2 ELISA (IgG) kits (EUROIMMUN, Lübeck, Germany), respectively. All procedures were performed according to the manufacturer’s instructions using calibrators (cut-off sample). Optical density (OD) was measured by an ELISA reader (iMarkTM Microplate reader; Bio-Rad, Hercules, California, USA). The results are expressed as the ratio of the OD of the standardly diluted (1:100) sample to the OD of the cut-off sample (OD/ODCO). Samples with high ratios (> 3.5) were further diluted 1:500 and retested. The resulting ratio was then multiplied by a factor of 5. If the ratio of OD was still > 3.5, it was considered to be 3.5. According to OD/ODCO, samples were defined as positive (OD/ODCO ≥ 1.1), negative (OD/ODCO ≤ 0.8) or borderline (0.8 < OD/ODCO < 1.1). Given the normal distribution of the data, the statistical significance of the difference between the measurements at T1 and T2 was evaluated using paired t tests (Prism software, version 8). Multiplicative changes between T1 and T2 were computed as the median of T2/T1 ratio of each sample.
Neutralising antibody detection
Neutralising anti-RBD antibodies were detected using the wild-type (Wuhan-Hu-1) SARS-CoV-2 Surrogate Virus Neutralisation Test Kit (sVNT; GenScript, Piscataway, New Jersey, USA) and the SARS-CoV-2 Neutralising Antibody Calibrator (GenScript) in diluted serum samples according to the manufacturer’s instructions. Only the samples from patients who participated in both samplings were analysed. The OD was measured by an ELISA reader (iMarkTM Microplate Reader, Bio-Rad). Antibody concentrations were calculated by second-order polynomial interpolation of the sample absorbances from the standard curve. To obtain final results, values were multiplied by dilution factors. For each plate, the cut-off value (set as the concentration of neutralising antibodies required for 30% inhibition) was calculated from the function equation. The data were normalised by dividing the final concentration by the cut-off value (c/cCO). Samples were considered positive if c/cCO ≥ 1 and negative if c/cCO < 1). The difference between samples collected at T1 and T2 was estimated by paired t tests (Prism software, version 8). Changes between T1 and T2 were computed as the median of the T2/T1 ratios computed separately for each sample.
Multivariate analysis and data comparison
Multivariate analyses of patient samples with available data for all methods used (except flow cytometry analysis) were performed using R: A language and environment for statistical computing (R Foundation for Statistical Computing, Vienna, Austria. URL: https://www.R-project.org/). The strength of the relationship between each pair of variables was evaluated in a correlation matrix with the Spearman correlation coefficient using the R package Corrplot [Citation28]. The multivariate analysis of all the data were visualised using the R package ComplexHeatmap [Citation29], which produces heatmaps in which the values of the measured variables are expressed on a colour scale. For the sake of comparability, the individual variables were first winsorized and then standardised by robust position (median) and variability (MAD) characteristics. For comparability of the first (T1) and second (T2) time points, the same outlier limits and numerical characteristic values as for the first measurement were used in the winsorization and standardisation of the second measurement. Individuals were then arranged according to the similarity of the measurements and divided into 3 clusters. A complete hierarchical linkage method using Euclidean distance was used for clustering.
Results
Memory T-cell response
PBMCs from 62 patients were sampled 3 to 6 months after positive PCR (T1), and 47 SARS-CoV-2 anti-N seronegative controls () were used for the detection of virus-specific memory T cells by the IFN-γ ELISPOT assay and the SARS-CoV-2 S and NMO peptide pools at concentrations of 1 µg/mL, 0.25 µg/mL, and 0.06 µg/mL. There were no statistically significant differences in the response of T cells to the different antigen dilutions in the control group (p = 0.4394 for S and p = 0.9196 for NMO) or in the patient group (p = 0.5686 for S and p = 0.6756 for NMO; ). Therefore, the following data were presented only for the 1 µg/mL peptide concentration, which was also used for the CEF peptide pool and had the lowest 25-75% percentile range when considering both the S and NMO antigens in the patient group.
T lymphocytes that produced IFN-γ in response to stimulation with the S-derived peptides were detected in 80.6% (50/62) of the patients and 19.1% (9/47) of the controls. A positive response against NMO peptides was detected in 87.1% (54/62) of the patients and 12.8% (6/47) of the controls. A response to the CEF peptide pool was observed in 88.7% (55/62) of patients and 100% (47/47) of controls (). The mean SFU count was almost 16-times greater for the S (p = 0.0006) and 30-times greater for the NMO (p < 0.0001) peptide pools for patients than for the controls (). Interestingly, the mean SFU count for CEF was almost 2 times greater in the controls (p = 0.0061) than in the patients in T1, and the reactivity to CEF was even lower at T2 (p = 0.0001 compared to controls) ().
PBMCs from 46 patients were also obtained approximately one year after T1 (T2), and changes in the T-cell response between T1 and T2 were examined and are expressed as the median of T2/T1 ratio. Vaccinated patients (38/46) were divided according to the number of months from the last vaccine dose to T2, regardless of the vaccine type or number of doses (). At T1, a positive T-cell response specific for the S and NMO antigens was detected in 84.2% (32/38) and 89.5% (34/38) of patients, respectively (). The response to the S-peptide pool increased 4.48-times at T2 (p = 0.0004; ), and the percentage of positive individuals increased to 97.4% (37/38) of the vaccinated patients (). The magnitude of the response to the NMO peptide pool () changed 0.64 times (p = 0.0733), but the positivity of the vaccinated patients was relatively stable and decreased only from 89.5% (34/38) to 78.9% (30/38; ). Positivity of unvaccinated patients against S peptide pool decreased between T1 and T2 from 87.5% (7/8) to 25% (2/8; ). The magnitude of the response of the unvaccinated patients (8/46) to S (p = 0.5280) and NMO (p = 0.8894) antigens decreased in most patients between T1 and T2 (), except for 1 highly positive individual at T2, which also increased the positivity of patients from 75% (6/8) at T1 to 87.5% (7/8) at T2 (). The response to CEF changed in most vaccinated patients, and the T2/T1 ratio changed 0.84-times (p = 0.2491; ). In the unvaccinated group, there was no significant difference in the magnitude of the anti-CEF response (p = 0.9341; ).
These results showed that the T-cell response to SARS-CoV-2 was effectively induced after infection, and the activation of memory T cells was further supported by vaccination. The overall antiviral response, represented by the anti-CEF response, indicated that in patients after SARS-CoV-2 infection, the antiviral response was reduced in comparison to that in controls.
Phenotype of T cells
PBMCs from 6 vaccinated patients who underwent both sampling procedures were used for analysis of the T-cell phenotype by flow cytometry. PBMCs were stained to determine how the numbers of activated CD4+ (CD69+ CD134+ CD137+) and CD8+ (CD137+) T cells differed after stimulation with the S, NMO or CEF peptide pools between T1 and T2. The frequencies of the activated CD4+ Th subpopulations were slightly greater at T2 after stimulation with S or NMO than at T1 (Supplementary Figure S1A and B); however, due to the small sample size (n = 6), this difference was not statistically significant. The most visible activation was observed in the Th17 subpopulation at T2 for the S (p = 0.3916) and NMO (p = 0.9776) antigens. However, our main interest was memory T cells, mainly Tcm and Tem cells. The S- and NMO-specific responses of Tcm (p = 0.8129 and p > 0.9999) and Tem (p = 0.2662 for S and p = 0.9884 for NMO) cells seemed to increase at T2 compared to T1, but these differences were not statistically significant due to the small sample size (Supplementary Figure S1C and D). Analysis of CD8+ memory populations did not reveal statistically significant differences between subpopulations of T cells. A noticeable increase occurred only in the case of Teff cells (p = 0.8207) and only slightly in the Tem cell (p = 0.7659) subpopulation when comparing T1 and T2; moreover, a noticeable increase occurred only in response to the S-peptide pool (Supplementary Figure S1E and F). We also analysed the phenotypes of the Tcm and Tem memory populations, but due to low cell frequencies, the data are not shown. SARS-CoV-2-specific activated CD8+ cells were detected at higher frequencies than CD4+ cells in all the samples.
The flow cytometry results did not show clear activation of T cells with a specific phenotype after infection or subsequent vaccination. An increased response of specific memory T cells was observed after vaccination, but due to the small sample size, these results were not statistically significant.
Memory B-cell response
PBMCs from controls and patients were restimulated, diluted, and examined for SARS-CoV-2-specific memory IgG+ () or IgA+ (Supplementary Figure S2A) ASCs using the IgA/IgG double-colour ELISpot assay. We found no statistically significant differences in the number of SFUs among the different dilutions of IgG+ ASCs in either the control group for both antigens (p = 0.9980 for recombinant S (rS) protein and p = 0.8489 for recombinant N (rN) protein)or in the patient group (p = 0.4742 for rS and p = 0.8609 for rN). Therefore, we chose data from wells containing 66,667 PBMCs, which had the lowest 25-75% percentile range for both the rS and the rN (). Memory B cells responding to the rS and rN antigens were present in 90.9% (40/44) and 81.8% (36/44) of patients, respectively (). The B-cell memory response appears highest in patients with severe to critical disease (severity grade 4 and 5; data not shown). IgG+ ASCs responding to the rS and rN antigens were also detected in 4.5% (2/43) and 18.2% (8/43) of the controls (), respectively. Although a response was detected in some SARS-CoV-2-seronegative blood donors who served as controls, the mean number of SFUs was more than 80-times greater (p < 0.0001) for IgG+ ASCs directed against the rS protein when comparing patients with controls (). The response to the rN protein was 20-times greater (p < 0.0001) in patients than in controls (). The numbers of IgA+ ASCs directed against either the rS or rN antigen were very low in both groups (Supplementary Figure S2B and C), and there was no statistically significant difference between patients and controls for the rS (p = 0.3113) or rN (p = 0.5715) antigens. To examine the polyclonally stimulated ASC response, a capture antibody (cAb) directed against a constant part of the human antibodies was also used (Supplementary Figure S3). Similarly, the percentages of overall IgG+ ASCs in the patient group and the control group were similar (p = 0.2408; Supplementary Figure S3A and B). However, the overall IgA+ ASC population was lower in the patient group than in the control group (p < 0.0001; Supplementary Figure S3C and D).
Figure 2. Response of IgG+ memory antibody-secreting cells (ASCs) after SARS-CoV-2 infection and vaccination. Peripheral blood mononuclear cells (PBMCs) from previously infected individuals (patients), isolated 3 to 6 months after a positive PCR test (T1) and one year apart (T2), and 43 controls (A) were analysed for IgG+ or IgA+ memory ASCs using the double-colour ELISpot assay (see Supplementary Figure S2 for IgA). Recombinant SARS-CoV-2 S (rS) and N (rN) proteins were used for antibody detection. The results are expressed as the number of spot-forming units (SFUs) per 1 × 10⁶ PBMCs and are shown as medians (lines in the boxes), 25-75% percentiles (dotted boxes), 5-95% percentiles (whiskers), and outliers for all cell dilutions (B, C). Differences between dilutions were analysed by one-way ANOVA, and the results were not statistically significant. Samples were considered positive if there were two or more positive wells with cell dilutions (according to the used algorithm; D). For further comparison, only the data from wells containing 66,667 PBMCs were used to express single values and means with SEM (E, F). These data were analysed by an unpaired t test. Sample positivity and response level to the rS and rN antigens were analysed between T1 and T2 (G) in vaccinated (H-J) and unvaccinated people (K-M). The gray bars represent median values (I, J, L, M). These data were statistically analysed using paired t tests. SEM – standard error of the mean; *p < 0.05, **p < 0.01, ***p < 0.001, ****p < 0.0001.
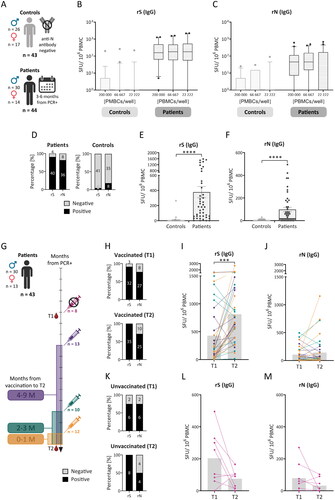
PBMCs from 43 patients who underwent sampling at T2 were analysed to obtain information on the postinfection or postvaccination memory ASC response and its changes between T1 and T2, which are expressed as the medians of the T2/T1 ratios. Vaccinated patients (35/43) were divided according to the number of months from the last vaccine dose to T2, regardless of the vaccine type or number of doses (). The percentage of vaccinated patients who were positive for anti-rS IgG+ ASCs increased from 91.4% (32/35) to 100.0% (35/35) between the first (T1) and second (T2) sampling (). The number of IgG+ ASCs increased 5-times (p = 0.0002; ). The percentage of patients who were positive for the rN protein decreased slightly from 77.1% (27/35) to 71.4% (25/35; ), while the magnitude of the IgG+ ASC response was unchanged (with a median T2/T1 ratio equal to 1.00; p = 0.3112; ). The percentage of unvaccinated patients (8/35) positive for anti-rS protein IgG+ ASCs increased from 75.0% (6/8) at T1 to 100.0% (8/8) at T2. However, the percentage of patients who were positive for the rN protein decreased from 75.0% (6/8) at T1 to 50.0% (4/8) at T2 (). The magnitude of the response of anti-SARS-CoV-2 IgG+ ASCs in the unvaccinated group decreased between samplings, with median T2/T1 ratios equal to 0.38 (p = 0.0749) and 0.10 (p = 0.2093) for the rS and rN antigens, respectively (). In general, the percentage of IgA+ ASCs was very low (), and there was no statistically significant difference between T1 and T2 for either antigen in vaccinated or unvaccinated patients. In addition, there was no statistically significant difference in the cAb response between T1 and T2 (Supplementary Figure S3F–I).
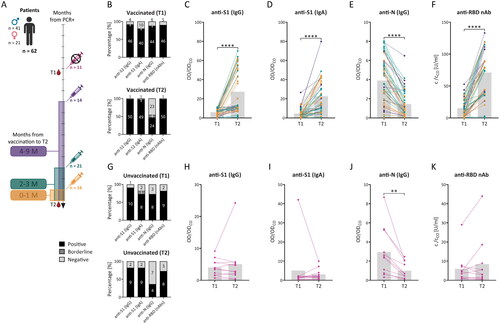
Figure 3. Detection of circulating IgG and IgA antibodies specific for SARS-CoV-2 antigens after SARS-CoV-2 infection and vaccination. Sera from 62 previously infected individuals (patients) were collected 3 to 6 months after a positive PCR test (T1) and after another year (T2) (A) and were tested via ELISA and the SARS-CoV-2 surrogate virus neutralisation test (sVNT). The results were expressed as the ratio between the optical density (OD) of the sample and the OD of the cut-off sample (CO) for ELISA or the concentration of the anti-RBD nAb (c) of the sample and the concentration of the cut-off (CO), which describes the concentration of neutralising antibodies required for 30% inhibition. For ELISA, samples were considered positive (OD/ODCO ≥ 1.1), negative (OD/ODCO ≤ 0.8), or borderline (0.8 < OD/ODCO < 1.1), and for sVNT samples were considered positive (c/cCO ≥ 1) or negative (c/cCO < 1). Response level and sample positivity were analysed for anti-S1 IgG antibodies (B, C, G, H), anti-S1 IgA antibodies (B, D, G, I), anti-N IgG antibodies (B, E, G, J), and neutralising anti-RBD antibodies (anti-RBD nAb; B, F, G, K) in T1 and T2 for vaccinated (B-F) and unvaccinated patients (G-K). The gray bars represent median values (C-F, H-K). The data were statistically analysed using paired t tests. *p < 0.05, **p < 0.01, ***p < 0.001, ****p < 0.0001.
The results showed that the memory ASC IgG+ response was effectively established 3 to 6 months after SARS-CoV-2 infection with further induction of the IgG+ ASC response to the S antigen after vaccination; however, circulating IgA+ ASCs directed against SARS-CoV-2 were rare, and vaccination tended not to increase their numbers.
Antibody detection
Sera from 62 patients who underwent both T1 and T2 blood draws were analysed via SARS-CoV-2 ELISAs and a surrogate virus neutralisation test. Changes between T1 and T2 are expressed as the median of T2/T1 ratios. Vaccinated patients (51/62) were divided according to the number of months from the last vaccine dose to T2, regardless of the number of doses and vaccine type (). In the first sampling, 90.2% (46/51) of the subsequently vaccinated patients were IgG positive for the S1 antigen. An IgA antibody response was found in fewer patients (78.4%; 40/51; ). Vaccination between T1 and T2 markedly enhanced the magnitude of the response for both analysed isotypes of circulating anti-S1 antibodies—3.47-times for IgG (p < 0.0001; ) and 5.49-times for IgA (p < 0.0001; ). There was a correlation between anti-S1 IgG levels () and the number of months since vaccination (rs = −0.3624; p = 0.0090), indicating anti-S1 IgG levels decreased with time since the last vaccine dose. The positivity increased from 90.2% to 98.0% (50/51) for IgG and from 78.4% to 96.1% (49/51) for IgA antibodies. An IgG response to the N antigen was detected in 86.3% (44/51) of patients at T1 (). At T2, the response decreased, with a median T2/T1 ratio equal to 0.26 (p < 0.0001; ), and sample positivity decreased to 47.1% (24/51; ). Among the unvaccinated patients (11/62), 90.9% (10/11) and 72.7% (8/11) were positive for anti-S1 IgG and IgA at T1, respectively (). At T2, 81.8% (9/11) of the unvaccinated patients were positive for both antibody isotypes. The T2/T1 ratio of the anti-S1 response changed 0.83-times (p = 0.4977) for IgG and 1.08- times (p = 0.5249) for IgA ( and ). The response of circulating IgG antibodies against the N antigen was not stable in the unvaccinated group and decreased from 72.7% (8/11) of the positive patients to 36.4% (4/11; ). The level of anti-N IgG antibody changed 0.29-times (p = 0.0060; ).
Anti-RBD neutralising antibodies (nAbs) were analysed in the same groups. Among the vaccinated patients, 90.2% (46/51) were considered positive for nAbs at T1, while at T2, 98.0% (50/51) were positive (). The magnitude of the response increased 4.61- times (p < 0.0001) between T1 and T2 (). There was a correlation between nAb levels and disease severity in both time points T1 (rs = 0.6150; p < 0.0001) and T2 (rs = 0.3284; p = 0.0186). Among the unvaccinated patients, 81.8% (9/11) were positive for nAbs at T1, whereas 72.7% (8/11) were positive at T2 (). The magnitude of the T2/T1 ratio of the nAb response changed 0.79-times (p = 0.2367; ).
The detection of serum antibodies showed that the levels of circulating anti-S1 IgG and IgA antibodies increased after vaccination. The response to the rN protein decreased between the samplings, but most patients were still considered positive. Positive nAb levels were detected in more patients than antibody isotypes detected by ELISA and were also detected at relatively high levels in unvaccinated patients.
Interplay between components of the adaptive immune system
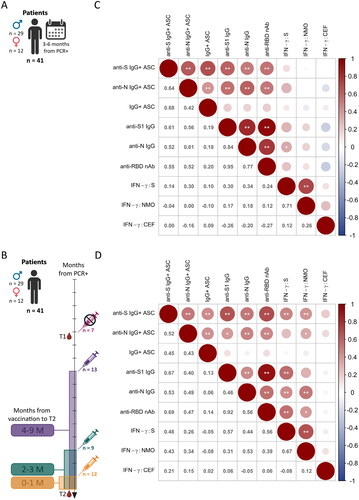
Results of serum and PBMC analyses of 41 patients for whom the data from all assays were available for both blood draws were compared using multivariate analysis. The immune response was compared separately for T1 () and T2 (). A comparison of the samples obtained at T1 revealed the strongest positive correlation between anti-S1 IgG and anti-RBD nAbs (rs = 0.95; ). The presence of antibodies correlated with the level of memory IgG+ ASCs (). The responses of T cells to S and NMO antigens were also significantly correlated with each other (rs = 0.71). Interestingly, the magnitude of the T-cell response did not correlate positively with the B-cell response. At T2 (), there was a positive correlation between anti-S IgG+ ASCs and SARS-CoV-2-specific T cells that produced IFN-γ against the S (rs = 0.48) and NMO (rs = 0.43) peptide pools. In general, a significant positive correlation between B-cell and T-cell responses after vaccination was found in most comparisons ().
Figure 4. Correlations of all branches of the adaptive immune response after SARS-CoV-2 infection and vaccination. The data from samples with available results (A, B) for all previously analysed parameters were correlated in matrix plots showing the Spearman correlation between all parameters with significance levels: *p < 0.05, **p < 0.01. The size and colour intensity of the circle represent the absolute value of the Spearman rank correlation coefficient noted on the left side. Red represents positive correlations, and blue represents negative correlations. Matrix plots show the correlation of the data for T1 (C) and T2 (D) separately.
Owing to the combination of different groupings of patients used in the multivariate correlation (), we proceeded to perform a deeper and more individual comparison of the obtained data (). A heatmap for T1 () was generated to summarise the immune status of patients 3-6 months after SARS-CoV-2 infection according to the similarity of the measured parameters. Older people with greater disease severity tended to have a stronger response of memory IgG+ ASCs (cluster 1), which may or may not be supported by memory T cells. Patients in cluster 2 had higher levels of anti-RBD nAbs and a lower response of memory IgG+ ASCs than patients in cluster 1. Patients in cluster 2 still tended to have more severe COVID-19 than did those in cluster 3, which included younger patients with milder disease (mostly G1-3, with some exceptions). In summary, the T1 data show that the response to SARS-CoV-2 infection is highly individual and that immune memory is influenced by disease severity, which is associated with age.
Figure 5. Multiparametric analysis of branches of adaptive immunity after SARS-CoV-2 infection and vaccination. Data from samples with available results for all previously analysed parameters (see ) are presented in a heatmap with a dendrogram and patient IDs (P1-P41) showing measured variables expressed by a colour scale (std. value) clustered in 3 groups (clusters) separately at T1 (A) and T2 (B). Sex (male – M or female – F), age (26-77 years), and severity of COVID-19 (G1 – asymptomatic, G2 – mild, G3 – moderate, G4 – severe, G5 – critical and G6 – critical, requiring artificial lung ventilation and/or extracorporeal membrane oxygenation) were observed for patients at T1. Moreover, the number of vaccine doses (0-3) and the interval of months after vaccination (0-1; 2-3; 4-9; - refers to unvaccinated) were observed for patients at T2.
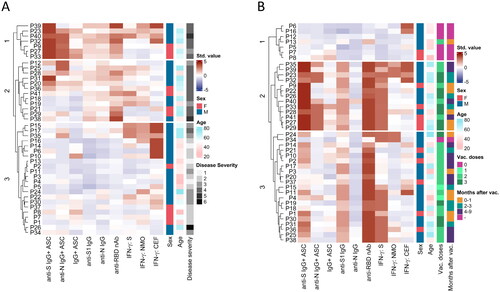
After assessing the changes at T2 compared to T1 (), the same outlier limits and numerical characteristic values were used as for the T1 data. Clustering was strongly influenced by vaccination. With one exception, all unvaccinated patients in cluster 1 had a lower overall anti-SARS-CoV-2 response than did the vaccinated patients. Clusters 2 and 3 revealed that vaccination further improved blood levels of anti-S IgG and the anti-RBD nAbs. Interestingly, cluster 2 differed from cluster 3 in its greater response of anti-S and anti-N memory IgG+ ASCs, linking patients who received more vaccine doses. The mean number of vaccine doses was approximately 2.6 for cluster 2 and 2.1 for cluster 3. Vaccination also induced anti-S memory T cells - all patients with 3 doses had a strong anti-S memory T-cell response in both clusters 2 and 3 ().
In summary, our data reveal the individuality of the anti-SARS-CoV-2 response after COVID-19 (at T1) and further support the benefit of repeated vaccination due to the increased induction of memory B-cell and T-cell responses against the S antigen. People receiving more vaccine doses appear to have higher levels of IgG+ ASCs.
Discussion
Due to the easy spread of SARS-CoV-2 and the early and high vaccination coverage, the number of people with hybrid immunity is relatively high. To understand the secondary immune response against SARS-CoV-2, it is necessary to know the relationship between the branches of immune memory compartments. In this study, we analysed all the branches related to immune memory: T cells, B cells and circulating antibodies, in patients after COVID-19 compared to SARS-CoV-2-negative blood donors. The immune response of the patients was analysed at two time points: 3 to 6 months after the positive PCR test (T1) and 1 year after the first sampling (T2). Since most patients were vaccinated against SARS-CoV-2 between T1 and T2, they developed hybrid immunity.
The T-cell response was evaluated using an ELISpot assay in which cells producing IFN-γ were detected after stimulation with SARS-CoV-2-specific peptide pools or the control CEF peptide pool. The results showed the effective development of an anti-SARS-CoV-2 response against S and NMO antigens in most patients, which is consistent with the findings of other studies [Citation13, Citation18]. In natural infection, the response to the S antigen has been demonstrated to be stronger than that to other viral antigens [Citation30, Citation31]. The results for the NMO peptides reflect the response only after infection or possible reinfection because none of the NMO epitopes were included in the vaccines used. Our data suggest that the response to the NMO epitopes was almost twice as strong as the response to the S epitopes. As similar numbers of peptides were used in the S and NMO peptide pools, this difference may be caused by differences in the immunodominance of individual epitopes. Most of the immune epitopes have been detected within the S antigen but also within the ORF1a sequence [Citation30]; these are epitopes included in the NMO peptide pool. On the other hand, a response to SARS-CoV-2-specific antigens was also found in several control samples. However, since approximately 80% of SARS-CoV-2 epitopes are unique and have never been exposed to the immune system before the COVID-19 pandemic [Citation10], the presence of a response in the control group may indicate cross-reactive T cells primed against human coronaviruses, as has been shown previously [Citation10, Citation32, Citation33].
Our data support the efficacy of vaccination in individuals, who were previously symptomatically infected and its ability to boost the anti-S response, which increased almost 5-times in T2. This boosting effect has also been observed by others [Citation34, Citation35]. The magnitude of the response to the NMO antigens decreased in most patients at T2, but the positivity of the samples against NMO remained almost the same, suggesting the possible maintenance of the immune memory response for a longer period of time. It has been shown that the anti-N memory T-cell response can be maintained for at least 15 months [Citation18], including individuals in whom neutralising antibodies have disappeared [Citation36]. In addition, the memory T-cell response directed against the SARS-CoV-1 N protein has been shown to be detectable even 17 years after SARS-CoV-1 infection [Citation37]. Individual patients with an increased response to NMO peptides at T2 suggested the possibility of undetected SARS-CoV-2 reinfection.
The magnitude of the mean response to CEF was almost twice as high in the control group as in the patient group. These findings suggest a possible perturbation in the antiviral immune response caused by SARS-CoV-2. Gao et al. (2023) reported that patients with a COVID-19 convalescent status had a lower response to vaccination against SARS-CoV-2 than patients after vaccination alone. They also reported reduced activation of CD8+ T cells after prior SARS-CoV-2 infection. Interestingly, the response to HCMV was reduced only in the group of hospitalised COVID-19 patients compared to that in nonhospitalized patients [Citation38]. These findings may suggest that the immunosuppressive effect of SARS-CoV-2 infection may occur only in patients with severe COVID-19, which is consistent with our patient’s data (the majority of patients were hospitalised and had more severe COVID-19). Since severe COVID-19 can be defined as severe sepsis [Citation39–41], which can lead to the apoptosis of dendritic cells [Citation42] and T cells [Citation39], including memory T-cell subsets [Citation43]; this mechanism might explain the reduced anti-CEF response observed in the patients in this study. On the other hand, other studies comparing the immune response to CEF in controls and convalescents have not shown any differences [Citation44, Citation45] or have shown greater positivity for CEF in convalescents after SARS-CoV-2 infection [Citation46]. However, no statistically significant differences have been found between patients and controls in studies that enrolled proportionally more patients with mild than severe COVID-19 [Citation44] or enrolled patients sampled within only 2 weeks from COVID-19 diagnosis [Citation45]. Moreover, a study showing a greater anti-CEF response in the SARS-CoV-2 convalescent group enrolled only mild patients [Citation46], suggesting that a reduced anti-CEF response after SARS-CoV-2 infection may be observed only in memory IFN-γ-producing T-cell populations and/or be associated with more severe disease. Since a reduced response to CEF was also observed at T2, the immunosuppressive effect of SARS-CoV-2 infection could be long lasting. This implies that infection may affect long-lived memory T-cell populations, as has been shown, for example, for measles virus and its negative effect on long-lived plasma cells [Citation47]. It should be noted that the reduced anti-CEF response may also be the effect of the difference in age range between patients and controls [Citation48, Citation49] in this study.
The phenotype of T lymphocytes was analysed by flow cytometry in 6 patients. Although we noted some interesting observations, due to the small sample size, our data did not reveal any statistically significant T-cell phenotype characteristics specific for SARS-CoV-2 infection. Data on the detection of activated CD4+ and CD8+ subpopulations outline that after vaccination (at T2), the frequencies of S- or NMO-specific CD4+ Th populations increased, but overall, we found low frequencies of SARS-CoV-2-specific T cells. Minervina et al. showed that individuals after contracting COVID-19 (61-110 days post infection) had a reduced total number of CD4+ memory T cells compared to those vaccinated only [Citation50]. Similar results have been shown for CD8+ lymphocytes (21-42 days post infection) [Citation34]; therefore, the limited number of SARS-CoV-2-specific T cells detected in our study might be due to the enrolment of COVID-19 patients with more severe disease. The frequencies of CD8+ and CD4+ Tcm and Tem cells stimulated by the S-peptide pool seemed to increase between T1 and T2, suggesting a boosting effect of vaccination, as shown by others [Citation50, Citation51].
Analysis of SARS-CoV-2-specific B-cell memory subpopulations was performed using a double-colour enzymatic ELISpot assay. Most patients developed B-cell memory against both antigens (rS and rN). Since the number of memory B cells increases rapidly in the first 3 months after infection, gradually stabilises after 4 months [Citation13], and can increase up to 6 months after infection depending on the specific SARS-CoV-2 antigen targeted [Citation13, Citation52], our data (at T1) on ASCs were indicative of the formation of a stabilised memory B-cell population. Although a positive response was found in some controls, the mean number of anti-S IgG+ ASCs was more than 80 times greater in patients than in controls, confirming the establishment of robust B-cell memory against the S antigen after SARS-CoV-2 infection. The detection of a positive response in the control group may suggest cross-reactivity and/or unrecognised asymptomatic infection [Citation53]. Interestingly, we found a reduction in the overall level of IgA+ ASCs in the patient group compared to that in the control group. These data suggest a possible negative effect of SARS-CoV-2 infection on IgA+ ASCs, but this possibility should be further investigated due to the non-specific detection of ASCs by the capture antibody. In most patients, SARS-CoV-2-specific IgA+ ASCs were not found, or their level was low. This may reflect the kinetics of circulating anti-S IgA antibodies, which have a half-life of only 55 days [Citation18], and the rarity of circulating IgA+ memory B cells, which have been found to be undetectable in most COVID-19 patients approximately 5 months after infection [Citation17]. After vaccination at T2, the anti-S response of IgG+ ASCs increased 5-times in all vaccinated patients, whereas vaccination did not support the anti-S IgA+ ASC response. We also observed an increased number of positive samples at T2 in the unvaccinated group, although the magnitude of the response decreased. An increased number of positive samples at T2 may be caused by undetected asymptomatic infection or may reflect long-lasting generation of memory B cells [Citation17] due to long-term germinal centres present in some patients even 7 months after confirmation of SARS-CoV-2 infection [Citation16] and continual affinity maturation of SARS-CoV-2-specific memory B cells [Citation17].
Circulating memory B cells, either IgG+ or IgA+, may not correspond to circulating antibody levels due to the presence of long-lived plasma B cells in the bone marrow that produce high levels of both antibody isotypes. Therefore, we also analysed the levels of SARS-CoV-2-specific anti-S1 and anti-N IgG and anti-S1 IgA antibodies in the patient group by ELISA. We showed that both IgG and IgA anti-S1 antibody levels increased significantly in vaccinated patients. Since we detected only a low number of memory IgA+ ASCs by the B-ELISpot, these results may indicate that the main producers of SARS-CoV-2-specific IgA in the blood circulation could be long-lived IgA+ plasma cells in the bone marrow [Citation54] or memory IgA+ cells in the lymph nodes [Citation55] rather than circulating memory IgA+ ASCs. We also showed that vaccination markedly enhanced the level of nAbs, as reported by others [Citation18, Citation56, Citation57]. On the other hand, the nAb levels in unvaccinated patients decreased over time, demonstrating the benefit of vaccination also after infection. Positive nAb responses were found in more patients than IgG and IgA antibodies detected by ELISA, most likely due to the high sensitivity of the sVNT test [Citation58].
Finally, we performed a multivariate analysis on all the results obtained to identify common patterns that might characterise the memory immune response to SARS-CoV-2. We found that in patients at T1, there was a strong correlation between the branches of the B-cell response (IgG+ ASCs, anti-S1 IgG, anti-N IgG and anti-RBD nAbs), but there was no correlation or only a weak correlation between the B-cell response and the T-cell response. Since milder COVID-19 has been shown to lead to a stronger correlation between the SARS-CoV-2-directed CD4+ T-cell response and antibody levels [Citation59], our results may be affected by a high proportion of patients with severe to critical COVID-19. This difference may be due to CD4+ Tfh cell impairment because elevated antibody levels are associated with increased numbers of activated Tfh cells over time [Citation59]. On the other hand, others have also shown that the antibody response does not correlate with the T-cell response (cells producing IFN-γ, IL-2 or both cytokines in response to S1 or SNMO peptide pools) [Citation18] in patients who are not vaccinated. However, after vaccination, the SARS-CoV-2-specific T-cell response significantly correlated with the anti-SARS-CoV-2 antibody and memory IgG+ ASC levels, indicating the supportive effect of vaccination on the development of both branches of the immune response in patients with hybrid immunity [Citation22]. Interestingly, we found a correlation between the number of anti-S IgG+ ASCs and the number of T cells producing IFN-γ after stimulation with the NMO peptide pool. This might suggest that vaccination may also lead to non-specific activation of the T-cell response [Citation60]; more likely, this may be the effect of unrevealed SARS-CoV-2 reinfection [Citation61].
To assess the complexity and variability of immune responses to SARS-CoV-2 infection, a multivariate analysis also included clustering of individual parameters, which revealed 3 clusters for T1 and T2. Clustering at T1 was mainly based on the B-cell response (both circulating antibodies and ASCs) and was affected by COVID-19 severity, which was associated with age. In agreement with our data, others have shown that a higher antibody response is usually correlated with more severe outcomes and/or hospitalisation [Citation38, Citation59]. After vaccination at T2, the induction of IgG+ memory ASCs was a critical factor in clustering. Patients in Cluster 2 exhibited a strong response of anti-S IgG+ ASCs and S-specific T cells and high levels of anti-RBD nAbs, which was associated with more vaccine doses than was observed in Cluster 3. In our study, the importance of repeated vaccination for the activation of immune memory was particularly evident in the stimulation of T cells, as all patients who received 3 doses had high levels of T-cell immunity.
This study has several limitations. First, we were confronted with low compliance of the study population regarding the second sampling despite the prediction of the attending physicians in the process of study planning. Second, we did not expect such rapid development of vaccines and therefore did not design the study with the inclusion criterion of not being vaccinated before the second sampling. Obviously, this approach would not have been possible for ethical reasons. Third, due to the enrolment of seronegative blood donors as controls, it was unfortunately not possible to fully match patients and controls by age (blood donation is possible from 18 to 65 years).
Nevertheless, the study demonstrated a long-term memory response of both B cells and T cells in patients with hybrid immunity for up to 15 months after a positive SARS-CoV-2 PCR test, a large beneficial effect of vaccination on further induction of these memory cells, and the need for repeated vaccinations to enhance and maintain immune memory. In addition to concerns about vaccine safety, vaccine efficacy and effectiveness concerns have been described as the main reasons for vaccine hesitancy [Citation62, Citation63]. Interestingly, most of the patients in our study who came for the second sampling have been vaccinated but the coverage by the primary vaccination (two vaccine doses) in the Czech Republic did not exceed 65% [Citation64]. Therefore, our results support the importance of vaccination even in the infected individuals and also the need for boosters for sustained protection from severe disease and death. Our findings also suggested a possible long-term negative effect of severe SARS-CoV-2 infection on the overall antiviral immune memory response that warrants further investigation.
infd_a_2358379_sm7786.docx
Download MS Word (823.3 KB)Acknowledgments
The views and opinions expressed are those of the authors only and do not necessarily reflect those of the European Union or the European Health and Digital Executive Agency. Neither the European Union nor the granting authority can be held responsible for them. Schemes and pictures were created at Biorender.com.
Disclosure statement
No potential conflict of interest was reported by the author(s).
Data availability statement
The data that support the findings of this study are available from the corresponding author (Michal Šmahel) upon reasonable request.
Additional information
Funding
References
- Corman VM, Landt O, Kaiser M, et al. Detection of 2019 novel coronavirus (2019-nCoV) by real-time RT-PCR. Euro Surveill. 2020;25(3):2000045. doi: 10.2807/1560-7917.ES.2020.25.3.2000045.
- Acuti Martellucci C, Flacco ME, Cappadona R, et al. SARS-CoV-2 pandemic: an overview. Adv Biol Regul. 2020;77:100736. doi: 10.1016/j.jbior.2020.100736.
- WHO. WHO coronavirus (COVID-19) dashboard, 2023. accessed 2023 Dec 13. https://covid19.who.int. .
- V'kovski P, Kratzel A, Steiner S, et al. Coronavirus biology and replication: implications for SARS-CoV-2. Nat Rev Microbiol. 2021;19(3):155–170. doi: 10.1038/s41579-020-00468-6.
- Beyer DK, Forero A. Mechanisms of antiviral immune evasion of SARS-CoV-2. J Mol Biol. 2022;434(6):167265. doi: 10.1016/j.jmb.2021.167265.
- Blair JE, Gotimukul A, Wang F, et al. Mild to moderate COVID-19 illness in adult outpatients. Medicine (Baltimore). 2021;100(24):e26371. doi: 10.1097/MD.0000000000026371.
- Oran DP, Topol EJ. Prevalence of asymptomatic SARS-CoV-2 infection: a narrative review. Ann Intern Med. 2020;173(5):362–367. doi: 10.7326/M20-3012.
- Sette A, Crotty S. Adaptive immunity to SARS-CoV-2 and COVID-19. Cell. 2021;184(4):861–880. doi: 10.1016/j.cell.2021.01.007.
- Sette A, Crotty S. Immunological memory to SARS-CoV-2 infection and COVID-19 vaccines. Immunol Rev. 2022;310(1):27–46. doi: 10.1111/imr.13089.
- Tarke A, Sidney J, Kidd CK, et al. Comprehensive analysis of T cell immunodominance and immunoprevalence of SARS-CoV-2 epitopes in COVID-19 cases. Cell Rep Med. 2021;2:100204. doi: 10.1016/j.xcrm.2021.100204.
- Farber DL, Yudanin NA, Restifo NP. Human memory T cells: generation, compartmentalization and homeostasis. Nat Rev Immunol. 2014;14(1):24–35. doi: 10.1038/nri3567.
- Akbar AN, Terry L, Timms A, et al. Loss of CD45R and gain of UCHL1 reactivity is a feature of primed T cells. J Immunol. 1988;140(7):2171–2178. doi: 10.4049/jimmunol.140.7.2171.
- Dan JM, Mateus J, Kato Y, et al. Immunological memory to SARS-CoV-2 assessed for up to 8 months after infection. Science. 2021;371(6529):eabf4063. doi: 10.1126/science.abf4063.
- Hope JL, Bradley LM. Lessons in antiviral immunity. Science. 2021;371(6528):464–465. doi: 10.1126/science.abf6446.
- Karlsson AC, Humbert M, Buggert M. The known unknowns of T cell immunity to COVID-19. Sci Immunol. 2020;5(53):eabe8063. doi: 10.1126/sciimmunol.abe8063.
- Tan H-X, Wragg KM, Kelly HG, et al. Cutting edge: SARS-CoV-2 infection induces robust germinal center activity in the human tonsil. J Immunol. 2022;208(10):2267–2271. doi: 10.4049/jimmunol.2101199.
- Sakharkar M, Rappazzo CG, Wieland-Alter WF, et al. Prolonged evolution of the human B cell response to SARS-CoV-2 infection. Sci Immunol. 2021;6(56):eabg6916. doi: 10.1126/sciimmunol.abg6916.
- Marcotte H, Piralla A, Zuo F, et al. Immunity to SARS-CoV-2 up to 15 months after infection. iScience. 2022;25(2):103743. doi: 10.1016/j.isci.2022.103743.
- Thompson MG, Burgess JL, Naleway AL, et al. Interim estimates of vaccine effectiveness of BNT162b2 and mRNA-1273 COVID-19 vaccines in preventing SARS-CoV-2 infection among health care personnel, first responders, and other essential and frontline workers - eight U.S. locations, December 2020-March 2021. MMWR Morb Mortal Wkly Rep 2021;70:495–500. doi: 10.15585/mmwr.mm7013e3.
- Brannock MD, Chew RF, Preiss AJ, et al. Long COVID risk and pre-COVID vaccination in an EHR-based cohort study from the RECOVER program. Nat Commun. 2023;14(1):2914. doi: 10.1038/s41467-023-38388-7.
- Pušnik J, Monzon-Posadas WO, Zorn J, et al. SARS-CoV-2 humoral and cellular immunity following different combinations of vaccination and breakthrough infection. Nat Commun. 2023;14(1):572. doi: 10.1038/s41467-023-36250-4.
- Bobrovitz N, Ware H, Ma X, et al. Protective effectiveness of previous SARS-CoV-2 infection and hybrid immunity against the omicron variant and severe disease: a systematic review and meta-regression. Lancet Infect Dis. 2023;23(5):556–567. doi: 10.1016/S1473-3099(22)00801-5.
- Broberg E, Nicoll A, Amato-Gauci A. Seroprevalence to influenza A(H1N1) 2009 virus—where are we? Clin Vaccine Immunol. 2011;18(8):1205–1212. doi: 10.1128/CVI.05072-11.
- Dowd JB, Palermo T, Brite J, et al. Seroprevalence of Epstein-Barr virus infection in U.S. children ages 6-19, 2003-2010. PLoS One. 2013;8(5):e64921. doi: 10.1371/journal.pone.0064921.
- Lachmann R, Loenenbach A, Waterboer T, et al. Cytomegalovirus (CMV) seroprevalence in the adult population of Germany. PLoS One. 2018;13(7):e0200267. doi: 10.1371/journal.pone.0200267.
- Lehmann AA, Kirchenbaum GA, Zhang T, et al. Deconvoluting the T cell response to SARS-CoV-2: Specificity versus chance and cognate cross-reactivity. Front Immunol. 2021;12:635942. doi: 10.3389/fimmu.2021.635942.
- Wolf C, Köppert S, Becza N, et al. Antibody levels poorly reflect on the frequency of memory B cells generated following SARS-CoV-2, seasonal influenza, or EBV infection. Cells. 2022;11(22):3662. doi: 10.3390/cells11223662.
- Taiyun W, Simko V. R package “corrplot”: visualization of a correlation matrix (Version 0.92), 2021. accessed 2023 Aug 23. https://github.com/taiyun/corrplot.
- Gu Z, Eils R, Schlesner M. Complex heatmaps reveal patterns and correlations in multidimensional genomic data. Bioinformatics. 2016;32(18):2847–2849. doi: 10.1093/bioinformatics/btw313.
- Quadeer AA, Ahmed SF, McKay MR. Landscape of epitopes targeted by T cells in 852 individuals recovered from COVID-19: meta-analysis, immunoprevalence, and web platform. Cell Rep Med. 2021;2:100312. doi: 10.1016/j.xcrm.2021.100312.
- Ssali I, Mugaba S, Watelo AK, et al. Spike protein is a key target for stronger and more persistent T-cell responses—a study of mild and asymptomatic SARS-CoV-2 infection. Int J Infect Dis. 2023;136:49–56. doi: 10.1016/j.ijid.2023.09.001.
- Kundu R, Narean JS, Wang L, et al. Cross-reactive memory T cells associate with protection against SARS-CoV-2 infection in COVID-19 contacts. Nat Commun. 2022;13(1):80. doi: 10.1038/s41467-021-27674-x.
- Tarke A, Zhang Y, Methot N, et al. Targets and cross-reactivity of human T cell recognition of common cold coronaviruses. Cell Rep Med. 2023;4(6):101088. doi: 10.1016/j.xcrm.2023.101088.
- Gao F, Mallajosyula V, Arunachalam PS, et al. Spheromers reveal robust T cell responses to the Pfizer/BioNTech vaccine and attenuated peripheral CD8+ T cell responses post SARS-CoV-2 infection. Immunity. 2023;56(4):864–878.e4. doi: 10.1016/j.immuni.2023.03.005.
- Sedegah M, Porter C, Goguet E, et al. Cellular interferon-gamma and interleukin-2 responses to SARS-CoV-2 structural proteins are broader and higher in those vaccinated after SARS-CoV-2 infection compared to vaccinees without prior SARS-CoV-2 infection. PLoS One. 2022;17(10):e0276241. doi: 10.1371/journal.pone.0276241.
- Guo L, Wang G, Wang Y, et al. SARS-CoV-2-specific antibody and T-cell responses 1 year after infection in people recovered from COVID-19: a longitudinal cohort study. The Lancet Microbe. 2022;3(5):e348–e356. doi: 10.1016/S2666-5247(22)00036-2.
- Le Bert N, Tan AT, Kunasegaran K, et al. SARS-CoV-2-specific T cell immunity in cases of COVID-19 and SARS, and uninfected controls. Nature. 2020;584(7821):457–462. doi: 10.1038/s41586-020-2550-z.
- Shrock E, Fujimura E, Kula T, MGH COVID-19 Collection & Processing Team, et al. Viral epitope profiling of COVID-19 patients reveals cross-reactivity and correlates of severity. Science. 2020;370(6520):eabd4250. doi: 10.1126/science.abd4250.
- Hotchkiss RS, Moldawer LL, Opal SM, et al. Sepsis and septic shock. Nat Rev Dis Primers. 2016;2(1):16045. doi: 10.1038/nrdp.2016.45.
- Karakike E, Giamarellos-Bourboulis EJ, Kyprianou M, et al. Coronavirus disease 2019 as cause of viral sepsis: a systematic review and meta-analysis. Crit Care Med. 2021;49(12):2042–2057. doi: 10.1097/CCM.0000000000005195.
- Shappell CN, Klompas M, Chan C, CDC Prevention Epicenters Program, et al. Use of electronic clinical data to track incidence and mortality for SARS-CoV-2–associated sepsis. JAMA Netw Open. 2023;6(9):e2335728. doi: 10.1001/jamanetworkopen.2023.35728.
- Chang T, Yang J, Deng H, et al. Depletion and dysfunction of dendritic cells: understanding SARS-CoV-2 infection. Front Immunol. 2022;13:843342. doi: 10.3389/fimmu.2022.843342.
- Al Saihati HA, Hussein HAM, Thabet AA, et al. Memory T cells discrepancies in COVID-19 patients. Microorganisms. 2023;11(11):2737. doi: 10.3390/microorganisms11112737.
- Humbert M, Olofsson A, Wullimann D, et al. Functional SARS-CoV-2 cross-reactive CD4+ T cells established in early childhood decline with age. Proc Natl Acad Sci U S A. 2023;120(12):e2220320120. doi: 10.1073/pnas.2220320120.
- Saini SK, Hersby DS, Tamhane T, et al. SARS-CoV-2 genome-wide T cell epitope mapping reveals immunodominance and substantial CD8+ T cell activation in COVID-19 patients. Sci Immunol. 2021;6(58):eabf7550. doi: 10.1126/sciimmunol.abf7550.
- Koerber N, Priller A, Yazici S, et al. Dynamics of spike-and nucleocapsid specific immunity during long-term follow-up and vaccination of SARS-CoV-2 convalescents. Nat Commun. 2022;13(1):153. doi: 10.1038/s41467-021-27649-y.
- Petrova VN, Sawatsky B, Han AX, et al. Incomplete genetic reconstitution of B cell pools contributes to prolonged immunosuppression after measles. Sci Immunol. 2019;4(41):eaay6125. doi: 10.1126/sciimmunol.aay6125.
- Zhou F, Yu T, Du R, et al. Clinical course and risk factors for mortality of adult inpatients with COVID-19 in Wuhan, China: a retrospective cohort study. Lancet. 2020;395(10229):1054–1062. doi: 10.1016/S0140-6736(20)30566-3.
- Molani S, Hernandez PV, Roper RT, et al. Risk factors for severe COVID-19 differ by age for hospitalized adults. Sci Rep. 2022;12(1):6568. doi: 10.1038/s41598-022-10344-3.
- Minervina AA, Pogorelyy MV, Kirk AM, et al. SARS-CoV-2 antigen exposure history shapes phenotypes and specificity of memory CD8+ T cells. Nat Immunol. 2022;23(5):781–790. doi: 10.1038/s41590-022-01184-4.
- Mise-Omata S, Ikeda M, Takeshita M, et al. Memory B cells and memory T cells induced by SARS-CoV-2 booster vaccination or infection show different dynamics and responsiveness to the omicron variant. J Immunol. 2022;209(11):2104–2113. doi: 10.4049/jimmunol.2200525.
- Wang Z, Muecksch F, Schaefer-Babajew D, et al. Naturally enhanced neutralizing breadth against SARS-CoV-2 one year after infection. Nature. 2021;595(7867):426–431. doi: 10.1038/s41586-021-03696-9.
- Song G, He W, Callaghan S, et al. Cross-reactive serum and memory B-cell responses to spike protein in SARS-CoV-2 and endemic coronavirus infection. Nat Commun. 2021;12(1):2938. doi: 10.1038/s41467-021-23074-3.
- Turner JS, Kim W, Kalaidina E, et al. SARS-CoV-2 infection induces long-lived bone marrow plasma cells in humans. Nature. 2021;595(7867):421–425. doi: 10.1038/s41586-021-03647-4.
- Poon MML, Rybkina K, Kato Y, et al. SARS-CoV-2 infection generates tissue-localized immunological memory in humans. Sci Immunol. 2021;6(65):eabl9105. doi: 10.1126/sciimmunol.abl9105.
- Naaber P, Tserel L, Kangro K, et al. Dynamics of antibody response to BNT162b2 vaccine after six months: a longitudinal prospective study, the lancet regional. Lancet Reg Health Eur. 2021;10:100208. doi: 10.1016/j.lanepe.2021.100208.
- Sahin U, Muik A, Vogler I, et al. BNT162b2 vaccine induces neutralizing antibodies and poly-specific T cells in humans. Nature. 2021;595(7868):572–577. doi: 10.1038/s41586-021-03653-6.
- Tan CW, Chia WN, Qin X, et al. A SARS-CoV-2 surrogate virus neutralization test based on antibody-mediated blockage of ACE2–spike protein–protein interaction. Nat Biotechnol. 2020;38(9):1073–1078. doi: 10.1038/s41587-020-0631-z.
- Nelson RW, Chen Y, Venezia OL, MGH COVID-19 Collection & Processing Team, et al. SARS-CoV-2 epitope-specific CD4+ memory T cell responses across COVID-19 disease severity and antibody durability. Sci Immunol. 2022;7(73):eabl9464. doi: 10.1126/sciimmunol.abl9464.
- Schramm CA, Moon D, Peyton L, et al. Interaction dynamics between innate and adaptive immune cells responding to SARS-CoV-2 vaccination in non-human primates. Nat Commun. 2023;14(1):7961. doi: 10.1038/s41467-023-43420-x.
- Deng L, Li P, Zhang X, et al. Risk of SARS-CoV-2 reinfection: a systematic review and meta-analysis. Sci Rep. 2022;12(1):20763. doi: 10.1038/s41598-022-24220-7.
- Trabucco Aurilio M, Mennini FS, Ferrari C, et al. Main predictors of COVID-19 vaccination uptake among Italian healthcare workers in relation to variable degrees of hesitancy: result from a cross-sectional online survey. Trop Med Infect Dis. 2022;7(12):419. doi: 10.3390/tropicalmed7120419.
- Li M, Luo Y, Watson R, et al. Healthcare workers’ (HCWs) attitudes and related factors towards COVID-19 vaccination: a rapid systematic review. Postgrad Med J. 2023;99(1172):520–528. doi: 10.1136/postgradmedj-2021-140195.
- https://ockovani.opendatalab.cz/statistiky. accessed 2024 April 4.