
Abstract
Background
Severe acute respiratory syndrome coronavirus 2 (SARS-CoV-2) is an airborne pathogen, but detection of infectious SARS-CoV-2 in air and in particular the introduction of the virus into the environment by different human expiratory manoeuvres is not well studied.
Objectives
The aim of this study was to investigate the presence of SARS-CoV-2 in cough from coronavirus disease of 2019 (COVID-19) in-patients and to study contamination of the virus in the patient’s environment.
Methods
Detection of SARS-CoV-2 in cough was analyzed by PCR, culture and imaging. Detection in cough was compared to presence of the virus in air and on surfaces from patient rooms.
Results
Twenty-five patients in 21 rooms were included in the study. SARS-CoV-2 RNA was found in cough aerosols from 16 out of 22 patients that produced voluntary cough. As demonstrated by plaque-forming unit assays, active virus was isolated from 11 of these 16 patients. Using mainly molecular detection, the virus was also found in air, on high-contact surfaces, and no-touch surfaces from the room of the COVID-19 patients.
Conclusions
These results show that infectious SARS-CoV-2 circulating in air can originate from patient cough and should be considered against the risk of acquiring COVID-19 through inhalation.
Introduction
Coronavirus disease of 2019 (COVID-19) is caused by infection with severe acute respiratory syndrome coronavirus 2 (SARS-CoV-2) and has claimed almost 7 million lives to date [Citation1]. Efforts to control SARS-CoV-2 require a better understanding of how the virus spreads. Transmission-based precautions for infection control traditionally categorize the spread of respiratory pathogens into contact, droplet and airborne (or aerosol) transmission, respectively [Citation2,Citation3]. Revised categories based on how pathogens are transferred [Citation4] to a contact and that consider the continuum of respiratory infection in the inhalation route [Citation5] are gaining ground. Thus, public health organizations such as the WHO [Citation6], the Center for Disease Control and Prevention in the USA [Citation7], and the Public Health Agencies of Canada [Citation8] and Sweden [Citation9], respectively, essentially recognize airborne transmission of COVID-19 by short and long-range aerosol inhalation. Such recognition has been important for implementing measures based on aerosols to mitigate COVID-19. That said, there is not a large body of data on aerosol transmission of SARS-CoV-2. Several studies have shown the presence of SARS-CoV-2 RNA in the air [Citation10–17]. In some cases, it has also been possible to identify active virus from aerosols [Citation13–16,Citation18]. A recent study shows that SARS-CoV-2 can be expectorated during breathing, talking and singing [Citation19].
Seasonal coronavirus, influenza virus and rhinovirus have been detected in ‘fine’ aerosols (<5 µm) in the exhaled breath of individuals with acute respiratory illness [Citation20]. This suggests that these viruses may be acquired by both short- and long-range inhalation. Interestingly, influenza virus can be detected in aerosols from infected patients during voluntary cough [Citation21–23] or exhaled breath in combination with involuntary cough [Citation24]. Despite this, the contribution of cough in producing aerosols containing SARS-CoV-2 remains poorly studied. To begin investigating this knowledge gap in the transmission of COVID-19, we studied the presence of SARS-CoV-2 RNA and active virus in cough aerosols from COVID-19 patients and in their hospital rooms.
Materials and methods
Environmental and patient sampling
Patient rooms measured 20 m2 and had either 4 or 12 air-changes-per-hour (Sup. Table 1). Each room had a capacity for two occupants and were connected to the ward corridor by an anteroom measuring 4.4 m2 (Sup. Table 1). A layout of the ward is presented in (Sup. Figure 1). Environmental samples were collected from 21 patient rooms and their adjoining anterooms. Room air was collected for 15 min once-a-day on the THOR electrostatic air sampler [Citation25]. Air samples were eluted in 0.5 mL of PBS containing 0.05% Tween-80 (PBS-T80) (Sigma, St. Louis, MO). The collection procedure for this device has been previously described [Citation13]. For surface sampling, a MS Mini DNA/RNA buccal swab (Isohelix, Cell Projects, Harrietsham, UK) was used on the surface of interest, stored in 3 mL eNat® preservation buffer (COPAN) and stored at −80 °C. Swabs were collected from the surface of the air exhaust vent, the patient bed rail, the floor immediately in front of the patient, and the floor in the anteroom. The total surface area sampled at each location was ∼90 cm2 for air exhaust vents, ∼100 cm2 for bed rails and ∼625 cm2 for the floor. This procedure has also been previously described [Citation13].
After room air sampling, THOR was disinfected with 70% ethanol and a fresh collector piece mounted onto the device. THOR was arranged on a tripod at 1 m height from the ground and placed approximately 0.5 m in front of the patient, who was asked to cough towards the device. The patient was asked to produce three deep coughs followed by 30 s of rest. This step was repeated three times. Cough sampling took approximately 3 min to complete. Patient cough and room air were sampled every day for a maximum of three consecutive days. Room air was sampled first to reduce the risk of patient cough samples from being contaminated by pre-existing SARS-CoV-2 in room air. Surface samples were only taken on the first day of sampling when the patient was enrolled in the study. A combined nose-throat swab (NTS) was taken from each patient on the first day of sampling and preserved in 500 µL of PBS-T80 for subsequent RNA analysis.
Ethics statement
This study was conducted according to good clinical and scientific practices and following the ethical principles of the Declaration of Helsinki. Collection of patient samples and patient data were approved by the Swedish Ethical Review Authority under study protocol Dnr 2022-04426-02. Study participants provided written informed consent prior to study initiation. Participation was voluntary.
RNA extraction and RT-qPCR on heat-inactivated samples
Surface, air, cough and NTS samples were heat-inactivated and RNA extraction was performed using the Zymo Quick-DNA/RNA™ Viral MagBead kit (Zymo Research, Irvine, CA), as previously described [Citation13]. Hid-RT-PCR [Citation26], was performed on extracted samples using 12 µL of sample as template, as previously described [Citation13].
Quantification of SARS-CoV-2 infectious particles
Plaque-forming unit (PFU) assays from qPCR-positive air samples and cough were done as previously described [Citation13] and with additional clarifications [Citation27]. Briefly, serial dilutions of samples were added to Vero E6 cells for 1 h at 37 °C followed by removal of the inoculum media and two washes with PBS. Overlay medium consisting of two parts 2% carboxymethylcellulose (CMC, Sigma, St. Louis, MO) and three parts DMEM supplemented with 5% FBS (Sigma, St. Louis, MO), 100 units/mL penicillin (Cytiva, Marlborough, MA), 100 µg/mL streptomycin (Cytiva, Marlborough, MA) and 10 µg/mL amphotericin B (Sigma, St. Louis, MO), was added to the plates. The plates were incubated at 37 °C for three days. After three days plates were assessed by light microscopy for cytopathic effects in line with viral-induced plaque formation. PFUs were quantified and their locations marked. PFUs were further analyzed for SARS-CoV-2 RNA and protein as described below.
RT-qPCR for SARS-CoV-2 from PFUs
For confirmation of SARS-CoV-2 content from PFUs, an aliquot from each plaque was picked and added to 300 µL of QIAzol (Qiagen, Hilden, Germany). RNA was extracted as per manufacturer’s instructions, eluted in 20 µL of nuclease-free water, diluted 1:10 with nuclease-free water and analyzed by hid-RT-PCR for SARS-CoV-2.
Immunostaining for SARS-CoV-2 from PFUs
After picking of the PFU content for PCR analysis, the plates were fixed with 4% paraformaldehyde for 20 min, permeabilized with PBS 0.1% Triton-X100 (Sigma, St. Louis, MO) for 15 min, blocked with PBS containing 4% FBS for 30 min, then incubated overnight at 4 °C with primary mouse anti-SARS-CoV-2 nucleocapsid 1 (MA1-7404, Thermo Fisher Scientific Co., Waltham, MA) in PBS containing 1% FBS. Wells were then washed three times with PBS and incubated with rabbit anti-mouse Alexa Fluor 555 (ab150118, Abcam, Cambridge, UK) for 30 min at 37 °C. Nuclei were counterstained with Hoechst (Invitrogen, Carlsbad, CA). Antibodies were diluted in PBS containing 1% FBS. The presence of SARS-CoV-2 in PFUs was assessed by confocal microscopy on a Zeiss LSM 900-airy (Carl Zeiss AG, Oberkochen, Germany).
Statistical analyses
Graphical representations of data and statistical testing were performed using GraphPad Prism version 10.0.3 for MacOS (GraphPad Software Inc., La Jolla, CA).
Results
Detection of SARS-CoV-2 RNA in cough from COVID-19 patients
The presence of SARS-CoV-2 RNA in cough was studied in COVID-19 patients. A total of 25 individuals were enrolled from the infectious disease ward of Karolinska University Hospital Huddinge, Stockholm, Sweden. Sampling took place between 28 April 2021 and 11 June 2021. The study participants were all symptomatic, well into their second week of disease, and mostly middle-aged men (). They were asked to produce three repetitions of three deep coughs followed by 30 s of regular breathing, while aerosols were sampled on the electrostatic air sampler THOR [Citation25]. Twenty-two of the 25 patients were able to produce cough. Eight of these individuals were sampled once (36%), nine sampled twice (41%) and five sampled three times (23%) on consecutive days. Following molecular analysis by RT-PCR, SARS-CoV-2 RNA was detected in about half of all the aerosol samples collected (19/37, 51%) (), demonstrating a molecular signature for the virus in the cough of COVID-19 patients. The median Ct value for cough samples was 37.06 and comparable to the median Ct of 37.34 from NTS samples taken from the patients on the first day of sampling (). Interestingly, only about half of the NTS samples were positive for SARS-CoV-2 by RT-PCR (13/25, 52%) (). Pearson’s correlation testing did not reveal a statistical association between Ct values from NTS with SARS-CoV-2 levels in cough (p = .659). Therefore, low, or absent detection of virus in the nasal and/or oral cavity does not immediately annul the possibility of finding the virus in cough.
Figure 1. Detection of SARS-CoV-2 in patient cough aerosols and patient NTS. Cough aerosol samples were collected from 22 patients up to three consecutive days. A nose-throat swab (NTS) was collected from each patient on the day of their enrollment into the study. Cough and NTS were analyzed by hid-RT-PCR. (A) Percentage of positive samples. (B) Ct distribution of all samples collected. Circles represent individual samples. Median Ct values are 37.06 (cough) and 37.34 (NTS).
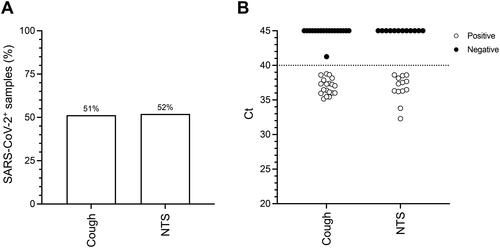
Figure 2. Active SARS-CoV-2 viral particles in patient cough aerosols. Patient cough samples were serial diluted and used to infect Vero E6 cells to isolate active viral particles. Infected Vero E6 were stained for SARS-CoV-2 nucleocapsid protein 1 (N1, yellow) and for nucleic acid (Hoechst, blue), and then analyzed by confocal microscopy. Representative immunofluorescence images of SARS-CoV-2negative PFU (A) and SARS-CoV-2+ PFUs (D–F) obtained from cough samples, as well as lab strain SARS-CoV-2 PFU as control (B). The same plates were then stained with 1% Crystal Violet and images were taken for PFU morphology comparison. Representative brightfield images of SARS-CoV-2+ PFU (G–I) obtained from cough samples, as well as lab strain SARS-CoV-2 PFU as control (C). Scale bar = 200 µm.
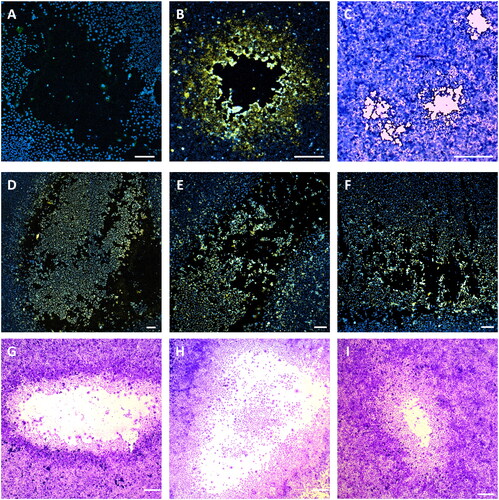
Table 1. Characteristics of COVID-19 patients (n = 25) occupying rooms at the time of environmental sampling.
SARS-CoV-2 in cough aerosols are infectious
We next sought to determine the presence of active viral particles in cough aerosols and patient room air. To this effect, using our previously published protocol [Citation27], Vero E6 cells were inoculated with SARS-CoV-2 PCR-positive cough samples or room-air samples, and examined three days later for plaque forming units (PFUs). The presence of SARS-CoV-2 in PFUs was then analyzed by hid-RT-PCR, and the expression of SARS-CoV-2 N1 protein by confocal microscopy. Most PCR-positive cough samples generated PFUs. Viral N1 was visualized in about one quarter of all PFUs (). The remaining three quarters of PFUs were negative for SARS-CoV-2 (), which could suggest the presence of other plaque-forming viruses in patient cough. PFUs from patient cough had larger areas of cell disruption () and more diffuse N1 staining (F)) compared to PFUs generated during control infections in vitro with our laboratory Wuhan strain [Citation28] (). The latter also produced high expression of N1 in the immediate perimeter of the disrupted monolayer ().
Figure 3. Distribution of SARS-CoV-2 in air and surface samples from COVID-19 patient rooms. Air and surface samples were collected from patient rooms, and adjoining anterooms and tested for the presence of SARS-CoV-2 RNA by hid-RT-PCR. (A) Percentage of positive samples across different sample types. (B) Ct distribution of all samples collected. Circles represent individual samples. Median Ct values for patient room locations are 36.88 (room air), 37.34 (air exhaust vent), 37.72 (bed rail) and 34.66 (floor). Median Ct values for anteroom locations are 36.82 (room air), 36.93 (air exhaust vent) and 35.99 (floor).
Our plaque assay identified a total of 763 PFUs from cough samples. Of the 763 PFUs, 212 (28%) were confirmed to be SARS-CoV-2 PFUs by imaging and 468 (61%) by RT-PCR (). Of the PFUs confirmed to be of SARS-CoV-2 origin, 168 PFUs were detected by both imaging and RT-PCR, 44 PFUs by imaging only and 300 PFUs by RT-PCR only. The median number and median concentration of SARS-CoV-2 PFUs recovered from each cough sample were 24 PFU and 60 PFU/mL, respectively (). Furthermore, a total of 684 PFUs were recovered from the air of COVID-19 patient rooms (). Of these, 104 PFUs (15%) were confirmed to be SARS-CoV-2 by imaging and 552 PFUs (81%) by RT-PCR. Of the SARS-CoV-2 confirmed PFUs, 64 PFUs were detected by both methods, 40 by imaging only, and 488 by RT-PCR only. Both detection methods yielded the same median number of SARS-CoV-2 PFUs (24 PFUs) and the same median concentration (60 PFU/mL) (). These numbers are similar to our prior quantification of SARS-CoV-2 from the environment after electrostatic air sampling [Citation13].
Table 2. Detection of infectious SARS-CoV-2 particles in patient’s cough.
COVID-19 patients shed SARS-CoV-2 into their immediate environment
In each patient room, surface swabs were taken from the exhaust vent, the floor beside the bed, and the bed rail. Surface swabs were also taken from the exhaust vent and the floor of the anteroom. Air from patient rooms and anterooms was collected for 15 min on THOR. Room air was sampled for a maximum of three consecutive days, always before cough sampling, while surface swabs were collected on the first day of cough sampling only. The highest positive returns per sample for SARS-CoV-2 RNA by hid-RT-PCR were observed from floors in patient rooms (21/26, 81%) and in anterooms (17/20, 85%) (). Contamination with SARS-CoV-2 RNA was also detected on exhaust vents in patient rooms (6/20, 30%) and anterooms (10/20, 50%), and from the bed rails in patient rooms (9/25, 44%) (). Roughly half of the air samples collected from patient rooms (21/38, 55%) and anterooms (16/31, 52%) also returned positive for the virus (). Pearson’s correlation testing did not reveal statistical association between Ct values in cough with room air (Sup. Figure 2). Detection in room air was lower than for floors but higher than for both exhaust vents and bed rails. Median Ct values for patient room locations were 36.88 (air), 37.34 (exhaust vents) and 37.72 (bed rails) and for anterooms 36.82 (air), 36.93 (exhaust vent) and 34.66 (floor) (). Returns for exhaust vents in both locations, and for the floor in the anteroom represent the proportion of contamination in these surfaces. Since floor and bed rails in patient rooms are tied to each participant, the frequency of contamination per room was (18/21, 86%) and (9/21, 43%), respectively, very similar to the frequency per sample (). The overall frequencies of PCR-positive returns for floor and air per sample, are in line with our previous results from similar sampling carried out during December 2020 to February 2021 in the infectious disease ward of Uppsala University Hospital [Citation13].
Table 3. Detection of infectious SARS-CoV-2 particles in patient’s room air.
Of the 22 COVID-19 patients that produced cough aerosols in our study, 16 patients (67%) had at least one cough sample that was positive for SARS-CoV-2 RNA (). Of these 16 patients, nine (56%) also had active SARS-CoV-2 confirmed by imaging and 11 (69%) by RT-PCR (). Moreover, of the 21 patient rooms investigated, 14 rooms (67%) were positive at least once for airborne SARS-CoV-2 RNA (), with four (29%) having active SARS-CoV-2 confirmed by imaging and 14 (100%) by RT-PCR. Combined, these observations suggest that molecular detection of SARS-CoV-2 in indoor air and patient cough is accompanied by the presence of activeSARS-CoV-2.
Table 4. Detection of SARS-CoV-2 positivity by PCR and plaque assay.
Discussion
The aerosolization of SARS-CoV-2 by humans is incompletely understood. We detected SARS-CoV-2 in aerosols from voluntary cough produced by hospitalized, Swedish COVID-19 patients well into their second week of disease. SARS-CoV-2 was detected in cough and room air by RT-PCR. SARS-CoV-2 RNA has been reported in exhaled breath [Citation18,Citation29,Citation30] and during talking and/or singing [Citation19,Citation30,Citation31]. We demonstrate infectious SARS-CoV-2 in cough and room air by PFU assays and confocal imaging, corroborating virus RNA detection with infection potential. Our results support the introduction of SARS-CoV-2 into air after a short episode of coughing and identify inhalation as a risk during contact with infected persons performing this expiratory maneuver.
In experimental aerosols, SARS-CoV-2 infectiousness rapidly declines 5 min after aerosolization [Citation32]. If aerosolized in artificial saliva and conditions of high relative humidity, the virus retains infectiousness for much longer, declining only about 50% in infectiousness after 3 h [Citation33]. So, it is possible that the aerosols produced by our patients may render their environment infectious for an extensive amount of time. Thus, these patients should remain in isolation. Mechanical ventilation in patient rooms and the use of respiratory protection by healthcare workers attending these patients are also important safeguards against occupational exposure, as per routines in the infectious disease ward of this study. Although we did not attempt to isolate active virus from anterooms, the frequency of RNA detection was the same as in the patient rooms where active virus was confirmed. Since the healthcare professionals in this ward don personal protective equipment in the anteroom, it may be important to consider gowning protective gear prior to entering the anteroom.
We used an established quantitative RT-PCR that targets SARS-CoV-2 N1 to detect the virus [Citation26]. It was originally developed as an extraction-free, diagnostic PCR for patient swabs. We used it here with additional sample types. We also used extracted RNA as template since it increases the sensitivity of detection. However, template may be lost during extraction, especially in samples with low, starting viral content. Indeed, our patients were well into their second week of disease. Put together, it is not surprising that some NTS samples were PCR-negative and Ct values for PCR-positive NTS high. Our PCR returns could be underestimating the frequency of positives returns in our cohort.
Experimental challenge in young adults shows that active SARS-CoV-2 disappears around day 12 in the nose and throat, and virus RNA around day 14 after challenge [Citation34]. These infections were (understandably) performed using a very low dose of virus [Citation34]. Challenge with a higher inoculum could probably extend viral shedding. How viral load from this experimental infection relates to detection of virus in aerosol is unknown. In our cohort, PCR-positive returns from patient cough had a median Ct value of 37.06, close to the median Ct of 37.34 in patient NTS taken at the time of cough sampling. Pearson’s correlation testing did not reveal statistical association between Ct values in cough with NTS (p = .659). It would have been interesting to know where our NTS values stand in relation to the timeline of viral shedding from the challenged individuals in [Citation34].
Also, Pearson’s correlation testing did not reveal statistical association between Ct values in cough with room air (p = .587), between cough with bed rail (p = .192), floor (p = .238) or exhaust vent (p = .499). Overall Ct values were high, but this is expected from environmental samples. Our Ct values are also in line with Ct returns from a similar collection done in Uppsala University Hospital [Citation13]. An interesting difference between these two studies was the almost threefold lower frequency for PCR-positive returns from the exhaust vents from the clinical site in Stockholm compared to Uppsala [Citation13]. Differences in ventilation may provide some explanation for this. Patient rooms in Stockholm have about 2–6 times higher air-changes-per-hour than in Uppsala, which may prevent virus from landing on no-touch surfaces.
Our electrostatic air sampler inactivates SARS-CoV-2 [Citation13], so the PFU counts that we report here are verily underestimated. The number of PFUs detected from patient cough and the air in their rooms was similar to those obtained from the air in rooms occupied by COVID-19 patients in the infectious disease ward in Uppsala, where the same electrostatic collector was used [Citation13]. PFUs recorded from aerosols were different in size and shape from PFUs generated with a control Wuhan strain of the virus. It has been shown that some mutations to the virus result in different plaque size and morphology [Citation35,Citation36]. This effect is more pronounced when comparing different strains [Citation36]. For instance, the Delta strain has been shown to produce much larger plaques than the original Wuhan strain [Citation37]. In addition, SARS-CoV-2 isolated from clinical samples has yielded both PFUs of variable size and of different appearance [Citation10]. Some of our recorded PFUs were negative for SARS-CoV-2. This was more pronounced when detection was done by imaging, which is less sensitive than RT-PCR. Regarding PCR-based confirmation of the virus, the harvest method may not have successfully picked material with viral RNA in all the cases. A more likely explanation is that some plaques were indeed not formed by SARS-CoV-2, but by other virus(es) in the environment.
It was not our intention to investigate changes in viral contamination in patient rooms or in viral load in patient cough over time. That would require a larger and longitudinal study, with repeated sampling of surfaces, room air and patients. We did sample cough and room air over three consecutive days in our study. The main reason for doing this was to increase the probability of virus detection. Pathogen air sampling is a challenge because of the expected low-copy number of the microorganism in air, and due to the experimental nature of air sampling itself.
Our air sampler uses electrostatics in an open-air environment to collect aerosol particles [Citation25]. Thus, our sampling protocol was designed to mitigate cross contamination between cough and environmental samples. Room air was sampled first to reduce the risk of contaminating patient cough with room air. In laboratory experiments, our air sampler precipitates airborne particles at 100 Lair/min [Citation25]. This, together with the high air-changes-per-hour in the patient’s room, further negates the risk of above contamination. The duration of cough sampling was also short (3 min, five times shorter than for room air) and it was done close to the patient (0.5 m). It is therefore very unlikely that patient cough in our study was contaminated by pre-existing SARS-CoV-2 in the air.
This study did not investigate recovery of SARS-CoV-2 from exhaled breath or involuntary cough. A recent study reports viral load released during breathing, talking and singing, with highest recovery detected after singing [Citation19]. We considered it excessive to request additional expiratory maneuvers from our hospitalized cohort, since they had already been asked to produce cough multiple times. To investigate viral shedding from involuntary cough or sneezing would require air sampling during natural breathing, where cough and sneeze can be recorded as metadata to the collection. This has previously been done for influenza, where spontaneous cough has been shown to be a predictor of virus shedding [Citation38]. Larger cohorts and longer air sampling intervals (≥30 min) would be needed to investigate the contribution of involuntary cough in aerosolizing SARS-CoV-2.
Supplemental Material
Download PDF (475.6 KB)Acknowledgements
We thank Pontus Nauclér (Karolinska Institutet) for helping us realize the study, Region Stockholm and the staff at the infectious disease clinic at Karolinska University Hospital Huddinge, for facilitating sample collection. Confocal microscopy was done at Biomedicum Imaging Core Facility (BIC), Karolinska Institutet. Work with active SARS-CoV-2 was performed at the BSL3 Biomedicum Core Facility, Karolinska Institutet.
Disclosure statement
No potential conflict of interest was reported by the author(s).
Additional information
Funding
References
- WHO. Coronavirus (COVID-19) dashboard; 2023 [cited 2023 Oct 16]. Available from: https://covid19.who.int/
- WHO. Infection prevention and control of epidemic- and pandemic-prone acute respiratory infections in health care. Geneva; 2014 [cited 2023 Nov 1]. Available from: https://iris.who.int/handle/10665/112656
- WHO. Transmission-based precautions for the prevention and control of infections: aide-memoire; 2022 [cited 2023 Nov 1]. Available from: https://www.who.int/publications/i/item/WHO-UHL-IHS-IPC-2022.2
- Li Y. Basic routes of transmission of respiratory pathogens – a new proposal for transmission categorization based on respiratory spray, inhalation, and touch. Indoor Air. 2021;31(1):3–6. doi: 10.1111/ina.12786.
- Li Y. The respiratory infection inhalation route continuum. Indoor Air. 2021;31(2):279–281. doi: 10.1111/ina.12806.
- WHO. Coronavirus disease (COVID-19): how is it transmitted? 2023 [cited 2023 Nov 1]. Available from: https://www.who.int/news-room/questions-and-answers/item/coronavirus-disease-covid-19-how-is-it-transmitted
- CDC. How coronavirus spreads; 2023 [cited 2023 Nov 1]. Available from: https://www.cdc.gov/coronavirus/2019-ncov/prevent-getting-sick/how-covid-spreads.html
- Public Health Agency of Canada. COVID-19: prevention and risks; 2023 [cited 2023 Nov 1]. Available from: https://www.canada.ca/en/public-health/services/diseases/2019-novel-coronavirus-infection/prevention-risks.html#h
- Public Health Agency of Sweden. FAQ about COVID-19; 2023 [cited 2023 Nov 1]. Available from: https://www.folkhalsomyndigheten.se/the-public-health-agency-of-sweden/communicable-disease-control/covid-19/covid-19-faq/
- Lin YC, Malott RJ, Ward L, et al. Detection and quantification of infectious severe acute respiratory coronavirus-2 in diverse clinical and environmental samples. Sci Rep. 2022;12(1):5418. doi: 10.1038/s41598-022-09218-5.
- Stern RA, Charness ME, Gupta K, et al. Concordance of SARS-CoV-2 RNA in aerosols from a nurses station and in nurses and patients during a hospital ward outbreak. JAMA Netw Open. 2022;5(6):e2216176. doi: 10.1001/jamanetworkopen.2022.16176.
- Otter JA, Zhou J, Price JR, et al. SARS-CoV-2 surface and air contamination in an acute healthcare setting during the first and second pandemic waves. J Hosp Infect. 2023;132:36–45. doi: 10.1016/j.jhin.2022.11.005.
- Rufino de Sousa N, Steponaviciute L, Margerie L, et al. Detection and isolation of airborne SARS‐CoV‐2 in a hospital setting. Indoor Air. 2022;32(3):e13023. doi: 10.1111/ina.13023.
- Nannu Shankar S, Witanachchi CT, Morea AF, et al. SARS-CoV-2 in residential rooms of two self-isolating persons with COVID-19. J Aerosol Sci. 2022;159:105870. doi: 10.1016/j.jaerosci.2021.105870.
- Lednicky JA, Lauzard M, Fan ZH, et al. Viable SARS-CoV-2 in the air of a hospital room with COVID-19 patients. Int J Infect Dis. 2020;100:476–482. doi: 10.1016/j.ijid.2020.09.025.
- Santarpia JL, Rivera DN, Herrera VL, et al. Aerosol and surface contamination of SARS-CoV-2 observed in quarantine and isolation care. Sci Rep. 2020;10(1):12732. doi: 10.1038/s41598-020-69286-3.
- Chia PY, Coleman KK, Tan YK, et al. Detection of air and surface contamination by SARS-CoV-2 in hospital rooms of infected patients. Nat Commun. 2020;11(1):2800. doi: 10.1038/s41467-020-16670-2.
- Adenaiye OO, Lai J, Bueno de Mesquita PJ, et al. Infectious severe acute respiratory syndrome coronavirus 2 (SARS-CoV-2) in exhaled aerosols and efficacy of masks during early mild infection. Clin Infect Dis. 2022;75(1):e241–e248. doi: 10.1093/cid/ciab797.
- Alsved M, Nyström K, Thuresson S, et al. Infectivity of exhaled SARS-CoV-2 aerosols is sufficient to transmit covid-19 within minutes. Sci Rep. 2023;13(1):21245. doi: 10.1038/s41598-023-47829-8.
- Leung NHL, Chu DKW, Shiu EYC, et al. Respiratory virus shedding in exhaled breath and efficacy of face masks. Nat Med. 2020;26(5):676–680. doi: 10.1038/s41591-020-0843-2.
- Lindsley WG, Blachere FM, Beezhold DH, et al. Viable influenza A virus in airborne particles expelled during coughs versus exhalations. Influenza Other Respir Virus. 2016;10(5):404–413. doi: 10.1111/irv.12390.
- Lindsley WG, Blachere FM, Thewlis RE, et al. Measurements of airborne influenza virus in aerosol particles from human coughs. PLOS One. 2010;5(11):e15100. doi: 10.1371/journal.pone.0015100.
- Lindsley WG, Noti JD, Blachere FM, et al. Viable influenza A virus in airborne particles from human coughs. J Occup Environ Hyg. 2015;12(2):107–113. doi: 10.1080/15459624.2014.973113.
- Milton DK, Fabian MP, Cowling BJ, et al. Influenza virus aerosols in human exhaled breath: particle size, culturability, and effect of surgical masks. PLoS Pathog. 2013;9(3):e1003205. doi: 10.1371/journal.ppat.1003205.
- Rufino de Sousa N, Sandström N, Shen L, et al. A fieldable electrostatic air sampler enabling tuberculosis detection in bioaerosols. Tuberculosis. 2020;120:101896. doi: 10.1016/j.tube.2019.101896.
- Smyrlaki I, Ekman M, Lentini A, et al. Massive and rapid COVID-19 testing is feasible by extraction-free SARS-CoV-2 RT-PCR. Nat Commun. 2020;11(1):4812. doi: 10.1038/s41467-020-18611-5.
- Rufino de Sousa N, Steponaviciute L, Margerie L, et al. Plaque-forming units from air samples: Letter to Editor. Re: Jefferson et al., Indoor Air, 2022. Indoor Air. 2022;32(11):e13169. doi: 10.1111/ina.13169.
- Lentini A, Papanicolaou N, Reinius B. Whole genome sequencing of in vitro propagated SARS-CoV-2 at the Karolinska Institutet BSL-3 Core Facility. Zenodo; 2021. 10.5281/zenodo.4722501
- Johnson TJ, Nishida RT, Sonpar AP, et al. Viral load of SARS-CoV-2 in droplets and bioaerosols directly captured during breathing, speaking and coughing. Sci Rep. 2022;12(1):3484. doi: 10.1038/s41598-022-07301-5.
- Coleman KK, Tay DJW, Tan KS, et al. Viral load of severe acute respiratory syndrome coronavirus 2 (SARS-CoV-2) in respiratory aerosols emitted by patients with coronavirus disease 2019 (COVID-19) while breathing, talking, and singing. Clin Infect Dis. 2022;74(10):1722–1728. doi: 10.1093/cid/ciab691.
- Alsved M, Nygren D, Thuresson S, et al. Size distribution of exhaled aerosol particles containing SARS-CoV-2 RNA. Infect Dis. 2023;55(2):158–163. doi: 10.1080/23744235.2022.2140822.
- Oswin HP, Haddrell AE, Otero-Fernandez M, et al. The dynamics of SARS-CoV-2 infectivity with changes in aerosol microenvironment. Proc Natl Acad Sci U S A. 2022;119(27):e2200109119. doi: 10.1073/pnas.2200109119.
- Smither SJ, Eastaugh LS, Findlay JS, et al. Experimental aerosol survival of SARS-CoV-2 in artificial saliva and tissue culture media at medium and high humidity. Emerg Microbes Infect. 2020;9(1):1415–1417. doi: 10.1080/22221751.2020.1777906.
- Killingley B, Mann AJ, Kalinova M, et al. Safety, tolerability and viral kinetics during SARS-CoV-2 human challenge in young adults. Nat Med. 2022;28(5):1031–1041. doi: 10.1038/s41591-022-01780-9.
- Goldswain H, Dong X, Penrice-Randal R, et al. The P323L substitution in the SARS-CoV-2 polymerase (NSP12) confers a selective advantage during infection. Genome Biol. 2023;24(1):47. doi: 10.1186/s13059-023-02881-5.
- Liu Y, Liu J, Johnson BA, et al. Delta spike P681R mutation enhances SARS-CoV-2 fitness over Alpha variant. Cell Rep. 2022;39(7):110829. doi: 10.1016/j.celrep.2022.110829.
- Khandelwal N, Chander Y, Kumar R, et al. Studies on growth characteristics and cross-neutralization of wild-type and delta SARS-CoV-2 from Hisar (India). Front Cell Infect Microbiol. 2021;11:771524. doi: 10.3389/fcimb.2021.771524.
- Yan J, Grantham M, Pantelic J, et al. Infectious virus in exhaled breath of symptomatic seasonal influenza cases from a college community. Proc Natl Acad Sci U S A. 2018;115(5):1081–1086. doi: 10.1073/pnas.1716561115.