
Abstract
This article presents a comprehensive review of control loop performance assessments in the context of building HVAC controls. Few studies are available for assessing HVAC control loop performance using a single control quality factor. A control quality factor should be an objective and quantitative metric with simple-to-interpret criteria and should only use data available from the actual control system, such as the control output. The authors systematically reviewed 34 indices and the associated methods of evaluating control loop performance and cataloged the drawbacks and merits of the different indices. Most of these performance assessment indices are currently used in process control industry applications. There were 14 of the 34 indices selected for further review, due to their particular suitability for implementation in HVAC control loop performance assessment. Finally, the selected 14 indices are implemented for assessments of three regulatory control loops with proportional-integral controllers: a heating coil outlet air temperature control loop and variable air volume room air temperature control loop using simulated data from a dynamic Modelica model, and variable air volume room air temperature control loop in a heating mode from real field data. Based on the review and preliminary results, the Normalized Harris Index and exponentially weighted moving averages based index are proposed as potential candidates for control quality factor, and further investigation of the use of them in HVAC control loop performance assessment is recommended.
Introduction
HVAC systems are used to control environmental variables such as temperature and humidity in the built environment. Although some intelligent controllers (e.g., fuzzy logic controllers [Yen and Langari Citation1998] and pattern recognition adaptive controllers [Seem Citation1998]), have been developed over the past two decades, the most commonly used controller in HVAC applications remains the proportional-integral (PI) type (Seem Citation1998; Zhao et al. Citation2013). Indeed, 95% of industrial controllers are of the proportional-integral-derivative (PID) type even though in implementation, most loops are actually PI control (Astrom and Hägglund Citation1995). The PI/PID controller has proven to be simple to implement and sufficient for most HVAC applications. However, numerous studies have shown that, while the controllers may be effective in regulating the built environment, if poorly implemented, inefficient energy consumption often results (Barwig et al. Citation2002). Poorly performing control loops are not unique to the HVAC environment, but are a common issue across various industries, resulting in wasted energy, reduced occupant comfort, and excessive and unnecessary wear of actuators. In a 2000 Honeywell report (Edgar Citation2007), the author described the following statistics: of the 64% of controllers utilizing closed-loop feedback, 25% were rated as having excellent performance, 23% as acceptable, 34% as fair, and 16% as poor.
Cost and performance are always the biggest concerns in the HVAC industry, and for engineers installing and commissioning a system, time spent tuning control loops can significantly add to the overall expense. Controllers are conventionally shipped with default tuning parameters that are determined through manufacturers’ lab tests. Without retuning, those parameters could result in poor control performance since the actual HVAC systems will almost certainly have nonlinear and varying dynamics that are different from those existing at the manufacturers’ test facilities (Federspiel and Seem Citation1996). For example, loads for a given HVAC system will often vary with time due to different seasonal or job-schedule loads (summer versus winter and weekday versus weekend, for example). To better optimize performance, controller parameters should be adjusted to accommodate such major variations in the underlying process dynamics. At this time, the tuning procedure commonly used in the HVAC industry is highly labor-intensive and subject to human error as stated in ASHRAE Guideline 11 (ASHRAE Citation2009). As an alternative, auto-tuning (Astrom and Hägglund Citation1995) is emerging as a method for automating the tuning of control loops in HVAC applications (Dexter et al. Citation1990; Dexter and Haves Citation1989; Zhao et al. Citation2012). Unfortunately, the HVAC industry does not have standard and quantifiable methodologies to test and verify the state of tuning and the performance of systems operating under closed-loop control. Current methods include proprietary schemes and labor-intensive manual methods.
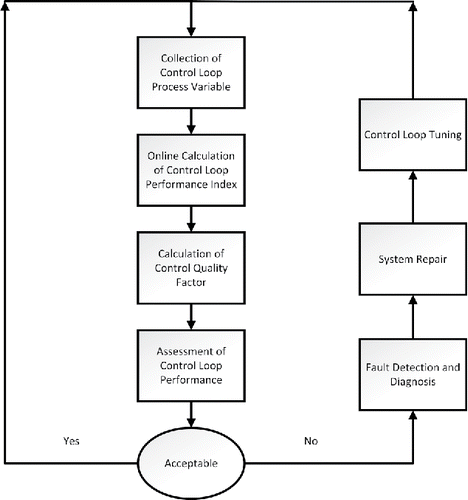
Control loop performance assessment (CLPA) is thus an important step to guarantee the efficiency of automation systems. It is also a key step for deciding if fault detection and diagnosis is necessary and if there is a need for subsequent tuning of control loops. A diagram of a typical procedure for the control loop performance monitoring is shown in .
The control performance assessment (CPA) has been an active topic for researchers and practitioners in the last three decades, especially in the process control industry. In late 1980s, Harris (Citation1989) introduced the Harris Index, which is based on minimum variance control (MVC) theory. Since then, the Harris Index has been widely used in the process control industry. Several commercially available packages (e.g., Honeywell's Loop Scout; Jämsä-Jounela et al. Citation2003) have used the Harris Index for CLPA, mainly in the process control loops. There have been some new CPA indices emerging in the process control industry in the last decade, especially in the refining and oil industries. However, algorithms behind those CPA indices are complicated and requiring significant computational resources, which may not be appropriate for applications such as HVAC closed-loop performance assessment. HVAC control loop assessment usually requires a simple and fast evaluation algorithm due to the limited on-board memory of most HVAC controllers. In addition, the current CPA indices from the process control industry do not generally give definite assessment scales or criteria, such as excellent, good, fair, bad, and fail. Some CPA indices only have the lower bound such as an Integral of Absolute Error index from Hägglund (Citation1995). In general, most existing CPA indices need a human in-the-loop to make the final assessment of control loop performance.
Furthermore, The HVAC industry does not have standard methodologies to verify that a control loop is tuned or is performing well. Descriptions of the state of tune of a control loop are often subjective. For example, ASHRAE Guideline 11 (ASHRAE Citation2009), field testing of HVAC control components, under PI loop tuning checkout, suggests the following:
Observe the results and note the time between oscillations, the number of oscillations, and the approximate amount of actuator movement with each oscillation. Continued oscillation, increasing amount of movement with each oscillation, or failure to move at all indicate need for tuning (pp. 31–32).
Procedures such as these can be highly labor intensive, and subject to human error and subjective interpretation. For example, the “time between oscillations” and “continued oscillation” are completely subjective.
In summary, there is a need for a comprehensive and systematic review of the state-of-art of CLPA to facilitate the development of an objective and quantitative index with simple-to-interpret criteria for HVAC applications, namely, the control quality factor (CQF). The purpose of this extensive literature review is to generate a reference list of information to HVAC closed-loop control performance measurement and evaluation methods that are objective and quantitative. The main focus of this research is an assessment of normal loop operation after recovering from a set-point change and/or a disturbance (e.g., load change).
The structure of this article is organized as follows:
Reviews of CPA methods: the advantages and disadvantages will be discussed for a total of 34 assessment indices from different categories.
Threshold of CPA indices: the authors are looking for the quantitative and simple-to-interpret criteria (for example, values from 0 to 100, with 0 being very poor and 100 being excellent), and a threshold for “excellent” (e.g., CQF > 90), “good,” “fair,” and “fail” control.
Case study with selected CPA indices for HVAC control loop assessment: 14 selected performance indices were calculated for simulated heat coil outlet air temperature control loop, simulated variable air volume (VAV) room air temperature control loop, and real VAV room air temperature control loop. Simulation data is from a dynamic Modelica model.
Discussions and conclusions: based on the CPA indices reviewed and the case study, the CPA indices with good potentials for HVAC CLPA are recommended for further investigations.
Reviews of CPA methods
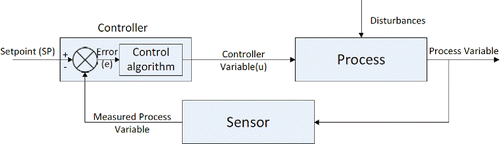
The assessment of closed-loop control performance has been an active study in the process control industry. A typical closed control loop is shown in . Most of HVAC control loop are actually stochastic regulatory control. The most popular regulatory HVAC control is feedback control, where the measured process variable (e.g., outlet air temperature for a water coil) is compared to a set-point. The error deviation will lead to a correction action (e.g., valve opening position) by the controller. The most common feedback controller in HVAC application is a PI controller (Seem Citation1998; Zhao et al. Citation2013), which is the focus of CLPA in this article. The regulatory control aims to reduce the variability with changing conditions. It will regulate the process to operate at a chosen set-point/reference and minimize effects of load disturbances. Because the uncertainty exists either in measurement or in the disturbances (e.g., load change), the control is essentially a stochastic control. In HVAC application, it is common to assume that disturbances are in a Gaussian distribution in a Bayesian probability theory context (Erickson et al. Citation2009; Ma et al. Citation2015).
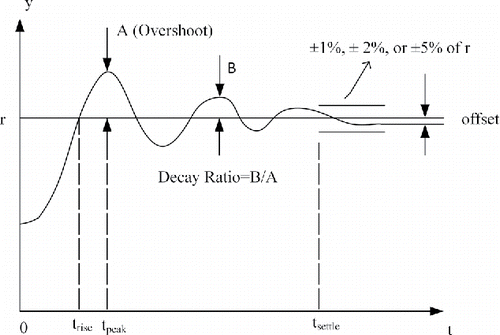
Limited performance assessment studies of P/PI controllers in HVAC industry are available, notably those by Johnson Controls (Seem and House Citation2009; Seem et al. Citation1999), Honeywell (Clarke et al. Citation2002), United Technologies Corporation/Carrier (Zhao et al. Citation2013), and others. In their work, Seborg et al. (Citation2006) illustrated a systematic method for assessing closed-loop performance by using time domain characteristics which included overshoot, decay ratio and setting time. Other methods for evaluating control loop performance included the use of error integral-based criteria (Lopez et al. Citation1967).
In the process control field, numerous assessment indices are available for use with feedback control loops. Shardt et al. (Citation2012) gave a systematic view on process control evaluations for regulatory control loops and supervisory control loops. Jelali (Citation2006) gave a comprehensive overview for the CPA benchmark methods applied in process control industry.
In this review, the authors focus on the extension of matured CPA methods to HVAC applications based on the wide availability of publications. Similar to the categories proposed by Shardt et al. (Citation2012), the authors selected 34 CPA indices as shown in . They are classified into the following categories: dynamic response, integral-based indices, correlation methods, frequency domain analysis, statistical methods, exponentially weighted moving average method, MVC benchmarks, and other methods. Given the challenges of HVAC control loops performance assessment for HVAC control loops, some indices in were selected for further testing using simulated data from a dynamic model and field data from a real building. The selected CPA indices are denoted by star (*) in . The key criteria for this selection are as follows.
Table 1 Summary of CPA indices reviewed.
Easily computation
Index should not require plant tests and require minimum specification of process dynamics. It only uses the data commonly stored and available in the HVAC local controller, for example, control loop output (y) and set-point (r). It should be suitable for on-line real-time computation in the same automation controller that is running the control loop being tested. Therefore, the performance of the control loop will be continuously monitored with the same hardware or test equipment. Controllers used in HVAC applications often have limited onboard memory, so the on-line computation will require a simple formula for the proposed CQF.
Objectivity and accuracy
The assessment scale spanning from excellent, good, fair, bad, and fail should be provided. Ideally, there is a need for a definitive threshold that indicates loop tuning acceptability. Then, this CQF can be used by specifiers to mandate a threshold on HVAC construction and commissioning projects.
Scalability
Performance shall evaluate loop control quality after a defined period of time following startup or a set-point change for a defined period of normal activity—the intent is to evaluate normal loop operation after a reasonable time to recover from a disturbance. It shall apply to all common HVAC processes such as supply air temperature control, duct static pressure control, airflow control, etc.
Dynamic response analysis
Dynamic response analysis, part of time domain analysis, is a fundamental approach for CPA. For dynamic response analyses of control loops, commonly used metrics include rise time, settling time, peak time, offset, and decay. These indices for dynamic response analysis are shown in (Brogan Citation1974). However, it is difficult to utilize these dynamic response indices as standardized indices (or benchmarks) due to the different inherent structures in different closed-loop systems. In addition, the goal of this study is to focus on evaluating control loop performance after its recovery from disturbances (or after the settling time). Therefore, dynamic response analysis will not be included in the scope of the proposed HVAC CLPA.
Integral based indices
Another group of time domain indices are integral based indices. This group of indices includes integral of the square error (ISE), integral of the absolute error (IAE), integral of square time derivative of the control input (ISTC), and integral of the absolute error multiplied by time (ITAE). Those indices all have a lower bound of zero, which in theory would indicate good control performance. However, they also have no upper bounds.
ISE
(1)
In ISE, errors with large values are weighted more heavily than the errors with smaller values. Large errors usually occur immediately following a disturbance and are seen in the form of overshoot or a sluggish response. The ISE is one of the most commonly used criteria to reduce overshoot. Zhou and Liu (Citation1998) presented an algorithm for an on-line self-tuning PI controller for controlling heating and cooling coils in an air-handler unit (AHU). They also analyzed the spectral distribution of the error as a function of P and I gains for a further validation. This index works well to detect the oscillation of the control loops during the dynamic response period.
IAE
(2)
Positive and negative contributions to error are treated as the same in this criterion. The IAE is often used for an on-line controller parameter adjustment. Hägglund (Citation1995) proposed an automatic approach based on IAE to determine if a control loop will oscillate with a load disturbance occurring frequently. Forsman and Stattin (Citation1999) proposed a new criterion for detecting oscillations in control loops using the IAE method, which can categorize the control loops into oscillation and very distinct oscillation. Thornhill and Hägglund (Citation1997) developed a modified IAE method with an off-line approach. The modified IAE method is appropriate for controllers with unknown integration times. However, it may not be so applicable to the proposed study, as HVAC control loops generally possess definite schedules for the integration time. Yu and Wang (Citation2012) obtained the lower bound for the IAE index for CLPAs of maintaining the water level in a water tank which was subject to input disturbance changes using both simulated and real data.
ITAE
(3)
ITAE heavily weights larger errors that occur late in time while less emphasis is placed on the initial error (usually large). A large ITAE will indicate a bigger control deviation. Zhao et al. (Citation2012) proposed a performance-based parameter tuning method for model-driven PID control systems based on ITAE criteria, which demonstrated good performance in set-point tracking and quick responses to disturbances.
ISTC
(4)
Oscillations of the control input u(t) can lead to mechanical failure of actuators and increased operating costs. The ISTC is an index used to evaluate the control input change. A larger ISTC will indicate an oscillating control signal, which can result in unnecessary wear of associated actuators and wasted energy. In contrast, a smaller ISTC correlates to smooth control signals, which may indicate reduced energy consumption and should prolong equipment life. Zheng (Citation2007) proposed the ISTC method in her PhD thesis. But this method does not consider the control output and unmeasured disturbances. In a control loop, the controller input, actuator, and plant will all influence the process outputs. An analysis of only the controller input could be biased, and may not cover all characteristics of the control system.
Correlation function analysis
The third group of time domain methods is correlation function-based analysis. There are three indices derived from correlation functions: the idle index (Hägglund Citation1999; Stanfelj et al. Citation1993), oscillation detection (Horch Citation1999), and the relative damping index (Howard and Cooper Citation2009, Citation2010).
Frequency domain analysis
Frequency domain analysis usually includes Nyquist plots, Bode plots, Nichols plots, phase margins, and gain margins (Shardt et al. Citation2012). Those methods all require mathematic models of the process, which are generally not available for most HVAC control loops. In addition, the plots generally require human-in-the-loop visualization to decide whether the control loop performances are acceptable or not, which is not feasible for online assessment of HVAC control loop performance.
Statistical methods
Statistical methods are typically simple in principle for CLPAs. Horch and Heiber (Citation2004) evaluated the simple performance indices for large data sets with respect to pulp mill control loops. They tested statistically based indices (mean of control error, standard deviation of control error, standard deviation of control outputs, etc.). Rice et al. (Citation2010) applied the standard variation index to assess control loop performance.
The simplicity of the statistically based CPA indices may indicate good potential for their use in HVAC CLPA.
Harris index
The most common control benchmark in the process control industry is based on MVC theory. The best achievable performance from MVC is compared with the actual control loop performance (Harris Citation1989). Actual performance from PI/PID controllers was comprehensively compared with those from corresponding MVC controllers (Underwood Citation2002). Due to large variations in the manipulated variables in MVC, a field-implementation of MVC is not always practical. However, it is commonly used as a benchmark for evaluating control loop performance. Initially, the MVC-based index could be only used in univariate control loops, but later it was improved into multi-input/multi-output (MIMO) control loops (Harris et al. Citation1996; Huang et al. Citation1997; Huang and Shah Citation2012; Ko and Edgar Citation2001; McNabb and Qin Citation2003). Another recent improvement for utilizing the MV benchmark is the generalized minimum variance (GMV; Grimble Citation2002; Huang and Shah Citation2012).
Normalized Harris index
Using a CLPA index based on MVC theory is popular in assessing controller performance (Harris et al. Citation1999; Harris Citation1989; Huang and Kadali Citation2008; Huang and Shah Citation2012; Ordys et al. Citation2007). It is built on the concept that a minimum variance controller will have a minimum variance of the output signal (Åström Citation2012). In other words, it is the lower bound that the control loop can reach, because the minimum variance can always exist in the format of random signals and unmeasured disturbances in real control loops. Harris (Citation1989) proposed an index called the Harris Index based on the MVC theory, which is defined as:
(5)
This index has a range in the interval [0, 1], where “0” indicates the worst performance and “1” indicates the best performance. For low-performing control loops, the variance of control outputs is much larger than the minimum variance, which leads this index close to zero. For control loops with the best performance, the variance of control outputs is equal to the minimum variance, which leads the index value to be 1. To estimate the minimum variance (σ2mv), only routine operating data and the time delay (d) are need and no extra experiments are required. However, sometimes, it could be challenged to obtain the time delay (d) in practice. Huang et al. (Citation1997) developed a filtering and correlation (FCOR) method by which they calculated the minimum variance (σ2mv) using the impulse response coefficients of the closed-loop transfer function fi, and the system time delay d:
(6) where σ2e is the variance of the residuals or white-noise, which is a disturbance term for the closed-loop transfer function. Unfortunately, using this approach (Huang et al. Citation1997) to calculate σ2mv for HVAC applications may not be straightforward and feasible, because it involves many matrix calculations.
There are many other methods to obtain the minimum variance. The classic approach is the auto-regression-moving-average (ARMA) fitting approach (Box and Jenkins Citation1976; Qin Citation1998). Another approach is the recursive least squares method (Desborough and Harris Citation1992; Hu Citation2013; Shah and Cluett Citation1991). More complicated algorithms include an iterative approach to get minimum variance as proposed by Ko and Edgar (Citation2004), a filter-based approach by Jain and Lakshminarayanan (Citation2005), a sum of squares programming approach by Sendjaja and Kariwala (Citation2009) and an iterative convex programming approach by Fu et al. (Citation2012). However, the simplest and most accurate approach of those is the recursive least squares method.
Qin (Citation1998) gave a systematic view of control performance monitoring using minimum variance principles with respect to the assessment of PID controllers. He proposed two schemes: The first scheme specified detailed steps to calculate the minimum variance from MVC theory; the second scheme provided a formula that uses an autocorrelation function to evaluate whether the controller achieves a minimum variance.
Hugo (Citation2006) pointed out the drawbacks of MVC controllers in three aspects.
MVC controllers maybe over aggressive due to the lack of detuning.
MVC controllers assume that the controllers are linear processes where all parameters are known.
MVC controllers need an ARMA model explicitly for the disturbance, while real controls always contain unknown disturbance models.
Generalized Harris index
An advanced MVC method, called the GMV method, was developed by Grimble (Citation2002). It is more flexible than MVC method and considers the control action penalization. Obtaining the minimum variance from GMV follows the same procedure as was used in MVC. The key, and challenging, step in utilizing GMV is determining the appropriate weighting functions. Guidelines for selecting weighting functions can be found in Grimble and Uduehi (Citation2001), and Grimble and Majecki (Citation2004). There are no known applications of GMV in the HVAC industry. Another drawback of the GMV index is that it requires both the control error (e(k) = y(k) − r(k)) and control signal u(k). This increases the complexity of the online calculation for the HVAC DDC controller.
CPA indices from the closed-loop identification
A powerful, yet computationally expensive approach is closed-loop system identification. System identification is implemented and the resulting transfer function can be used for control loop assessment. Salsbury (Citation2007) applied identification techniques to evaluate control loop performance, which can be used to detect oscillatory and sluggish control loops. He proposed two indices from the transfer function identified: the aggressive or oscillatory index, and the sluggishness index. Both are based on the second order transfer function parameters derived from the time domain system identification. The system is considered sluggish if the sluggish index is bigger than 1.
This method needs large computational resources to do system identification for obtaining the parameters in the second order transfer function and as such, is not an ideal choice for HVAC CLPA due to the limited resources available with HVAC DDC controllers, in particular, for online real time implementations.
CPA indices from the exponentially weighted moving averages (EWMA)
Another performance index used in the process control industry is EWMA (Hunter Citation1986; Prabhu and Edgar Citation2007; Zhang Citation2008). This index was developed in 1959. The fundamental approach for this idea is to obtain the current time sample through the last N samples. Hunter (Citation1986) gave an equation for calculating EWMA.
(7) where
is the EWMA value for some specific performance index X at time t, λ is the exponential smoothing constant, Xt − jδ is the value of performance index X at the past time t − jδ, δ is the sample time for the analog-to-digital converter, and λ(1 − λ)j is the exponential smoothing weighting factor, through which the contribution of X from past times decreases exponentially with the increasing index j.
A recursive formula is then applied to obtain the EWMA which needs the past value of EWMA:
(8)
EWMA has very strong capabilities in noise filtering. The exponential smoothing constant λ is very important in calculating the EWMA values of control outputs. An appropriate choice of λ is suggested in the next subsection.
Traditional EWMA-based index set
Seem and House (Citation2009) used the EWMA method to evaluate an AHU controller performance to detect controller faults. They suggested lower and upper bound values for the exponential smoothing constant (Seem et al. Citation1997):
(9) where the ts is the settling time for the controller.
Seem and House (Citation2009) also proposed several indices using the EWMA approach as the calculation engine. These indices used inputs from control errors, the absolute value of the control error, control outputs, the absolute value of the control input change, control input, duty cycle, and the number of starts, stops, and reversals. Selecting the appropriate smoothing constant remains a problem due to the unavailability of the settling time and sample time of the analog-to-digital converter.
Normalized EWMA-based index set
Salsbury and Alcala (Citation2015) proposed two normalized EWMA-based indices with respect to the three EWMA indices for HVAC applications. The three EWMA indices are given based on the control error of:
(10)
The first EWMA index is proposed based on the control error as:
(11)
The second EWMA index is proposed based on the absolute value of control error as:
(12)
The third EWMA index is proposed based on the error related to the time constant as:
(13) where ek is the error between the set-point and the process output. kis the sampling number, and Wis the effective number of samples applied in the EWMA calculation.
The two normalized indices are then given as:
(14)
(15) where the variable a is defined as:
(16) where Δt is the sample period and τa is the actual time constant of the closed-loop system.
The first normalized EWMA-based index works well for set-point tracking, while the second normalized EWMA based index is similar to the Harris index. However, the time constant is not readily available. Generally, a system identification approach can be used to obtain the actual time constant. Salsbury and Alcala (Citation2015) suggest using the integral time of a PI controller as a substitute for the time constant. However, the integral time of the PI controller may not be directly available for some HVAC DDC controllers. The controller output u(k) and the system identification may be needed for estimating the integral time. For the online real time implementation on the local DDC controller, this could require some extra memory.
Hurst index with detrended fluctuation analysis (DFA)
Srinivasan et al. (Citation2012) proposed a new CLPA method using DFA. The only required data are control output data collected during routine plant operation. DFA is one method used to compute the generalized Hurst exponent (Hu et al. Citation2001; Peng et al. Citation1992). Hu et al. (Citation2001) and Peng et al. (Citation1992) present a detailed method for how to use DFA. The DFA method involves polynomial curve fitting, and the order of polynomial is based on a trial and error approach. This Hurst index indicates a good control with a value close to zero and a bad control with a value close to one.
Table 2 Error band for VarBand (Li and O’Neill Citation2015).
Table 3 Summary of requirements/benefits of control benchmarking methods (Jelali Citation2006).
Variance Band (VarBand)
The VarBand index was proposed by Li and O'Neill (Citation2015). They discussed several indices for CLPA for various HVAC control loops using both simulation data and real data. The drawback of the VarBand index is that it requires the predefined error band for different control loops as shown in , which is based on domain knowledge and literature review. The definition of VarBand is shown below:
(17) where σ2b is the variance for the predefined error band and σ2y is the variance of the control outputs with respect to the set-point.
This index is based on the concept of comparisons between the allowed control error and actual output error. The exponential function is applied to normalize the index value to the range of [0, 1].
Jelali (Citation2006) gave a comprehensive comparison for the CPA benchmarks in terms of the advantages and drawbacks of many popular CPA methods (). From , it can be seen that MVC and GMVC based methods have a medium computational cost but have fewer input data requirements. Furthermore, they both have good benchmarks in control loops. The other methods listed in by Jelali (Citation2006), including historical benchmarking (HIS), extended horizon performance index (EHPI), linear quadratic Gaussian (LQG), optimal PID control (OPID), and restricted structure LQG (RS-LQG), were not selected for this detailed review because they either require too many computational resources or they have limited applications.
All of the above CPA methods reviewed in this article have some merits and drawbacks as well. However, they have not been widely applied in the HVAC industry although some studies are available from both industry (Boysen Citation2013) and academia (Underwood Citation2002; Zheng Citation2007; Zhou and Liu Citation1998). Moreover, there is a need to define the thresholds for these indices, which can be used to interpret the performance assessment results and/or set the tolerance for an acceptable tuning. Therefore, a review of threshold of the CPA indices is presented in the following section.
Threshold of CPA indices
One goal of this research is to find the bounded index with assessment scales and we are looking for the quantitative and simple-to-interpret criteria (for example, values from 0 to 100, with 0 being very poor and 100 being excellent), and a threshold for “excellent” (e.g., CQF > 90), “good,” “fair,” and “fail” control. The threshold of the available CPA indices provides some insight on how to determine the assessment scales for evaluation of the performance of HVAC control loops. The threshold values are defined as either the minimum/maximum values, or the optimal values, from the literature review with respect to their control loops. In this section, the selected indices with threshold values from the previous sections are further reviewed: Harris index, ISE, IAE, ITAE, ITSC, and EWMA. They are all widely applied in the process control industry but have limited implementations in HVAC applications. Although the current CPA indices from the process control industry are useful and instructive for the development of a CQF for HVAC applications, their scales or bounded values may not be appropriate for HVAC control loops performance assessment.
Normalized Harris index
Harris indices based on MVC methods have been widely applied for assessment of PID controller performance in the process control industry. Although there are issues related to MVC robustness, which is characterized by excessive input signals (Qin and Yu Citation2007), performance indices (e.g., the Harris index) based on MVC theory are still practical and have been widely adopted in various applications. Ko and Edgar (Citation2004) studied the performance for single-loop PID control. They developed an iterative approach to calculate the minimum variance for PID controllers in an existing control loop. They also demonstrated the advantage of their iterative method using a series of simulated examples. Their results shown that a Harris index value close to 1 corresponded to unhealthy control loops, while smaller values close to 0 reflected healthy control loops. However, they did not calculate the thresholds of scales for “excellent,” “good,” “fair,” and “fail” control loops.
ISE
Zhou and Liu (Citation1998) proposed a new algorithm for auto tuning by introducing the concept of ISE. They defined the maximum value of ISE to be 80 in the real AHUs test, under which the coil can reach a new set-point in 5 min in response to a 1°F (0.56°C) step change in the set-point. Their threshold for ISE was obtained based on experts’ experiences. The algorithm evaluated the heating and cooling coil controller performance by looking at the AHU supply air temperature and associated set-points. Their upper bounder value of ISE was set as 80. However, they did not give the lower bound value of ISE for their controllers, nor details on how to obtain the threshold values.
IAE
Ooi and Weyer (Citation2011) applied the IAE method to detect the oscillations of control loops for an irrigation system. Using the IAE, they identified the cause of oscillations of control loops on six irrigation pools where the disturbances only propagated from downstream pools to upstream pools using the decentralized distant downstream controller. In their tests, they did not give a lower/upper bound of IAE values or critical IAE values for a healthy control performance. They gave only an acceptable oscillation by defining an acceptable limit for IAE index:IAElim.
ITAE
Zhao et al. (Citation2012) proposed a performance-based parameter tuning method for model-driven PID (MD TDOF PID) control systems. The ITAE index was used to demonstrate advantages of the proposed method in a quick response to inputs and rejection of disturbances when compared to the TDOF CS MSP tuning method (Padhan and Majhi Citation2010) and the PT MD TDOF PID tuning method (Baba et al. Citation2003). Their cases are based on simulation cases for square wave signals. The ITAE values from their simulation control loops have large variations. Their results show the IT MD TDOF PID control loops perform better. However, they did not point out the minimum or maximum values of the ITAE index. They adopted the calculated ITAE as optimal values for control loop performance.
EWMA
Seem and House (Citation2009) applied the EWMA method to implement HVAC fault detections using a model-based method. Their fault detection method for AHUs was validated through 16 simulations which consisted of temperature sensor offset faults, stuck and leaking damper faults, and stuck and leaking valve faults. However, they did not give the maximum or minimum values of their EWMA index.
Salsbury and Alcala (Citation2015) proposed two normalized EWMA indices. They had the first index (EquationEquation 14(14) ) tested in a field test for control loops of VAV controlled zone temperature, VAV airflow and AHU static pressure. The first normalized EWMA index indicates a good control with index values close to 1, and a bad control with index values close to 0. They did not point out the upper bound and lower bound for the second normalized EWMA index (EquationEquation 15
(15) ).
In summary, HVAC applications will not follow exactly those threshold values reviewed above. Based on this literature review, we propose a CQF with assessment scales and will conduct a series of tests using data collected from HVAC control loops in real buildings. In addition, simulated data from models with known ground truth (i.e., whether the control loop performance is normal) will be included into the testing.
In the next section, the authors present case studies of a performance assessment of three HVAC control loop using 14 of the CPA indices that are being reviewed in this article. Both simulated data from dynamic Modelica models and field data from a real building are used for case studies.
Case study with selected CPA indices for HVAC control loops
Most HVAC controllers have limited on-board memory for controller implementation. Thus, the required CPA indices should be computationally simple yet accurate. Based on the literature review study for the CPA indices from process control loops, 14 indices were selected for this case study following the selection criteria stated in the section of “Review of CPA methods.” The indices to be benchmarked are shown in the .
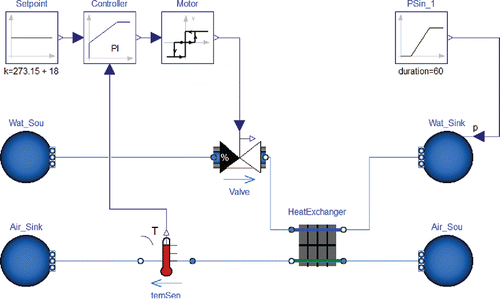
Table 4 PI controller settings.
Since the most popular HVAC contoller is a PI contoller, three PI control loops were assessed using the 14 selected indices:
Case 1: Simluated heating coil outlet air tempature control loop
Case 2: Simulated VAV room air tempeature control loop
Case 3: Real VAV room air tempeature control loop from a real building
Case 1: Modelica model of heating coil
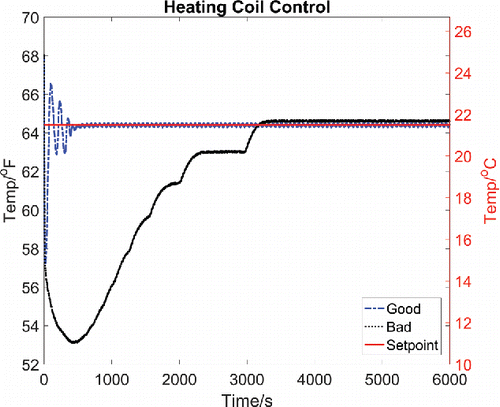
A dynamic heating coil model was developed using Modelica (Fritzson Citation2010) in the case study. The simulation environment is Dymola 2015 (Elmqvist et al. Citation1996) as shown in . The free open source LBNL Modelica building library (Wetter et al. Citation2014) is utilized for this case study due to its flexibility and capability for dynamic modeling of control components. The heating coil model is composed of a hot water loop, an air loop, a heat exchanger, a water valve, a motor, a temperature sensor, and a PI controller. In this study, the supply hot water temperature is 185°F (85°C) and the return hot water temperature is 149°F (65°C). The source air temperature is 41°F (5°C) and the sink air temperature is 70°F (21.1°C). The outlet air temperature is controlled at a set-point of 64.4°F (18°C) with a PI controller. lists the PI controller parameters for two cases of controlling outlet air temperature of the heating coil. These two control scenarios are chosen as “good” control and “bad” control. shows the simulated data used for the case study. For the good control scenario, the settling time is about 300 s. For the bad control scenario, the settling time is 3000 s. The time delay for both scenarios is estimated as 2 s using a system identification method.
Case 1: Test results for selected CPA indices
For this study, the authors evaluated the performance of this outlet air temperature control loop in a heating coil from t = 0 s to t = 3600 s. The test results of selected CPA indices for two scenarios (e.g., good control and bad control) are shown in . Although the ultimate goal of the current study is to evaluate the control loop performance after the settling time for a normal operation, the evaluation was included for the period from the initial state to the settling time (dynamic response period) to help better understand how the CPA indices will behave.
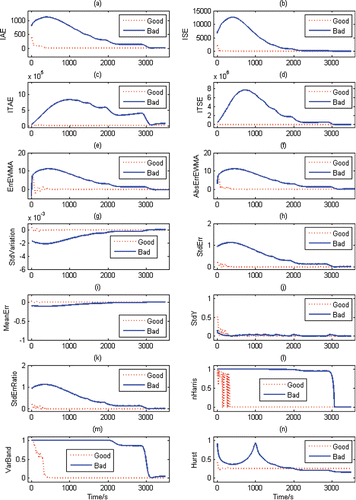
shows the CPA indices for an outlet air temperature control loop in a heating coil using the simulated data described previously. For the integral based indices (subplot [a–d]), the IAE, ISE, ITAE, ITSE all have very similar index curves. For the bad control scenario, these indices increase rapidly initially, decrease slowly later and finally stay close to the zero. For the good control scenario, these indices remain constant close to the zero. For an ideal control with perfect set-point tracking, the control errors will be zero, which leads the integral based indices to be exactly zero.
For the EWMA based indices (subplots [e–f]), we can see the EWMA of control error (ErrEWMA) is similar to the absolute value of EWMA of control error (AbsErrEWMA). They both increase with the control error increases and then decrease slowly with control error decreases. For oscillation intervals, the EWMA-based indices also demonstrate the oscillation values. Both indices are close to zero after the 500th s when the good control loop is stable.
Table 5 PI controller settings for VAV box control loops.
For the statistically based indices (subplots [g–k]), five indices are tested: standard variation (subplot [g]), standard deviation of control error (subplot [h]), standard deviation of process outputs (subplot [i]), mean of control errors (subplot [j]), and the ratio of standard deviation of error and standard deviation of outputs (subplot [k]). For the good control loop, the mean of the error is close to the zero, while for the bad control loop, the error mean is negative. Standard deviation of the error for the good control loop is close to the zero, and decreases gradually to the zero for the bad control loop. The ratio of standard deviation of the error and the standard deviation of outputs are similar to the standard deviation of error. The standard deviation of the process outputs does not so clearly distinguish between the “good” and “bad” control loops. The standard variation for the good control case remains close to zero, but the magnitude is small and in a scale of 10−3. The standard variation for the bad control case is negative initially and increases to close to zero.
For the MVC based index, it can be seen that the normalized Harris index is able to distinguish between the “good” and “bad” control loops. For the good control case, the Harris index has some fluctuations initially and then decreases to a value near to zero; subsequently, it remains constant. For the bad control case, the Harris index remain close to one and finally drops to zero at time t = 3000 s. Results are similar for the VarBand index. Nevertheless, the VarBand index did not show the fluctuations for the good control case during the initial stage (period of dynamic response stage).
The benchmarking results from the Hurst index (DFA based) are interesting, as the good control loop has index values close to the zero and the bad control loop has index values that vary, with a peak at around t = 1000 s. This occurs because the Hurst index relies on the curves of control errors, which are at peak at the time t = 1000 s. The control error curves lead to an increasing slope before the time of the peak control error and a decreasing curve slope afterward. This occurs as a result of the curve fitting
Case 2: Modelica model of VAV system
In order to test the CQFs behaviors for cases with load disturbances, the simulated data was used from VAV box control loops in a Modelica-based VAV systems model. A dynamic building model with a VAV system was developed using LBNL Modelica building library (Wetter et al. Citation2014). The building model has five interconnected rooms, which simulate a medium-sized office building in Chicago, Illinois. The details of each room model can be found in the DOE Commercial Building Benchmarks (Deru et al. Citation2011). The VAV system is composed of an economizer, an AHU with heating coil and cooling coil, a supply/return air path, and related control components. In each zone, the VAV box has a water reheat coil. For this study, the room cooling air temperature set-point is 75.2°F (24°C), and the room heating air temperature set-point is 68°F (20°C). lists the PI controller parameters for the room air temperature control loop of a VAV terminal box in heating and cooling modes, respectively. In the heating modes, the room air temperature is controlled by modulating the reheating coil valve. While in the cooling mode, the room air temperature is controlled by modulating the damper. The room occupation schedule is from 0700–1900. Two-day control data was collected only for the period when the rooms are occupied. Night-time data is not used. Internal heat gains for both days were varied to simulate load disturbances.
From , it can be seen that on the first day, the room air temperature does not reach the set-point until 1300. However, the system maintains the temperature set-point very well beginning at 0900 on the second day, with only small fluctuations. The assessments with selected 14 indices are shown in the next section.
Case2: Test result for selected CPA indices
demonstrates the selected CPA indices for an assessment of the VAV room air temperature control loop. For the integral based indices (subplot [a–d]), the IAE, ISE, ITAE, ITSE all have very similar index curves. On the first day, these indices decrease rapidly initially, stay close to zero and finally increase to one. On the second day, values of these indices are similar to those on the first day.
For the EWMA based indices (subplots [e–f]), it can be seen that the EWMA of the control error (ErrEWMA) and absolute value of EWMA of the control error (AbsErrEWMA) are similar. They both increase with control error increases and then decrease slowly with control error decreases.
For the five statistically based indices (subplots [g–k]), the indices curves show some differences. For the good control periods, the mean of control errors is close to the zero, while for the bad control periods, the mean is negative. Standard deviation of control error for the good control periods is close to the zero, and increases gradually to higher values for the bad control periods. The ratio of standard deviation of error and the standard deviation of outputs are similar to the standard deviation of error.
For the MVC based index, the normalized Harris index is able to distinguish between the “good” and “bad” control loops. For the good control periods, the Harris index remains close to zero. For the bad control periods, the Harris index remains close to one. VarBand index has similar assessment results.
The results from the Hurst index (DFA-based) are similar to those from the MVC-based index. But it has smaller values for the bad control periods.
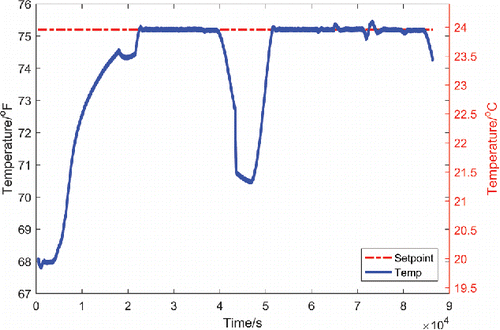
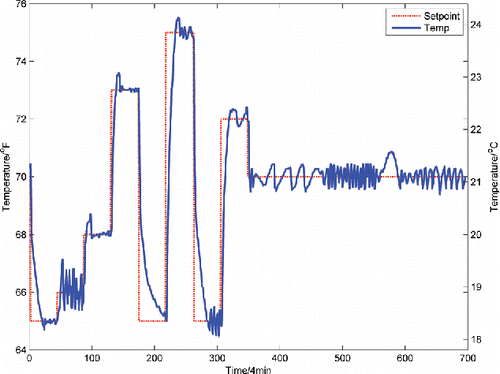
Case 3: Real VAV room temperature control loop
shows the VAV room air temperature in the heating mode from real field data. This data was collected from Iowa Energy Center's Energy Resource Station (ERS) located in Ankeny, Iowa. Data sampling frequency was set as 4 min. The varying room air temperature set-point is plotted as well. The time delay for this system is estimated to be 8 min. The temperature has more fluctuations. For the first 350 data points, the set-point is varied significantly. For the second 350 data points, the set-point remains constant and the room air temperature is fluctuated frequently around set-points. The assessment results are shown in the next section.
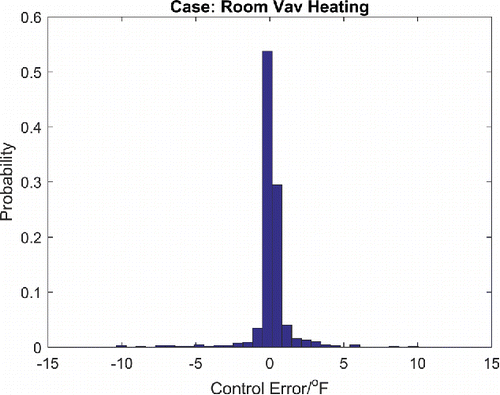
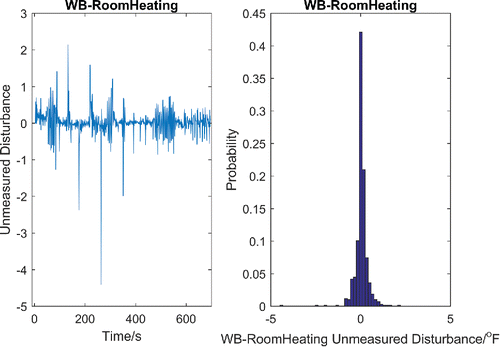
Uncertainties in the observation (control error) for this real VAV room temperature control loop now are presented in the probability density function (PDF) plot as shown in . This PDF plot shows that the control error is in a nearly Gaussian distribution with a mean value of 0.0688°F (0.038°C). The unmeasured disturbances, as shown in , were estimated using recursive linear squared method (Hu Citation2013; Shah and Cluett Citation1991). The estimated unmeasured disturbance is in a nearly Gaussian distribution with a mean value of near zero and a variance of 0.12°F2 (0.037°C2).
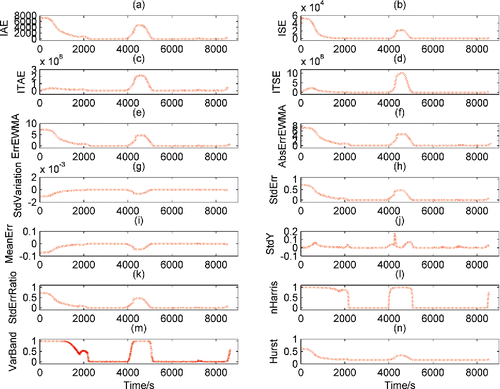
Case 3: Test result for selected CPA indices
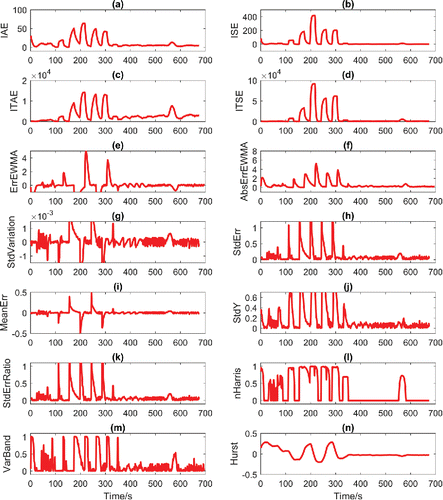
shows selected CPA indices for a VAV room air temperature control loop in the heating mode from real field data. All the indices show the varying CPA values are following the air temperature variations around the set-point. For the first 350 data points, most CPA indices are varying significantly following the set-point variations. For the second 350 data points, all CPA indices are close to zero with small fluctuations. The behaviors of CPA indices in this case study are similar to that from simulated cases.
Table 6 Summary of 14 selected CPA indices.
Table 7 Targets and assumptions of 14 selected CPA indices.
Discussion and conclusions
Based on the critical literature review and the preliminary test using simulation data from one HVAC control loop, a comparison of the selected 14 CPA indices is presented in . They are compared in several aspects:
Objective: The authors evaluate (1) whether the CPA index is independent of control loop types and (2) whether there is a human-in-loop involved.
Parameters/required inputs (control error, control output, and control input): These are required data collected from the control loop for performance assessment. Control outputs are the most commonly available data from HVAC controllers. Involving other variables, such as control inputs would complicate the evaluation.
With lower and upper bounds: The authors evaluate whether the CPA index has both bower and upper bounds so that it is easy to interpret the CPA index with qualitative assessment scales such as excellent, good, fair, bad, and fail.
Required computational burden: The authors evaluate whether the computational algorithms of the CPA index is suitable for an online implementation in a HVAC local controller with a limited on-board memory.
In addition, targets and assumptions associated with implementations of these indices for a regulatory feedback controller such as a PI controller are listed in .
There are numerous analytical and practical works dealing with CLPAs in the process control industry. However, very few studies are available that focus on HVAC applications. There is a need to select, develop, and test an objective and quantitative metric (i.e., CQF) with simple-to-interpret criteria for HVAC applications. The final decision will be made based on the following criteria:
This CQF should be suitable for HVAC applications, in particular, regulatory feedback control loop (e.g., PI controller). There may be some challenges to directly using existing performance metrics from the process control industry. Unpredictable load variations may result in significant uncertainties in the performance assessment.
This CQF should be suitable for on-line computations in the same automation controller that is running the control loop being tested. Therefore, the performance of the control loop will be continuously monitored with the same hardware or test equipment. Controllers used in HVAC applications often have limited onboard memory, so the on-line computation will require a simple formula for the proposed CQF.
This CQF should be automatically calculated based on historical data.
This CQF should only require data commonly stored and available in the HVAC local controller.
From this comprehensive review of the CLPA and the case study using three specific HVAC control loops, shows the normalized Harris index is a potential candidate for the HVAC CLPA. The calculation of the Harris index only needs data from the controller output and it is also a single index with a lower bound and upper bound that can be mapped to a performance assessment scale. However, the algorithm itself may require a relatively complicated computational effort. Another attractive index is the EWMA based index. More comprehensive evaluations with real data from various types of HVAC control loops in real buildings will be needed to further evaluate the applicability of the Normalized Harris index and the EWMA based index for HVAC applications. Some modifications may be needed, for example, algorithms to consider reversal behaviors. Furthermore, a field-testing using a real HVAC DDC controller is necessary to test whether the proposed CQF is suitable for online implementations.
Nomenclature
| AbsErrEWMA | = | absolute value of EWMA of control error |
| ARMA | = | auto-regression-moving-average |
| AR | = | auto regression |
| MA | = | moving average |
| CPA | = | control performance assessment |
| CLPA | = | control loop performance assessment |
| CQF | = | control quality factor |
| DDC | = | direct digital controller |
| DFA | = | detrended fluctuation analysis |
| ErrEWMA | = | EWMA of control error |
| EWMA | = | exponentially weighted moving average in Equations 33–37 |
| HVAC | = | heating, ventilation, and air-conditioning |
| IAE | = | integral of the absolute error |
| ISE | = | integral of squared error |
| ISTC | = | integral of square time derivative of the control input |
| ITAE | = | integral of the absolute error multiplied by time |
| IT MD TDOF PID | = | model driven two-degree-of-freedom PID control by improve method |
| HIS | = | historical benchmarking |
| EHPI | = | extended horizon performance index |
| OPID | = | optimal PID control |
| RS-LQG | = | restricted structure linear quadratic Gaussian |
| LQG | = | linear quadratic Gaussian |
| MD TDOF PID | = | model driven two-degree-of-freedom PID control |
| MVC | = | minimum variance control |
| STD | = | standard deviation |
| PID | = | proportional-integral-derivative |
| PT MD TDOF PID | = | model driven two-degree-of-freedom PID control by previous method |
| TDOF CS MSP | = | two-degree-of-freedom control scheme by modified smith predictor |
| = | EWMA value of interested variables | |
| Xt | = | variables to be EWMA |
| Vb | = | variance band |
| e(t) | = | control error at time t in Equation 1 |
| r(t) | = | set-point at time t in Equation 1 |
| δ | = | sample time |
| ηmv | = | Harris index |
| λ | = | exponential smoothing constant |
| σ2b | = | variance of the predefined error band |
| σe | = | standard deviation of control error |
| σ2mv | = | minimum variance |
| σy | = | standard deviation of process output |
| τa | = | actual time constant |
| Δt | = | sample period |
Acknowledgments
The authors want to thank members of the Project Monitoring Subcommittee (PMS) for providing direction, review, and technical expertise. This work emerged from the Annex 60 project, an international project conducted under the umbrella of the International Energy Agency (IEA) within the Energy in Buildings and Communities (EBC) Programme. Annex 60 will develop and demonstrate new generation computational tools for building and community energy systems based on Modelica, Functional Mockup Interface, and BIM standards.
Funding
This work was supported by ASHRAE through RP-1587 “Control Loop Performance Assessment.” The financial support from ASHRAE is greatly appreciated.
References
- ASHRAE. 2009. Guideline 11-2009—Field Testing of HVAC Controls Components. Atlanta: ASHRAE.
- Åström, K.J. , and T. Hägglund. 1995. PID controllers: Theory, design and tuning . (2nd ed.). Research Triangle Park, NC: International Society of Automation.
- Åström, K.J. 2012. Introduction to stochastic control theory. New York, NY: Academic Press, Inc.
- Baba, Y., T. Shigemasa, M. Yukitomo, F. Kojima, M. Takahashi, and E. Sasamura. 2003. Model-driven PID control system in single-loop controller. Paper presented at the SICE 2003 Annual Conference, Fukui University, Japan, August 4–6.
- Barwig, F.E., J.M. House, C.J. Klaassen, M.M. Ardehali, and T.F. Smith. 2002. The national building controls information program. Paper presented at the Proceedings of ACEEE summer study on energy efficiency in buildings. Washington, DC, 3: 1–14.
- Box, G.E., and G.M. Jenkins. 1976. Time Series Analysis: Forecasting and Control, Revised Ed. San Francisco, CA: Holden-Day.
- Boysen, H. 2013. Auto Tuning and Motor Protection as Part of the Pre-Setting Procedure in a Heating System. Danfoss News. http://heating.danfoss.com/PCMPDF/VFBBV202_auto_tuning.pdf
- Brogan, W.L. 1974. Modern control theory. Englewood Cliffs, NJ: Prentice-Hall, Inc.
- Clarke, J. A., J. Cockroft, S. Conner, J. W. Hand, N. J. Kelly, R. Moore, T. O'Brien, and P. Strachan. 2002. Simulation-assisted control in building energy management systems. Energy and Buildings 34(9):933–940.
- Deru, M., K. Field, D. Studer, K. Benne, B. Griffith, P. Torcellini, B. Liu, M. Halverson, D. Winiarski, M. Rosenberg, M. Yazdanian, J. Huang, and D. Crawley. 2011. US Department of Energy commercial reference building models of the national building stock. . Report NREL/TP-5500-4686. Godlen, CO: National Renewable Energy Laboratory.
- Desborough, L. and T. Harris. 1992. Performance assessment for univariate feedback control. Canadian Journal of Chemical Engineering . 70: 1186–1197.
- Dexter, A., G. Geng, and P. Haves. 1990. The application of self-tuning PID control to HVAC systems. IEE Colloquium Digest Control in Building Energy Management System, Digest No. 093: April 1-April 3.
- Dexter, A., and P. Haves. 1989. A robust self-tuning predictive controller for HVAC applications. ASHRAE Transactions 95(2): 431–438.
- Edgar, T.F. 2007. Performance Monitoring and Tuning Controllers. Oak Brook, IL: Reed Business Information.
- Elmqvist, H., D. Brück, and M. Otter. 1996. Dymola-User's Manual. Lund, Sweden: Dynasim AB, Research Park Ideon.
- Erickson, V.L., Y. Lin, A. Kamthe, R. Brahme, A. Surana, A. E. Cerpa, M.D. Sohn, and S. Narayanan. 2009. Energy efficient building environment control strategies using real-time occupancy measurements. Paper presented at the Proceedings of the First ACM Workshop on Embedded Sensing Systems for Energy-Efficiency in Buildings, New York, NY, November 3.
- Federspiel, C., and J. Seem. 1996. Temperature Control in Large Buildings. Boca Raton, FL: CRC/IEEE Press.
- Forsman, K., and A. Stattin. 1999. A new criterion for detecting oscillations in control loops. Paper presented at the European Control Conference, Karlsruhe, Germany, August 31–September 3.
- Fritzson, P. 2010. Principles of object-oriented modeling and simulation with Modelica 2.1 (1 ed.). Hoboken, NJ: John Wiley & Sons.
- Fu, R., L. Xie, Z. Song, and Y. Cheng. 2012. PID control performance assessment using iterative convex programming. Journal of Process Control 22(9):1793–9.
- Grimble, M., and P. Majecki. 2004. Weighting selection for controller benchmarking and tuning. Technical Report PAM-12-TN-1-V1, Industrial Control Centre, University of Strathclyde, Glasgow.
- Grimble, M., and D. Uduehi. 2001. Process control loop benchmarking and revenue optimization. Paper presented at the Proceedings of the 2001 American Control Conference, Arlington, VA, June 25–27.
- Grimble, M.J. 2002. Controller performance benchmarking and tuning using generalised minimum variance control. Automatica 38(12):2111–9.
- Hägglund, T. 1995. A control-loop performance monitor. Control Engineering Practice 3(11):1543–51.
- Hägglund, T. 1999. Automatic detection of sluggish control loops. Control Engineering Practice 7(12):1505–11.
- Harris, T., F. Boudreau, and J. MacGregor. 1996. Performance assessment of multivariable feedback controllers. Automatica 32(11):1505–18.
- Harris, T., C. Seppala, and L. Desborough. 1999. A review of performance monitoring and assessment techniques for univariate and multivariate control systems. Journal of Process Control 9(1):1–17.
- Harris, T.J. 1989. Assessment of control loop performance. The Canadian Journal of Chemical Engineering 67(5):856–61.
- Horch, A. 1999. A simple method for detection of stiction in control valves. Control Engineering Practice 7(10):1221–31.
- Horch, A., and F. Heiber. 2004. On Evaluating Control Performance on Large Data Sets. Germany: ABB Corporate Research.
- Howard, R., and D.J. Cooper. 2009. Performance assessment of non-self-regulating controllers in a cogeneration power plant. Applied Energy 86(10):2121–9.
- Howard, R., and D. Cooper. 2010. A novel pattern-based approach for diagnostic controller performance monitoring. Control Engineering Practice 18(3):279–88.
- Hu, K., P.C. Ivanov, Z. Chen, P. Carpena, and H.E. Stanley. 2001. Effect of trends on detrended fluctuation analysis. Physical Review E 64(1):011114.
- Hu, Y. 2013. Iterative and recursive least squares estimation algorithms for moving average systems. Simulation Modelling Practice and Theory 34:12–9.
- Huang, B., and R. Kadali. 2008. Dynamic modeling, predictive control and performance monitoring: A data-driven subspace approach. London, UK: Springer-Verlag.
- Huang, B., and S.L. Shah. 2012. Performance assessment of control loops: Theory and applications. London, UK: Springer-Verlag London.
- Huang, B., S. Shah, and E. Kwok. 1997. Good, bad or optimal? Performance assessment of multivariable processes. Automatica 33(6):1175–83.
- Hugo, A.J. 2006. Performance assessment of single-loop industrial controllers. Journal of Process Control 16(8):785–94.
- Hunter, J.S. 1986. The exponentially weighted moving average. Journal of Quality Technology 18(4):203–10.
- Jain, M., and S. Lakshminarayanan. 2005. A filter-based approach for performance assessment and enhancement of SISO control systems. Industrial & Engineering Chemistry Research 44(22):8260–76.
- Jämsä-Jounela, S., R. Poikonen, N. Vatanski, and A. Rantala. 2003. Evaluation of control performance: Methods, monitoring tool and applications in a flotation plant. Minerals Engineering 16(11):1069–74.
- Jelali, M. 2006. An overview of control performance assessment technology and industrial applications. Control Engineering Practice 14(5):441–66.
- Ko, B.-S., and T.F. Edgar. 2001. Performance assessment of multivariable feedback control systems. Automatica 37(6):899–905.
- Ko, B.S., and T.F. Edgar. 2004. PID control performance assessment: The single‐loop case. AIChE Journal 50(6):1211–8.
- Li, Y., and Z. O'Neill. 2015. Evaluating control performance on building HVAC controllers. Paper presented at the International Building Performance Simulation Association, Hyderabad, India, December 7–9.
- Lopez, A., P. Murrill, and C. Smith. 1967. Controller tuning relationships based on integral performance criteria. Instrumentation Technology 14(12):57–62.
- Ma, Y., J. Matuško, and F. Borrelli. 2015. Stochastic model predictive control for building HVAC systems: Complexity and conservatism. IEEE Transactions on Control Systems Technology 23(1):101–16.
- McNabb, C.A., and S.J. Qin. 2003. Projection based MIMO control performance monitoring: I—covariance monitoring in state space. Journal of Process Control 13(8):739–57.
- Ooi, S.K., and E. Weyer. 2011. Detection of oscillations in control loops in irrigation channels. Control Engineering Practice 19(3):311–9.
- Ordys, A., D. Uduehi, and M.A. Johnson. 2007. Process control performance assessment: From theory to implementation. Berlin, Germany: Springer Science & Business Media.
- Padhan, D.G., and S. Majhi. 2010. A two-degree-of-freedom control scheme for integrating and unstable delay processes. Paper presented at the IEEE INDICON 2010 Conference, Kolkata, India, December 17–19.
- Peng, C., S. Buldyrev, A. Goldberger, S. Havlin, F. Sciortino, M. Simons, and H. Stanley. 1992. Long-range correlations in nucleotide sequences. Nature 356(6365):168–70.
- Prabhu, A.V., and T.F. Edgar. 2007. Performance assessment of run-to-run EWMA controllers. IEEE Transactions on Semiconductor Manufacturing 20(4):381–5.
- Qin, S.J. 1998. Control performance monitoring—A review and assessment. Computers & Chemical Engineering 23(2):173–86.
- Qin, S.J., and J. Yu. 2007. Recent developments in multivariable controller performance monitoring. Journal of Process Control 17(3):221–7.
- Rice, R.C., R.R. Jyringi, and D.J. Cooper. (2010). Performance monitoring fundamentals: Demystifying performance assessment techniques: Innovative solutions from the process control professionals. www.controlstation.com.
- Salsbury, T.I. 2007. Continuous-time model identification for closed loop control performance assessment. Control Engineering Practice 15(1):109–21.
- Salsbury, T.I., and C.F. Alcala. 2015. Two new normalized EWMA-based indices for control loop performance assessment. Paper presented at the American Control Conference (ACC), Chicago, IL, July 1–3.
- Seborg, D., T.F. Edgar, and D. Mellichamp. 2006. Process dynamics & control. New York, NY: John Wiley & Sons.
- Seem, J.E. 1998. A new pattern recognition adaptive controller with application to HVAC systems. Automatica 34(8):969–82.
- Seem, J.E., and J.M. House. 2009. Integrated control and fault detection of air-handling units. HVAC&R Research 15(1):25–55.
- Seem, J.E., J.M. House, and R.H. Monroe. 1997. On-line monitoring and fault detection of control system performance. Paper presented at the Proceedings of CLIMA 2000 Conference, Congress Place, Brussels, Belgium, August 30-September 2.
- Seem, J.E., J.M. House, and R.H. Monroe. 1999. On-line monitoring and fault detection. ASHRAE Journal 41(7
- Sendjaja, A.Y., and V. Kariwala. 2009. Achievable PID performance using sums of squares programming. Journal of Process Control 19(6):1061–5.
- Shah, S.L., and W.R. Cluett. 1991. Recursive least squares based estimation schemes for self‐tuning control. The Canadian Journal of Chemical Engineering 69(1):89–96.
- Shardt, Y., Y. Zhao, F. Qi, K. Lee, X. Yu, B. Huang, and S. Shah. 2012. Determining the state of a process control system: Current trends and future challenges. The Canadian Journal of Chemical Engineering 90(2):217–45.
- Srinivasan, B., T. Spinner, and R. Rengaswamy. 2012. Control loop performance assessment using detrended fluctuation analysis (DFA). Automatica 48(7):1359–63.
- Stanfelj, N., T.E. Marlin, and J.F. MacGregor. 1993. Monitoring and diagnosing process control performance: The single-loop case. Industrial & Engineering Chemistry Research 32(2):301–14.
- Thornhill, N., and T. Hägglund. 1997. Detection and diagnosis of oscillation in control loops. Control Engineering Practice 5(10):1343–54.
- Underwood, C.P. 2002. HVAC control systems: Modelling, analysis and design. London, UK: E & FN Spon.
- Wetter, M., W. Zuo, T.S. Nouidui, and X. Pang. 2014. Modelica buildings library. Journal of Building Performance Simulation 7(4):253–70.
- Yen, J., and R. Langari. 1998. Fuzzy logic: Intelligence, control, and information. Englewood Cliffs, NJ: Prentice-Hall, Inc.
- Yu, Z., and J. Wang. 2012. Assessment of proportional–integral control loop performance for input load disturbance rejection. Industrial & Engineering Chemistry Research 51(36):11744–52.
- Zhang, Y. 2008. Improved methods in statistical and first principles modeling for batch process control and monitoring. Ph.D. Dissertation, University of Texas, Austin, TX: ProQuest.
- Zhao, F., J. Fan, and S. Mijanovic. 2013. PI auto-tuning and performance assessment in HVAC systems. Paper presented at the American Control Conference (ACC), Washington, DC, June 17–19.
- Zhao, Y., W. Xie, and X. Tu. 2012. Performance-based parameter tuning method of model-driven PID control systems. ISA Transactions 51(3):393–9.
- Zheng, B. 2007. Analysis and auto-tuning of supply air temperature pi control in hot water heating systems. Dissertation of University of Nebraska, January, 2007.
- Zhou, Q., and M. Liu. 1998. An on-line self-tuning algorithm of PI controller for the heating and cooling coil in buildings. Paper presented at the Proceedings of the eleventh symposium on improving building systems in hot and humid climates, Fort Worth, TX, June 1–2.