
 ?Mathematical formulae have been encoded as MathML and are displayed in this HTML version using MathJax in order to improve their display. Uncheck the box to turn MathJax off. This feature requires Javascript. Click on a formula to zoom.
Abstract
An experimental program was conducted to measure the relative and absolute roughness of phenolic duct systems connected with a four-bolt flange and cleat joint. Ducts with seven distinct rectangular cross sections (internal aspect ratios ) were investigated. In every instance, the duct material thickness was 7/8 in. (22 mm), with smooth aluminum foil covering the internal surface between flanges. For unreinforced phenolic ducts with 10 ft (3.0 m) sections connected by four-bolt flanges, the relative roughness ε/Dh ranged from 0.0002 to 0.0005, with an average value of 0.0003. For similar ducts having 5 ft (1.5 m) duct sections (double the number of flanges per test section), the relative roughness range and average doubled. It appears that the flanges are the dominant effect on relative roughness and that the ducts tested have about 1.5 to 2.8 times more absolute roughness than the average value for galvanized steel ducts described in the ASHRAE Handbook.
Introduction
Phenolic ducts are a new air distribution product that is entering the North American market from Europe and China. A phenolic duct system comprises phenolic panels, fabrication methods, coupling systems, and accessories to produce preinsulated rectangular ductwork in sections up to 13 ft (4.0 m) long, with a thickness of either 7/8 in. (22 mm) or 1-3/16 in. (30 mm) for different R values. Phenolic panels are made of a fiber-free rigid thermoset phenolic insulation core faced with embossed aluminum foil or smooth aluminum foil on both the interior and exterior of the duct. In addition, there are three transverse joint systems available to suit different installation and project specification requirements. They include (1) a four-bolt flange system, (2) drive cleats on four sides, and (3) butted ducts with fasteners at exterior corners and sides. Of the duct joining systems, the four-bolt flange and drive cleat systems have the same interior protrusions. The cleat system is simply two phenolic panels butted together with no internal protrusions, other than possibly not accurately aligning with each other.
SMACNA recently published the first edition of its “Phenolic Duct Construction Standards” (2015). Those standards describe structural construction requirements, but they do not include data to design phenolic duct systems. In particular, technical data such as the effects of surface roughness and flange connections on pressure drops are necessary to properly design duct systems. The objective of this research was to determine the relative and absolute roughness of phenolic duct systems connected with four-bolt flange and cleat joints, using test and data reduction procedures provided in ANSI/ASHRAE Standard 120-2017, “Method of Testing to Determine Flow Resistance of HVAC Ducts and Fittings” (ASHRAE Citation2017a).
There are numerous references available in the literature pertaining to the experimental determination of pressure losses in HVAC air duct systems; several of the most relevant studies are herein discussed. Huebscher (Citation1948) measured pressure drops in round, square, and rectangular air ducts. The respective ducts exhibited the same pressure loss per unit length when considered at the same air velocity, when each cross section had the same hydraulic diameter. The square and rectangular duct tests considered only one duct section length, and all tests dealt with a single absolute surface roughness. The concept of an equivalent round duct exhibiting the same friction and flow characteristics as rectangular cross sections was introduced; this analysis approach remains in widespread usage among duct designers. Hutchison (Citation1953) measured the surface roughness of aluminum ducts with longitudinal seams having 0.91 m (3 ft) section lengths. The joints were of the standard slip type, with the crimped end being slipped into the uncrimped end of the adjacent downstream section. The resulting absolute roughness of aluminum ducts was determined to be of the order of 1/3 that of similar galvanized steel ducts. It was noted that the measured absolute roughness was influenced by the duct diameter under study. Jones (Citation1979) performed further pressure loss measurements in round spiral seam galvanized steel ducts having 3.05 m (10 ft) sections joined by slip couplings spacing. The results were presented in terms of absolute and relative roughness.
Heyt and Diaz (Citation1975) first measured pressure loss characteristics of spiral flat oval galvanized steel air ducts. They did not explicitly report the duct section lengths or connection methods considered in the test program. It was shown that the absolute roughness was a function of duct aspect ratio. This was attributed to the strain imposed on the duct when stretched in its construction. They likewise introduced an expression for the equivalent round diameter pertinent to spiral flat oval ducts. Townsend et al. (Citation1994) later confirmed that the equivalent round diameter expression derived from the data of Heyt and Diaz (Citation1975) was accurate to within 6.2% of a rigorous solution, based on pressure loss data obtained from pressure loss tests performed on galvanized steel spiral flat oval ducts having section lengths of either 2.09 m (6 ft) or 3.66 m (12 ft) joined by bead slip connectors. Khaire and Idem (Citation2010) considered the influence of upstream test section geometry on measured duct relative roughness, based on pressure loss tests performed on straight flat oval galvanized steel ducts having cross sections of 356 × 152 mm (14 × 6 in.), and section lengths of 1.22 m (4 ft). The test ducts were connected to a nozzle chamber by two methods, namely, a smooth bellmouth and a conical transition. It was observed that the measured absolute roughness in a test section of fixed length was influenced by the connection method used to attach the test duct to the nozzle chamber, unless the entrance length was increased to at least 12 hydraulic diameters. It was later recommended that test section entrance lengths in ASHRAE Standard 120 (2017a) be extended to 15 hydraulic diameters, based on a numerical study presented by Kulkarni et al. (Citation2013).
Swim (Citation1978) measured pressure loss in straight rectangular sheet metal ducts when lined with spray-coated rigid board, and rigid board lined with a smooth facing material. In addition, the study also addressed rectangular duct systems that incorporated flexible fiberglass liners, and included the influence of fasteners on pressure loss. It was noted that the addition of mechanical fasteners increased pressure loss by approximately 40%. Likewise, it was concluded that that the wide variety of installation practices and the quality of the transverse joints made it difficult to accurately predict the pressure loss of lined duct systems. Swim (Citation1982) measured friction characteristics for air flow in polyvinyl chloride (PVC) pipes. It was deemed that the absolute roughness of PVC pipes is approximately the same as for aluminum ducts. It was further demonstrated that couplers added little resistance to the flow, such that the measured pressure drop occurring with one coupler per 18D of pipe was the same as that for a straight pipe with smooth butt joints.
Griggs et al. (Citation1987) presented experimental pressure loss data for airflow in round galvanized sheet metal ducts with a welded longitudinal seam and a nominal joint spacing of 1.22 m (4 ft). These tests investigated the influence of different joint types, that is, beaded slip, Vanstone, drawband, and welded. It was concluded that beaded slip and Vanstone joints exhibited the same absolute roughness. Therein welded joints appeared to offer relatively less flow resistance, and drawband joints exhibited the least resistance of the four joint types considered in the study. In addition, they investigated pressure losses in one diameter of spiral sheet metal ducts with a ribbed construction and having a nominal joint spacing of 3.05 m (10 ft). The resulting absolute roughness data were found to be a function of the number of ribs present in the spiral ducts. Griggs and Khodabakhsh-Sharifabad (Citation1992) measured pressure loss in two cross sections of rectangular galvanized sheet metal ducts attached using slip and drive connections; the duct section lengths were not clearly noted in their paper. The absolute roughness of the smaller cross section duct was observed to fall below the hydraulically smooth curve on a Moody diagram, whereas the data for the large size duct resided above that curve. The difference between these results was attributed to the “S” slip joint construction, which protruded different amounts in the flow cross section. They also simulated the influence of transverse joints, cross breaks, and beads by means of pressure loss tests performed on rectangular plywood ducts. Those tests demonstrated that friction factors increased as joint spacing decreased, and that thicker joints consistently yielded higher friction factors than thinner joints. The principal conclusion from their study was that absolute roughness measured in rectangular ducts is a function of surface condition, duct fabrication, and joint spacing and construction.
Kulkarni et al. (Citation2009) measured friction factors in round corrugated spiral seam galvanized steel ducts having three diameters, and 3.05 m (10 ft) sections joined by beaded slip connections. One particular corrugation profile having two corrugations per seam was considered in their test program. The presence of corrugations yielded greater surface roughness compared to conventional noncorrugated spiral ducts, leading to an increased pressure loss ranging from 7% to 34% at the same average air velocity. This was quantified in terms of an equivalent increased corrugated duct diameter that would exhibit the same flow and pressure losses as an uncorrugated duct. Therein Gibbs and Idem (Citation2010) measured the absolute roughness in similar round corrugated spiral seam galvanized steel ducts exhibiting 3.05 m (10 ft) sections joined by beaded slip connections. In this instance there were four corrugations present in each individual spiral seam. It was determined that minor differences in corrugation profiles and seam pitches did not have a significant influence on the measured pressure loss, since the resulting absolute roughness values differed by less than 15% compared to the results presented by Kulkarni et al. (Citation2009).
Abushakra et al. (Citation2004) investigated the influence of compression on pressure loss measured in wire-wound flexible ducts. These ducts are typically used in residential and light commercial applications. The study demonstrated that longitudinal compression of such ducts could increase the pressure drop by a factor ranging from 4 to 10, depending on the extent of compression. The increased pressure loss, relative to that for fully stretched ducts, was quantified in terms of a pressure drop correction factor (PDCF) that accounted for the compression fraction as well as the duct diameter. Weaver and Culp (Citation2007) contended that fully stretched flexible ducts exhibited pressure drops per unit length that fell within ±2% of rigid sheet metal having the same diameter, at a given volume flow rate. However, their study confirmed that flexible ducts having compressions ranging from 4% to 45% exhibited dramatically increased pressure loss, relative to fully stretched conditions. Urgusal and Culp (2007) described a combined numerical and experimental analysis of pressure loss as a function of air flow rate for board-supported nonmetallic flexible ducts that had compressions including fully stretched, 4% compression, 15% compression, and 30% compression. They contended that computational fluid dynamics (CFD) modeling was capable of predicting the resulting pressure loss per unit length to within 5% to 10% of the measured values. Culp and Cantrill (Citation2009) presented pressure loss data for nonmetallic wire-wound flexible ducts having compressions ranging from 4% to 45%, which had the maximum allowable sag between joist supports. Their data extended the PDCF correlations of Abushakra et al. (Citation2004) to larger diameter flexible ducts.
Kulkarni et al. (Citation2012) measured pressure losses in one diameter of an impermeable fabric duct used in air dispersion systems. Two specific cases were considered. In one instance the fabric duct included an internal frame that was installed to maintain a round cross section in the duct when no airflow is occurring. In addition, they considered the case where no internal support was present. The presence of the frame increased the relative roughness in the duct, compared to the case where no frame was used. It was concluded that the absolute roughness of a fabric duct was 1.69 mm (0.0056 ft) when a frame was present, whereas the absolute roughness was 0.11 mm (0.0004 ft) when the internal supports was absent. Leverette et al. (Citation2014) presented the results of a combined experimental and numerical study of pressure and velocity distributions in round fabric duct systems that had regularly spaced vents located along the flow axis. Once again two cases were considered: In one instance a ring and spoke skeletal frame was mounted internally to the duct, whereas in other cases there was no internal frame and the duct cross section was maintained solely by static pressure. Although there was a pressure loss penalty associated with the presence of an internal skeleton frame, it was determined that its use promoted more uniform flow distribution along the flow axis. Likewise, it was contended that incorporating variable area orifices at the midpoint along the flow axis yielded more uniform air dispersion.
Tested duct sections
Factory-fabricated ducts with seven distinct rectangular cross sections selected to provide a range of aspect ratios (), as listed in , were investigated in this project. The width W and height H of the ducts were based on measured duct internal dimensions. The major and minor dimensions were carefully assessed across three separate planes using a tape measure, and then averaged to evaluate the test section hydraulic diameter. In every instance, the duct material thickness was 7/8 in. (22 mm), with smooth aluminum foil covering the internal surface between flanges.
Table 1. Dimensions of ducts tested with 3.05 m (10 ft) and 1.52 m (5 ft) section lengths.
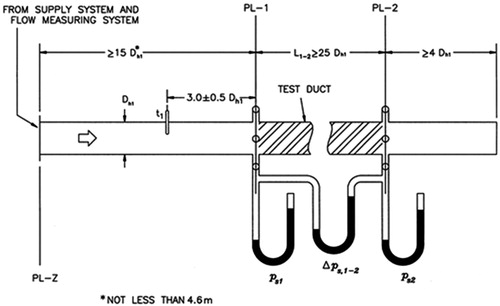
shows the test setup and total duct lengths required by Standard 120. All of the duct lengths there are expressed in terms of hydraulic diameter Dh. For each duct cross section, two test duct section lengths were tested. The section length of the first test series was 10 ft (3.0 m), and for the second series, the section length was reduced by half, that is, 5 ft (1.5 m) duct lengths. In each case, the total test duct length (combination of multiple duct sections) was at least 44 hydraulic diameters, with the test section comprising a minimum of 25 hydraulic diameters, per (excerpted from Standard 120). also lists the number of flanges in each case, and indicates the ratio of the number of flanges in the shorter duct section case to the number in the longer duct section case. It is important to note that halving the length of the test sections essentially doubled the number of joints for the ducts tested.
Fig. 1. Test setup.
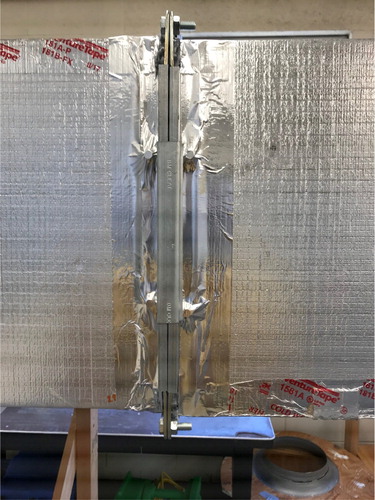
The duct sections tested were assembled according to manufacturer specifications, and per the requirements in the SMACNA Phenolic Duct Construction Standards (2015). In every instance, the phenolic ducts were supplied with a four-bolt flange preinstalled on each end by the manufacturer using retaining screws to fasten the periphery of the flanges to the ends of the ducts, as depicted in . The screws were generally spaced approximately 6 in. (150 mm) from each corner of flange, as well as at the center of the flange sides (space permitting). In every instance the screws projected as much as 1 in. (25 mm) into the flow cross section. Likewise, a stiffening ridge present on the internal surface of the flange protruded approximately 0.12 in. (3.0 mm) into the air flow cross section. portrays the self-adhesive foam gasket mounted on the exposed surface of each flange. This was installed in the laboratory per manufacturer requirements to minimize air leakage between the assembled duct sections. The duct sections comprising the test section were carefully aligned and secured using four bolts mounted at each corner. The bolts are apparent in , which depicts an extra application of caulking that was applied to the four exposed corners of each flange. While not required by the manufacturer for field installations, this procedure was followed because the corners of the flanges were viewed as a possible site for air leakage. The caulking was allowed to cure for at least 24 h before leakage and pressure loss testing began. As shown in , cleats were utilized to pull the flange ends together to minimize any possible air leakage paths. This was accomplished using a hammer to drive the cleat over the flange connections. The final step in the installation procedure was to apply aluminum foil tape around the outside of the flange connection to the duct, in order to completely cover each of the screw heads and further reduce possible air leakage at these locations. Taping over the screw heads was likewise not required by the manufacturer. The applied tape is also displayed in .
Fig. 2. Retaining screws factory installed by manufacturer mounted around the periphery of the flanges.
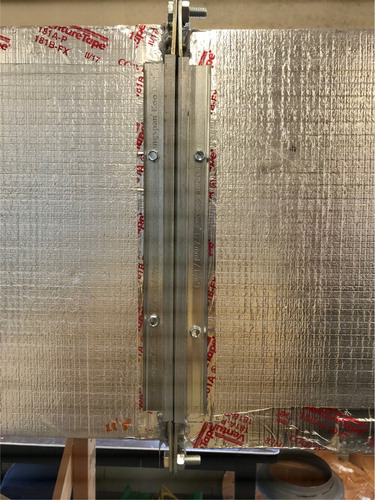
Fig. 3. Self-adhesive foam gasket applied to flange.
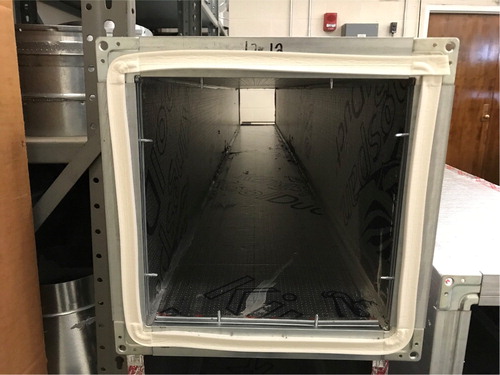
Fig. 4. Bolt connection at flange corner with caulk applied in addition to manufacturer’s instructions.
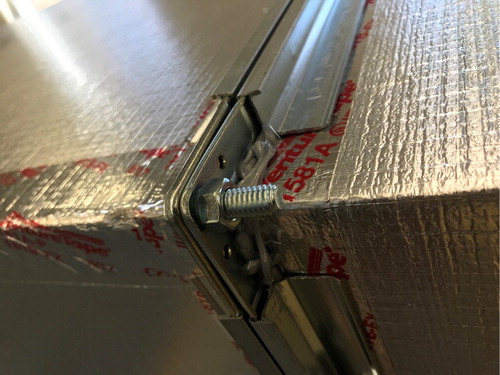
Fig. 5. Four-bolt flange assembly with cleat and tape.
Test program
Duct lengths upstream/downstream of the test section, as shown in , were chosen to conform to ASHRAE Standard 120. As a cost-saving measure, transformation pieces to attach the rectangular cross sections of the test ducts to the nozzle chamber were not employed in this project. Instead, more phenolic duct of the same cross section as the test duct section was used upstream of the test section, with a minimum length of 15 hydraulic diameters. The inlet of the upstream section was attached by flanges directly to a plywood sheet mounted on the outlet of the nozzle chamber described in the following, as permitted by ASHRAE Standard 120.
An existing nozzle chamber in compliance with ASHRAE Standard 120 was used to measure the flow rate through the test section. The nozzle board contained four long radius spun aluminum flow nozzles. Flow settling screens located inside the chamber upstream of the nozzle board were used to make the flow more uniform before entering the flow nozzles; unused nozzles were blocked by vinyl balls. The “blow-through” mode of Standard 120 (Section 7.2 b) was employed in conjunction with a 30-hp (22 kW) blower located upstream of the nozzle chamber. Flow rates were varied by adjusting the motor speed and changing the combination of nozzles. For each pressure drop test, the blower motor was allowed to run for several minutes in order to obtain steady-state conditions.
Each time a new setup was completed, an air leakage test was performed with the terminal end of the test setup carefully sealed using a combination of a plywood cover plate and cloth-backed tape. These tests were conducted to verify that the apparatus leakage was within acceptable limits, and that the pressure taps and tubing were leak free. Standard 120 requires that leakage “not exceed 0.5% of the minimum test flow rate at the maximum pressure expected during the test.” In all cases considered in the present test program, the leakage flow rates (expressed in terms of makeup air) were negligible, and in many instances beneath the detection limit of the procedure. Care was taken to ensure that the phenolic test ducts were not overpressurized, either during the leakage tests or during pressure loss testing with flow through the system, to prevent damage to the ducts. The manufacturer recommended that the internal pressure of the unreinforced duct should not exceed 4 in. wg (1000 Pa).
After leakage testing was completed, the test program was conducted as follows. Pressure drops for at least nine test points, evenly spaced over the target range of test velocities, were obtained for each duct cross section. Per ASHRAE Standard 120, in most cases, the minimum test air velocity was maintained at 6 m/s (1180 ft/min) or greater. The measured air velocities for 44 in. × 22 in. (1118 mm ×559 mm) phenolic duct sections were generally less than 6 m/s (1180 ft/min), because of the relatively large cross section, coupled with limitations of the test apparatus to achieve higher airflow rates. In all cases, the maximum air velocity did not exceed 36 m/s (7090 ft/min).
The ambient dry-bulb and wet-bulb temperatures were measured using a compact lab pyschrometer that utilized liquid-in-glass thermometers. The atmospheric pressure was measured using a mercury barometer. The nozzle chamber air temperature was measured using a general purpose liquid-in-glass thermometer. The static pressure drop across the nozzles was measured with a liquid-filled micromanometer connected to piezometric rings located 1.5 in. (38 mm) upstream and downstream of the nozzle board. Each ring was connected to a micromanometer to measure pressure drop across the nozzles. The upstream piezometric ring was also connected through a tee to a digital manometer. Measurements of pressure loss and upstream/downstream static pressure in the test section were performed using the static taps of pitot-static tubes. The static taps of the upstream and downstream pitot-static tubes were located at Planes 1 and 2 of , respectively. In every instance the pitot-static tubes were installed at the duct centerline, and they were aligned carefully with the flow direction. The test section pressure loss was measured using a liquid-filled micromanometer, whereas the upstream and downstream static pressures were measured using digital manometers. The test section temperature was not measured, but was assumed to equal the nozzle chamber temperature in the data reduction procedure.
Data reduction and measurement uncertainty
All data reduction calculations to evaluate the friction factor f and relative roughness ε/Dh complied with Section 9 of ASHRAE Standard 120, which uses SI units only in its calculations. In particular, the static pressure loss per unit length of straight test duct was determined as follows for each airflow rate (N data points for each test duct):
(1)
(1)
The numerical subscripts refer to the measurement locations indicated in . The corresponding “measured” Darcy friction factor for each of the N data points was evaluated at actual test conditions by
(2)
(2)
The calculated friction factor and relative roughness for the N data points for each test duct was then determined iteratively using the Colebrook equation:
(3)
(3)
In EquationEquation 3(3)
(3) , the Reynolds number was determined at test conditions using EquationEquation 4
(4)
(4) :
(4)
(4)
The iterative procedure was as follows. Initially, the quantity fcalc was determined using EquationEquation 3(3)
(3) by employing a relative roughness
. Then fcalc was successively recalculated by increasing
in increments of 0.0001 until
. The appropriate value of
for each duct test sample was that which minimized the square of the difference of the N measured and calculated friction factors, per EquationEquation 5
(5)
(5) :
(5)
(5)
When a measured quantity depends on more than one independent measurement, it is necessary to consider how errors combine to produce the net uncertainty in the overall measurement. Consider a dependent variable u that depends on more than one independent variable xi, such that
(6)
(6)
In the present study, it was determined that bias errors of the instrumentation (based on prior calibration) were negligible, and that all measurement errors were random. Such random (precision) errors tend to compensate, being equally likely to be both positive and negative. Therein, since all measurement uncertainties were stated at the same confidence level, the root-sum-square error in the measured parameter δur was estimated as
(7)
(7)
In this instance, δxi is the measurement uncertainty (precision error) of each independent variable. For example, the hydraulic diameter of the rectangular ducts was determined as a function of the measured duct height H and width W as follows:
(8)
(8)
It was assumed that measured duct dimensions were subject to random measurement uncertainties. In that case, the root-sum-square measurement uncertainty for the hydraulic diameter is given by
(9)
(9)
The combined volume flow rate through the nozzle bank is expressed as follows:
(10)
(10)
In this case the quantity ń refers to the number of open nozzles, and is the air density at the nozzle chamber inlet. Likewise, in EquationEquation 10
(10)
(10) , Ci and Ai are the nozzle coefficients and cross sections, respectively, and
denotes the nozzle diameter to chamber diameter ratio. Furthermore, the measured pressure drop across the combined set of open nozzles is indicated by
.
Section 9.3.1.2 of Standard 120 indicates that β = 0 for a chamber approach; this value was utilized in subsequent data reduction calculations. For all test conditions in the present study it was determined that the nozzle expansion factor = 1, to a close approximation. Uncertainties for
were deemed to be insignificant. It was assumed that uncertainties associated with the nozzle cross sections
were negligible. However, it was assumed that the nozzle coefficients and pressure drop measurements were subject to random experimental uncertainties. Likewise, measurement uncertainties of the air density and viscosity were fully taken into account in the data reduction; these are described in greater detail in ASHRAE RP-1764 (2018). Therein, the root-sum-square uncertainty for the combined nozzle volume flow rate was determined using
(11)
(11)
The volume flow rate in the test section Q1-2 was calculated in terms of the nozzle chamber volume flow rate, based on the continuity of mass flow equation:
(12)
(12)
In that instance, the measurement uncertainty of the test section volume flow rate was calculated as follows:
(13)
(13)
Referring to EquationEquation 4(4)
(4) , the test section Reynolds number can be expressed in terms of the rectangular cross section as follows:
(14)
(14)
The procedure to estimate the density and its measured uncertainty at any plane in the test apparatus is described in ASHRAE RP-1764 (2018). Likewise, the method used to evaluate the air viscosity and its measured uncertainty is provided in ASHRAE RP-1764 (2018). Based upon estimates of the measured test section cross section uncertainty, the hydraulic diameter measurement uncertainty (EquationEquation 9(9)
(9) ), and the test section volume flow rate uncertainty (EquationEquation 13
(13)
(13) ), the root-sum-square uncertainty of the test section Reynolds number was calculated using
(15)
(15)
In the present study, the Darcy friction factor was characterized as
(16)
(16)
Each quantity in EquationEquation 16(16)
(16) was deemed to be subject to a prescribed measurement uncertainty. Therein the root-sum-square uncertainty for the friction factor was determined as follows:
(17)
(17)
Values for the random measurement uncertainties considered in this study are presented in The measurement uncertainty of the test section length equaled ±0.5 in. (13 mm). It was estimated that the measurement uncertainties of duct height and width were ±0.1 in. (2.5 mm). In some instances the uncertainty for these single-sample measurements was limited by the scale readability of the instrumentation, for example, temperature measurements performed using liquid-in-glass thermometers, barometric pressure measurement, or test section pressure loss measurements. Section 6.1 of Standard 120 dictates that pressure measurements “shall be measured with accuracy equal to or better than 1.0 Pa and a precision equal to or better than 0.5 Pa.” For measurements of both the nozzle chamber static pressure and the nozzle chamber pressure drop, as well as the test section static pressure measurements at planes 1 and 2, the measurement uncertainties exceeded the measurement precision dictated by Standard 120. This was due to random pressure fluctuations that were inevitably encountered during the experiments. In those cases the time-averaging feature of the previously calibrated electronic manometers was utilized. As suggested by Section 5.3.3 of Hickman et al. (Citation2015), the nozzle discharge coefficient uncertainty (in EquationEquation 11
(11)
(11) ) was assumed to be ±1% in this investigation. The measurement uncertainty estimates were performed with a 95% confidence level.
Table 2. Uncertainties in measured parameters.
Results
The pressure loss test data measured for 10 ft (3.0 m) and 5 ft (1.5 m) long phenolic ducts connected using a four-bolt flange and cleat assembly are summarized in For these cases, there were no internal reinforcements present in the sample ducts. In every instance, the Darcy friction factor was calculated for each flow rate by EquationEquation 2(2)
(2) and plotted against the Reynolds number (EquationEquation 4
(4)
(4) ) on Moody diagrams. – depict the test data obtained for 10 ft (3.0 m) duct sections. Similarly, – portray the results for the 5 ft (1.5 m) duct sections. The Colebrook equation was used to determine relative roughness values by the least squares method; refer to EquationEquation 5
(5)
(5) . To a close approximation, the friction factor data for each duct cross section followed a single relative roughness curve; these data are also summarized in . The error bars shown for the test section Reynolds numbers and Darcy friction factors were calculated per EquationEquations 15
(15)
(15) and Equation17
(17)
(17) , respectively. They are based on the estimated random measurement uncertainties provided in .
Fig. 6. Moody diagram for a 305 mm ×152 mm (12 in. × 6 in.) phenolic duct with 3.05 m (10 ft) sections connected by four-bolt flanges (no internal reinforcements installed).
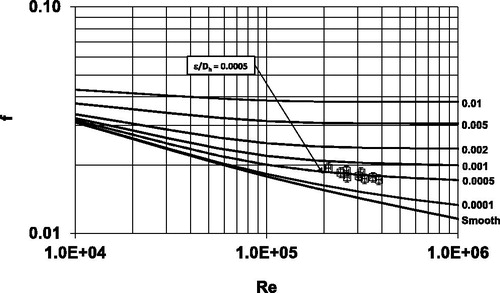
Fig. 7. Moody diagram for a 305 mm ×305 mm (12 in. × 12 in.) phenolic duct with 3.05 m (10 ft) sections connected by four-bolt flanges (no internal reinforcements installed).

Fig. 8. Moody diagram for a 610 mm ×305 mm (24 in. × 12 in.) phenolic duct with 3.05 m (10 ft) sections connected by four-bolt flanges (no internal reinforcements installed).
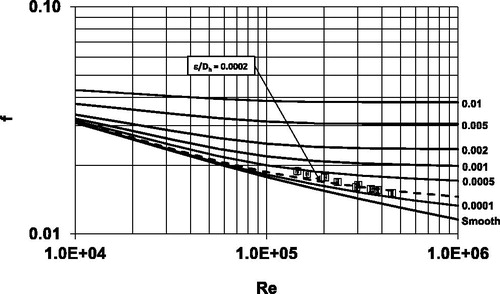
Fig. 9. Moody diagram for a 559 mm ×279 mm (22 in. × 11 in.) phenolic duct with 3.05 m (10 ft) sections connected by four-bolt flanges (no internal reinforcements installed).

Fig. 10. Moody diagram for a 559 mm ×559 mm (22 in. × 22 in.) phenolic duct with 3.05 m (10 ft) sections connected by four-bolt flanges (no internal reinforcements installed).
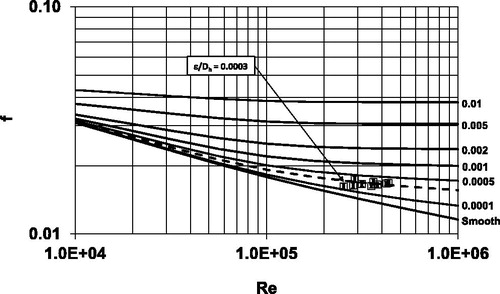
Fig. 11. Moody diagram for a 1118 mm ×559 mm (44 in. × 22 in.) phenolic duct with 3.05 m (10 ft) sections connected by four-bolt flanges (no internal reinforcements installed).

Fig. 12. Moody diagram for a 1118 mm ×279 mm (44 in. × 11 in.) phenolic duct with 3.05 m (10 ft) sections connected by four-bolt flanges (no internal reinforcements installed).

Fig. 13. Moody diagram for a 305 mm ×152 mm (12 in. × 6 in.) phenolic duct with 1.52 m (5 ft) sections connected by four-bolt flanges (no internal reinforcements installed).
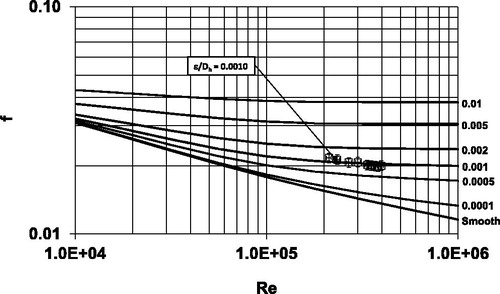
Fig. 14. Moody diagram for a 305 mm ×305 mm (12 in. × 12 in.) phenolic duct with 1.52 m (5 ft) sections connected by four-bolt flanges (no internal reinforcements installed).

Fig. 15. Moody diagram for a 610 mm ×305 mm (24 in. × 12 in.) phenolic duct with 1.52 m (5 ft) sections connected by four-bolt flanges (no internal reinforcements installed).
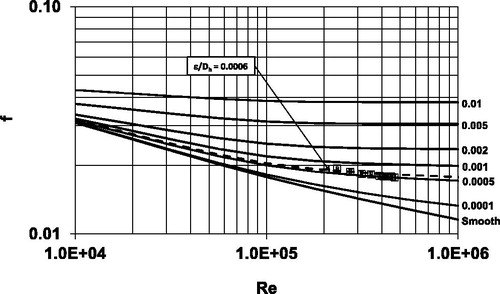
Fig. 16. Moody diagram for a 559 mm ×279 mm (22 in. × 11 in.) phenolic duct with 1.52 m (5 ft) sections connected by four-bolt flanges (no internal reinforcements installed).

Fig. 17. Moody diagram for a 559 mm ×559 mm (22 in. × 22 in.) phenolic duct with 1.52 m (5 ft) sections connected by four-bolt flanges (no internal reinforcements installed).
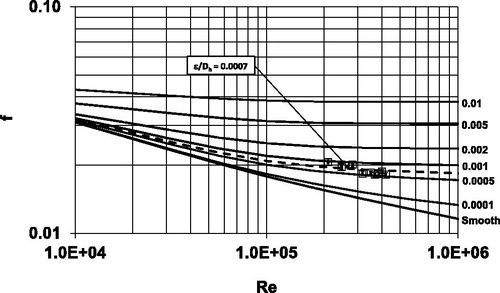
Fig. 18. Moody diagram for a 1118 mm ×559 mm (44 in. × 22 in.) phenolic duct with 1.52 m (5 ft) sections connected by four-bolt flanges (no internal reinforcements installed).

Fig. 19. Moody diagram for a 1118 mm ×279 mm (44 in. × 11 in.) phenolic duct with 1.52 m (5 ft) sections connected by four-bolt flanges (no internal reinforcements installed).
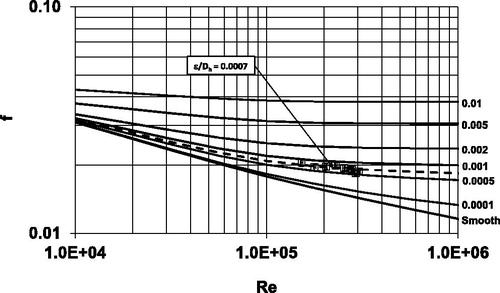
Table 3. Relative and absolute roughness values for phenolic ducts (no internal reinforcements installed).
Typically, the root-sum-square uncertainty of the test section Reynolds number was approximately 2%. The uncertainty analysis performed in this study indicated that several parameters provided the greatest contributions to that value. It was observed that the assumed nozzle discharge coefficient uncertainty, the measurement uncertainty of pressure loss across the nozzle chamber and test section, and the measurement uncertainty of the test section cross section influenced the root-sum-square uncertainty of the test section Reynolds number almost equally. The effects of other sources of uncertainty were orders of magnitude smaller for the conditions encountered in the experiments.
For most cases considered in this test program, the root-sum-square uncertainty of the Darcy friction factor was roughly 4%. The estimation of the Darcy friction factor uncertainty was dominated by uncertainties associated with the flow rate measurement, that is, the nozzle discharge coefficient and the flow nozzle pressure loss measurement uncertainties. Referring to , conservative estimates of the duct interior dimensions were employed in the uncertainty analysis, because in some instances the duct walls were not perfectly square. It is readily apparent that the friction factor uncertainty increased at lower flow rates, and correspondingly decreased as the air velocity increased. This phenomenon was observed very clearly in the Moody diagrams for the 44 in. × 22 in. (1118 mm ×559 mm) duct sections, where at the lowest flow rates, the estimated friction factor root-sum-square uncertainty approached 10%. This large uncertainty is attributed to the inability of the test apparatus to maintain the minimum test section air velocity (6 m/s) required by Section 5.4 of Standard 120. Consequently, the measured test section pressure loss values were reduced, thereby yielding a higher percentage measurement error.
Conclusions
For phenolic ducts with 10 ft (3.0 m) sections connected by four-bolt flange and cleat assemblies, the relative roughness ε/Dh ranged from 0.0002 to 0.0005, with an average value of 0.0003. By comparison, for similar duct systems having 5 ft (1.5 m) duct sections, the relative roughness range was 0.0004 to 0.0010, with an average value of 0.0006. Based on these results, it appears that doubling the number of joints per unit length over the test duct section generally doubled the measured relative roughness. Otherwise, these results were apparently independent of the aspect ratio of the ducts, over the span . The corresponding absolute roughness ε for phenolic ducts connected by four-bolt flange and cleat assemblies was 0.00044 ft (0.136 mm) for 10 ft (3.0 m) section lengths, and 0.00084 ft (0.254 mm) for 5 ft (1.5 m) section lengths. Their corresponding absolute roughness was about 1.5 to 2.8 times greater than the “average” absolute roughness (0.0003 ft, 0.09 mm) described for galvanized steel ducts in of the Duct Design chapter in the 2017 ASHRAE Handbook of Fundamentals (ASHRAE Citation2017c). That roughness value is based on the study of Griggs and Khodabakhsh-Sharifabad (1992). They reported absolute roughness values of 0.00027 to 0.0005 for “galvanized steel rectangular ducts with various types of joints, with 4 ft spacing.” However, they did not test the effects of galvanized ducts with actual joints. Instead the ducts were constructed from plywood, and wood strips placed inside the ducts were used to simulate joints. It is recommended that roughness data resulting from the present study be included in the ASHRAE Duct Fitting Database (2017b), and in future editions of the Duct Design chapter in the ASHRAE Handbook of Fundamentals. It is also suggested that other phenolic duct joining systems be considered for further experimental investigation, to ascertain their influence on the relative and absolute roughness.
| Nomenclature | ||
| A | = | duct cross-section, m2 (ft2) |
| Ai | = | nozzle area, |
| Ci | = | nozzle coefficients, dimensionless |
| Dh | = | hydraulic diameter, m (ft) |
| = | measured Darcy friction factor, dimensionless | |
| = | calculated Darcy friction factor, dimensionless | |
| H | = | height, mm (in.) |
| = | total test duct length, m (ft) | |
| ṁ | = | mass flow rate, kg/s (lbm/s) |
| n | = | pressure exponent, dimensionless |
| ń | = | number of open nozzles, dimensionless |
| N | = | number of data points, dimensionless |
| pb | = | barometric pressure, kPa (in. Hg) |
| = | saturation vapor pressure, Pa (lbf/in2) | |
| = | partial pressure, Pa (lbf/in2) | |
| ps | = | static pressure, Pa (in. of water) |
| pv | = | velocity pressure, Pa (in. of water) |
| = | duct pressure loss per unit length, Pa/m (in. of water/100 ft) | |
| Δps | = | static pressure differential between planes, Pa (in. of water) |
| Q | = | volume flow rate, L/s (ft3/min) |
| R | = | ideal gas constant, kJ/(kgda·K) [ft·lbf/(lbm,da·°R)] |
| Re | = | Reynolds number, dimensionless |
| = | ambient dry-bulb temperature, °C (°F) | |
| = | ambient wet-bulb temperature, °C (°F) | |
| t1 | = | test section dry-bulb temperature, °C (°F) |
| t5 | = | nozzle chamber approach dry-bulb temperature, °C (°F) |
| V | = | average air velocity, m/s (ft/min) |
| W | = | width, mm (in.) |
| Y | = | nozzle expansion factor, dimensionless |
| Greek symbols | ||
| β | = | nozzle diameter to chamber diameter ration, dimensionless |
| ε | = | absolute roughness, mm (ft) |
| ε/Dh | = | relative roughness, dimensionless |
| ρ | = | density, |
| µ | = | kinematic viscosity, Pa⋅s, (lbf⋅s/ft2) |
| Subscripts | ||
| 1 | = | test section upstream |
| 2 | = | test section downstream |
| 5 | = | nozzle upstream |
| 6 | = | nozzle downstream |
| x | = | plane |
References
- Abushakra, B, I.S. Walker, and M.H. Sherman. 2004. Compression effects on pressure loss in flexible HVAC ducts. HVAC&R Research 10(3):275–89.
- ASHRAE. 2017a. Method of Testing to Determine Flow Resistance of HVAC Ducts and Fittings. Standard 120-2017. Atlanta, GA: ASHRAE.
- ASHRAE. 2017b. Duct Fitting Database (DFDB), Version 6.00.05. Atlanta, GA: ASHRAE.
- ASHRAE. 2017c. Handbook of Fundamentals. Chapter 21, Duct design. Atlanta, GA: ASHRAE.
- ASHRAE. 2018. RP-1764. Determine the absolute roughness of phenolic duct. Final report. Atlanta, GA: ASHRAE.
- Culp, C., and D. Cantrill. 2009. Pressure losses in 12”, 14”, and 16” non-metallic flexible ducts with compression and sag. ASHRAE Transactions 115(1):622–28.
- Gibbs, D.C., and S. Idem. 2010. Measured and predicted pressure loss in corrugated spiral duct. ASHRAE Transactions 116(2):380–86.
- Griggs, E.I., W.B. Swim, and G.H. Henderson. 1987. Resistance to flow of round galvanized ducts. ASHRAE Transactions 93(1):3–16.
- Griggs, E.I., and F. Khodabakhsh-Sharifabad. 1992. Flow characteristics in rectangular ducts. ASHRAE Transactions 98(1):116–227.
- Heyt, J.W., and M.J. Diaz. 1975. Pressure drop in spiral flat-oval duct. ASHRAE Transactions 81(2):221–32.
- Hickman, C., B.T. Beck, and B. Babin. 2015. Effect of fittings on volumetric airflow measurements (RP-1245): Single-path duct disturbances. Science and Technology for the Built Environment 21(2):190–206.
- Huebscher, R.G. 1948. Friction equivalents for round, square and rectangular ducts. ASHVE Transactions 54:101–18.
- Hutchison, F.W. 1953. Friction loss in round aluminum ducts. ASHVE Transactions 59:127–38.
- Jones, C.D. 1979. Friction factor and roughness of United Sheet Metal Company spiral duct. United Sheet Metal, Division of United McGill Corp., Westerville, OH (August). Based on data in Friction Loss Tests, United Sheet Metal Company Spiral Duct, Ohio State University.
- Khaire, S., and S. Idem. 2010. Influence of test section entrance conditions on straight flat oval duct apparent relative roughness. ASHRAE Transactions 116(2):371–79.
- Kulkarni, D., S. Khaire, and S. Idem. 2009. Pressure loss of corrugated spiral duct. ASHRAE Transactions 115(1):28–34.
- Kulkarni, D., A.N. Nalla, S. Idem, and K. Gebke. 2012. Laboratory testing of a fabric air dispersion system. ASHRAE Transactions 118(2):484–90.
- Kulkarni, D., J. Cui, and S. Idem. 2013. Computational fluid dynamics studies of developing flows with various entrance geometries. HVAC&R Research 19(1):38–52.
- Leverette, J., K. Gebke and S. Idem. 2014. Pressure and velocity variation in a fabric air dispersion system. HVAC&R Research 20(8):862–74.
- SMACNA. 2015. Phenolic duct construction standards, 1st Ed. Chantilly, VA: Sheet Metal and Air-Conditioning Contractors National Association, Inc. https://www.smacna.org/store/product/.
- Swim, W.B. 1978. Flow losses in rectangular ducts lined with fiber glass. ASHRAE Transactions 84(2):216–26.
- Swim, W.B. 1982. Friction factor and roughness for airflow in plastic pipe. ASHRAE Transactions 88(1)269–84.
- Townsend, B., F. Khodabakhsh, and S. Idem. 1994. Equivalent round diameter of spiral flat oval ducts. ASHRAE Transactions 100(2):389–95.
- Ugursal, A., and C. Culp. 2007. Comparative analysis of CFD ΔP vs. measured ΔP for compressed flexible ducts. ASHRAE Transactions 113(1):462–69.
- Weaver, K., and C. Culp. 2007. Static pressure losses in nonmetallic flexible duct. ASHRAE Transactions 113(2):400–5.