
 ?Mathematical formulae have been encoded as MathML and are displayed in this HTML version using MathJax in order to improve their display. Uncheck the box to turn MathJax off. This feature requires Javascript. Click on a formula to zoom.
Abstract
This is the first journal paper from the ASHRAE research project RP-1747 “Implementation of RP-1547 CO2-based Demand Controlled Ventilation for Multiple Zone HVAC Systems in Direct Digital Control Systems.” HVAC designers face challenges in complying with the ventilation requirements in ASHRAE Standard 62.1 due to the complexity of the ventilation rate procedure (VRP) and the lack of direction on how to appropriately apply demand controlled ventilation (DCV) within the context of the VRP. The RP-1747 project aimed to address those issues by developing and testing DCV control sequences that are practical and implementable in typical single-duct variable air volume (VAV) systems with direct digital control (DDC) Systems. These control sequences were also tested for energy and ventilation performance by using a co-simulation of EnergyPlus and CONTAM coupled by a functional mockup unit (FMU).
This paper presents the simulation-based study of one office building in four climate zones including Miami (1A), Atlanta (3A), Oakland (3C), and Chicago (5A) for both DCV and non-DCV baselines. The ventilation requirements in non-DCV baselines were set following a simplified ASHRAE 62.1 approach and California Title 24. Simulation results show that RP-1747 DCV control logic could lead to 9% to 33% HVAC energy savings on a source energy basis compared with the non-DCV baseline with the simplified ASHRAE 62.1 approach. The simulated hourly outdoor airflow provided met or exceeded the ASHRAE Standard 62.1 ventilation requirement in the four climate zones for 83% to 97% of the time for the simulated building. Transients and simulation artifacts associated with the discretization of time steps appear to account for a large portion of the time steps when the ventilation provided is less than required by the Standard. After applying a tolerance to account for sensor and control error in real life and time averaging as allowed by Standard 62.1, the DCV strategy met ventilation requirements for 96% to 98% of the time. This indicates the RP-1747 DCV control logic achieves good compliance with the ventilation requirements in Standard 62.1.
Introduction
Demand-controlled ventilation (DCV) has proven to be a cost-effective and energy-efficient strategy compared with systems that provide a constant outdoor air ventilation rate. DCV is a ventilation rate control strategy to modulate the volume of fresh air taken into an occupied zone based on the current population of the zone. ASHRAE Standard 62.1 requires that the minimum outdoor air be based on the sum of ventilation rates required to dilute pollutants generated by occupants (e.g., bioeffluents) and building sources (e.g., off-gassing from furniture and other building materials). One way to monitor the concentration of bioeffluents generated by occupants indirectly is to measure zone CO2 concentration since, in general, CO2 generation rate is proportional to odorous bioeffluent generation rates (Lin et al. Citation2013). CO2-based DCV has been popular in the HVAC industry for years and it is mandated in ASHRAE Standard 90.1 for most densely occupied spaces. CO2-based DCV offers the possibility of reducing the energy penalty of over-ventilation during periods of low occupancy, while still ensuring adequate levels of outdoor air for ventilation. Numerous simulation-based studies and some actual field case studies show that CO2-based DCV can offer up to a 60% energy savings compared with constant ventilation rate systems (Mysen et al. Citation2005; Lin et al. Citation2013). summarizes the savings based on a NIST report (Emmerich and Persily Citation2003) and ASHRAE RP-1547 (Lin et al. Citation2013).
Table 1. Energy savings from CO2-based DCV from literature review.
Using CO2-based DCV in simple single zone HVAC systems is relatively well understood and the ASHRAE Standard 62.1 User’s Manual has provided a detailed procedure on how to apply CO2-based DCV in such simple systems since 2004. However, implementation of CO2-based DCV for multiple zone HVAC systems with direct digital controls (DDC) is still challenging due to system complexity. There is a lack of validated control strategies for multiple zone systems in current literature and practice even though there is an increased demand for mechanical and control designers to provide them to meet the requirements of energy standards such as ASHRAE Standard 90.1 and California Title 24.
There are a few CO2-based DCV control strategies for multiple zone HVAC systems in literature and practice including (1) CO2-based DCV control strategy (Stanke Citation2006, Citation2010; Murphy and Bradley Citation2005); (2) DCV control strategy for California Title 24 ventilation (California Energy Commission Citation2008; ASHRAE Citation2018); and (3) Supply air CO2-based DCV control strategy (Warden Citation2004; Nassif Citation2012). As part of ASHRAE research project RP-1547 entitled “CO2-based Demand Controlled Ventilation for Multiple Zone HVAC system,” Lin et al. (Citation2013) assessed these control strategies and concluded that they either do not comply with current ASHRAE Standard 62.1 requirements or cannot guarantee sufficient ventilation for all zones under all occupancy scenarios. Therefore, ASHRAE RP-1547 (Lin et al. Citation2013) proposed three different CO2-based dynamic reset strategies for DCV in multiple-zone HVAC systems as shown in .
Table 2. Three CO2-based dynamic reset strategies proposed by RP-1547 (Lin et al. Citation2013).
As shown in , all three control strategies can reduce energy consumption while meeting ASHRAE Standard 62.1 based on a simulation using EnergyPlus and EES (Lin et al. Citation2013). The CO2-based dynamic reset with zone primary air minimum reset Option 1 shows annual energy cost savings between 24% and 46% compared with a baseline case without DCV for different climates.
However, the CO2-based DCV control strategies for multiple zone HVAC system developed in RP-1547 are very complex and were only tested by the simulation. In particular, the iterations used in the control logic algorithm cannot be implemented in current commercially available DDC systems for HVAC applications. Another concern about the strategies developed in RP-1547 is related to CO2 sensor and air flow sensor accuracy, which were not tested even in a simulation environment. Sensor error has the potential to make control logic inaccurate or unstable. Literature shows that CO2 sensors have 20%–50% bias error if uncalibrated (Apte Citation2006). A laboratory-based study from Iowa Energy center (Shrestha Citation2009) and a Lawrence Berkeley National Laboratory (LBNL) field study (Fisk et al. Citation2010) confirmed that even many new CO2 sensors had error greater than 75 ppm and error greater than 200 ppm were not unusual. LBNL’s study also indicated that many CO2-based demand controlled ventilation systems may, because of poor sensor accuracy, fail to meet the design goals of saving energy while assuring that ventilation rates meet code requirements.
With support from ASHRAE, RP-1747 aims to adapt the DCV logic developed in ASHRAE RP-1547 (Lin et al. Citation2013) into practical, programmable control sequences that are implementable in typical HVAC DDC systems. These control sequences were first tested for energy and ventilation performance and sensitivity to sensor errors by using a co-simulation of EnergyPlus (EnergyPlus Citation2018) and CONTAM (CONTAM Citation2018). Then, they were implemented in a real building control system at Iowa Energy Center’s Energy Resource Station (ERS) to observe the actual stability and performance. The focus of this paper will be only on the simulation study to evaluate energy and ventilation performance from the proposed DCV strategy. The impacts of sensor error and field testing results are presented in other journal papers, and details of RP-1747 can be found in O’Neill et al. (Citation2017).
This rest of this paper is structured as follows. First, a summary of the proposed CO2-based DCV from RP-1747 will be introduced. Then, the proposed co-simulation methodology will be described, followed by a simulation case study of an office building. A detailed analysis of both energy performance and ventilation performance will be provided. Finally, conclusions will be presented.
Summary of the DCV control logic and sequences of operation for a single-path variable air volume (VAV) system
The basic control system for a single path VAV system is shown in . Key components and sensors are:
Fig. 1 VAV control schematic.
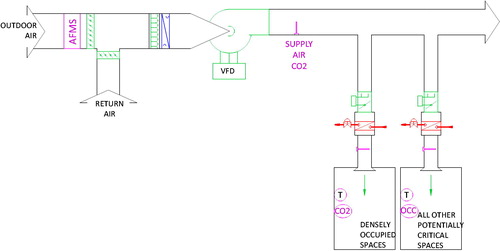
Airflow measuring station (AFMS) across the entire outdoor air intake.
Outdoor air economizer system including return air and outdoor air dampers.
Supply air fan with variable frequency drive.
Supply air CO2 sensor.
VAV boxes with reheat coils and pressure independent digital controls, including supply air temperature sensors as required to perform dual maximum VAV logic (Taylor et al. Citation2012).
Densely occupied zones (as defined by ASHRAE Standard 90.1 and LEED) with CO2 sensors.
Sparsely occupied zones with no additional controls.
Other zones with occupancy sensors.
O’Neill et al. (Citation2017) provided a detailed description of the CO2-based DCV control logic and sequences of operation for a single path VAV system from ASHRAE RP-1747. The proposed control logic is summarized as follows.
Dynamically determine actual zone ventilation needs using occupancy sensors and CO2 sensors, adjusted for zone air distribution effectiveness (Ez) based on supply air temperature and distribution design.
Dynamically determine the required air handling unit (AHU) outdoor airflow rate using the ASHRAE Standard 62.1 Ventilation Rate Procedure (also referred to as the Multiple Spaces Equation) at the system level. This outdoor airflow rate is limited to a design value that is determined by summing the zone ventilation requirements, effectively assuming that the system ventilation efficiency, Ev, is equal to 1.
Reset zone primary airflow minimums using Trim & Respond (T&R) logic (Taylor Citation2015). When the primary air is rich with outdoor air because of economizer operation and at all times for non-critical zones, reduce zone minimums. Otherwise, zone minimums are increased for the critical zone(s) only to ensure required outdoor airflow rate at AHU is never above the design rate.
The proposed control sequences improve upon draft DCV sequences developed by Taylor and Cheng (Citation2014), which broke the logic into zone level and system level calculations. Part of the intent of splitting the logic is to reduce network traffic by avoiding having the system level controllers continuously polling the zone controllers for information, instead of having the zone controllers send ventilation needs upward as needs change. This is the same technique used by RP-1455 Advanced Control Sequences for HVAC Systems (Hydeman and Eubanks Citation2014) to minimize network traffic.
The developed sequences apply to a single-path VAV reheat system with outdoor air economizer and the sensors shown in . Ventilation requirements of Standard 62.1 are calculated dynamically in the control sequences based on real-time sensing of system and occupant conditions and met by varying outdoor air intake and zone minimum airflow setpoints based on Option 1 logic from RP-1547. Rather than requiring minimum airflow setpoints to be fixed and predetermined by the designer, this approach dynamically determines minimum rates that meet Standard 62.1 while minimizing energy use. This also includes dynamic adjustment of zone air distribution effectiveness, which was not addressed in RP-1547. The sequences include diagnostic logic and alarming to assist in real-time fault detection including sensors out of calibration and “rogue zones” that are driving ventilation reset.
The rationale behind the logic is that when primary air is mostly outdoor air due to economizer operation, zone airflow minimums can be very low, all the way down to the zone minimum ventilation rate when supply air is 100% outdoor air. Clearly, this is the most efficient operating condition resulting in the lowest fan energy and reheat energy.
When the economizer is disabled, the zone minimums in the critical zones go the other way: they are increased to increase primary airflow and decrease the required primary outdoor air fraction in the critical zone(s), which increases system ventilation efficiency and ensures that the design minimum outdoor air rate, for which the heating and cooling systems were sized, is not exceeded. It is possible for the minimum airflow in the critical zone to increase to its cooling maximum airflow, resulting in an increase in reheat energy for this zone to avoid overcooling the space. However, this energy penalty should be less than the increase of the outdoor air rate for the whole system since, based on standard economizer logic, the weather must be either very cool or very warm in this condition such that the energy used to condition excess outdoor air will be high. In other words, the logic trades a small increase in reheat energy in the critical zone to avoid a large outdoor air conditioning energy penalty that would result if outdoor air rate is increased to all zones, which will over-ventilate all zones other than the critical zone.
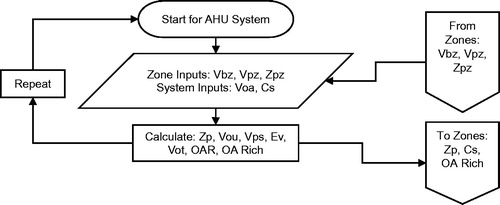
Control logic flow diagram representations
Flow diagram representations of the DCV control logic are presented in through for the different zone-level configurations and in for the air handler level. The logic shown represents the DCV logic only, but does not include the associated zone and air handler control logic. Note also that the logic that resets the zone minimum airflow setpoint using the trim and respond (T&R) sequence is simplified for clarity. The details of the T&R sequence can be found from the ASHRAE Guideline 36 (ASHRAE Citation2018). Parameter definitions are listed as follows:
Fig. 2 Flow chart for zone with CO2 sensors.
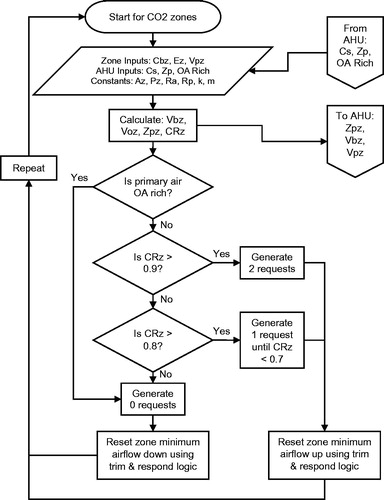
Fig. 3 Flow chart for zone with occupancy sensors.

Fig. 4 Flow chart for zone with no CO2 or occupancy sensors.
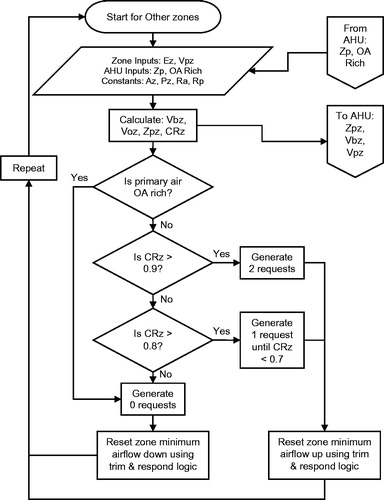
Fig. 5 Flow chart for air handler.
Az = Zone floor area
Cbz = Concentration of CO2 in breathing zone
CRz = Zone criticality ratio, defined as Zpz divided by Zp
Cs = Concentration of CO2 in supply air
Ez = Zone air distribution effectiveness
Ev = System ventilation efficiency
k = CO2 generation rate
m = metabolic rate
OA Rich = Equal to 1 when Voa > Vot, otherwise equal to 0.
OAR = Ratio of Voa to Vot
Pz = Zone population
Ra = Outdoor airflow rate required per unit area
Rp = Outdoor airflow rate required per person
Vbz = Breathing zone outdoor airflow
Voa = Actual outdoor airflow rate
Voz = Zone outdoor airflow
Vot = Outdoor air intake flow
Vou = Uncorrected outdoor airflow
Vps = System primary airflow
Vpz = Zone primary airflow
Zp = Maximum primary outdoor air fraction
Zpz = Zone primary outdoor air fraction
Simulation methodology
The practical control sequences are evaluated through building simulations. We are using a co-simulation framework of EnergyPlus and CONTAM to simulate CO2-based DCV for evaluating energy and ventilation performance. EnergyPlus is used for energy simulation while CONTAM is used for airflow simulation.
EnergyPlus (EnergyPlus Citation2018) is a whole-building simulation program developed by the U.S. Department of Energy. It models heating, cooling, lighting, and ventilating processes in buildings and includes many simulation capabilities, such as time steps of less than one hour, modular systems, multiple zone system airflow, thermal comfort, and natural ventilation. The model can also represent “plug” loads including computers and calculate the direct electrical energy consumption, as well as the effects of heat gains in the building. The model takes as input a description of the building (e.g., geometry, materials, roof type, window type, shading geometry, location, orientation), its usage and internal heat loads (sensible and latent) related to lighting, plug and occupant load, and the HVAC system description, and then computes the energy flows, zonal temperatures, airflows, and comfort levels on sub-hourly intervals for periods of days to years. To ensure the model is realistic, multiple internal load profiles for occupants, lighting, and plug loads are developed and semi-randomly assigned to different zones throughout the year. The impact of occupancy sensors is realistically simulated, for example, lights will shut off when spaces are unoccupied and plug loads will be reduced. This is critical for a realistic simulation.
CONTAM (CONTAM Citation2018) is multi-zone airflow and contaminant transport analysis software developed by U.S. National Institute of Standards and Technology (NIST). It is a widely-used tool for predicting airflows, contaminant concentrations, and personal exposures in buildings. In CONTAM, buildings are represented as networks of connected zones (e.g., rooms) that are modeled as having uniform contaminant concentrations (i.e., well mixed in a given zone).
We first talk about the coupling principle using FMU, and then evaluate three different coupling approaches.
Coupling principle
The functional mock-up interface (FMI) standard is an open and tool-independent standard for exchange of models between tools (FMI Citation2016). FMI defines a C interface that is implemented by an executable called a functional mock-up unit (FMU). NIST has released CONTAM FMU to be imported to EnergyPlus. LBNL implemented FMU in EnergyPlus to enable EnergyPlus to import any FMU.
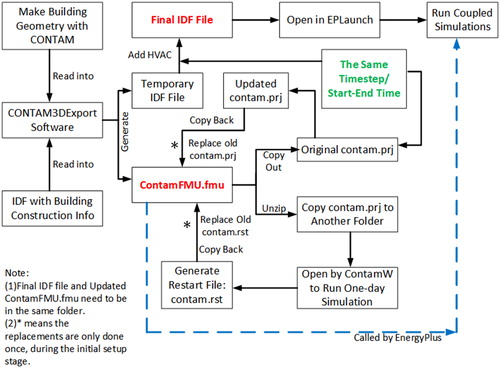
illustrates the coupling procedure for the co-simulation of EnergyPlus and CONTAM using FMU. CONTAM generates an FMU file, a slave program, to be coupled with EnergyPlus. The FMU file contains the CONTAM project file, parameter exchange information, and temporary IDF file. The temporary IDF file needs to be modified to implement a complete VAV system. Before the coupled simulation, one-day simulation in CONTAM alone is required, which can produce the restart file to be used for an initial stage of the coupling. This restart file should be put into the directory where the coupling simulation happens.
Fig. 6 Flow chart for generating coupling files through Functional Mockup Unit (FMU).
Coupling approaches
Three coupling approaches were explored, which are listed in , . The approach-1 is more intuitive with zone CO2 concentration from CONTAM passed to EnergyPlus. However, currently, EnergyPlus does not have an actuator associated to the zone CO2 concentration to receive such CO2 concentration value from CONTAM. It is possible to modify EnergyPlus source codes to implement this approach by creating a new actuator of zone CO2 concentration. Since the focus of ASHRAE RP-1747 is not to enhance the capability for EnergyPlus, this approach was not further explored.
Table 3. Coupling approach 1 (not adopted).
Table 4. Coupling approach 2 (not adopted).
Table 5. Coupling approach 3 (adopted).
The approach-2 aims to implement the CO2 based DCV in CONTAM and pass the resulting zone minimum outdoor air flow rate to EnergyPlus. However, the control implementation in CONTAM is simple and limited. CONTAM can only implement the simple control logic such as the proportional control or proportional-integral control. Furthermore, CONTAM cannot do a thermal simulation. The proposed CO2 based DCV has AHU level controls associated with an air-side economizer which cannot be implemented in CONTAM. This approach was not further explored.
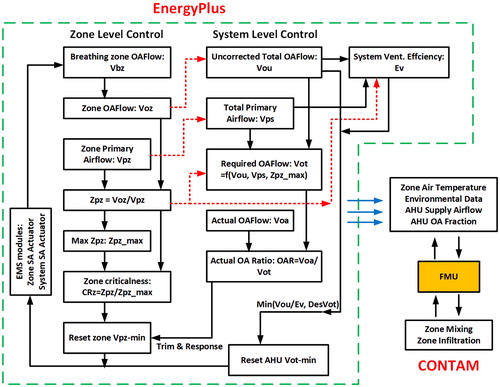
The approach-3 was implemented by passing the zone infiltration flow rate and zone mixing air flow rate from CONTAM to EnergyPlus, and evaluating zone contaminant calculation and controls in EnergyPlus.
illustrates how the different variables are passed at different levels in EnergyPlus for the proposed RP-1747 approach, and how EnergyPlus and CONTAM are coupled with each other.
Fig. 7 Flow chart for coupling between EnergyPlus and CONTAM.
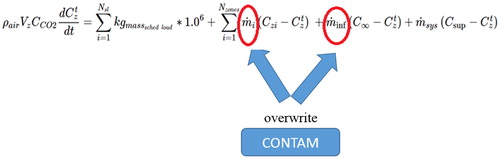
The zone CO2 calculation algorithms are from EnergyPlus (EnergyPlus Citation2018).
(1)
(1)
where
is the sum of scheduled internal carbon dioxide loads;
is the carbon dioxide transfer due to inter-zone mixing (ppm-kg/s);
is the carbon dioxide concentration in the zone air being transferred into the zone (ppm);
is the CO2 transfer due to infiltration (ppm-kg/s);
is the CO2 concentration in outdoor air (ppm);
is the CO2 concentration transfer due to the system supply (ppm-kg/s);
is the CO2 concentration from the AHU supply airstream (ppm);
is the AHU system supply air mass flow rate (kg/s);
is the CO2 storage in current zone air (kg/s);
is the zone CO2 at current time step (ppm);
is the zone air density (kg/m3);
is the zone volume (m3); and
is the CO2 capacity multiplier (dimensionless).
The coupling approach-3 is realized by overwriting two variables in Equation (1): zone infiltration mass flow rate and zone mixing mass flow rate. shows the terms that are overwritten in Equation (1):
Fig. 8 EnergyPlus zone CO2 concentration calculation variables overwritten by CONTAM.
Simulation case study and results
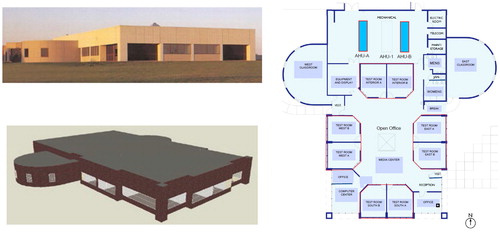
The building for the simulation-based case study is the Iowa Energy Center Energy Resource Station (ERS). The building is part of the Des Moines Area Community College Ankeny campus, and was built for the purposes of examining various energy-efficiency measures and demonstrating innovative HVAC concepts. There are four offices, eight test rooms, two classrooms, and a media center, among others. The facility has a total floor area of 9,208 ft2 (855.45 m2) and a building height of 15 ft (4.57 m). The facility has laboratory-testing capabilities combined with real building characteristics. shows the ERS building outlook, the rendered geometry using one of the EnergyPlus graphical interfaces DesignBuilder, and the floor plan. The ERS building was used for field testing of the proposed RP-1747 control logic in this project (details of the field study will be provided in another paper). There are two single-duct VAV AHUs. The cooling source is an electric chiller, and the heating source is a natural gas boiler. The terminal units are VAV boxes with hot water reheat coils. More details of the ERS building can be found from O’Neill et al. (Citation2017).
Fig. 9 ERS building outlook, rendered geometry, and floor plan.
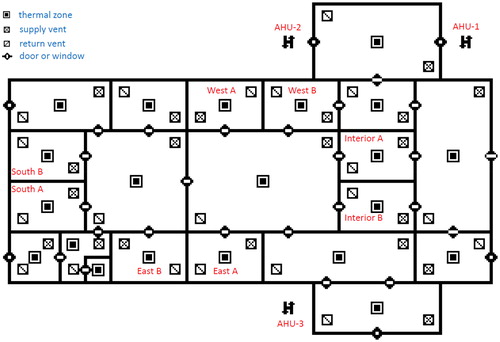
CONTAM model
CONTAM model was built for exchanging air flow data with EnergyPlus. It was created through the pseudo-geometry concept, without drawing the actual building floor plans to scale. It is required to have inputs including the actual thermal zone areas, window sizes and door sizes, and so forth. The AHU system is also required for supply air terminals and return air terminals at each thermal zone. The CONTAM model for ERS building is shown in . The eight thermal zones of interests are denoted in red.
Fig. 10 CONTAM model for ERS building.
EnergyPlus model
An EnergyPlus model is developed for ERS building following the actual HVAC equipment/system, internal heat gain, occupancy, and so forth, implemented in field testing using EnergyPlus version 8.6. presents a summary of the occupancy type and “design” internal loads for the eight zones in the ERS building. Three densely occupied conference rooms with CO2 sensors were simulated by two perimeter zones (East-A and South-B) and one interior zone (Interior-B). Four private offices with occupancy sensors were simulated by three exterior zones (East-B, South-B, West-B) and one interior zone (Interior-A). The eighth test room was used to simulate an open office, without CO2 or occupancy sensors.
Table 6. Summary of occupancy type and internal loads in the ERS building.
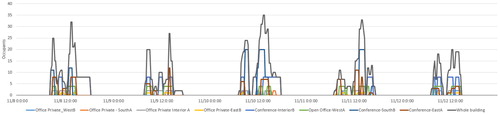
The occupancy schedules for each zone were developed, within user-defined constraints, using a tool developed by LBNL (LBNL Citation2017). Schedules were further modified manually to maintain overall occupant diversity rates for the overall “building.” The occupancy schedules for 15 unique test days are shown in , with values varying on a 15-minute basis. Lighting and equipment gains were scheduled on an On/Off basis to track occupant gains in each zone to simulate the lighting that was controlled by occupancy sensing and computers that go into “sleep” mode when not actively turned off when not active.
Fig. 11 Weekly occupancy schedule.
Dual maximum control logic is used for VAV terminal box control. The economizer control is using a fix dry-bulb temperature following ASHRAE 90.1. The high-limit shutoff temperatures for different climate zones are provided in .
Table 7. Economizer high limit shutoff dry bulb temperatures.
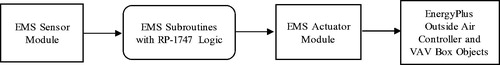
The proposed RP-1747 DCV control strategies were only applied to eight test rooms along with AHUs serving these rooms (i.e., AHU-A and AHU-B) in the EnergyPlus model. For the non-test rooms and associated HVAC equipment and system, the EnergyPlus model was built following the current ERS operation. To implement the proposed RP-1747 control sequence as shown in to , the EnergyPlus EMS module was used. As shown in , the EMS sensor module will get the CO2 concentrations from individual zones, and then such information will be used in the EMS subroutines with RP-1747 control logic. The zone airflow minimum setpoints and the system level minimum ventilation air flow rate setpoint following RP-1747 logic will be passed to the EMS actuator module. Finally, outside air controller and terminal VAV box objects in EnergyPlus will be controlled by the actuators.
Fig. 12 Flow chart for EnergyPlus EMS module with RP-1747 logic.
Simulation time steps in both EnergyPlus and CONTAM were set as 5 minutes. RP-1747 control sequence uses a trim and respond ratio of 5% with an updating frequency of 1 minute. Due to the limitation of EnergyPlus building envelope conduction heat transfer algorithm, it is not feasible to have a time step of 1 min in EnergyPlus. A simple sensitive study with a trim and respond ratio of 5%, 10%, and 12.5% in EnergyPlus was conducted, it was found the impact of this trim and respond ratio is limited on the energy consumption and the zone and system air flow rates with five-minute simulation time step. The trim and respond ratio is set as 12.5% for all simulation studies presented in this report. Some examples of EMS programming in EnergyPlus can be found in O’Neill et al. (Citation2017).
The eight test rooms are assumed to be served by one single duct unit even in reality there are two AHUs. In EnergyPlus simulation, each AHU is controlled to have the same OA fraction with the sum of the outside air flow rates equal to Vot. This Vot is calculated in the EnergyPlus EMS module following RP-1747 DCV control logic with an assumption of one single unit serving all eight zones.
ERS building baselines
Two baselines without DCV for ventilation requirements are considered in this project. One is set up using a simplified compliance approach that has been adopted for ASHRAE 62.1, while another one follows ventilation requirements for California Title 24. The simplified ASHRAE 62.1 approach provides a new method to determine system ventilation efficiency, Ev, and also determine zone minimum primary airflow as Voz * 1.5. The primary goal with this approach, and why it is used as a baseline here, is that it provides a simple, deterministic approach to establish Vot. The zone air flow minimums (Vpz_min) for eight test rooms are listed in with zone air distribution effectiveness (Ez) values of 0.8. The system level outside air minimums for two AHUs are listed in . AHU maximum air flow rates in four different climate zones are provided in .
Table 8. Zone air flow minimums for two baselines without DCV.
Table 9. System outdoor air minimums for two baselines without DCV.
Table 10. AHU Maximum air flow rates in four climate zones.
ERS building simulation results
The EnergyPlus-CONTAM simulations were conducted for four climate zones as listed below. Source energy savings potential from the RP-1747 control logic and associated ventilation performance are compared with baselines. Only HVAC energy consumption from test rooms and associated HVAC equipment are included in the analysis (the ERS facility and model also contain other spaces that are separate from the test rooms and served by independent HVAC equipment). The ventilation performance is evaluated using the hours of under-ventilation and over-ventilation hours compared with the proposed ASHRAE 62.1 simplified approach.
1A (Miami)
3A (Atlanta)
3C (Oakland)
5A (Chicago)
shows the annual HVAC source and site energy saving percentages from the proposed RP-1747 DCV logic compared with two baselines. The site to source energy conversion factors used by EnergyPlus (EnergyPlus Citation2018) are 3.167 for electricity and 1.084 for natural gas, respectively.
Table 11. ERS annual HVAC energy savings from DCV logic compared to baselines.
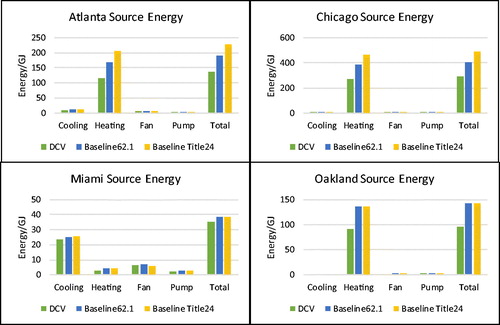
presents the source energy end-use saving potentials from the proposed DCV control strategy (green bar) compared with two baselines. Baselines from Title 24 (yellow bar) consumed more energy compared with those from the proposed ASHRAE simplified 62.1 approach (blue bar). Most of savings are from heating end use. This is because the zone minimums from the RP-1747 DCV logic are dynamic and less than those for the baselines.
Fig. 13 HVAC source energy consumption by end-use and climate zone.
A detailed comparison of the baselines with the case with the RP-1747 DCV logic is included mainly for Chicago in this paper. Only data with AHU ON (i.e., 8 a.m. to 5 p.m. weekdays) was plotted and analyzed. Data from AHU-A and AHU-B are combined for all the plots. For more details for Chicago simulations and other three climate zones, please refer to O’Neill et al. (Citation2017). The proposed RP-1747 control logic performed similarly in all four climate zones.
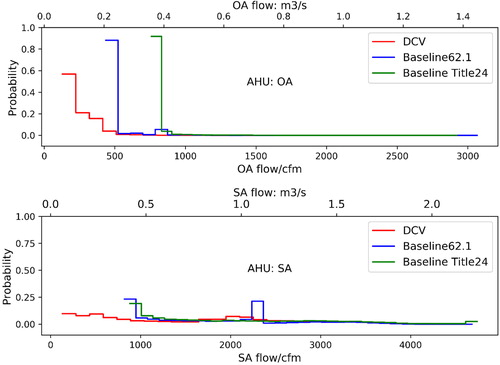
shows the probability density function (PDF) curve plot of the outside air (OA) flow rate and supply air (SA) flow rate for the AHU with comparisons between RP-1747 DCV control logic and two non-DCV baselines. The red lines represent the RP-1747 DCV control logic, the blue lines represent the proposed simplified ASHRAE 62.1 baseline and the green lines represent the Title 24 baseline. From the OA flow PDF curves, compared with two baselines, the outside air flow rates from the RP-1747 DCV logic are less than those from the baselines for the majority of the time. The same pattern can be observed for the total air flow rate, which results in less fan energy, cooling and heating energy consumption as shown in .
Fig. 14 AHU outside air (OA) and supply air (SA) flow probability density function (PDF) curve in Chicago from annual simulations.
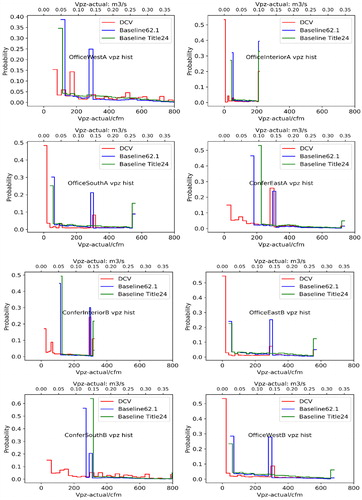
plots the PDF curves for actual zone supply air flow rates for eight test rooms. The red lines denote the RP-1747 DCV case, blue lines denote the baseline following the proposed simplified ASHRAE 62.1 approach and green lines denote the baseline following Title 24. High zone air flow rates in the range of 400 CFM to 840 CFM occur more often for the DCV cases compared with two non-DCV baselines for zone West A open office and zone south B conference. As an open office, west A is assumed to be fully occupied at all times since it is modeled without a CO2 or an occupancy sensor. South B also has one of the highest design occupant densities of the 8 zones (one other conference zone has higher occupant density, but also has higher equipment and lighting internal loads). Both zones are critical zone for most of the time (i.e., CRz > 0.8). Following RP-1747 control logic, this drives the zone minimums up toward the zone maximum flow, which is 831 CFM for zone West A and 756 CFM for zone south B, respectively, in Chicago. The other six zones show a different trend: the DCV cases have less frequent operation at high flow rates compared with the non-DCV baselines.
Fig. 15 Zone air flow rate (Vpz) for eight test rooms in Chicago from annual simulation.
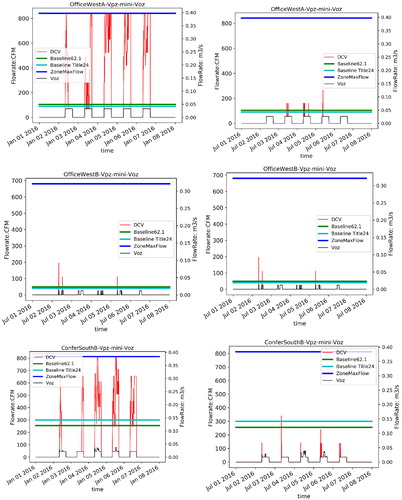
shows the dynamic zone air flow minimums using EnergyPlus EMS module with comparisons of those constant zone minimums from the two baselines. This figure shows that the dynamic zone minimums are smaller than the fixed values from the non-DCV baselines for the majority of the time, which contributes to the savings shown in . Furthermore, as shown in , these zone minimums are still larger than Voz. shows dynamic zone minimums for one week in January and one week in July with fixed zone minimums in baselines and Voz in zone West A open office, zone south B conference, and zone west B, office. These plots illustrate how the proposed RP-1747 control logic dynamically resets the zone minimums between Voz and Vcool_max.
Fig. 16 Zone air flow minimums (Vpz-min) for eight test rooms in Chicago from annual simulations.
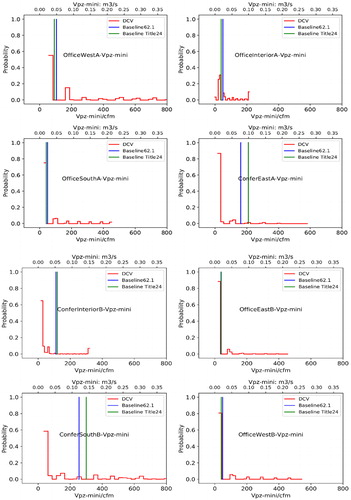
Fig. 17 Zone minimums vs. Voz in Chicago (one week in January and one week in July).
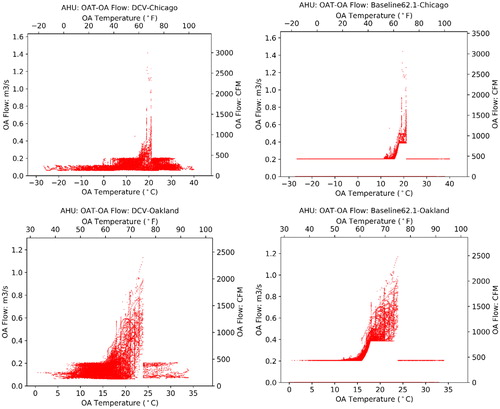
presents scatter plots of outdoor air temperature (OAT) vs. outdoor air flow rate (OA flow) for RP-1747 DCV case and the ASHRAE 62.1 baseline, respectively. The economizer is disabled when OAT is less than 41 °F (5 °C) and higher than 70 °F (21.1 °C) for Chicago following ASHRAE 90.1. The high limit shutoff temperature for Oakland is 75 °F (23.9 °C). AHU minimum outside air flow rates are set as fixed values in the baseline and are dynamically reset in the RP-1747 DCV case. This figure shows that the AHU in the DCV case has significantly lower outdoor air flow rates when not operating in economizer mode.
Fig. 18 Outdoor air temperature vs. outdoor air flow rate in Chicago and Oakland.
To further analyze the ventilation performance for the proposed RP-1747 control logic, the following parameters are analyzed using boxplots from annual simulation data using the Chicago weather file. Boxplots depict median and 25/75th percentile values with whiskers representing the minimum and maximum values. All the boxplots are based on data with a sampling frequency of 5 minutes when AHU is ON.
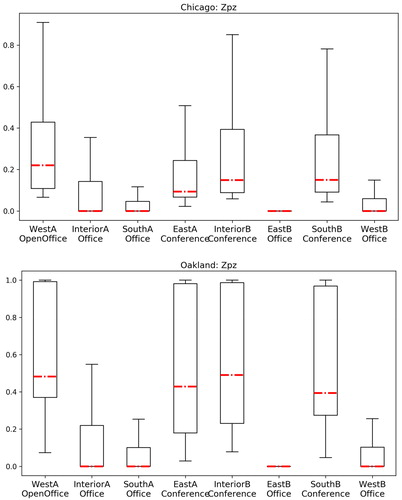
Zone primary air outdoor air fraction, Zpz. shows the boxplots of the zone primary air fraction Zpz in Chicago and Oakland. For Chicago, three conference rooms (South B, Interior B, and East A) with CO2 sensors have higher ranges as expected, with medians from 0.09 to 0.15 and the maximum values extending to 1.0 for South B conference room. The open office room (West A) with the largest simulated area, which is assumed at full design occupancy at all time, has a similar range. The Zpz values for private offices are consistently lower with median values of 0 and the 75th percentile value extending to about 0.15. Please note outliers are not shown in this boxplot. The outliers are defined using the 1.5 interquartile range (IQR) approach (Matlab Citation2017). Any point that is not within +/- 2.7δ (δ-standard deviation) is considered as an outlier. For example, for the East B office in Chicago, the median is 0, and the maximum is 1. About 78% of the time when AHU is on, Zpz in East B is 0. Both 25th and 75th percentiles are 0. Therefore, any non-zero point is considered as an outlier. The zone Zpz values in other climate zones exhibit similar patterns.
Fig. 19 Zone primary outdoor air fraction (Zpz) in Chicago and Oakland.
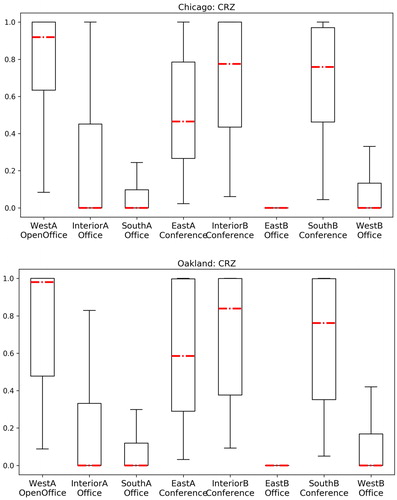
Zone criticality ratio, CRz. shows boxplots of the zone criticality ratio for all eight test rooms in Chicago and Oakland. Conference rooms (South B, Interior B, and East A) and open office room (West A) consistently have higher CRz values than the private offices. The median values for the private offices are equal to zero because these rooms have lower occupant densities and are frequently unpopulated. The zone CRz values in other climate zones exhibit similar patterns.
Fig. 20 Zone criticality ratio (CRz) in Chicago and Oakland.
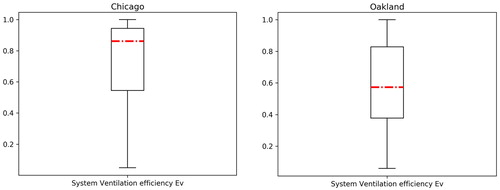
System ventilation efficiency, Ev. The system ventilation efficiency in Chicago and Oakland is shown in . For Chicago, the median value is 0.84 with a minimum of 0.05, a maximum of 1.0, 25th percentile of 0.58 and 75th percentile of 0.94. For Oakland, the median value is 0.57 with a minimum of 0.06, a maximum of 1.0, 25th percentile of 0.38 and 75th percentile of 0.84.
Fig. 21 System ventilation efficiency in Chicago and Oakland.
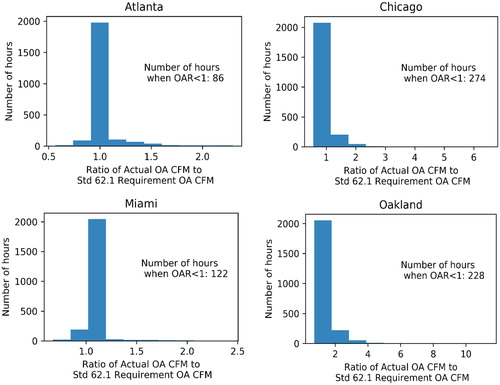
Ratio of actual outside air flow rate (Voa) to ASHRAE Standard 62.1 requirement (Vot), OAR. This ratio is calculated using the actual outdoor airflow (Voa) divided by the required outdoor airflow from Standard 62.1 (Vot), where the value of Vot is limited to the design value (DesVot). shows the number of hours in bins for OAR in four different climate zones. The size of the bin is 0.1. The hourly average data from EnergyPlus outputs with a sampling frequency of 5 minutes are used for these plots. For the majority of hours when AHUs are on, OARs are larger than 1 for these four climate zones. The instances where OAR is less than 1 appears to be due to a modeling convergence issue in EnergyPlus that could be not resolved, rather than a reflection on the ability of the control strategy to comply with Standard 62.1. The EMS module determines the outdoor air requirement and should simply pass that on to the EnergyPlus simulation. These figures also show that there is much more outdoor airflow provided in economizer mode than is required for ventilation.
Fig. 22 Histograms of outdoor air ratio for ERS Building in four climate zones (hourly data).
The previous paragraph and figures depict simulated performance of OAR, where the Vot value is limited to DesVot. A limit is needed in practice for sizing heating and cooling equipment and to avoid controlling the outdoor air damper to conditions beyond the design system capacity. The design value of DesVot is determined by assuming the system ventilation efficiency is equal to 1. Though the actual system ventilation efficiencies will generally be lower than this, this assumption is feasible because of occupant diversity and because the control logic dynamically adjusts zone airflows to help ensure compliance with ventilation requirements. However, to evaluate compliance with Standard 62.1, the outdoor air rate provided is compared to the value of Vot without the DesVot limit. summarizes the simulated compliance rate with Standard 62.1 ventilation requirements in four different climate zones. The selected statistics report compliance rates based on 5-minute interval data as well as hourly averages, as well as rates where Voa is greater or equal than Vot or within 90% of Vot. The rationale of the selection of 90% as a cut-off point is because, in practice, outdoor air flow meters will generally exhibit at least 10% measurement error. A detailed review of the time series simulation data also suggest that a large portion of the time steps where Voa is less than Vot are due to transients (e.g., the start of the day, rapid occupancy changes, etc.) and simulation artifacts associated with the simulation of discrete time steps.
Table 12. Simulated compliance rate with Standard 62.1 ventilation rates for ERS building.
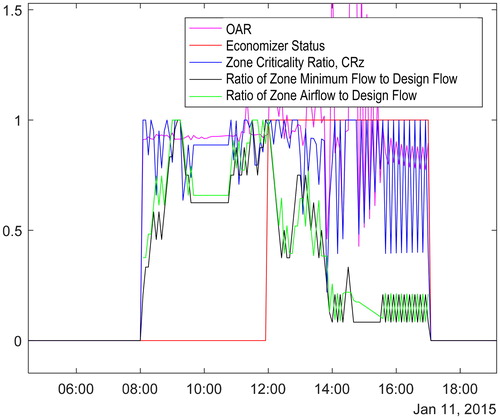
shows an example time series plot of the simulated zone performance for one day in the ERS building in Atlanta. The system OAR and economizer status are shown in pink and red, respectively. The zone is critical for most of the first half of the day, as evidenced by the value of CRz at or near 1. As a result, the DCV logic resets the zone minimum airflow upward for most of the morning and, occasionally, but briefly, all the way to the design airflow. When the OAR exceeds 1 and or the zone is no longer critical, the zone minimum is allowed to reset back downward. The zone minimum airflows generally tend to be much lower than the design zone maximum airflows. Consistent and prolonged operation with zone minimums equal to the design maximums might suggest that the assumption of Ev = 1 for determining the design Vot is too aggressive but that was not observed for the modeled building.
Fig. 23. Time series plot of simulated zone performance – ERS, Office West A, Atlanta.
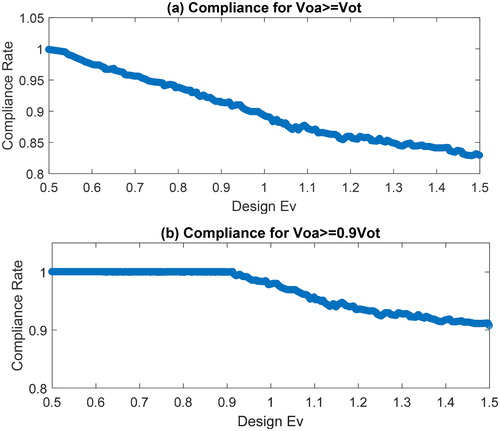
One thousand simulations with different design Ev values with an assumption of a uniform distribution) across a range from 0.5 to 1.5 were conducted using Chicago weather data. shows the sensitivity of system ventilation performance to design values of Ev. In the subplot (a), the compliance rate was calculated based on a frequency percentage of the ratio (greater than or equal to 1.0) of actual outdoor air flow rate to ASHRAE Standard 62.1 Vot requirement without limiting to design Vot using hourly data. In the subplot (b), the compliance rate was calculated based on a frequency percentage of the ratio that is greater than or equal to 0.9). With an Ev of 0.5, 0.75, and 1, the corresponding compliance rate is 99.8%, 93%, and 88%, respectively, including all the transient periods, for the case of Voa > = Vot. The compliance rate is 100%, 100%, and 98%, respectively, for an Ev of 0.5, 0.75, and 1.0, for the case of Voa > = 0.9Vot. The appropriate design value of Ev may depend on the expected occupant diversity of the building and the conservatism of the designer. Lower values of Ev would increase first costs associated with larger HVAC equipment but provide higher compliance rates with Standard 62.1.
Fig. 24 Sensitivity of system ventilation performance to design Ev (Chicago).
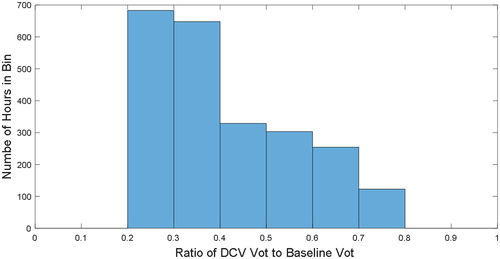
shows a comparison of the outdoor air intake flow between the DCV case and the non-DCV baseline using the proposed simplified 62.1 approach for Chicago. The non-DCV baseline Vot is 582 CFM as listed in . This non-DCV baseline Vot, which is calculated using an Ev of 0.75, is larger than the Design Vot (DesVot) in the proposed DCV case, which is based on an assumed Ev of 1. The minimum outdoor air setpoint is set to be less than or equal to DesVot in RP-1747, which means that Vot from the proposed DCV case will always be less than Vot from the baseline.
Fig. 25 Ratio of required ventilation rate (Vot) between DCV to non-DCV baseline in Chicago.
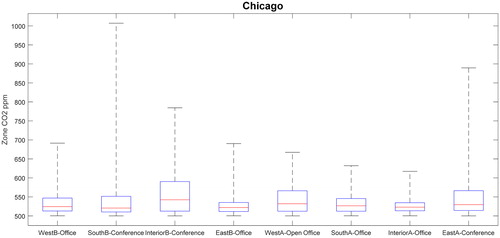
Zone CO2 concentrations. shows boxplots of CO2 concentrations for eight rooms in ERS building from the annual simulation in Chicago when the system is ON. The maximal CO2 concentrations in conference rooms (South B, Interior B, and East A) are consistently higher than those from private offices. The South B conference room CO2 concentrations reach to a maximum of 1,007 ppm with a median of 521 ppm, a 75% percentile of 552 ppm, and a 25% percentile of 510 ppm.
Fig. 26 Zone CO2 concentrations from an annual simulation in Chicago.
Conclusions
The simulation-based study was conducted to investigate the energy and ventilation performance from the proposed CO2-based DCV control sequences in the ASHRAE RP-1747 using a co-simulation of EnergyPlus and CONTAM. Simulation results show that:
RP-1747 DCV control logic resulted in 9% to 33% HVAC energy savings on a source energy basis compared with the non-DCV baseline with the simplified ASHRAE 62.1 approach. The site HVAC energy savings were between 9% and 32%.
RP-1747 DCV control logic resulted in 9% to 41% HVAC energy savings on a source energy basis compared with the non-DCV baseline following Title 24. The site HVAC energy savings were between 9% and 44%.
The simulated hourly outdoor airflow provided met or exceeded the ASHRAE Standard 62.1 ventilation requirement in the four climate zones for 83% to 97% of the time for the simulated building. Transients and simulation artifacts associated with the discretization of time steps appear to account for a large portion of the time steps when the ventilation provided is less than required by the Standard. After applying a tolerance to account for sensor and control error in real life and time averaging as allowed by Standard 62.1, the DCV strategy met ventilation requirements for 96 to 98% of the time. This indicates the RP-1747 DCV control logic achieves good compliance with the ventilation requirements in Standard 62.1.
| NOMENCLATURE | ||
| AHU | = | Air Handling Unit |
| Cbz | = | Zone CO2 concentration, ppm |
| Cs | = | CO2 concentration in the supply air at the air handler, ppm |
| CRz | = | Zone criticality ratio |
| DCV | = | Demand Controlled Ventilation |
| DDC | = | Direct Digital Controls |
| ERS | = | Energy Resource Station |
| Ev | = | System ventilation efficiency |
| Ez | = | Zone air distribution effectiveness |
| FMI | = | Functional Mock-up Interface |
| FMU | = | Functional Mock-up Unit |
| IQR | = | Interquartile Range |
| LBN | = | Lawrence Berkeley National Laboratory |
| NIST | = | National Institute of Standards and Technology |
| OA | = | Outside air |
| = | Probability Density Function | |
| RP | = | Research Project |
| T&R | = | Trim & respond |
| VAV | = | Variable Air Volume |
| Vbz | = | Breathing zone outdoor airflow |
| Voz | = | Required zone outdoor airflow |
| Vcool-max | = | Design zone maximum flow rate |
| Voa | = | Actual outdoor air flow |
| Vot | = | Required outdoor air intake flow |
| Vps | = | System primary airflow |
| Vou | = | Uncorrected outdoor air intake flow |
| Zp | = | Maximum primary outdoor air fraction |
| Zpz | = | Zone primary outdoor air fraction |
Additional information
Funding
Related Research Data
References
- Apte, M.G. 2006. A Review of Demand Control Ventilation. Lawrence Berkeley National Laboratory, LBNL-60170, May 2006.
- ASHRAE. 2018. ASHRAE Guideline 36-2018, High-Performance Sequences of Operation for HVAC Systems. Atlanta, GA: ASHRAE.
- California Energy Commission. 2008. Building Energy Efficiency Standards for Residential and Nonresidential Buildings. California Code of Regulations, Title 24.
- CONTAM. 2018. http://www.bfrl.nist.gov/IAQanalysis/CONTAM/
- Emmerich, S.J., and A.K. Persily. 2003. State-of-the-art Review of CO2 Demand Controlled Ventilation Technology and Application. Diane Publishing, NIST Report 6729.
- EnergyPlus. 2018. http://apps1.eere.energy.gov/buildings/energyplus/
- Fisk, W.J., D.P. Sullivan, D. Faulkner, and E. Eliseeva. 2010. CO2 Monitoring for Demand Controlled Ventilation in Commercial Buildings. Lawrence Berkeley National Laboratory, LBNL -3278E.
- FMI. 2016. https://fmi-standard.org/.
- Hydeman, M., and B. Eubanks. 2014. RP-1455 Final Report Advanced Control Sequences for HVAC Systems. Atlanta, GA: ASHRAE.
- LBNL. 2017. http://occupancysimulator.lbl.gov/
- Lin, X., J. Lau, and G. Yuill. 2013. ASHRAE 1547-RP Final Report CO2-Based Demand Controlled Ventilation for Multiple Zone HVAC Systems. Atlanta, GA: ASHRAE.
- Matlab. 2017. https://www.mathworks.com/
- Murphy, J., and B. Bradley. 2005. CO2-based demand-controlled ventilation with ASHRAE Standard 62.1-2004. Trane Engineers Newsletter, 34(5).
- Mysen, M., S. Berntsen, P. Nafstad, and P.G. Schild. 2005. Occupancy density and benefits of demand-controlled ventilation in Norwegian primary schools. Energy and Buildings 37:1234–40.
- Nassif, N. 2012. Supply air CO2-based demand-controlled ventilation for multi-zone HVAC systems. ASHRAE Transactions 118(2):300–307.
- O’Neill, Z.D., Y. Li, X. Zhou, Y. Li, S. Taylor, and H. Cheng, 2017. ASHRAE RP-1747 implementation of RP-1547 CO2-based demand controlled ventilation for multiple zone HVAC systems in direct digital control systems. ASHRAE Research Project Final Report.
- Shrestha, S.S. 2009. Performance Evaluation of Carbon-Dioxide Sensors used in Building HVAC Applications. Ph. D. Dissertation. Iowa State University, Ames, IA.
- Stanke, D. 2006. System operation: Dynamic reset options. ASHRAE Journal 48(12):18–32.
- Stanke, D. 2010. Dynamic reset for multiple-zone systems. ASHRAE Journal 52(3):22–35.
- Taylor, S. 2015. Resetting setpoints using trim & respond logic. ASHRAE Journal 47(11):52–57.
- Taylor, S., and H. Cheng. 2014. DCV in multiple space systems: Implementation in system design and controls. Presented at ASHRAE Annual Conference, Seattle, June 29, 2014. https://www.ashrae.org/File%20Library/Conferences/Conference%20Resources/Past%20ASHRAE%20Conferences/2014-ASHRAE-Annual-Conference-Technical-Program-Seattle--WA--June-28---July-2--2014.pdf
- Taylor, S., J. Stein, G. Paliaga, and H. Cheng. 2012. Dual maximum VAV box control logic. ASHRAE Journal 54(12):16–24.
- Warden, D. 2004. Supply air CO2 control of minimum outdoor air for multiple space systems. ASHRAE Journal 46(10):25–35.