
 ?Mathematical formulae have been encoded as MathML and are displayed in this HTML version using MathJax in order to improve their display. Uncheck the box to turn MathJax off. This feature requires Javascript. Click on a formula to zoom.
Abstract
A novel method for determining air infiltration for mechanically ventilated buildings is presented in this paper. It consists of a model that uses size-resolved particle concentrations of the outdoor, filtered supply, and exhaust air as input. Based on these continuously measured concentrations, the infiltration rate can be inferred by fitting the experimentally obtained indoor concentrations with theoretically calculated values. The approach was validated by continuous long-term field measurements made over a four-month period. The results show that infiltration rates could be reliably estimated using this method and that the calculated infiltration rates were clearly dependent on the wind speed.
Introduction
Uncontrolled air flows through the building enclosure can have a significant impact on energy consumption for heating and cooling. Moreover, the infiltrating air can transport outdoor contaminants indoors with varying efficiency: particulate pollutants are captured depending on their particle size, whereas gaseous pollutants are generally not removed during infiltration through the building envelope. Infiltration is also important from the viewpoint of security because accidental or intentional releases of toxic or hazardous materials can penetrate indoors with the infiltrating outdoor air (Yuan Citation2000). Although it is likely that concentrations of threat agents would be diluted in outdoor releases due to dispersion to the atmosphere, the number of potentially exposed persons could be very high in densely occupied spaces such as transport hubs.
Because of its importance for energy consumption and indoor air quality, infiltration has been the subject of several studies. There are also standardized methods for measuring infiltration, which are based on pressurization of the building and measuring leak air flow rate as a function of applied pressure difference created by an external fan (ASTM Citation2010; ISO 9972 Citation2015). During the tests, all the openings in the building envelope are closed and mechanical ventilation turned off. There have been numerous studies on the airtightness of buildings and there are very large databases available for residential buildings (Chan et al. Citation2013). The leakage, measured in air changes per hour, at a reference pressure (usually 50 Pa) provides a useful metric to compare the relative airtightness of different buildings. In principle, the air leakage results can be converted to air infiltration rates, provided that the detailed characteristics of the airflow of elements in the building envelope, weather conditions, and terrain are known. However, in practice, it is difficult to have reliable information about all these parameters and therefore simplified models have been developed for calculating infiltration rates (Sherman Citation1987; Jokisalo et al. Citation2009). Because of the simplified assumptions, these models may not necessarily provide a reliable picture of an individual building infiltration.
Another widely used way to determine the air flow rate is the tracer gas method, where a gaseous tracer is released inside the building and its concentration is measured (ASTM Citation2009). The commonly used release methods are decay and constant injection (Persily Citation2015). In the decay method, the release of the tracer gas is stopped and the decay in concentration is measured as a function of time. The air change rate (infiltration + mechanical ventilation) is then determined from the slope of the logarithmic decay curve. In the constant release method, the tracer gas is injected at a constant rate uniformly into the space being tested and its concentration is measured at known times (ASTM Citation2009).
To determine the infiltration rate for buildings with mechanical ventilation, both the total outdoor air exchange rate and mechanical air intake rate need to be measured. The infiltration can then be calculated by subtracting the mechanical air intake rate from the total air flow rate (Persily Citation2015). This requires two different measurements increasing the effort and potentially giving rise to uncertainties due to the inherent inaccuracies of both measurements.
In this study, the air infiltration of a mechanically ventilated building was determined using a novel approach utilizing a simple mass balance model combined with measured size-resolved airborne particle concentrations. The key parameters of the model were obtained from the measured concentrations and from literature. The infiltration rate was then determined using the most penetrating particles for reference when the building was unoccupied and there were no indoor particle sources. The basic idea is to numerically solve the mass balance equation and fit the measured indoor concentrations with the calculated ones to get the infiltration rates. A similar numerical approach was used by Thatcher et al. (Citation2003) to determine size-resolved particle deposition rate and penetration in two homes. However, they used a tracer gas method to measure the air exchange rates, whereas in this study the values of key parameters were estimated from the literature and the calculated infiltration rate was varied to obtain the best fit with the observed data. The feasibility of the current approach was then demonstrated with long-term field measurements. The presented method is especially useful in determining infiltration of large spaces for which the airtightness measurement may be challenging (Szymański et al. Citation2016).
Methods
Theoretical model
The presented method for determining infiltration is based on a relatively simple indoor particle mass balance model that is solved numerically using a forward time-marching method. The inputs for the model are obtained from existing data and from measurements.
Under well-mixed conditions, the mass balance of particulate contaminant concentrations in a mechanically ventilated building without indoor sources can be expressed as (see the notation in ):
(1)
(1)
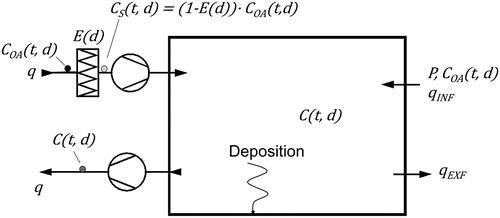
where V is the volume of the building (m3), C (t,d) is the indoor and COA (t,d) the outdoor air particle size-resolved, time-dependent concentration, and q is the mechanical ventilation flow rate (m3/h). P(d) is the contaminant penetration defined as the fraction of particles that enters through the building envelope with the infiltrating air, qINF is the infiltration and qEXF the exfiltration flow rate, and E(d) is the removal efficiency of the supply air filter as a function of particle size d. The term k is the first-order indoor particle deposition loss-rate coefficient (1/h) and takes into consideration both gravitational settling on upwards-facing horizontal surfaces as well as deposition on other surfaces.
Fig. 1 Schematic of the mechanically ventilated space and sampling points for the particle concentrations (no recirculation of room air).
In general, outdoor concentration varies with time such that an analytical solution to EquationEquation (1)(1)
(1) is not possible. Therefore, the indoor concentration was solved numerically using a forward time-marching method with a time step of Δt:
(2)
(2)
(3)
(3)
In this work the outdoor size-resolved particle concentration was obtained from the measurements. A similar approach has previously been employed by Thatcher et al. (Citation2003) for studying the infiltration and deposition of particles using a concentration rebound method in two residences. They used a window-mounted HEPA filter system to pressurize the buildings and bring indoor particle concentrations to a very low level. When the HEPA filter system was turned off, infiltration of particle-laden outdoor air resumed, and the indoor particle concentration rebounded. At the same time, a separate tracer gas method was used to determine the ventilation rate. Thatcher et al. (Citation2003) employed parameter fitting to determine the particle penetration and deposition rate as a function of particle size, while in this study these values are fixed and the fitting is done to find the infiltration rate.
Field measurements
To solve EquationEquation (3)(3)
(3) , the parameters in the model need to be determined. Some of them may be readily available, such as the volume of the building and mechanical ventilation flow rates (e.g., by airflow measurement devices installed in the ductwork), but there are also parameters that need to be determined experimentally or by other means.
The field experiments were conducted in a commercial building in Helsinki, Finland. The building was located 2 km from the city center and 200 m from a main entryway to the city. The four-story building included a gym, offices, storage facilities, and a parking garage, and it was mechanically ventilated with two separate air-handling units. The particle-counting equipment was installed in the air-handling unit serving the offices and the gym, with a total volume of about 4000 m3. The mechanical supply flow rate was 1.0 m3/s, corresponding to an air exchange rate of 0.9 1/h. The air flow rate was estimated from the pressure drop of the supply air filter that was measured in the laboratory before the experiments. Due to short straight lengths after disturbances, it was not possible to find sufficiently uniform air velocity profiles for accurate multipoint traverse in the ventilation system. The ventilation is assumed to be balanced such that the mechanical supply airflow rate is the same as the exhaust flow rate. This also implies that the exfiltration rate equals the infiltration rate; therefore, qEXF=qINF (Hurel et al. Citation2016).
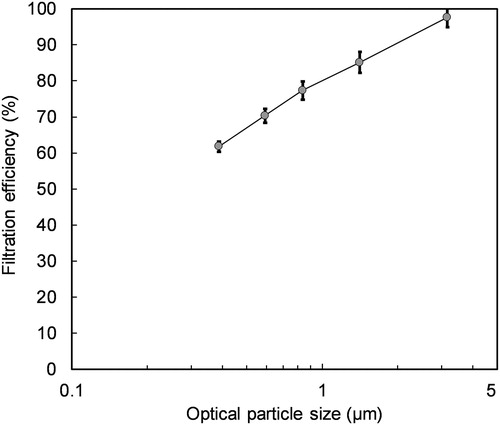
The supply air of the air-handling unit was taken directly from outside at roof level, filtered, and distributed to the ventilated spaces. The exhaust air was discharged outdoors through a heat exchanger without any recirculation. The air-handling unit was equipped with a 592 x 592 mm F7 grade supply-air filter. The measured fractional efficiency of the filter E(d) can be defined from the measured concentrations upstream and downstream from the air filter, as
(4)
(4)
and is shown in ; therefore, substituting (4) into (3) we find:
(5)
(5)
Fig. 2 Measured particle removal efficiency of the supply air filter. Vertical bars indicate standard deviation of the mean over the one-day measurement period.
The measurement system consisted of air sampling, a valve mechanism, a particle counter (Met One 237B), and a computer that controlled the system and recorded the measured data, as described in Kulmala et al. (Citation2016). Isokinetic samples were taken cyclically upstream of the filter (outdoor air), after the filter (supply air), and in the exhaust air. The building had mixing ventilation effectively reducing concentration gradients in the ventilated spaces. Particle losses in smooth ventilation ducts have been found to be strongly size-dependent so that the deposition rate of >5 µm size particles increases rapidly with size while <5 µm particles have deposition velocities of the order 1 mm/s or less (Sippola and Nazaroff Citation2004; Zhao and Chen Citation2006), suggesting that the particle losses in the ductwork are small. Therefore, it is reasonable to assume that the exhaust air sampling point represents the average indoor air concentration fairly well.
The particle counter classifies particles according to their size in six bins, which are > 0.3, 0.5, 0.7, 1, 2, and 5 μm. The sample lines made of 10 mm inner diameter copper tubes were designed so that they were similar in size and length, to minimize errors due to losses. An auxiliary pump with a flow rate of 12 Lpm was used, to increase flushing and reduce particle residence time in the sampling tubes. The sampling line also had a zero filter such that the zero level of the particle counter could be checked during each measurement cycle. Measurements were taken over a period of four months.
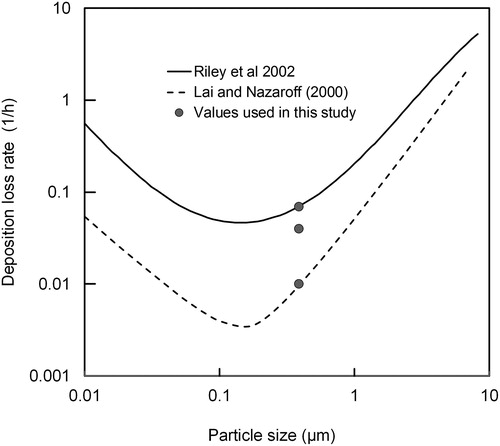
The particle size range used for the analysis was the smallest size range of the measurement device, namely 0.3–0.5 µm. This was advantageous because in this particle size range, penetration through the building envelope is near its maximum and deposition close to its minimum value ( and ). In addition, the sampling losses in this size range were estimated to be 0.14%; therefore, they can be considered negligible (von der Weiden et al. Citation2009).
Fig. 3 Calculated penetration factors for different crack sizes and pressure drops based on the model by Mosley et al. (Citation2001). The particle size range used for analysis has been shown by dashed lines.
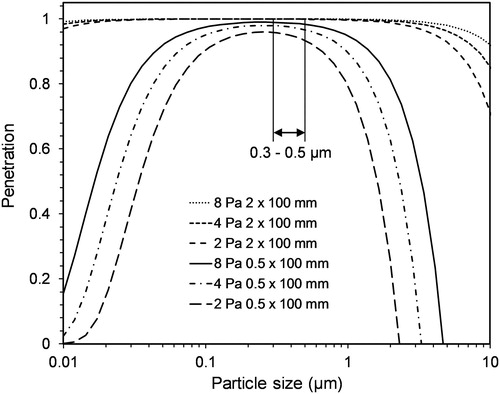
Fig. 4 Deposition loss rate as a function of particle size from previous studies and values used in this work.
Parameter values arising from independent estimation
The remaining unknown values requiring estimation before solving EquationEquation (5)(5)
(5) are the penetration factor P(d) and deposition loss rate of particles on indoor surfaces k. Both the terms are strongly particle size-dependent.
The fractional penetration of particles from outdoors to indoors that is associated with infiltrating airflow has been widely studied both experimentally and theoretically. The experimental work has been performed under laboratory conditions (Mosley et al. Citation2001; Liu and Nazaroff Citation2003; Lai et al. Citation2012) and in real buildings (Tung et al. Citation1999; Thatcher et al. Citation2003; Chen et al. 2012). Theoretical models to describe penetration through cracks have been developed by Mosley et al. (Citation2001), Liu and Nazaroff (Citation2003), and Lai et al. (Citation2012). Although there are differences between the real-life measurements and the theoretical models, all these studies have observed penetration is strongly dependent on particle size such that particles in the size range of 0.1 µm to 0.4 µm penetrate the building envelope most efficiently, while larger particles are trapped mainly due to gravitational settling and smaller ones due to diffusion (Mosley et al. Citation2001; Chen and Zhao Citation2011).
Crack heights in building structures span the range of 0.3 mm to 3 mm (Mosley et al. Citation2001). In this work the penetration was calculated by the model presented by Mosley et al. (Citation2001) using values of 0.5 mm and 2 mm for crack height (see ). As can be seen, the theoretically obtained penetration was close to the same for the smallest measured size range (0.3 µm–0.5 µm) in both cases such that the model calculations were made with an average value of 0.97 for the penetration factor P(d).
The deposition loss factor k has also been the subject of several studies. These studies have shown widely varying values depending on the measurement method, surface roughness, air velocity, and volume and geometry of the test environment. However, it is generally agreed that the deposition as a function of particle size has a v-shaped form, such that ultrafine particles deposit are mainly due to Brownian diffusion, while gravitational settling is important for coarse particles, and the accumulation mode particles deposit least effectively. For this analysis, the deposition loss constant k was estimated to be 0.01 1/h–0.07 1/h for the smallest size range (0.3 µm–0.5 µm). This is the range of values of a theoretical model presented by Lai and Nazaroff (Citation2000) and an experimental curve fit by Riley et al. (Citation2002), illustrated in .
Summary of the values of the parameters in the calculation model
summarizes the values used in the theoretical model presented in EquationEquation (1)(1)
(1) . The table also shows how these values have been deduced.
Table 1. Estimation of parameters in EquationEquation (1)(1)
(1) .
Results and discussion
The periods when the building was unoccupied were used to estimate the infiltration rates. This is because human activities and sources generate particles that are seen in the exhaust air flow and are difficult to differentiate from the outdoor-originated particles.
The predicted particle concentration in the size range of 0.3 µm–0.5 µm was adjusted to the measured one using least squares fit by changing the value of the leak air flow rate in EquationEquation (1)(1)
(1) and keeping other variables constant. shows an example of the curve fitting. In this case the fitting was done for the time period between midnight and 7:00 a.m. when the building was unoccupied and when the weather conditions were relatively s). It is seen that during the night and early morning the predicted particle concentration followed the measured one well (predicted concentration = 1.0 · measured concentration with R2 = 0.92) giving an infiltration flow rate of 0.68 1/h. The average wind speed during the same time period was 5.3 m/s.
Fig. 5 Example of curve fitting for infiltration rate. Particle size range from 0.3 to 0.5 µm.
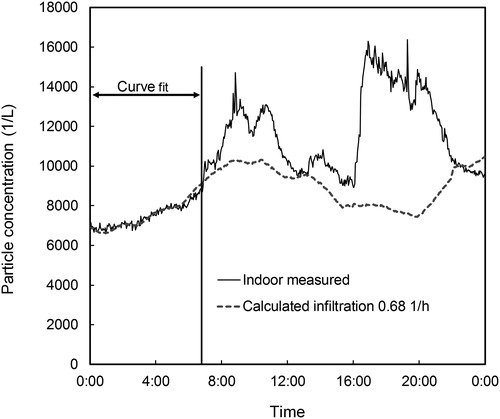
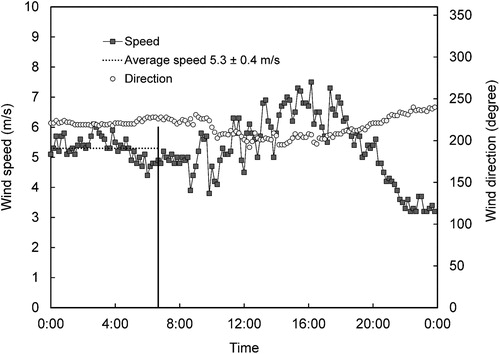
Fig. 6 Wind speed and direction during the example case. During the time frame used for infiltration estimation, the average wind speed was 5.3 m/s with a standard deviation of 0.4 m/s.
shows that the measured daytime indoor concentrations deviated from the predictions likely due to indoor sources—the simulations were made assuming no indoor particle generation. In the evening the measured indoor concentrations began to decrease but at the end of the day differed somewhat from the calculated values. This may be because toward the end of the day the wind velocity decreased, which likely also reduced the infiltration rate, while the calculated values are based on the infiltration rate observed in the morning.
The local meteorological data were obtained from the Finnish Meteorological Institute’s Kumpula weather station which is located a few hundred meters from the measurement site. The weather data values for the wind speed and direction were recorded at 10-minute intervals. The infiltration rates were calculated for cases where the atmospheric conditions were sufficiently stable, so the wind velocity did not change drastically during the calibration period.
shows the infiltration rates determined at different dates against wind speed. The infiltration rate varied between 0.2 1h and 2.2 1/h with an average value of 0.43 1/h. This is quite high, nearly half of the mechanical ventilation flow rate (0.9 1/h) but comparable to that in earlier measurements (Persily Citation2015) where fan-off infiltration rates on the order of 0.5 1/h or higher were observed in office buildings. This was generally a significant portion of the total flow rate.
Fig. 7 Correlation between infiltration rate and wind speed.
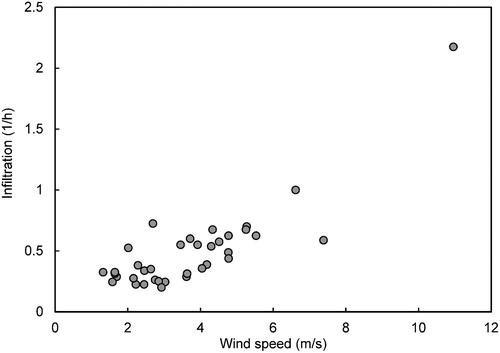
As can be seen in , there is a correlation between the infiltration rate and wind speed. The main driving force for infiltration is the pressure difference between indoors and outdoors caused by the wind and buoyancy forces. According to the ASHRAE handbook (Citation2017), in buoyancy-driven ventilation, the infiltration rate is proportional to ΔT0.5, while in wind-driven ventilation, it is proportional to wind speed. There was no similar correlation between infiltration and temperature difference, suggesting that the infiltration was mostly wind-driven during the field tests. This may be because the measurements were made in summer and autumn and the temperature differences between indoors and outdoors varied only moderately from 0 °C to 16 °C. The wind speed varied from 1.3 m/s to 11 m/s with an average value of 3.7 m/s.
The uncertainties of the presented method are related to the key parameters of the mass balance model such as the penetration factor P(d) and deposition loss k and mechanical ventilation flow rate q. There are relatively few in situ studies on the penetration factor, and they have used different methods, making comparison of the results difficult (Chen and Zhao Citation2011). Moreover, CFD simulations on particle deposition in crack have shown that the penetration factor is not constant but depends on the pressure difference across the building envelope (Popescu and Limam Citation2012). To examine the effect of P(d) on infiltration, calculations were made with different values for the penetration factor. It was found that a 10% decrease in P(d) increased the calculated infiltration rate by 20%. In , the results are shown for the case with P(d) = 0.97, but in more airtight buildings penetration may be lower.
The effect of the deposition loss factor k on the infiltration was studied by calculating the infiltration rates with a range of realistic values. It was found that the change of k from 0.04 1/h to 0.01 1/h reduced the infiltration rate on average only by 3% while the change from 0.04 1/h to 0.07 1/h increased it by just 3%. It can thus be concluded that the uncertainty in the deposition loss factor has a small impact on the calculated infiltration.
Another uncertainty in the studied case was related to the mechanical ventilation flow rates. It was assumed that the mechanical ventilation was balanced and that the flow rates were deemed to be as specified in the design. This assumption was supported by the measured pressure difference over the supply air filter and by the fact that ventilation flows in systems equipped with heat exchangers are usually balanced. However, for more accurate results the supply and exhaust flow rates should be determined more reliably.
Based on the results, it may be concluded that the presented method is a viable option for the determination of infiltration in a mechanically ventilated building. It has several advantages: it is non-intrusive and the measurements can be made in the air-handling unit without interfering with normal activities, it uses ubiquitous ambient particles as tracers, and it can be fully automated. Infiltration depends on wind speed and temperature difference, so that for representative results, long-term measurements should be made across a wide range of weather conditions. This is possible with the aid of the automated measurement system without excessive costs.
The disadvantages of the presented method are related to the uncertainties of the values of P(d) and k, and they may need to be determined experimentally case by case. Particle penetration is also related to the pressure difference across the building envelope which varies according to weather conditions. The dependence is stronger for smaller cracks than larger cracks, so it may be anticipated that leaky buildings, like the studied one, have more constant P(d) close to 1 than airtight ones. However, more research is needed to validate this.
Better understanding of human exposure to outdoor-originated particles is important to more accurately estimate the health risks and the effect of different countermeasures on occupant exposure. The measures to decrease indoor concentration levels can thus be focused more efficiently when the impact of different actions is better known.
Conclusions
Penetration of outdoor particles indoors through infiltration in the building envelope may have a significant impact on indoor concentrations. Particle penetration is also important when considering the protection of building occupants from accidental or intentional outdoor releases of hazardous agents. A key parameter in this process is infiltration. By knowing the infiltration rate and penetration factor of the targeted pollutant, it is possible to estimate the pollutant entry rate into the indoor environment and thus the indoor concentrations. In this work a novel method to determine the infiltration is presented. The method is based on a relatively simple but sufficiently accurate indoor particle concentration model combined with measurements or estimation of the key parameters. Long-term experiments under varying weather conditions have demonstrated the feasibility of the method and its ability to respond to the change in environmental conditions.
The presented model requires as input time- and size-resolved outdoor, supply, and exhaust air particle concentrations. These can be obtained by continuous measurements using a suitable particle counter. The main uncertainties are related to the particle penetration factor through the building envelope as well as the mechanical ventilation flow rates, and to a lesser extent particle deposition rate on indoor surfaces.
The advantage of this novel method is that the measurements can be done in the mechanical rooms where the air-handling units are located without disturbing building operations. They can also be fully automated so that the measurements can be made for a sufficiently long time to determine the effect of varying outdoor weather conditions on infiltration. It may be concluded that the model is generally applicable to the determination of air infiltration of mechanically ventilated buildings, but it is likely that the model parameters must be determined on a case-by-case basis.
Acknowledgments
The field measurements were performed within the EDEN Project (End-user driven DEmo for cbrNe). The later analysis of the results was performed in the PANDHUB Project (Prevention and Management of High Threat Pathogen Incidents in Transport Hubs).
Additional information
Funding
Related Research Data
References
- ASHRAE. 2017. 2017 ASHRAE Handbook Fundamentals. Atlanta, GA: ASHRAE, Inc.
- ASTM. 2009. ASTM Standard E1333-14, Standard Test Method for Determining Air Change in a Single Zone by Means of a Tracer Gas Dilution. West Conshohocken, PA: ASTM International 0 (Reapproved 2006), pp. 1–17. doi:10.1520/E0741-00R06E01.2.
- ASTM. 2010. ASTM Standard E779-10, Standard Test Method for Determining Air Leakage Rate by Fan Pressurization 1. West Conshohocken, PA: ASTM International, pp. 1–11. doi:10.1520/E0779-10.2. FP7 Security.
- Chan, W.R., J. Joh, and M.H. Sherman. 2013. Analysis of air leakage measurements of US houses. Energy and Buildings 66:616–25.
- Chen, C., and B. Zhao. 2011. Review of relationship between indoor and outdoor particles: I/O ratio, infiltration factor and penetration factor. Atmospheric Environment 45:275–88.
- Hurel, N., M. Sherman, and I. Walker. 2016. Sub-additivity in combining infiltration with mechanical ventilation for single zone buildings. Building and Environment 98:89–97.
- ISO 9972. 2015. Thermal Performance of Buildings. Determination of Air Permeability of Buildings. Fan Pressurization Method. Geneva, Switzerland: International Organization for Standardization.
- Jokisalo, J., J. Kurnitski, M. Korpi, T. Kalamees, and J. Vinha. 2009. Building leakage, infiltration, and energy performance analyses for Finnish detached houses. Building and Environment 44:377–87. doi:10.1016/j.buildenv.2008.03.014.
- Kulmala, I., H. Salmela, T. Kalliohaka, T. Zwęgliński, M. Smolarkiewicz, A. Taipale, and J. Kataja. 2016. A tool for determining sheltering efficiency of mechanically ventilated buildings against outdoor hazardous agents. Building and Environment 106:245–53.
- Lai, A.C.K, J. L. S. Fung, M. Li, and K. Y. Leung. 2012. Penetration of fine particles through rough cracks. Atmospheric Environment 60: 436–43.
- Lai, A.C.K., and W.W. Nazaroff. 2000. Modelling indoor particle deposition from turbulent flow onto smooth surfaces. Journal of Aerosol Science 31:463–76.
- Liu, D., and W.W. Nazaroff. 2003. Particle penetration through building cracks. Aerosol Science and Technology 37:565–73.
- Mosley, R.B., D.J. Greenwell, L.E. Sparks, Z. Guo, W.G. Tucker, R. Fortmann, and C. Whitfield. 2001. Penetration of ambient fine particles into the indoor environment. Aerosol Science and Technology 34:127–36.
- Persily, A.K. 2015. Field measurement of ventilation rates. Indoor Air 26:97–111.
- Popescu, L., and K. Limam. 2012. Particle penetration research through buildings cracks. HVAC and R Research 18:312–22.
- Riley, W.J., T.E. McKone, A.C.K. Lai, and W.W. Nazaroff. 2002. Indoor particulate matter of outdoor origin: Importance of size-dependent removal mechanisms. Environmental Science and Technology 36:200–7.
- Sherman, M. 1987. Estimation of infiltration from leakage and climate indicators. Energy and Buildings 10:81–6.
- Sippola, M.R., and W.W. Nazaroff. 2004. Experiments measuring particle deposition from fully developed turbulent flow in ventilation ducts. Aerosol Science and Technology 38:914–25.
- Szymański, M., A. Górka, and R. Górzeński. 2016. Large buildings airtightness measurements using ventilation systems. International Journal of Ventilation 14:395–407.
- Thatcher, T.L., M.M. Lunden, K.L. Revzan, R.G. Sextro, and N.J. Brown. 2003. A concentration rebound method for measuring particle penetration and deposition in the indoor environment. Aerosol Science and Technology 37:847–64.
- Tung, T., C.W. Christopher, Y.H. Chao, and J. Burnett. 1999. A methodology to investigate the particulate penetration coefficient through building shell. Atmospheric Environment 33:881–93.
- von der Weiden, S.L., F. Drewnick, and S. Borrmann. 2009. Particle loss calculator – a new software tool for the assessment of the performance of aerosol inlet systems. Atmospheric Measurement Techniques 2:479–94.
- Yuan, L. 2000. Sheltering effects of buildings from biological weapons. Science & Global Security 8:329–55.
- Zhao, B., and J. Chen. 2006. Numerical analysis of particle deposition in ventilation duct. Building and Environment 41:710–8.