
 ?Mathematical formulae have been encoded as MathML and are displayed in this HTML version using MathJax in order to improve their display. Uncheck the box to turn MathJax off. This feature requires Javascript. Click on a formula to zoom.
Abstract
The controlled microclimate of greenhouses is vital for producing quality yield. This paper investigates the thermal performance of an evaporative cooled greenhouse operating in Qatar. Three design factors affecting the greenhouse thermal performance were assessed, namely the greenhouse geometry, operational parameters, and its geographical location. Geometrical parameters include induction fan elevation, roof shape, and aspect ratio. Operational parameters refer to the air flowrate. The greenhouse location dictates the incident solar intensity that was studied. Computational Fluid Dynamics (CFD) was used to model a typical ASHRAE compliant greenhouse. The simulation results were validated using measured data of a greenhouse inner air temperature, relative humidity, and the global incident solar radiation, showing good agreement. Simulation results showed that induction fans located at or below the crop height resulted in lowering the average temperature of the greenhouse. Doubling of the greenhouse ventilation rate from 20 ACH to 40 ACH further decreased the greenhouse air temperature. Temperature rise due to high incident solar radiation is reduced by increasing the ventilation rates. The uneven span greenhouse roof shape resulted in the lowest average inner temperature. For the same greenhouse floor area and volume, the effect of the aspect ratio showed negligible differences.
Introduction
Greenhouse cultivation is known as “protected agriculture” and “factories for the plant production” (Benli Citation2013; Fatnassi et al. Citation2003; Li and Willits Citation2008). It provides a controlled microclimate environment at the required CO2 concentration levels against harsh outdoor climatic conditions. Currently, the research on sustainable agriculture is focused on energy utilization technologies, the environmental impacts and the cost efficiency (Taki et al. Citation2018). The greenhouse insulates the crop and attempts either to “keep the heat in” or “keep the heat out” creating a favorable microclimate environment for cultivation. Solar energy drives photosynthetic process, which is essential for the plant growth (Ghasemi Mobtaker et al. Citation2016). Air leakages out of the greenhouse must be kept low to secure carbon dioxide supply and avoid mixing (Kuroyanagi Citation2017).
In hot and arid environments, it is challenging to maintain favorable micrometeorological conditions to grow crops for long periods. Geographically, agricultural greenhouses find excellent applications and effectiveness in regions with extreme weather conditions, such as the Middle East and North Africa (MENA) and the Gulf Countries Corporation (GCC) countries. The weather in these regions is characterized by elevated relative humidity values ranging from 43% in June to 72% in December (Ghani et al. Citation2017). Other climatic features include negative water deficit due to scarce precipitation and sandstorms. These harsh conditions prohibit open cultivation and make protected agriculture challenging, forcing countries to rely on food imports.
ASHRAE Handbook provides a detailed description of greenhouse structural characteristics, materials, and methods of climate control (ASHRAE Citation2011). To increase the daily crop exposure to sunlight, the standards recommend an east–west (E–W) orientation of the greenhouse, which leads to a north–south (N–S) oriented gutter. The maximization of the crop exposure to sunlight, especially during the winter season as the daylight period is shorter, would increase the greenhouse yield. To capture an adequate amount of sunlight, the standards also recommended building greenhouses with a roof slope rise-to-run ratio of 1:2. Greenhouse cooling technologies, such as natural and mechanical ventilation, shading techniques, fogging and evaporative cooling were also discussed. Ghani et al. (Citation2019) proposed a standard model design for achieving optimal greenhouse conditions in hot and arid environments. They highlighted that the greenhouse must be E–W oriented for arid and semi-arid areas, with a brick wall on the north side for limiting incident radiation and solar energy, which could overheat the greenhouse micro climate because of excessive heat loads. The authors recommended the dimensions of the greenhouse have a width:length ratio close to 0.5 to avoid uneven horizontal distribution profiles of air velocity, humidity, and temperature along the greenhouse. The study recommended the greenhouse roof shape to be either even span or uneven span.
Greenhouse evaporative cooling system
Evaporative cooling is a widely used technique to control the microclimate of greenhouses. It is the most effective method utilized for cooling greenhouses in regions of ambient temperatures of more than 40 °C (Attar et al. Citation2014; He et al. Citation2014) and operates better in regions of low ambient relative humidity (Abu-Hamdeh and Almitani Citation2016). The system efficiency depends on the humidity ratio. It is proposed for arid (Al-Ismaili and Jayasuriya Citation2016) and semi-arid regions (Ishii et al. Citation2016), where scarcity of water is an obstacle for irrigation. Water is used to wet a medium or a pad. Hence, induced air is cooled as it passes through the wetted medium due to water evaporation by heat absorption (He et al. Citation2017) increasing its relative humidity and lowering the vapor pressure deficit (Abdel-Ghany et al. Citation2016). Evaporative cooling is an environmentally friendly method (Heidarinejad and Bozorgmeh Citation2008) that avoides utilization of chemical refrigerants (Vala et al. Citation2014), reduces CO2 emmsions (Roy and Khurdiya Citation1986) and of low energy consumption (Manassaldi et al. Citation2014).
For cultivation, adquate levels of greenhouse humidity values are considered to be from 45% to 85% (Ozgener and Hepbasli Citation2005). For better tomato yields in desert greenhouses, an evaporative cooling system can be combined with a liquid desiccant air dehumidifier (Lefers et al. Citation2016). Mahmoudi et al. (Citation2010) suggested positioning the dehumidifier upstream from the first evaporator. In humid climates, simultaneous usage of evaporative cooling, shading, and ventilation can provide optimal indoor conditions for all year round flower cultivation (Ganguly et al. Citation2010). In Thailand, the study characterized mechanical ventilation and evaporative cooling systems for tomato cultivation and concluded that in high relative humidity areas, utilization of evaporative methods, without assisting strategies of dehumidification, cannot solely contribute to optimized greenhouse tomato production. Similarly, in Mahasarakham University, corrugated cellulose evaporative pads positioned on a north wall of a silkworm rearing house decreased the temperature from 32 °C to 22 °C and increased the relative humidity from 33% to 82% at a cooling efficiency between 66% and 80.2% (Lertsatitthanakorn et al. Citation2006). Adjustment of the airflow velocities throughout the wetted pad at 1–1.5 m/s can result in saturation rates ranging between 64% and 70% (Franco et al. Citation2010).
Greenhouse evaporative cooling systems can be used as direct or indirect systems (Pakari and Ghani Citation2019a, Citation2019b). Indirect evaporative cooling is favored since the lesser the amount of moisture added to the air, the more efficient the method (Buker and Riffat Citation2015). Direct cooling usually consists of three components, namely wetted medium or pad, water pump, and air fan (Kovačević and Sourbron Citation2017). Wetted mediums, such as the evaporative cooling pads are grid-shaped surfaces made out of plastic (Liao and Chiu Citation2002), organic materials such as aspen and khus (Jain and Hindoliya Citation2011), umice stones and volcanic tuff (Gunhan et al. Citation2007), or wood wool, coconut coir, and stainless steel (Shekhar et al. Citation2016). A one cubic meter of wetted medium can present up to 400 m2 of available evaporative surface (Beshkani and Hosseini Citation2006). The wetted medium thermal performance is mainly affected by its corrugation shape and its width. Their efficiency is increased at low air face velocity (Parks et al. Citation2003). Geo-polymers (inorganic material) can be used as evaporate cooling pads due to their high water retention, good cooling effect, and their excellent capillary lift of water (Emdadi et al. Citation2016). The cooling pads are normally wall mounted. Nevertheless, in Delhi, evaporative cooling pads distributed over the roof and walls, reduced the greenhouse temperature by up to 10 °C lower than the ambient (Kovačević and Sourbron Citation2017) In Sudan, straw cooling pads yielded low air temperature of 25.1 °C to grow cucumber. Such moistened medium offered wide surface for heat and mass exchange offering maximum cooling effect (Ahmed et al. Citation2011). For large water evaporation surface, wet-durable honeycomb paper was used as packing material (Dai and Sumathy Citation2002). The optimium dimensions of the cooling pads were modelled to be of 6 m long, 1.75m high, and 3m wide fitted to a 24 m2 even span greenhouse (Jain and Tiwari Citation2002). Fan-to-pad distance is recommended to be less than 53 m apart (ASHRAE Citation2011). It was found that evaporative cooling boxes present high cooling efficiency rates. The boxes are prefabricated blocks made from high density polyethylene containing two types of 3D mesh that can decrease the greenhouse temperatures by up to 5.5–7.5 °C (Perret et al. Citation2005).
In the arid climate of Iraq, the indirect–direct evaporative cooling, decreased the greenhouse temperature by about 12.1 °C–21.6 °C and improved relative humidity from 8% to 62% opposed to the outside ambient conditions (Aljubury and Ridha Citation2017). In Oman, utilization of two evaporative cooling pads, instead of the conventional single pad cooling system, resulted in lowering the water temperature up to 3 °C and in increasing the relative humidity to 100% (Davies and Paton Citation2005). In Dubai, integrating the evaporative pad cooling system with an array of pipes produced shade and mitigated the buoyancy effects (Sutar and Tiwari Citation1995).
Reduction in energy consumption of the evaporative cooled greenhouses can be achieved by utilizing heat pipes (Romantchik et al. Citation2017). Moreover, the needed power for cooling could be generated by photovoltaic panels (Sonneveld et al. Citation2010; Vox et al. Citation2008; Yildirim and Bilir Citation2017).
Greenhouse Co2 concentration enrichment
Higher concentrations of CO2 within the greenhouse increases the plants growth rates owing to raising net photosynthesis. Plants growth rate benefit from higher CO2 concentration as the greenhouse reaches the growth optimal temperature (Panwar et al. Citation2011; Umeda et al. Citation2015).
For effective CO2 concentration enrichment, the greenhouse should be air tight to avoid CO2 leakages. Supplementary CO2 can be generated from solid CO2 (dry ice), bottled CO2, misting carbonated water (ASHRAE Citation2011), or by free air CO2 enrichment (FACE) systems (Yang et al. Citation2007).
For optimum plant growth rate and maximum yield, a CO2 concentration range of 700 to 900 μL l−1 is recommended (Mortensen Citation1987). CO2 enrichment combined with higher temperature values increased the leaf area and above-ground biomass of the soybeans plants and led to higher seed yield (Xie et al. Citation2005). CO2 concentration enrichment can increase crop yields up to 30% (Becker and Kläring Citation2016). For a greenhouse of an average height of 3 m, air changes range of 6 to 60 air changes per hour (ACH) can develop an average air velocity values from 0.08 to 0.25 m/s within the greenhouse (Radhwan and Fath Citation2005). The investigation revealed that such climatic conditions enhanced CO2 absorption by the leaves; whereas for higher air velocities, the CO2 absorption capability was lower. Moreover, the distribution of the carbon dioxide presents seasonal fluctuations (Hand Citation1984). It is mainly dependent on the dominant wind characteristics of the greenhouse (Miglietta et al. Citation2001; Okada et al. Citation2000), a parameter which was not considered in this study.
This work did not examine the effect of CO2 concentration enrichment on the greenhouse thermal performance as it considers an evaporative cooled greenhouse.
Computational fluid dynamics (CFD) as a design tool
CFD was used to examine agricultural greenhouses ventilation methods and to assess optimal climate control strategies (Bartzanas et al. Citation2004; Boulard et al. Citation2002, Citation2017; Campen and Bot Citation2003; Chu et al. Citation2017; He et al. Citation2017; Kim et al. Citation2017; Mistriotis et al. Citation1997; Ould Khaoua et al. Citation2006; Santolini et al. Citation2017; Teitel et al. Citation2008). CFD was used to investigate the thermal conditions of greenhouses planted with various plants, lettuce (Piscia et al. Citation2012; Zhang et al. Citation2016), tulip flowers (Nayeem & Qayoom Citation2015), ornamental plants (Bouhoun Ali et al. Citation2018), mushrooms (Han et al. Citation2009; Wu et al. Citation2010), and cucumber (Subin et al. Citation2018), on different cultivation seasons (Al-Mulla et al. Citation2018). CFD is an effective tool for assessing and optimizing the greenhouses climate control strategies in cold arid regions such as Mongolia (Ta et al. Citation2015) and in tropical climates like Indonesia (Niam et al. Citation2017). It is used to investigate the effect of solar loading for Chinese solar greenhouses (Tong et al. Citation2018), winter night heating in a Venlo-type heated greenhouses (Libin and Xiushui Citation2011). CFD was used to investigate the effect of certain greenhouse construction elements, such as insect proof screens, on the greenhouse thermal climate and ventilation rates (Flores-Velázquez et al. Citation2012). Moreover, CFD is a valid tool to assess water requirements and adapt suitable irrigation strategies (Kichah et al. Citation2012). Nevertheless, CFD results must be validated by experimental or previously published data. The selection of an appropriate CFD simulation model depends on the greenhouse prevailing climatic conditions (De la Torre-Gea Citation2011). Fluctuations in CFD results depend on the daily climate fluctuations, during cloudy and sunny days, since solar radiation affects the temperature and RH distribution (Xiuhua et al. Citation2011).
In this paper, a three dimension CFD model of an evaporative cooled greenhouse was validated against actual greenhouse measured data and previously published research. Hence, the validated model was used to investigate the effect of different greenhouse design and operational parameters, such as induction fan elevation, the greenhouse geometrical parameters of the roof shape and aspect ratio, different ventilation rates, and incident solar intensities, on its thermal performance.
Materials and methods
Greenhouse numerical modeling
The energy exchange of a typical greenhouse and its environment is a complex process that involves thermal radiation from the soil, atmosphere, greenhouse environment and vegetation, emitted throughout greenhouse structure and cover. The process also involves natural convection of the indoor air and forced convection caused by wind flow and conduction in soil and cover (Ghani et al. Citation2019). As the indoor airflow of the greenhouse is considered to be turbulent, incompressible Reynolds averaged Navier-Stokes equations and the k-ε turbulence model were used for the numerical modeling. The k-ε turbulence model requires reasonable Computing Process Unit (CPU) time and residual values. The greenhouse CFD model solved the continuity equation, momentum conservation equations, and turbulent and dissipated energy (k-ε) conservation equations, for an incompressible fluid in Cartesian coordinates. The CFD model was used to solve mass, momentum, and energy conservation equations in a three dimensions pattern. To assess and optimize the greenhouse microclimate under different design and operating conditions, the following methodology was adapted: (i) assign appropriate boundary conditions to different greenhouse components using available literature and specifications; (ii) solve the momentum, mass, and energy equations with the selected boundary conditions using a finite element method; (iii) assess and validate the numerical model; (iv) vary the structural characteristics and fans operating conditions to optimizes the greenhouse model; and (i) provide greenhouse design recommendations in light of the acquired computational results.
Geometrical configuration
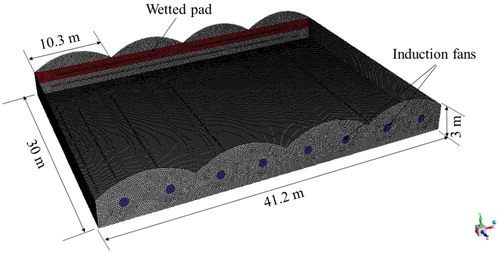
The thermal performance of an arch type four spans greenhouse, considered as a bench mark case, is investigated. lists the geometric characteristics of the greenhouse, the fans and the pads specifications. The fan to pad distance was kept below the maximum ASHRAE recommended fan-to-pad distance of 53 m (ASHRAE Citation2011). The air velocities through the cooling pad assigned a value of 1.7 m/s according to the recommended value by ASHRAE for a typical 150 mm thick corrugated cellulose cooling pad.
Table 1. Geometric characteristics of the greenhouse.
Greenhouse model meshing
As depicted in , the greenhouse was computationally modeled using a total of 4,500,000 tetrahedral elements. The tomato crop was modeled using nearly 1,000,000 elements to represent the crop model. The model total number of cells was selected according to a grid independency study to ensure that the numerical solution results do not depend on the model total mesh size, quantity, or type. A fine meshing scheme was applied to the greenhouse model narrow areas, and a coarser meshing scheme was applied further away.
Fig. 1 Four span Greenhouse Geometry with 16 rows of tomato crop.
Mass, momentum, and energy conservation
In order to examine the flow field, the temperature and relative humidity distribution inside the greenhouse, a full 3D CFD model was developed using a commercially available CFD tool. The greenhouse inner microclimate and the crop type were considered by the simulation. EquationEquation 1(1)
(1) represents the general transport equation for any instantaneous scalar variable denoted by φ (Jakobsen Citation2008).
(1)
(1)
where φ is a general instantaneous scalar variable, Γφ is molecular the diffusion coefficient, and Sφ represents the source term for the remaining processes.
Turbulence modeling
The flow is considered as fully turbulent on account of dimensions and velocities, while buoyancy forces were taken into account as well. The standard k-ε model developed by Launder and Spalding (Citation1974) was used, aiming to compound the large gradients in the solution variables at the near wall region with the wall bounded flow. The reliability of the model was examined for the prediction of natural ventilation and was evaluated in real size systems (Drori et al. Citation2005; Drori and Ziskind Citation2004; Launder and Spalding Citation1974; Ziskind et al. Citation2002).
Greenhouse crop modeling
The greenhouse aerodynamic crop modeling and its dynamic thermal interaction with the greenhouse microclimate is a vital modeling feature. As shown in , the crop leaf resistance presented to the airflow is considered as a momentum sink, while the heat and water vapor balance is considered as a total of latent and sensible heat.
Fig. 2 Crop modeling flow chart
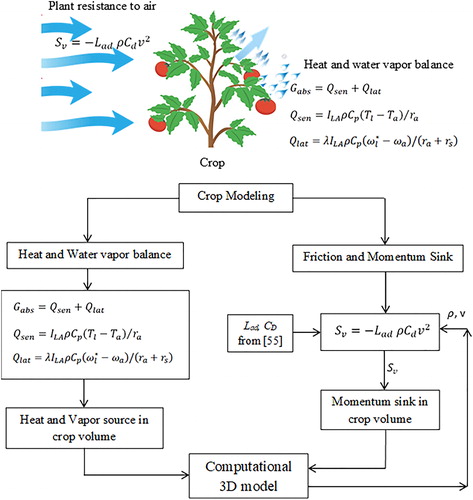
The crop volume is modeled as a porous medium boundary to facilitate assigning of the momentum sink parameters and capture the plant evapotranspiration process. The current numerical study considered a crop planted in 16 parallel rows and occupying a total volume of 1000 m3. User defined functions (UDF), describing the aerodynamic resistance and the heat and water vapor balance, were developed and applied to the crop volume.
Friction forces presented to the airflow induced by the greenhouse fans, as the crop leaves decrease the air momentum inside the greenhouse. The momentum sink (Sv), caused by the drag effect of the crop, was set in the numerical model as a negative source term of the momentum. (Sv) as determined by Darcy-Forchheimer model (Schlichting Citation1974).
Crop evapotranspiration is the process by which water is transferred to the atmosphere by the transpiration from plants. For enhanced greenhouse computational modeling, the crop transpiration, consisting of heat and mass transfer was considered (Bartzanas et al. Citation2004; Boulard and Wang Citation2002; Fatnassi et al. Citation2003; Molina-Aiz et al. Citation2004).
Crop friction and momentum sink model
The presence of a crop in the greenhouse gives rise to a momentum sink due to the friction forces (drag forces) presented by the crop leaves. The aerodynamic behavior of the crop is assimilated to the crop porous medium. Darcy-Forchheimer model, restricted to its inertial terms, is applied to determine the pressure drop of the porous medium (Boulard et al. Citation1999). This pressure drop is represented in the momentum equation as the sink source term (Sv). EquationEquation 2(2)
(2) was used to calculate the momentum sink of the porous medium model of the tomato crop. The equation presents the drag coefficient (Cd) as defined by Boulard et al. (Citation1999) and the leaf array density (Lad) (Roy and Boulard Citation2005).
(2)
(2)
where Lad is the leaf array density, ρ is the air density (kg/m3), Cd is the drag coeffecient of the crop, and v is the characteristic velocity of air (m/s). For mature tomato crop, the values of Lad and Cd, have been experimentally determined as 3 m−1 and 0.32, respectively (Boulard and Wang Citation2002; Haxaire Citation1999).
Crop heat and water vapor balance model
The exchange of heat and water vapor between the crop leaves and the greenhouse environment was modeled by developing a UDF describing the relation in EquationEquations 3–5 (Fatnassi et al. Citation2006). The User-Defined Function (UDF) was developed to calculate the leaf temperature (Tl), the absolute humidity of the leaf (wl), and the transpiration density (φw) for the tomato crop. Roy and Boulard (Citation2005) described the aerodynamic resistance (ra) through the laminar boundary theory and Boulard and Wang (Citation2002) described the stomatal resistance (rs) in relation to the global radiation density (Rg) and the vapor pressure deficit (Da) (Boulard and Wang Citation2002) .EquationEquations 3–5 describe the heat and water vapor balance in relation to the leaf modeling approach. As described by EquationEquation 3(3)
(3) , the crop receives a total net radiative flux (Gabs) comprising convective sensible heat flux (Qsen) and convective heat latent (Qlat). Both Qsen and Qlat are further calculated using EquationEquations 4
(4)
(4) and Equation5
(5)
(5) , taking into account the stomatal and the aerodynamics resistances (rs and ra), respectively, the surface temperature (Tl) , and the air temperature (Ta) in °C (Fluent Inc. Citation2012).
(3)
(3)
(4)
(4)
(5)
(5)
where Gabs is the total net radiative flux (W/m2), Qsen is the convective sensible heat flux (W/m2), ILA is the crop stand leaf area index, Qlat is the convective latent heat (W/m2), Cp is the specific heat of air at constant pressure (J
/kg), ra is the aerodynamics resistance (s/m), rs is the is the stomatal resistance (s/m), ρ is the air density (kg/m3), λ is the latent heat of water vaporization (J/kg), ωl is the absolute humidity at saturation at leaf temperature, ωa is the absolute humidity of greenhouse air, Tl is the surface temperature (
), and Ta is the air temperature (°C).
The convective sensible heat flux Qsen was modeled as a source term of the porous volume of the crop, while the convective latent heat was used to calculate the evaporated flux of water. The evaporated flux was modeled as a source of water from the porous volume of the crop.
Greenhouse radiation model
The discrete ordinates (DO) radiation model was selected to solve EquationEquation 3(3)
(3) using Cartesian coordinates for a large number of discrete solid angles. The advantage of the model lay on the fact that it can provide solutions concerning radiation on semitransparent surfaces, since it can cover a large range of optical thickness. Direction (
) and spectral intensity (Ιλ) were used to describe the radiative transfer as illustrated in EquationEquation 6
(6)
(6) (Fluent Inc. Citation2012).
(6)
(6)
where
is the position vector
is the direction vector,
is the scattering direction vector, σ is Stefan-Boltzmann constant, αλ is the spectral absorption coefficient, Ibλ is the black body intensity (Planck equation), σs is the scattering coefficient, n is the refractive index, φ is the phase function, and Ω is the solid angle radiant (rad). For simplicity, αλ, σs, and n were considered constant for wavelengths between 0.2–3 μm (Kim et al. Citation2008).
Results and discussion
Experimental greenhouse and crop
Field measurement for a typical arch type greenhouse was used to validate the CFD numerical model results. The experimental greenhouse is located at the Al Khalaf farm, Al Khor, Qatar, 25°44′20.3″N, 51°28′23.1″E. This geographical area is known for its harsh climatic conditions. The greenhouse is constructed with four identical arch type roofs with a total area of 1000 m2 planted with tomato crops.
Data collection instruments and methodology
In order to validate the greenhouse computational results, temperature, relative humidity, and solar radiation data were recorded for the typical greenhouse on three different days. The greenhouse climatic data such as air temperature and relative humidity was collected using Fluke 971 Temperature Humidity Meter. The device has a temperature range of −20 to 60
with an accuracy of ±0.5
and a screen resolution of 0.1
and a relative humidity range of 5% to 95% RH with an accuracy of ±2.5%. The incident solar radiation was measured using a Voltcraft PL-110SM pyranometer. The device has a measuring range of 0–1999 W/m2 with an accuracy of ±10W/m2 and a resolution of 1W/m2. A Full Spectrum Quantum Meter, Apogee MQ-500, was utilized to measure the Photo Active Radiation (PAR) inside and outside the greenhouse. The device has calibration uncertainty of ±5%, and a measurement range between 0 and 4000 µmol/m2s. The device measurement repeatability is less than 0.5% (Apogee n.d.). Air temperature and relative humidity were measured every five meters at the greenhouse centerline. The measurements were collected at three different heights along the greenhouse centerline to capture the effect of height variation. Measurements were taken along the main centerline of the greenhouse, starting at the evaporative pad and leading toward the extraction fans, at three different heights of 0.5, 1.0, and 1.5 m. The first measurement point was located 1 m downstream the evaporative pad and the last and fifth point was located 5 m upstream the extraction fans. Collecting the experimental data sets for the measurement points located at the three different heights across the greenhouse spanned a period of 60 minutes. The physical boundary conditions, including external ambient conditions, were measured and averaged for the validation case simulation. details the measured conditions during the three days of measurements. For validating the model, the average recorded values of these conditions were used as the CFD model boundary conditions.
Table 2. Measured ambient conditions.
Greenhouse computational model validation
The computational model was validated against field measurements of a typical arch type greenhouse and a previous published research work of a geometrical similar case (Fidaros et al. Citation2009).
Case study validation
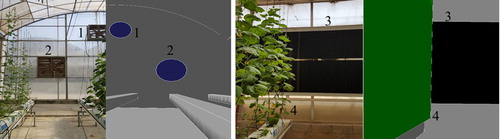
shows a comparison between the physical tested greenhouse geometrical configuration and the numerically modeled geometry used for validation. The actual dimensions of the arch type greenhouse were measured and incorporated in the numerical model. Boundary conditions of walls, supplied air, exhaust air speed, and ambient air conditions were measured on site. The figure illustrates the location of the exhaust fan, evaporative fan, evaporative pad, and the plant row.
Fig. 3 Comparison between measured and simulated temperatures. 1. Exhaust fan. 2. Evaporative fan. 3. Evaporative pad. 4. Plant row.
Temperature validation
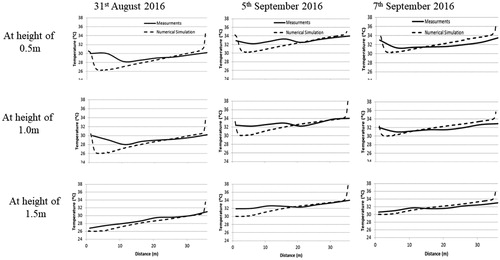
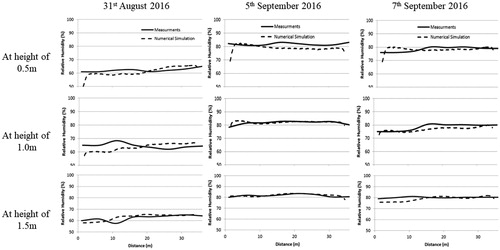
shows a comparison between measured and simulated inner greenhouse temperatures at three elevations on the greenhouse centerline for the three days. Although simulation results showed good agreement with measurements, differences up to 4 were found immediately downstream the wetted pad. The numerical simulation under prediction of temperature is attributed to late mixing between the admitted cold air and the greenhouse inner warmer air. Due to mixing, the difference between measured and simulated temperature values, at the 0.5 m and 1.0 m height, is relatively large in the vicinity immediately downstream the evaporative pad. This difference is smaller when measured at the 1.5 m height as its clears the evaporative pad.
Fig. 4 Comparison between measured and simulated temperatures.
Relative humidity validation
shows the measured and simulated relative humidity distribution at three elevations on the greenhouse centerline for the three days. Simulated relative humidity results were in agreement with measurements. In comparison to the measured RH% values, the numerical simulations under predicted the greenhouse inner relative humidity values by an average of 2%. The simulated relative humidity values at the 0.5 m and 1 m height, in the vicinity immediately downstream the evaporative pad, were low due to late air mixing and the developed low air temperature profile. Hence, the simulated relative humidity profile will increase along the length of the greenhouse and toward the fan.
Fig. 5 Comparison between measured and simulated relative humidity.
Radiation model validation
For the arch type greenhouse, internal and external solar radiation values were measured to validate the results of the radiation numerical model. depicts outside and inside photo active radiation (PAR), as measured and calculated from the CFD model, and the transmitted percentage profile during August 31, 2016. The CFD model simulates the total solar radiation. Typically, about 45% of the solar radiation energy is in the 400–700 nm range. Hence, a conversion factor of 2.1 was used to convert the measured PAR values (µmol/m2s) to total solar radiation (W/m2) (Langhans and Tibbitts Citation1997). The solar radiation model boundary conditions, such as location, date, time, orientation, and the greenhouse wall properties were used in the numerical model. As a result the outside solar radiation and the inside solar radiation, values were calculated by the CFD software.
Fig. 6 Measurements of global incident solar radiation inside and outside the greenhouse.
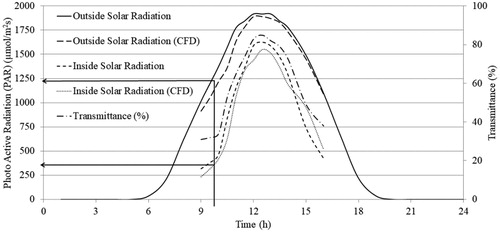
For all time steps simulated between 9.00 a.m. and 4.00 p.m., the average predicted value of the transmitted solar radiation was under predicted by an average error of 5.3%, while the outside solar radiation was under estimated by an average value of 5.6%.
Validation against previously published research
To further gain confidence on the developed greenhouse numerical model, the computational results were validated against previously measured data of a tomato cultivated greenhouse as published by Fidaros et al. (Citation2009). The authors measured the flow pattern of a geometrically similar arch type greenhouse planted with tomato crop. shows velocity magnitude, temperature and relative humidity values plotted against the horizontal axis of the greenhouse, at a height of 0.25 m above the highest level of the crop canopy. The experimental data presented trivial differences in comparison to this study simulation results. The numerical model slightly under predicted the velocity magnitudes. The simulation model overestimated the temperature values measured at the 15 m station on the longitudinal axis by up to (5%). However, the numerical model marginally underestimated the relative humidity.
Fig. 7 Simulated and measured values of velocity, temperature, and relative humidity at line passing at 0.25 m above the crop.
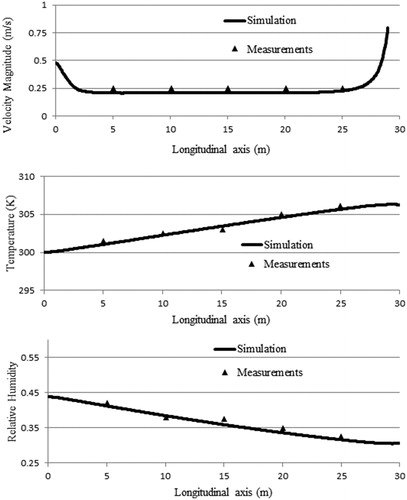
Fig. 8 depicts typical CFD obtained results for the air conditions at a vertical plane inside the greenhouse. The plane shows air temperature contours (oC), velocity contours (m/s), relative humidity contours (%), and velocity vectors for the air as it flows from the wetted pad to the induction fan on the opposite wall. a. Temperature contours (°C). b. Velocity contours (m/s). c. Relative humidity contours (%). d. Velocity vectors (m/s) at a vertical plane at x = 11.7m from the side wall.
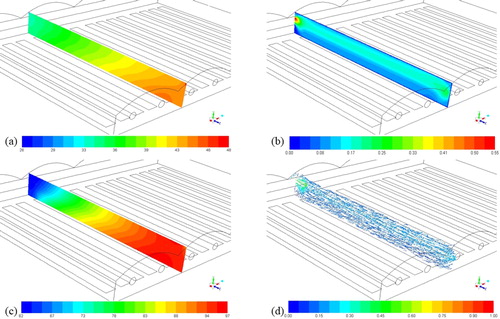
In general, the air velocity, temperature and relative humidity computational results were in agreement with the measured results of Fidaros et al. (Citation2011) published research. The comparison showed similar trends of air velocity, temperature, and relative humidity profiles along the centerline between the cooling pad and the induction fan.
Utilization of the validated greenhouse CFD model
The validated greenhouse numerical model was used to investigate the effect of various greenhouse major design and operational parameters on its thermal performance. As summarized in , a total of 17 numerical simulations were performed to assess the effect of varying extraction fan location (1, 2, and 3 m above the greenhouse floor), the effect of various roof shape (horizontal, even span, and uneven span), the effect of several aspect ratio (1:3 and 1:2 for an arch shape roof), and the effect of increasing the ventilation rate (20, 40, 60, and 80 ACH). In order to perform consistent parametric study, the intake conditions of supplied air from the evaporative pad were kept constant. In practice, supplied air relative humidity can be controlled by changing the thickness of the wet pad. Moreover, the effect of different incident solar radiation (300, 600, and 900 W/m2) on the greenhouse thermal performance was investigated. For each case, the simulation results were shown as temperature contours in () at a longitudinal plane located 11.7 m along the greenhouse x-axis.
Table 3. Summary of different boundary conditions used in parametric study cases.
Numerical simulations boundary conditions
The numerical simulations were carried out at the peak of Qatar’s summer season. To represent the hot and arid environment, a maximum dry bulb temperature of 47 and a Relative Humidity RH% of 27% (0.01822kgw/kga) were considered for the ambient conditions outside the greenhouse. The computational model only considered the interior volume of the greenhouse along with the crop. The outer domain effects were taken into account as measured boundary conditions imposed at the greenhouse walls. The solar radiation model boundary conditions, such as location, date, time, orientation, and the greenhouse wall properties don’t depend on the outer domain. Different solar radiation boundary conditions were simulated with direct normal incident (DNI) ranges from 300–900 W/m2. Moreover, the supplied air entering the greenhouse through the wetted pad was captured as a boundary condition at the pad inner face. Measured air temperature of 34
and relative humidity of 70% (0.02386kgw/kga) were assigned to the pad boundary condition.
Airflow values of 21,000m3/h, 42,000m3/h, 63,000m3/h, and 84,000m3/h were considered at the exit boundary of each span to represent different greenhouse ventilation rates of 20, 40, 60, and 80 ACH, respectively. The greenhouse was assumed to be structurally air tight as it has double doors entrance setup which were kept closed during the experiment. Moreover, the greenhouse induction fans flow rate is greater than any assumed air infiltration values. The greenhouse was constructed out of transparent polycarbonate sheets. The material thermal and optical properties are given in . The study considered a tomato crop height of 1.5 m.
Table 4. Polycarbonate thermal and optical properties (Fernández and Bailey Citation1992).
CFD simulation results and discussion
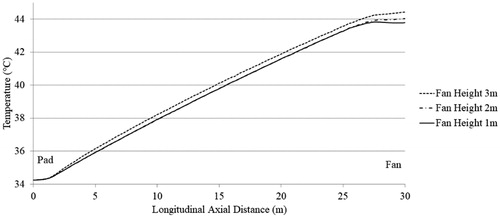
Effect of fan location
The arch type greenhouse induction fans were mounted on the wall opposite to the wetted pads. The fan elevation was vertically measured off the greenhouse floor to the center of the fan. Three fan elevations of 1, 2 and 3m were assessed. shows a longitudinal temperature profile rise of about 8 plotted at height of 1.75 m along the greenhouse centerline spanning from the pad toward the fan. Fans located at an elevation of 1 m and 2 m have an almost identical temperature rise profile, while fans located at an elevation of 3 m developed a slightly higher temperature rise profile by about 0.3
The numerical study concluded that the induction fan elevation in the greenhouse is of a minimal effect on its microclimate.
Fig. 9 Effect of fan elevation on longitudinal temperature rise profile.
Effect of the greenhouse roof shape
The greenhouse roof shape affects the received and the transmitted amount of solar radiation as the exposed roof area changes with roof shape. Moreover, the solar shade produced by the inclination angle of incident solar beam would change with the roof shape. As shown in , four different ASHRAE recommended typical roof shapes of commercial greenhouses were simulated. Namely, arch type roof, horizontal flat roof, even span roof, and an uneven span roof (ASHRAE Citation2011).
Fig. 10 a. Arch type roof greenhouse geometry. b. Horizontal flat roof greenhouse geometry. c. Even span roof greenhouse geometry. d. Uneven span roof greenhouse geometry.
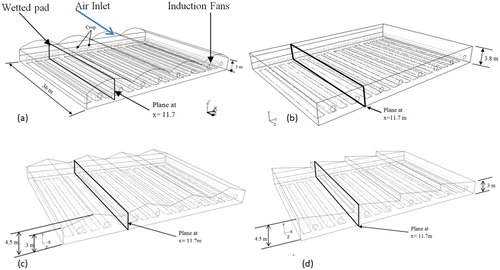
For the four cases of varying the greenhouse roof shapes, the greenhouse volume, foot print area of 1047 m2, aspect ratio of (3:4), and the crop volume were kept constant. A ventilation rate of 20 ACH and an incident solar radiation of 600W/m2 were used as boundary conditions for all the four cases. The crop porous volumes, displayed as blocks (), were modeled as 16 equally spaced parallel rows. Exposed roof areas to the solar radiation depend on the roof shape, as the horizontal roof will have the minimum exposed area followed by the uneven span, even span, and arch shape roof.
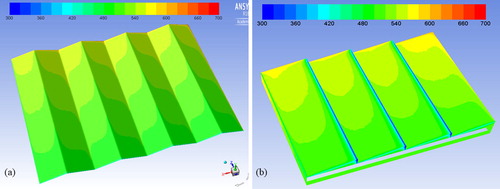
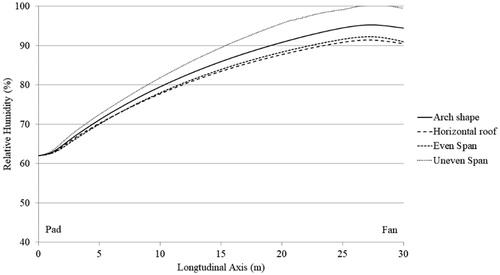
illustrates the temperature rise profiles for the four investigated roof shapes plotted on the horizontal centerline at a height of 1.75 m, which is 0.25 m above the crop. The temperature rise profile of the horizontal flat roof and the even span roof yielded identical results, but the arch shaped roof developed relatively lower temperature rise profile. The uneven span roof greenhouse showed the lowest temperature rise profile among other roof shapes. This mainly attributed to the geometry of the greenhouse roof, as the uneven span roof has less area exposed to the incident solar radiation. The uprights of the uneven span roof shielded the immediate surfaces to its vicinity to about 300 W/m2. depicts the contours of radiation heat flux of the even an uneven span roof shapes. The simulation was performed at an incident solar radiation of 900 W/m2, and the sun direction vector was calculated for the farm location on July 1, at 12.00 p.m. For an even span shaped roof, the radiation heat flux values varied between 410 and 680 W/m2. However, for an uneven span shaped roof, the radiation heat flux ranged between 310 and 633 W/m2.
Fig. 11 Temperature rise profile on a horizontal line at a height of Y-1.75 m for different roof shapes.
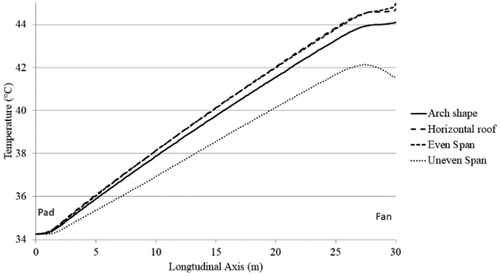
Fig. 12 Comparison between radiation heat flux in W/m2 at roof surface of even and uneven span.
depicts the change of relative humidity RH % at a height of 1.75m from the greenhouse floor. This figure shows that the shape of the roof affects the average relative humidity inside the greenhouse. The uneven span roof resulted in the highest average humidity, while the horizontal roof had the lowest average relative humidity. The uneven span roof shape developed the lowest greenhouse inner temperature and the highest humidity percentage.
Fig. 13 Relative humidity profile on a horizontal line at a height of Y-1.75 m for different roof shapes.
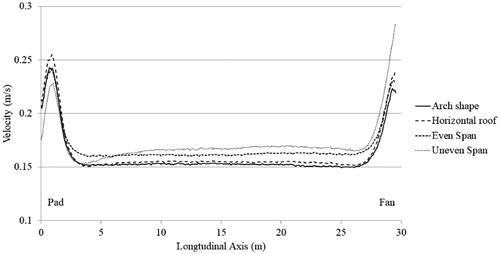
shows the change of velocity along the greenhouse at a height of 1.75 m above its floor. For the different roof shapes, the change of velocity profiles was only noticeable at the first 2.5 m downstream the wetted pad and at the last 2.5 m upstream the induction fan. Typically, air ensued from the wetted pad at a relatively higher velocity and, then, its velocity decreased due to mixing. Then, it accelerated again just downstream from the induction fans. The uneven span roof shape developed the fastest average velocity across the greenhouse.
Fig. 14 Velocity profile on a horizontal line at a height of Y-1.75 m for different roof shapes.
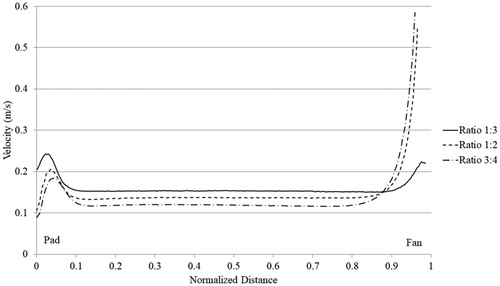
Effect of the greenhouse aspect ratio
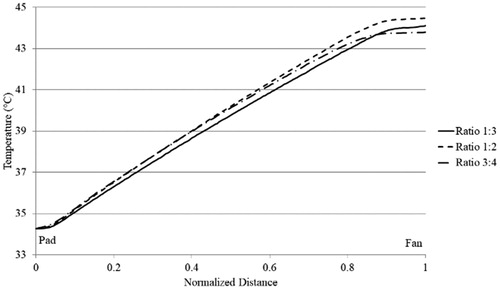
Greenhouses have different aspect ratios according to the available plot area. The greenhouse aspect ratio is defined as the greenhouse span width to its length. For the arched roof greenhouse, three different aspect ratios of (3:4), (1:2), and (1:3) were investigated. Temperature rise profiles for the three cases were plotted in against the normalized axial distance of the greenhouse. The arch type greenhouse with an aspect ratio of 1:3 developed the lowest internal temperatures along its span except for the last one fifth of its length. The temperature gradient rise depicted at the last 20% of its length is attributed to the effect of extraction fan location with respect to the plotted line elevation above the crop row.
Fig. 15 Temperature rise profile at a horizontal line for different aspect ratios.
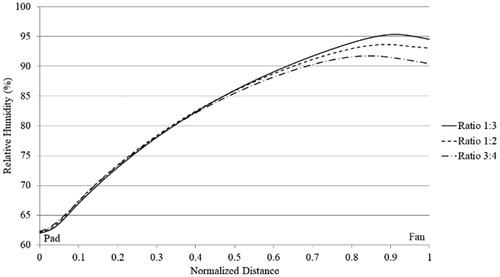
represents the effect of different aspect ratios on the change of relative humidity along the greenhouse. An aspect ratio of 3:4, which developed the shortest greenhouse geometry, yielded the lowest relative humidity value near the greenhouse pad. As the greenhouse volume is fixed for all the aspect ratio studies, the 3:4 aspect ratio has developed the widest front area.
Fig. 16 Relative humidity profile at a horizontal line for different aspect ratios.
The velocity change profiles were plotted in for different aspect ratios. The figure shows that an aspect ratio of 3:4 has resulted in the lowest average velocity along the greenhouse. This result is attributed to the increase of the spacing between the induction fans in comparison to the other investigated greenhouse geometries.
Fig. 17 Velocity profile at a horizontal line for different aspect ratios.
Effect of greenhouse ventilation rate
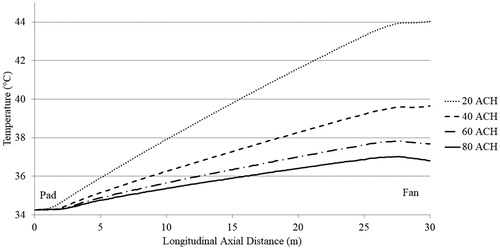
Induction fans, located at 2 m height were modeled to investigate the thermal performance of the greenhouse under different air ventilation rates of 20, 40, 60, and 80 ACH. The simulations were carried out for an arch type greenhouse with an aspect ratio of (3:4) and under incident solar radiation of 600 W/m2. is a plot of the temperature rise profile at the centerline of the greenhouse at an elevation of 1.75 m. For 20 ACH case, the air temperature upstream the extraction fan was about 10 °C higher than the air temperature downstream the cooling pad. When the ventilation rate was doubled to 40 ACH, the air temperature difference was reduced to 5.5 °C indicating a better thermal performance. Increasing the ventilation rate developed a cooler greenhouse and an enhanced temperature profile along the greenhouse.
Fig. 18 Temperature rise profile at a longitudinal line with different ventilation rates.
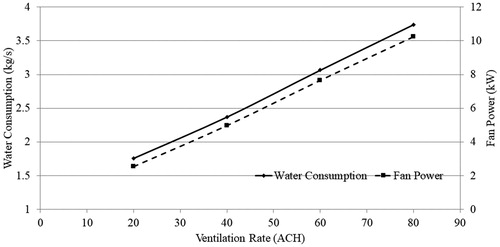
From , it is evident that increasing the ventilation rate decresed the internal temperature throughout the greenhouse. However, increasing the greenhouse ACH carries an inhereted penalty in both water and power consumption. depictes the linear increase of water consumption (kg/s) and electric power (kW) with the increase of the greenhouse ACH. The water consumption in (kg/s) was calculated fom the CFD simulations for the different ACH rates. The water consumption depends on air conditions (water mass fraction and airflow rate) upstream and downstream the cooling pads. Moreover, the electric power consumption in (kW) was calculated from the extraction fan manufacturer spesifications for the assciated airflow rates.
Fig. 19 Effect of increasing greenhouse ACH on water and power consumption.
Effect of incident solar radiation
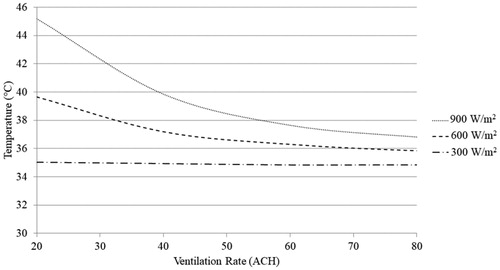
Few studies investigated the difference of the greenhouse inner and outer temperatures when exposed to extended periods of high solar radiation. A temperature difference of about 8 °C was recorded between the inner and outer environment of a small 13 m X 33 m Venlo-type greenhouse at a solar radiation of around 500 W/m2 (Sethi Citation2009). In this study, the effect of solar radiation on the temperature rise profile inside the greenhouse was investigated using three different DNI solar radiation loads of 300, 600, and 900 (W/m2) at four greenhouse ventilation rates of 20, 40, 60, and 80 ACH. As depicted in , the effect of increasing the greenhouse ACH is evident at higher incident solar radiation exposure. Temperature rise due to incident solar radiation is decreased by increasing the greenhouse ventilation rates. The effect of increasing the greenhouse ACH becomes weaker for ventilation rates higher than 60 ACH.
Fig. 20 Temperature rise profile of different ventilation rate and incident solar intensities.
Recommendations for optimizing the greenhouse structural and operational parameters
The study findings highlighted different structural and operating parameters that can enhance the thermal performance of a greenhouse operating in hot and arid environments.
The greenhouse should be designed and positioned to receive minimum level of solar irradiance in the summer and maximum levels in winter. Consequently, reducing the cooling energy required to offset the solar heat load with the potential of making the climate control method more affordable.
Reduce the greenhouse cooling demand by adjusting the intensity of admitted sunlight to suit the crop. This could be achieved by using optics such as negative linear Fresnel lens to distribute sunlight inside the greenhouse (Pakari and Ghani Citation2019c). To maximize yield, grow lights can be used to extend the period of crop light exposure.
An East West (E-W) orientation for greenhouses (Edwards and Lake Citation1965) and glasshouses (Jain and Tiwari Citation2002) is recommended.
Uneven span greenhouse yields a better thermal performance in hot and arid environments as the exposed roof area is less and the straight face of the roof will further shade the greenhouse.
Long greenhouses develop undesired air and temperature profiles, and consequently additional evaporative cooling pads will be required for controlling the indoor climate (Ali et al. Citation1990). This study found that a greenhouse with an aspect ratio of 1:3 will have a lower temperature distribution along 80% of its length. A slight increase in temperature profile is captured at the last 20% of its length.
The greenhouse prevailing air velocity and its ACH are significant parameters for plant growth (Ould Khaoua et al. Citation2006). This study found that increasing the ventilation rate yielded a cooler greenhouse and an enhanced temperature profile along the greenhouse. Temperature rise profile due to incident solar radiation can be decreased by increasing the ventilation rate. However, the effect of increasing the ACH becomes weaker for ventilation rates higher than 60 ACH which is in agreement with other research findings (Perret et al. Citation2005).
The greenhouse evaporative cooling system can lower its inner temperature by 3 °C (Kittas et al. Citation2003) and up to 10 °C (Aljubury and Ridha Citation2017) with the a cooling system efficiency of 80%.
Summary and discussion
This paper presented a validated numerical investigation of the thermal performance of an evaporative cooled greenhouse in the hot and arid environments of Qatar. A 3D CFD greenhouse model with crop and radiation simulation was developed. The numerical simulation results were validated against actual measured data of a full scale greenhouse in Alkhor, Qatar. Measured and simulated values for the greenhouse inner air temperature, relative humidity and radiation showed good agreement. Lowest average temperature could be achieved when the induction fans were located at a position not higher than crop height. The uneven span roof greenhouse was found to yield the lowest solar radiation exposure and transmissivity. For the same greenhouse volume and foot print area, the aspect ratio effect was studied. The lowest temperature profiles were associated with greenhouses of an aspect ratio of 1:3. Significant changes in the greenhouse inner average temperature and air distribution occurred when changing its ventilation rates. Increasing the ventilation rate yielded a cooler greenhouse and an enhanced temperature profile along the greenhouse. The temperature rise due to incident solar radiation can be decreased by increasing the ventilation rate. The effect of increasing the ACH becomes weaker for ventilation rates higher than 60 ACH. It is envisaged that the presented CFD model can aid the greenhouse designers and operators to modify existing structures and crop management practices for better thermal performance.
Additional information
Funding
Related Research Data
References
- Abdel-Ghany, A. M., I.M. Al-Helal, P. Picuno, and M.R. Shady. 2016. Modified plastic net-houses as alternative agricultural structures for saving energy and water in hot and sunny regions. Renewable Energy 93:332–9. doi:10.1016/j.renene.2016.02.084
- Abu-Hamdeh, N. H., and K.H. Almitani. 2016. Solar liquid desiccant regeneration and nanofluids in evaporative cooling for greenhouse food production in Saudi Arabia. Solar Energy 134:202–10. doi:10.1016/j.solener.2016.04.048
- Ahmed, E.M., O. Abaas, M. Ahmed, and M.R. Ismail. 2011. Performance evaluation of three different types of local evaporative cooling pads in greenhouses in Sudan. Saudi Journal of Biological Sciences 18(1):45–51. doi:10.1016/j.sjbs.2010.09.005
- Al-Ismaili, A. M., and H. Jayasuriya. 2016. Seawater greenhouse in Oman: A sustainable technique for freshwater conservation and production. Renewable and Sustainable Energy Reviews 54:653–64. doi:10.1016/j.rser.2015.10.016
- Al-Mulla, Y.A., M.I. Al-Balushi, H.A. Al-Busaidi, A.A. Al-Mahdouri, C. Kittas, and N. Katsoulas. 2018. Analysis of microclimate and cucumber fruit yield in a screenhouse and an evaporatively cooled greenhouse in a semi-arid location. Transactions of the ASABE 61(2):619–29. doi:10.13031/trans.12144
- Ali, H.M., S. Moustafa, and H. El-Mansy. 1990. An efficient greenhouse design for hot climates. Energy Conversion and Management 30(4):433–7. doi:10.1016/0196-8904(90)90044-Y
- Aljubury, I.M.A., and H.D. Ridha. 2017. Enhancement of evaporative cooling system in a greenhouse using geothermal energy. Renewable Energy 111:321–31. doi:10.1016/J.RENENE.2017.03.080
- Apogee. (n.d.). MQ-500 Full-spectrum Quantum Sensor. doi:https://www.apogeeinstruments.com/mq-500-full-spectrum-quantum-meter/
- ASHRAE. 2011. ASHRAE Handbook - HVAC Applications. American Society of Heating. Atlanta: ASHRAE.
- Attar, I., N. Naili, N. Khalifa, M. Hazami, M. Lazaar, and A. Farhat. 2014. Experimental study of an air conditioning system to control a greenhouse microclimate. Energy Conversion and Management 79:543–53. doi:10.1016/j.enconman.2013.12.023
- Bartzanas, T., T. Boulard, and C. Kittas. 2004. Effect of vent arrangement on windward ventilation of a tunnel greenhouse. Biosystems Engineering 88(4)479–90. doi:10.1016/J.BIOSYSTEMSENG.2003.10.006
- Becker, C., and H.-P. Kläring. 2016. CO2 enrichment can produce high red leaf lettuce yield while increasing most flavonoid glycoside and some caffeic acid derivative concentrations. Food Chemistry 199:736–45. doi:10.1016/J.FOODCHEM.2015.12.059
- Benli, H. 2013. A performance comparison between a horizontal source and a vertical source heat pump systems for a greenhouse heating in the mild climate Elaziğ, Turkey. Applied Thermal Engineering 50(1):197–206. doi:10.1016/j.applthermaleng.2012.06.005
- Beshkani, A., and R. Hosseini. 2006. Numerical modeling of rigid media evaporative cooler. Applied Thermal Engineering 26(5–6):636–43. doi:10.1016/j.applthermaleng.2005.06.006
- Bouhoun Ali, H., P.-E. Bournet, P. Cannavo, and E. Chantoiseau. 2018. Development of a CFD crop submodel for simulating microclimate and transpiration of ornamental plants grown in a greenhouse under water restriction. Computers and Electronics in Agriculture 149:26–40. doi:10.1016/J.COMPAG.2017.06.021
- Boulard, T., R. Haxaire, M.A. Lamrani, J.C. Roy, and A. Jaffrin. 1999. Characterization and modelling of the air fluxes induced by natural ventilation in a greenhouse. Journal of Agricultural Engineering Research 74(2):135–44. doi:10.1006/jaer.1999.0442
- Boulard, T., C. Kittas, J.C. Roy, and S. Wang. 2002. SE—Structures and environment: convective and ventilation transfers in greenhouses, part 2: Determination of the distributed greenhouse climate. Biosystems Engineering 83(2):129–47. doi:10.1006/BIOE.2002.0114
- Boulard, T., J.-C. Roy, J.-B. Pouillard, H. Fatnassi, and A. Grisey. 2017. Modelling of micrometeorology, canopy transpiration and photosynthesis in a closed greenhouse using computational fluid dynamics. Biosystems Engineering 158:110–33. doi:10.1016/J.BIOSYSTEMSENG.2017.04.001
- Boulard, T., and S. Wang. 2002. Experimental and numerical studies on the heterogeneity of crop transpiration in a plastic tunnel. Computers and Electronics in Agriculture 34(1–3):173–90. doi:10.1016/S0168-1699(01)00186-7
- Buker, M.S., and S.B. Riffat. 2015. Recent developments in solar assisted liquid desiccant evaporative cooling technology—A review. Energy and Buildings 96:95–108. doi:10.1016/j.enbuild.2015.03.020
- Campen, J. ., and G.P. Bot. 2003. Determination of greenhouse-specific aspects of ventilation using three-dimensional computational fluid dynamics. Biosystems Engineering 84(1):69–77. doi:10.1016/S1537-5110(02)00221-0
- Chu, C.-R., T.-W. Lan, R.-K. Tasi, T.-R. Wu, and C.-K. Yang. 2017. Wind-driven natural ventilation of greenhouses with vegetation. Biosystems Engineering 164:221–34. doi:10.1016/J.BIOSYSTEMSENG.2017.10.008
- Dai, Y.J., and K. Sumathy. 2002. Theoretical study on a cross-flow direct evaporative cooler using honeycomb paper as packing material. Applied Thermal Engineering 22(13):1417–30. doi:10.1016/S1359-4311(02)00069-8
- Davies, P.A., and C. Paton. 2005. The Seawater Greenhouse in the United Arab Emirates: Thermal modelling and evaluation of design options. Desalination 173:103–11. doi:10.1016/j.desa1.2004.06.211
- De la Torre-Gea, G. 2011. Computational fluid dynamics in greenhouses: A review. African Journal of Biotechnology 10(77):17651–17662. doi:10.5897/AJB10.2488
- Drori, U., V. Dubovsky, and G. Ziskind. 2005. Experimental verification of induced ventilation. Journal of Environmental Engineering 131(5):820–6. doi:10.1061/(ASCE)0733-9372(2005)131:5(820)
- Drori, U., and G. Ziskind. 2004. Induced ventilation of a one-story real-size building. Energy and Buildings 36(9):881–90. doi:10.1016/j.enbuild.2004.02.006
- Edwards, R.I., and J.V. Lake. 1965. Transmission of solar radiation in a large-span East-West glasshouse. Journal of Agricultural Engineering Research 10(2):125–31. doi:10.1016/0021-8634(65)90061-2
- Emdadi, Z., N. Asim, M. Ambar Yarmo, R. Shamsudin, M. Mohammad, and K. Sopian. 2016. Green material prospects for passive evaporative cooling systems: Geopolymers. Energies 9(0 ):586. doi:10.3390/en9080586
- Fatnassi, H., T. Boulard, and L. Bouirden. 2003. Simulation of climatic conditions in full-scale greenhouse fitted with insect-proof screens. Agricultural and Forest Meteorology 118 (1):97–111. doi:10.1016/S0168-1923(03)00071-6
- Fatnassi, H., T. Boulard, C. Poncet, and M. Chave. 2006. Optimisation of greenhouse insect screening with computational fluid dynamics. Biosystems Engineering 93(3):301–12. doi:10.1016/j.biosystemseng.2005.11.014
- Fernández, J. E., and B.J. Bailey. 1992. Measurement and prediction of greenhouse ventilation rates. Agricultural and Forest Meteorology, 58(3–4), 229–245. doi:10.1016/0168-1923(92)90063-A
- Fidaros, D., C. Baxevanou, T. Bartzanas, and C. Kittas. 2009. Investigation of flow patterns in a greenhouse with mechanically assisted ventilation. Acta Horticulturae 893(June):645–52.
- Fidaros, D., C. Baxevanou, T. Bartzanas, and C. Kittas. 2011. Investigation of flow patterns in a greenhouse with mechanically assisted ventilation. Acta Horticulturae 893:645–52. doi:10.17660/ActaHortic.2011.893.68
- Flores-Velázquez, J., G. De La Torre-Gea, E. Rico-García, I.L. López-Cruz, and A. Rojano-Aguilar. 2012. Advances in Computational Fluid Dynamics Applied to the Greenhouse Environment. Chapter 4, Applied Computational Fluid Dynamics 2002. pp. 35–62, Rijeka, Croatia.
- Fluent Inc. 2012. USers Guide (Release 15.0). Multiphase Flows .
- Franco, A., D. Valera, and A. Madueno. 2010. Influence of water and air flow on the performance of cellulose evaporative cooling pads used in Mediterranean greenhouses. Transactions of the ASABE 53(2):565–76. doi:http://elibrary.asabe.org/abstract.asp?aid=29571
- Ganguly, A., D. Misra, and S. Ghosh. 2010. Modeling and analysis of solar photovoltaic-electrolyzer-fuel cell hybrid power system integrated with a floriculture greenhouse. Energy and Buildings 42(11):2036–43. doi:10.1016/j.enbuild.2010.06.012
- Ghani, S., E.M.A.A. ElBialy, F. Bakochristou, S.M.A. Gamaledin, and M.M. Rashwan. 2017. The effect of forced convection and PCM on helmets’ thermal performance in hot and arid environments. Applied Thermal Engineering 111:624–637. doi:10.1016/j.applthermaleng.2016.09.142
- Ghani, S., F. Bakochristou, E.M.A.A. ElBialy, S.M.A. Gamaledin, M.M. Rashwan, A.M. Abdelhalim, and S.M. Ismail. 2019. Design challenges of agricultural greenhouses in hot and arid environments – A review. Engineering in Agriculture, Environment and Food 12(1):48–70. doi:10.1016/j.eaef.2018.09.004.
- Ghasemi Mobtaker, H., Y. Ajabshirchi, S.F. Ranjbar, and M. Matloobi. 2016. Solar energy conservation in greenhouse: Thermal analysis and experimental validation. Renewable Energy 96:509–19. doi:10.1016/J.RENENE.2016.04.079
- Gunhan, T., V. Demir, and A.K. Yagcioglu. 2007. Evaluation of the suitability of some local materials as cooling pads. Biosystems Engineering 96(3):369–77. doi:10.1016/j.biosystemseng.2006.12.001
- Han, J.H., H.J. Kwon, J.Y. Yoon, K. Kim, S.W. Nam, and J.E Son. 2009. Analysis of the thermal environment in a mushroom house using sensible heat balance and 3-D computational fluid dynamics. Biosystems Engineering 104(3):417–24. doi:https://www.sciencedirect.com/science/article/pii/S153751100900227X
- Hand, D.W. 1984. Crop responses to winter and summer Co2 enrichment. Acta Horticulturae 162:45–64. doi:10.17660/ActaHortic.1984.162.4
- Haxaire, R. 1999. Caractérisation et modélisation des écoulements d’air dans une serre. Université de Nice Sophia Antipolis, Nice, pp. 1–148.
- He, S., Z. Guan, H. Gurgenci, I. Jahn, Y. Lu, and M. Alkhedhair. 2014. Influence of ambient conditions and water flow on the performance of pre-cooled natural draft dry cooling towers. Applied Thermal Engineering 66(1–2):621–31. doi:10.1016/j.applthermaleng.2014.02.070
- He, S., Y. Xu, G. Zhang, K. Hooman, and M. Gao. 2017. Selection of wetted media for pre-cooling of air entering natural draft dry cooling towers. Applied Thermal Engineering, 114, 857–863. doi:10.1016/j.applthermaleng.2016.11.179
- He, X., J. Wang, S. Guo, J. Zhang, B. Wei, J. Sun, and S. Shu. 2017. Ventilation optimization of solar greenhouse with removable back walls based on CFD. Computers and Electronics in Agriculture 149, 16–25. doi:10.1016/J.COMPAG.2017.10.001
- Heidarinejad, G., and M. Bozorgmeh. 2008. Heat and mass transfer modeling of two stage indirect/direct evaporative air coolers. ASHRAE [Thailand Chapter Journal].
- Ishii, M., S. Sase, H. Moriyama, L. Okushima, A. Ikeguchi, M. Hayashi, K. Kurata, C. Kubota, M. Kacira, and G.A. Giacomelli. 2016. Controlled environment agriculture for effective plant production systems in a semiarid greenhouse. Japan Agricultural Research Quarterly 50(2):101–13. doi:.org/10.6090/jarq.50.101
- Jain, D., and G.N. Tiwari. 2002. Modeling and optimal design of evaporative cooling system in controlled environment greenhouse. Energy Conversion and Management 43(16):2235–50. doi:10.1016/S0196-8904(01)00151-0
- Jain, J.K., and D.A. Hindoliya. 2011. Experimental performance of new evaporative cooling pad materials. Sustainable Cities and Society 1(4):252–6. doi:10.1016/j.scs.2011.07.005
- Jakobsen, H.A. 2008. Chemical reactor modeling. Multiphase Reactive Flows. London: Springer-Verlag. doi:https://link.springer.com/content/pdf/10.1007/978-3-319-05092-8.pdf
- Kichah, A., P.-E. Bournet, C. Migeon, and T. Boulard. 2012. Measurement and CFD simulation of microclimate characteristics and transpiration of an Impatiens pot plant crop in a greenhouse. Biosystems Engineering 112(1):22–34. doi:10.1016/J.BIOSYSTEMSENG.2012.01.012
- Kim, K., J. Yoon, H. Kwon, J. Han, and J. Son. 2008. 3-D CFD analysis of relative humidity distribution in greenhouse with a fog cooling system and refrigerative dehumidifiers. Biosystems Engineering 100(2):245–55. doi:https://www.sciencedirect.com/science/article/pii/S1537511008000895
- Kim, R., S. Hong, I. Lee, and K. Kwon. 2017. Evaluation of wind pressure acting on multi-span greenhouses using CFD technique, part 2: Application of the CFD model. Biosystems Engineering 164:257–80. doi:https://www.sciencedirect.com/science/article/pii/S1537511016308029
- Kittas, C., T. Bartzanas, and A. Jaffrin. 2003. Temperature gradients in a partially shaded large greenhouse equipped with evaporative cooling pads. Biosystems Engineering 85(1):87–94. doi:10.1016/S1537-5110(03)00018-7
- Kovačević, I., and M. Sourbron. 2017. The numerical model for direct evaporative cooler. Applied Thermal Engineering Journal 113:1–12. doi:10.1016/j.applthermaleng.2016.11.025
- Kuroyanagi, T. 2017. Investigating air leakage and wind pressure coefficients of single-span plastic greenhouses using computational fluid dynamics. Biosystems Engineering 163:15–27. doi:10.1016/J.BIOSYSTEMSENG.2017.08.004
- Langhans, R., and T. Tibbitts. 1997. Plant Growth Chamber Handbook. Ames: Iowa Agricultural and Home Economics Experiment Station.
- Launder, B.E., and D.B. Spalding. 1974. The numerical computation of turbulent flows. Computer Methods in Applied Mechanics and Engineering 3(2):269–89. doi:10.1016/0045-7825(74)90029-2
- Lefers, R., N.M.S. Bettahalli, S.P. Nunes, N. Fedoroff, P.A. Davies, and T. Leiknes. 2016. Liquid desiccant dehumidification and regeneration process to meet cooling and freshwater needs of desert greenhouses. Desalination and Water Treatment 57(48–49):23430–42. doi:10.1080/19443994.2016.1173383
- Lertsatitthanakorn, C., S. Rerngwongwitaya, and S. Soponronnarit. 2006. Field experiments and economic evaluation of an evaporative cooling system in a silkworm rearing house. Biosystems Engineering 93(2):213–9. doi:10.1016/j.biosystemseng.2005.12.003
- Li, S., and D.H. Willits. 2008. Comparing low-pressure and high-pressure fogging systems in naturally ventilated greenhouses. Biosystems Engineering 101(1):69–77. doi:10.1016/j.biosystemseng.2008.06.004
- Liao, C.-M., and K-H. Chiu. 2002. Wind tunnel modeling the system performance of alternative evaporative cooling pads in Taiwan region. Building and Environment 37(2):177–87. doi:10.1016/S0360-1323(00)00098-6
- Libin, W., and M. Xiushui. 2011. Numerical simulation on thermal environment of heated glass greenhouse based on porous medium. Ransactions of the Chinese Society for Agricultural Machinery 2:038. doi:http://en.cnki.com.cn/Article_en/CJFDTOTAL-NYJX201102038.htm
- Mahmoudi, H., N. Spahis, S.A. Abdul-Wahab, S.S. Sablani, and M.F.A. Goosen. 2010. Improving the performance of a Seawater Greenhouse desalination system by assessment of simulation models for different condensers. Renewable and Sustainable Energy Reviews 14(8):2182–8. doi:10.1016/j.rser.2010.03.024
- Manassaldi, J.I., N.J. Scenna, and S.F. Mussati. 2014. Optimization mathematical model for the detailed design of air cooled heat exchangers. Energy 64:734–46. doi:10.1016/j.energy.2013.09.062
- Miglietta, F., M.R. Hoosbeek, J. Foot, F. Gigon, A. Hassinen, M. Heijmans, … and B. Wallén. 2001. Spatial and temporal performance of the MiniFACE (Free Air CO2 Enrichment) System on bog ecosystems in Northern and Central Europe. Environmental Monitoring and Assessment 66(2):107–27. doi:10.1023/A:1026495830251
- Mistriotis, A., G.P.A. Bot, P. Picuno, and G. Scarascia-Mugnozza. 1997. Analysis of the efficiency of greenhouse ventilation using computational fluid dynamics. Agricultural and Forest Meteorology 85(3–4):217–28. doi:10.1016/S0168-1923(96)02400-8
- Molina-Aiz, F., D.L. Valera, and A. Álvarez. 2004. Measurement and simulation of climate inside Almeria-type greenhouses using computational fluid dynamics. Agricultural and Forest Meteorology 125(1–2):33–51. doi:10.1016/j.agrformet.2004.03.009
- Mortensen, L. 1987. Review: CO2 enrichment in greenhouses. Crop responses. Scientia Horticulturae 33(1–2):1–25. doi:10.1016/0304-4238(87)90028-8
- Nayeem, M., and A. Qayoom. 2015. Design of micro climatic environmental conditions inside greenhouses for cultivation of tulip flowers. Journal of Applied Engineering (JOAE) 3. doi:https://s3.amazonaws.com/academia.edu.documents/46473209/JOAE__31__202-210.pdf?AWSAccessKeyId=AKIAIWOWYYGZ2Y53UL3A&Expires=1535567770&Signature=O846VQnn4vTsfsRIyoCOZvUE4Vc%3D&response-content-disposition=inline%3B filename%3DDesign_of_Micro_Climatic_Environmental_C.pdf
- Niam, A.G., H. Suhardiyanto, K.B. Seminar, and A. Maddu. 2017. CFD simulation of cooling pipes distance in the growing medium for hydroponic substrate in tropical lowland CFD simulation of cooling pipes distance in the growing medium for hydroponic substrate in tropical lowland. International Journal of Engineering Research and Development. 15(February):56–63.
- Okada, M., M. Lieffering, H. Nakamura, M. Yoshimoto, H.Y. Kim, and K. Kobayashi. 2000. Free-air Co2 enrichment (face) using pure Co 2 injection: System description. New Phytologist 150(2):251–60. doi:http://www.newphytologist.com
- Ould Khaoua, S.A., P.E. Bournet, C. Migeon, T. Boulard, and G. Chassériaux. 2006. Analysis of greenhouse ventilation efficiency based on computational fluid dynamics. Biosystems Engineering 95(1):83–98. doi:10.1016/J.BIOSYSTEMSENG.2006.05.004
- Ozgener, O., and A. Hepbasli. 2005. Exergoeconomic analysis of a solar assisted ground-source heat pump greenhouse heating system. Applied Thermal Engineering 25(10):1459–71. doi:10.1016/j.applthermaleng.2004.09.015
- Pakari, A., and S. Ghani. 2019a. Regression models for performance prediction of counter flow dew point evaporative cooling systems. Energy Conversion and Management 185:562–73. doi:10.1016/j.enconman.2019.02.025.
- Pakari, A., and S. Ghani. 2019b. Comparison of 1D and 3D heat and mass transfer models of a counter flow dew point evaporative cooling system: Numerical and experimental study. International Journal of Refrigeration 99:114–25. doi:10.1016/j.ijrefrig.2019.01.013.
- Pakari, A., and S. Ghani. 2019c. Evaluation of a novel greenhouse design for reduced cooling loads during the hot season in subtropical regions. Solar Energy 181:234–42. doi:10.1016/j.solener.2019.02.006.
- Panwar, N.L., S.C. Kaushik, and S. Kothari. 2011. Solar greenhouse an option for renewable and sustainable farming. Renewable and Sustainable Energy Reviews 15(8):3934–45. doi:10.1016/j.rser.2011.07.030
- Parks, C., D. Jones, J.Clemente, J., Bechtel Corporation, C.D. Parks, and D.E. Jones. 2003. Evaluating performance of air cooled heat exchangers in lng plants. In Presentation at the AIChE Spring National Meeting 2003, New Orleans, LNG Equipment Design.
- Perret, J.S., A.M. Al-Ismaili, and S.S. Sablani. 2005. Development of a humidification–dehumidification aystem in a quonset greenhouse for sustainable crop production in arid regions. Biosystems Engineering 91(3):349–59. doi:10.1016/j.biosystemseng.2005.04.009
- Piscia, D., J. Montero, E. Baeza, and B. Bailey. 2012. A CFD greenhouse night-time condensation model. Biosystems Engineering 111(2):141–54. doi:https://www.sciencedirect.com/science/article/pii/S1537511011002017
- Radhwan, A.M., and H.E.S. Fath. 2005. Thermal performance of greenhouses with a built-in solar distillation system: experimental study. Desalination 181(1–3):193–205. doi:10.1016/j.desal.2005.05.005
- Romantchik, E., E. Ríos, E. Sánchez, I. López, and J.R. Sánchez. 2017. Determination of energy to be supplied by photovoltaic systems for fan-pad systems in cooling process of greenhouses. Applied Thermal Engineering 114:1161–8. doi:10.1016/j.applthermaleng.2016.10.011
- Roy, J.C., and T. Boulard. 2005. CFD prediction of the natural ventilation in a tunnel-type greenhouse: Influence of wind direction and sensibility to turbulence models. Acta Horticulturae 691:457–64.
- Roy, S.K., and D.S. Khurdiya. 1986. Studies on evaporatively cooled zero energy input cool chamber for storage of horticultural produce. Indian Food Packer 40(6):26–31.
- Santolini, E., B. Pulvirenti, S. Benni, L. Barbaresi, D. Torreggiani, and P. Tassinari. 2017. Numerical study of wind-driven natural ventilation in a greenhouse with screens. Computers and Electronics in Agriculture 149:41–53. doi:10.1016/J.COMPAG.2017.09.027
- Schlichting, G. 1974. Theory of Boundary Layer. Moscow: Science.
- Sethi, V.P. 2009. On the selection of shape and orientation of a greenhouse: Thermal modeling and experimental validation. Solar Energy 83(1):21–38. doi:10.1016/j.solener.2008.05.018
- Shekhar, S., S. Suman, H.S. Moharana, and D. Sethy. 2016. Performance of different pad materials in advanced desert coolers-A comparative study. International Journal of Engineering Science 4368–4371.
- Sonneveld, P.J., G.L.A.M. Swinkels, G.P.A. Bot, and G. Flamand. 2010. Feasibility study for combining cooling and high grade energy production in a solar greenhouse. Biosystems Engineering 105(1):51–8. doi:10.1016/J.BIOSYSTEMSENG.2009.09.012
- Subin, M.C., J.S. Lourence, R. Karthikeyan, and C. Periasamy. 2018. Analysis of materials used for greenhouse roof covering -structure using CFD. IOP Conference Series: Materials Science and Engineering . Vol. 346, No. 1, p. 012068. IOP Publishing. doi:10.1088/1757-899X/346/1/012068
- Sutar, R., and G.N. Tiwari. 1995. Analytical and numerical study of a controlled-environment agricultural system for hot and dry climatic conditions. Energy and Buildings 23:9–18.
- Ta, N., B. Chen, S. Wu, and M. Wenjuan. 2015. The simulation analysis of solar greenhouse in cold arid area based on GFD. Journal of Inner Mongolia Agricultural University (Natural Science Edition) 1:016. doi:http://en.cnki.com.cn/Article_en/CJFDTotal-NMGM201501016.htm
- Taki, M., A. Rohani, and M. Rahmati-Joneidabad. 2018. Solar thermal simulation and applications in greenhouse. Information Processing in Agriculture 5(1):83–113. doi:10.1016/J.INPA.2017.10.003
- Teitel, M., G. Ziskind, O. Liran, V. Dubovsky, and R. Letan. 2008. Effect of wind direction on greenhouse ventilation rate, airflow patterns and temperature distributions. Biosystems Engineering 101(3):351–69. doi:10.1016/J.BIOSYSTEMSENG.2008.09.004
- Tong, G., D. Christopher, and C. Zhang. 2018. New insights on span selection for Chinese solar greenhouses using CFD analyses. Computers and Electronics in Agriculture 149:3–15. doi:https://www.sciencedirect.com/science/article/pii/S0168169916308481
- Umeda, H., D. Ahn, Y. Iwasaki, S. Matsuo, and S. Takeya. 2015. A cooling and CO2 enrichment system for greenhouse production using CO2 clathrate hydrate. Engineering in Agriculture, Environment and Food 8(4):307–12. doi:https://www.sciencedirect.com/science/article/pii/S1881836615000336
- Vala, K.V., F. Saiyed, and D.C. Joshi. 2014. Evaporative cooled storage structures: An Indian scenario. Trends in Post Harvest Technology 2(3):22–32.
- Vox, G., G. Scarascia-Mugnozza, and E. Schettini. 2008. Renewable energy sources and greenhouse industry: Trends and perspectives. Agricultural and Biosystems Engineering for a Sustainable World. International Conference on Agricultural Engineering, Hersonissos, Crete, Greece, 23-25 June, 2008. doi:https://www.cabdirect.org/cabdirect/abstract/20083324964
- Wu, D.L., H. Tao, W.W. Xu, W.W. Liu, and Q. Tang., & 2010, undefined. (2010). Design of Humidification System for Cultivation of Agaricus bisporus in Plastic Greenhouse. Northern Horticulture 23:026. doi:http://en.cnki.com.cn/Article_en/CJFDTOTAL-BFYY201023026.htm
- Xie, X., Z. Huang, J. Wang, and Z. Xie. 2005. The impact of solar radiation and street layout on pollutant dispersion in street canyon. Building and Environment 40(2):201–12. doi:10.1016/j.buildenv.2004.07.013
- Xiuhua, C., M. Hanping, and N. Jun. 2011. Numerical prediction and CFD modeling of relative humidity and temperature for greenhouse-crops system. Transactions of the Chinese Society for Agricultural Machinery 42(2):173–79. doi:http://en.cnki.com.cn/Article_en/CJFDTOTAL-NYJX201102037.htm
- Yang, L., J. Huang, H. Yang, G. Dong, H. Liu, G. Liu, … and Y. Wang. 2007. Seasonal changes in the effects of free-air CO2 enrichment (FACE) on nitrogen (N) uptake and utilization of rice at three levels of N fertilization. Field Crops Research 100(2–3):189–99. doi:10.1016/J.FCR.2006.07.003
- Yildirim, N., and L. Bili. 2017. Evaluation of a hybrid system for a nearly zero energy greenhouse. Energy Conversion and Management 148:1278–90. doi:10.1016/J.ENCONMAN.2017.06.068
- Zhang, Y., M. Kacira, and L. An. 2016. A CFD study on improving air flow uniformity in indoor plant factory system. Biosystems Engineering 147:193–205. doi:https://www.sciencedirect.com/science/article/pii/S1537511016300447
- Ziskind, G., V. Dubovsky, and R. Letan. 2002. Ventilation by natural convection of a one-story building. Energy and Buildings 34(1):91–101. doi:10.1016/S0378-7788(01)00080-9.