
 ?Mathematical formulae have been encoded as MathML and are displayed in this HTML version using MathJax in order to improve their display. Uncheck the box to turn MathJax off. This feature requires Javascript. Click on a formula to zoom.
Abstract
In a building-integrated agriculture (BIA) space, peak loads must be estimated to size HVAC equipment in order to maintain indoor air conditions that enhance crop growth. However, the estimation of the rates of heat gain/loss induced by the crops and their impact on heating and cooling loads have only been sparsely addressed. The present study proposes a workflow to estimate the impact of crops on a BIA space peak loads. The building, BIA space and crops – lettuces – are modeled in TRNSYS 18, while loads for design day conditions are assessed by completing a parametric study that varied the cultivated density (CD), the indoor air conditions (temperature and humidity) and the leaf area index (LAI) of the crops. Compared to the baseline peak loads, the estimated sensible heating and latent cooling peak loads of the BIA space at the highest CD for a LAI of 2.1 are 3.6 to 3.7 and 1.1 to 2.1 times higher, while being 13.3 to 14.0 and 6.0 to 9.9 times higher for a LAI of 10. The results show the importance of considering crops in estimating peak loads to size HVAC equipment and promote crop yield.
Introduction
As protected urban agriculture gains in popularity, year-round food production solutions in cold climates are being developed (McCartney and Lefsrud Citation2018). These solutions include, but are not limited to, stand-alone greenhouses, vertical farms, container farms or Building-Integrated Agriculture (BIA) spaces. BIA spaces are building spaces that are dedicated to crop production on top of or in buildings that have a different main use such as office, school, grocery store or retail (Puri and Caplow Citation2009), while vertical farms are buildings that exclusively grow crops. In both cases, they allow high density cultivation by the use of crop production systems such as vertical hydroponic stacking. There are two types of BIA spaces, one with daylighting and possibly electric lighting, and BIA spaces with only electric lighting, i.e., without any natural lighting. In both cases, the environment is fully controlled: indoor conditions (humidity, temperature, light, CO2 concentration) are maintained to enhance crop productivity. In most cases, when agricultural spaces are modeled, the multi-factorial interaction of plants with the environment is neglected (Sethi et al. Citation2013). However, the rates of heat gain/loss induced by the crops are not necessarily negligible; they have indeed been shown to have a significant impact on loads in a BIA space (Talbot and Monfet Citation2018). Therefore, when designing a BIA space, these additional crop heat gains/losses must be considered when calculating peak loads to size heating, ventilation and air conditioning (HVAC) equipment (Spitler Citation2014). However, to our knowledge, the estimated rates of heat gain/loss induced by the crops and their impact on peak loads have currently only been sparsely detailed.
The purpose of this study is to propose a modeling approach in the form of a workflow to estimate the impact of crops, detailed for lettuces, on BIA space peak loads. This is accomplished by modeling the building, the BIA space with only electric lighting, as well as crops (lettuces), in TRNSYS 18 (Klein, et al. Citation2017), and completing a parametric study for different grower scenarios. In order to fully assess the estimated rates of heat gain/loss induced by the crops and their impact on peak loads, a review of peak load calculations and crop energy balance is first presented. This is followed by a brief description of the modeling approach used, i.e., the workflow. Results are then presented to assess the impact of crops on peak loads. The obtained results may then be used to assist the design process to adequately size BIA space HVAC equipment.
Literature review
The concept of peak load stemmed from the need to size HVAC equipment which, under recommended design conditions, will maintain specific indoor conditions within a space (Spitler Citation2014). In a BIA space, the design parameters depend on the indoor conditions chosen by the growers in order to enhance crop productivity. To complete the peak load, external and internal gains/losses, including crop gains/losses, are estimated. An overview of peak load calculations and crop energy balance is presented in this section.
Load calculation methods
Various load calculation methods exist for determining the maximum energy transfer rate required to maintain indoor conditions, which are based on different simplifications and assumptions. The most commonly known are the heat balance (HB) method, the radiant time series (RTS) method, the transfer function method (TFM), and the cooling load temperature difference (CLTD) and cooling load factor (CLF) method (Kavanaugh Citation2006). In order to find the highest reasonable loads to size HVAC equipment, load calculations consider external gains/losses (conduction through the building envelope, solar heat gains through fenestration and infiltration heat gains/losses), and internal heat gains (occupants, lighting, equipment, etc.). These gains/losses are influenced by the environmental design conditions (ASHRAE Citation2007). The indoor conditions are established based on owners’ (and growers, in the case of the BIA space) criteria, local codes or comfort criteria (Spitler Citation2014). For most applications, the outdoor conditions are specified as being the 99.6% design condition in heating and the 1% design condition in cooling (ASHRAE Citation2007). However, for critical cases, the 0.4% cooling design condition is recommended, which is the case for the BIA space. If the BIA space is an interior space, the impact of outdoor conditions on the loads is limited and loads are mainly influenced by internal gains.
Internal gains considered for peak load calculations fall under the general categories of occupant, lighting and equipment. Occupant gains and some equipment gains will contribute to both sensible and latent loads, while lighting gains are solely sensible. Sensible gains break down into radiative and convective fractions, and only the convective fraction of the sensible gain is considered instantaneous (Spitler Citation2014). The long-wave radiative fraction interacts with the room surfaces, and is considered as a delayed gain in time. The latent gains are also considered instantaneous and part of the latent cooling load. Other gains/losses, such as miscellaneous equipment or processes, can also be considered as needed. These miscellaneous gains/losses must be carefully evaluated based on the operating schedule and the load factor, and are even more subjective than occupant and lighting gains (Spitler Citation2014). In a BIA space, these miscellaneous gains/losses are induced by the crops, which have not been considered in estimating peak loads.
Crops: A complex internal heat gain/loss
Many interactions have to be considered in assessing the rates of heat gain/loss induced by the crops during both photosynthesis (with the lights on during photoperiod) and respiration (with the lights off during dark period) as illustrated in .
Fig. 1. Crop energy balance.
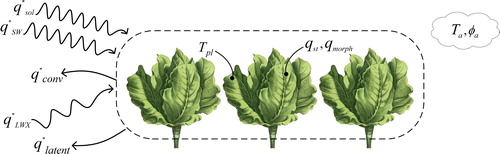
These interactions, based on the assumption that the crops are perfectly irrigated, are modeled by a single energy balance between the crops and its environment, either at the leaf or canopy scale (Stanghellini Citation1987). It can be written according to the HB method (ASHRAE Citation2013) as defined in EquationEquation 1(1)
(1) and is expressed at a canopy scale as an energy flux per unit of surface of cultivated area (W⋅m−2cultivated). The cultivated area (Acultivated) is the sum of all the horizontal areas of the growing beds.
(1)
(1)
where:
is the transmitted solar radiation flux absorbed by crops, W/m2cultivated;
is the short-wave radiation flux absorbed by the crops from lights, W/m2cultivated;
is the net long-wave radiation flux exchange between surfaces, W/m2cultivated;
and
are the fluxes stored within the leaves, stems and fruits or used for the photosynthesis, respectively, W/m2cultivated;
is the convective exchange flux with ambient air, which can cause the crop cooling effect, W/m2cultivated; and
is the latent exchange flux with ambient air, mostly by transpiration from the leaves, W/m2cultivated.
The energy exchanged is influenced by the size of the leaves, often evaluated using the Leaf Area Index (LAI), a dimensionless variable defined as the total one-sided area of photosynthetic tissue per unit of ground surface area (Watson Citation1947) that represents an effective area for latent and sensible heat exchange. The LAI increases with crop growth and is correlated with the Cultivation Area Cover (CAC), which represents a percentage of the cultivated area that is covered by leaves (Graamans et al. Citation2017). The indoor conditions are defined by the temperature and the humidity, or the vapor pressure deficit (VPD), and the CO2 level. The VPD is the difference between the theoretical pressure exerted by water vapor held in saturated air (100% relative humidity at a given temperature) and the pressure exerted by the water vapor that is actually held in the air being measured at the same given temperature, i.e., the difference between the vapor pressure inside the leaf to the vapor pressure of the air. Other parameters, such as the resistance of the boundary layer to heat transfer, vapor transfer and the surface (or stomatal) resistances influence the energy exchanged. Different crop models, which are modeled using the crop energy balance formulation, have been used in a building model (Benis, Reinhart, and Ferrão Citation2017; Graamans et al. Citation2017; Kokogiannakis and Cooper Citation2015; Ward et al. Citation2015). Each of these models are formulated according to various assumptions and simplifications of the energy balance and uses different sub-models, as detailed in . The different parameters presented in are defined in the nomenclature section. The net long-wave radiation flux exchange between surfaces () is neglected by everyone except for Ward et al. (Citation2015), the stored flux (
) is included in half of the models and the flux used for the photosynthesis (
) is neglected in all models. Different formulations are also proposed for the aerodynamic resistance (
) and the stomatal resistance (
).
Table 1. Details of the fluxes formulated in the developed crop models.
A further analysis of the developed crop models also highlights differences in the level of complexity. For example, the model proposed by Ward et al. (Citation2015) is dynamic and based on many parameters that support greenhouse simulations. In addition to the energy balance between the crops and its environment, the model also includes a carbon balance (Vanthoor et al. Citation2011). It is more suitable for assessing the impact of daily variations of indoor conditions on crop yield. Conversely, Graamans et al. (Citation2017) proposed a simplified lettuce model that has been validated experimentally under steady-state conditions as part of a study of a controlled-environment agriculture (CEA) space. The model has been used to explore and quantify the thermal behavior of lettuce for different lighting power intensities and indoor air conditions (temperature and humidity) during photosynthesis and respiration (Graamans et al. Citation2017).
Few studies have integrated a crop model into a building model. In most cases, the objective is to evaluate the impact on indoor conditions rather than estimating the impact of crops on peak loads. The workflow (modeling approach) described in this paper proposes to assess the impact of crops on peak loads in a BIA space.
Workflow: the modeling approach
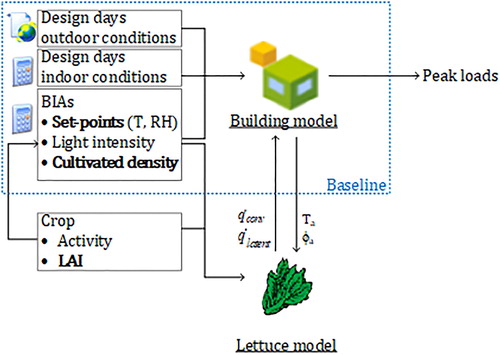
This research proposes a workflow that aims to estimate the impact of crops on peak loads in a BIA space, using an existing and validated steady-state lettuce thermal model (Graamans et al. Citation2017) integrated to a building model with a BIA space. TRNSYS is selected as the energy simulation software since it offers the possibility of developing complex HVAC systems and custom types, which are considered as essential for future work on evaluating crop yield and the energy performance of BIA space. The overall approach consists of first estimating the baseline loads of the BIA space for design conditions. The baseline loads are used as the basis for comparison and are identical to the grower scenarios under study without including the rates of heat gain/loss induced by crops. The baseline heating load considers the conduction through the building envelope and sensible and latent heat losses by ventilation, while the baseline cooling load considers conduction through the building envelope, sensible and latent heat gain/loss by ventilation, as well as the occupants sensible and latent heat gains and the lighting sensible heat gain. Then, the rates of heat gain/loss induced by the crops are estimated, in this case using the lettuce model according to different assumptions, which is integrated with the BIA space model. Finally, a parametric study is conducted to assess the impact of crops on peak loads. This is done for different grower scenarios, with the indoor air conditions (temperature and humidity), the cultivated density CD (EquationEquation 2(2)
(2) ), and the LAI varied. An overview of the proposed approach is illustrated in , where the elements in bold indicate the elements that are varied in the parametric study.
(2)
(2)
where:
Fig. 2. Overview of the modeling approach.
is the cultivated density (%);
is the sum of all the horizontal areas of the growing beds, which modifies the quantity of crops and the required lighting intensity (m2cultivated); and
is the total BIA space floor area (m2).
Building and BIA space model
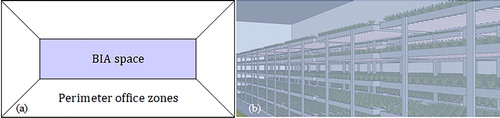
The building, located in Montreal (Canada), has a 110.55 m2 BIA space located in the middle of the building, with a celling height of 5.3 m ().
Fig. 3. Configuration of the case study: (a) building and (b) BIA space.
The design parameters (e.g., environmental design day conditions, indoor conditions and internal gains) of the perimeter office zones are manually set in TRNSYS for a medium office space type based on ASHRAE 90.1-2010 (ASHRAE Citation2010). The selected design days correspond to the 99.6% design condition in heating and the 0.4% design condition in cooling, while the building envelope characteristics are detailed in .
Table 2. Building envelope characteristics.
The 110.55 m2 studied BIA space is dedicated to the hydroponic culture of lettuce heads stacked in multi-tier growing beds (). The thermal effects of the hydroponic system are neglected since it is supposed to be covered to limit evaporation losses. It is assumed that the interior walls of the BIA space are covered with water-repellent material to ensure the integrity of the envelope by retaining the humidity in the space and minimizing the migration of water vapor through the envelope.
In the BIA space, the indoor conditions (temperature, humidity, light and CO2 level) are controlled to promote crop yield. For lettuce, the ambient dry bulb temperature should be maintained between 19 and 24 °C to optimize the degree of crop activity during the photoperiod and dark period (Brechner, Both, and Staff Citation1996). The ambient relative humidity should be maintained in a range of 70 to 80% to limit crop transpiration and the proliferation of fungi caused by water condensation on leaves or surfaces (Hézard et al. Citation2012). The CO2 level should be maintained between 700 and 1000 ppm by an enrichment system (Kozai, Niu, and Takagaki Citation2015). The ventilation rate is set to 0.02 h−1 to avoid dilution of the injected CO2 (Kozai, Niu, and Takagaki Citation2015).
To estimate the peak cooling loads, the considered internal gains are five occupants being present between 6:00 and 22:00 and 0.25 between 22:00 and 24:00, and the gain from the horticulture lighting, which is considered to be on at all times. Light emitting diode (LED) lamps are selected since this type of lighting allows placing lamps near the crops. The selected LED lamps’ input electric power is estimated at 168 watts per surface area cultivated (168 W⋅m−2cultivated), with an efficiency of 52% (Royal Philipps Citation2018). This represents a photosynthetic photon flux density (PPFD) of 437 μmol⋅s−1⋅m−2cultivated during the photoperiod, which is high since most horticultural LED lamps have a PPFD between 300 and 500 μmol⋅s−1⋅m−2cultivated (Lomax Citation2018). The long-wave radiative and convective heat fractions are estimated to 0.17 and 0.31 using tabulated experimental results for high efficiency LED luminaires (Liu et al. Citation2017). It is assumed that the long-wave radiation emitted by lights is reflected by crops and computes as a radiative heat gain. The short-wave radiation emitted by lights is partly absorbed by crops according to the CAC and the leaf reflection coefficient, while the remainder computes as a radiative heat gain.
The building and the BIA space are modeled using TRNBuild, an interface for creating and editing all the non-geometric information required by the multizone building model (Type 56) in TRNSYS 18. The building and BIA space indoor conditions are also specified in TRNBuild. In the BIA space, the humidity capacitance ratio is set to 1 to model the impact of interior wall being covered with water-repellent material, which means that only air from the zone can absorb moisture. The sensible and latent energy demands of the zone airnode, referred to as the loads in TRNSYS, are estimated by specifying unlimited sensible heating and cooling power in TRNBuild. However, moisture removal due to the process of cooling air in a building is not automatically consider by Type 56. Type 2280 is coupled with Type 56 to estimate the moisture removal rate. This moisture removal rate is then used by Type 56 to estimate the latent load.
The multizone building model (Type 56) uses the heat balance method to calculate thermal zone loads, but does not include automatic design day calculations for sizing (Crawley et al. Citation2008). To ensure that the manually set parameters are valid, a comparison of the heating and cooling loads calculated with OpenStudio (Guglielmetti, Macumber, and Long Citation2011), an interface for EnergyPlus (Crawley et al. Citation2000) that allows automatic design day calculations for sizing, is completed. The differences between the heating and cooling loads estimated using TRNSYS and OpenStudio are 0.7 and 3.3%, respectively. These slight discrepancies may be explained by different software assumptions, such as how inside radiation is calculated.
For the BIA space under study, the external gains/losses do not fluctuate significantly since the thermal exchanges with the outdoor environment are limited as illustrated in . The simulation results (the outputs) are the estimated loads for the design days with a 10-minutes time step without (baseline) or with considering the crops as an additional internal gain/loss.
Crop model
To estimate the rates of heat gain/loss induced by the crops, a lettuce model coded as a TRNSYS component is used, which is based on the algorithm proposed by Graamans et al. (Citation2017) for growing lettuces under electrical lighting only in a CEA space. The short-wave radiation flux absorbed by the crops from lights (), the convective exchange flux with ambient air (
) and the latent exchange flux with ambient air (
) used in this study are respectively referred to as the net radiation (
), the sensible heat exchange (
) and the latent heat exchange (
) by Graamans et al. (Citation2017) and detailed in .
Table 3. Details of the fluxes formulated in the Graamans et al. (Citation2017) lettuce model.
Only relevant assumptions and simplifications that are inherent to the lettuce model developed by Graamans et al. (Citation2017) are specified:
For the short-wave radiation flux absorbed by the crops from lights (
), it is supposed that the short-wave radiation emitted by the horticultural lights is all part of the photosynthetically active radiation (PAR) spectral range. A portion of this light is absorbed by the crops and the remainder is computed as a radiative heat gain. The portion absorbed by the crops depends on two parameters: the leaf reflection coefficient (
The leaf reflection coefficient (
The CAC is set to the following:
For LAI ≤ 2.45, a linear relationship between CAC and LAI for lettuces developed by Tei, Scaife, and Aikman (Citation1996) is used:
For LAI > 2.45, the CAC is set to 95%, which means that 5% of the PAR light emitted from the electric lighting do not reach any leaves.
The net long-wave radiation flux exchange between surfaces (
The CO2 concentration is high and set to 700–1000 ppm.
The air of the BIA space is well-mixed using a forced circulation system to ensure sufficient air velocity over the leaves to facilitate gas exchange at the leaves.
The inputs and parameters specified in the crop model are the lighting intensity (total installed LED electric power), the indoor conditions (temperature and humidity) and LAI, which can be set to a value between 0 and 10 for hydroponic lettuce (Fraile-Robayo et al. Citation2017). These are used in the crop model to estimate the rates of heat gain/loss induced by the crops (convective fraction of the sensible heat only - and
) per surface area cultivated (W⋅m−2cultivated) during photosynthesis and respiration. These rates are integrated as additional internal gains/losses to the BIA space model.
Furthermore, an analysis of the crop activity (photosynthesis or respiration) and LAI to be used to estimate the appropriate rates of heat gain/loss induced by the crops and its impact on peak loads is completed. This analysis is based on the theoretical rates of heat gain/loss induced by the crops and their impact on loads (Talbot and Monfet Citation2018). The crop activity varies between two states: (1) photosynthesis and (2) respiration. The minimum LAI value of 0 is used when the crops have not yet grown leaves and thus, there is no heat gain/loss induced by the crops. The maximum LAI is set either to 10 for a single-stage crop growth management method, when lettuces are all grown at the same rate, or to 2.1 under a diversified stage crop growth management method, when different growth stages coexist at the same time (Tei, Scaife, and Aikman Citation1996). When estimating the peak loads, the following are considered:
Sensible heating load: It is assumed that the peak sensible heating load occurs in dark periods, i.e., when the lights are off and the LAI is maximum in order to consider the largest cooling effect induced by crops. If the rate of sensible heat loss induced by the crops is neglected at this step, the heating load could be underestimated. In fact, a previous study showed a 38% increase in the heating load caused by the crops cooling effect during the dark period (Talbot and Monfet Citation2018).
Sensible cooling load: It is assumed that the peak sensible cooling load occurs when the crops have not grown any leaves and the lights are on to enhance crop growth. Under this set of assumptions, the rates of heat gain/loss induced by the crops is not included in the estimation of the peak sensible cooling load and can be calculated as prescribed by load calculation. The BIA space peak sensible cooling load would be mainly influenced by the lighting gain, which varies according to the cultivated density.
Latent cooling load: It is assumed that the peak latent cooling load is instantaneous (no storage) and occurs in photoperiod, when the lights are on and the LAI is maximum, which is when the rate of latent heat gain induced by the crops is estimated to be at its maximum (Graamans et al. Citation2017).
presents a brief overview of the assumptions used to estimate the impacts of crops on the BIA space peak loads.
Table 4. Assumptions used to estimate the BIA space peak loads.
Parametric study
A parametric study is conducted to estimate the impact of crops on peak loads by varying the cultivated density CD (see EquationEquation 2(2)
(2) ), the indoor air conditions (temperature and humidity) and the LAI. The parametric study is completed for different combinations of parameters, as detailed in .
Table 5. Parametric study parameters.
The selected indoor air conditions are based on values proposed in the literature, and a narrow valid range is used to estimate the latent cooling load only. An analysis of the vapor pressure deficit (VPD), the difference between the vapor pressure inside the leaf to the vapor pressure of the air, which is often used by growers to maintain the indoor air conditions instead of controlling the temperature and the humidity independently, is conducted. For lettuce and other leafy greens, it is recommended to maintain the VPD between 0.65 kPa and 0.9 kPa (Kuack Citation2017), as illustrated in by the white cells.
Table 6. Reference vapor pressure deficit (VPD) (kPa) for leafy greens production in the BIA spaceTable Footnote1.
Simulation results are only generated for temperature and relative humidity that are within the recommended VPD range, i.e., the white cells of . Different combinations of temperature/humidity can lead to the same VPD value, which limited the number of required combinations when analyzing the results.
For the cultivated density, the value increases the quantity of crops as vertical stacking occurred. A minimum CD of 60% is used, which means that there is only one tier of growing bed, and the remaining floor area is dedicated to equipment and operations. A maximum CD of 600% is used, which considers a vertical distance between tiers of 30 cm to maximize productivity (Kozai, Niu, and Takagaki Citation2015), and means that 10 tiers are stacked vertically in the BIA space. Further, as vertical stacking occurs, the lighting intensity increases to ensure crop growth. The estimated loads of the BIA space without crops (LAI = 0) constitute the baseline and take into account this increase in total electric lighting power with the cultivated density. For example, for a CD of 120%, the lighting intensity of the BIA space is twice as high as for a CD of 60%.
For the LAI, a value of 0 (baseline), of 2.1 (when lettuces are grown according to a diversified crop growth management method) and of 10 (when lettuces are grown according to a single-stage crop growth management method) are assessed since this parameter influences the rates of heat gain/loss induced by the crops (Prenger, Fynn, and Hansen Citation2002). The corresponding CAC values used are 81% for a LAI of 2.1 and 95% for a LAI of 10.
Results
The estimated rates of heat gain/loss induced by the crops for different indoor air conditions are presented first. This is followed by an overview of the BIA space design day load profiles and the results of the parametric study, where the indoor air conditions (temperature and humidity), the cultivated density and the LAI are varied, as detailed in .
Estimated rates of heat gain/loss induced by crops
The rates of heat gain/loss induced by the crops used to estimate the sensible heating and latent cooling peak loads are obtained from the lettuce model proposed by Graamans et al. (Citation2017). These values are only valid for a BIA space that is lit with LED lamps, has a ventilation rate of 0.02 h−1 that is well-mixed using a forced air circulation system to ensure sufficient air velocity over the leaves to facilitate gas exchange at the leaves and where the CO2 level is maintained by an enrichment system between 700 and 1000 ppm.
For these specific conditions, presents the estimated rates of heat gain/loss induced by the crops (lettuces) per cultivated area for indoor air conditions, activities and LAI, which depend on the crop growth management method. During respiration the rate of sensible heat loss is equal to the rate of the latent heat gain, while during photosynthesis the sensible heat loss is a fraction of the rate of latent heat gain.
Table 7. Estimated rates of heat gain/loss induced by the crops (lettuces) for different activities and LAI for a ventilation rate of 0.02 h−1.
The rates of heat gain/loss induced by the crops for different activities and LAI for a ventilation rate of 0.02 h−1 during dark period (respiration) and photoperiod (photosynthesis) are then computed as internal sensible heat loss (convective heat loss only) and latent heat gain in a building model to estimate the peak loads of the BIA space.
Overview of the BIA space loads
The BIA space design day load profiles are detailed, as an example, for the highest density (CD = 600%) for a VPD set-point of 0.75 kPa, which corresponds to a temperature/relative humidity combination of 21 °C/70% or 24 °C/75%. For this specific CD and VPD, the sensible and latent loads are depicted for the heating design day () and the cooling design day () for a LAI of 0, 2.1 and 10. The peak sensible heating load is 12 kW, 37 kW and 138 kW, respectively for a LAI of 0, 2.1 and 10. As per the initial assumption, the peak sensible heating load occurs during the dark period.
Fig. 4. BIA space heating design day sensible and latent loads profiles at a CD of 600%, VPD of 0.75 kPa and ventilation rate of 0.02 h−1.
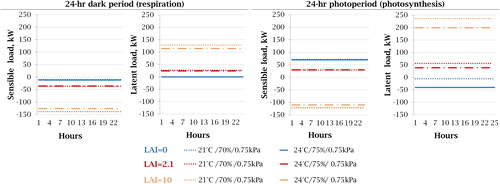
Fig. 5. BIA space cooling design day sensible and latent loads profiles at a CD of 600%, VPD of 0.75 kPa and ventilation rate of 0.02 h−1.
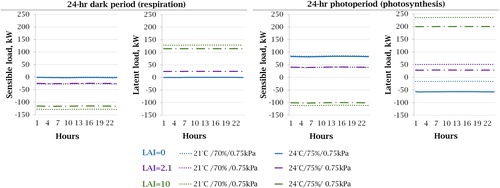
The peak latent cooling load is 51 kW for a LAI of 2.1 and 236 kW for a LAI of 10. As per the initial assumption, the peak latent cooling load occurs during the 24-hour photoperiod, i.e., during photosynthesis. For the same VPD set-point, the latent cooling loads at 21 °C/70% and 24 °C/75% are considerably different over the 24-hour photoperiod: they are 22.4 kW and 35.7 kW higher for LAIs of 2.1 and 10, respectively.
The impact of the external gains/losses (conduction and ventilation) on the BIA space loads are those for a LAI of 0 in the dark period ( and ). The external gains/losses are constant throughout the day for the winter design day, while fluctuating slightly (± 0.5 kW) for the summer design day. Thus, the internal gains/losses of the BIA space have the largest impact on the loads as illustrated in and .
Impact of crops on sensible heating load
The baseline peak sensible heating load of the BIA space (LAI = 0), i.e., when no internal loads are considered (there is no occupant, the LED lighting is off and the rates of heat gain/loss induced by the crops is not included), varies between 9 kW and 12 kW when the temperature of the BIA space varies between 19 °C and 24 °C, regardless of the relative humidity (represented by the blue lines in ). Then, as the cultivated density (CD) increases for two different LAIs (2.1 and 10), the impact of the crops on the load is assessed. The peak sensible heating load is significantly higher than the baseline peak load as the cultivated density increased, as illustrated in .
Fig. 6. Variation of the BIA space peak sensible heating load with the cultivated density for a ventilation rate of 0.02 h−1.
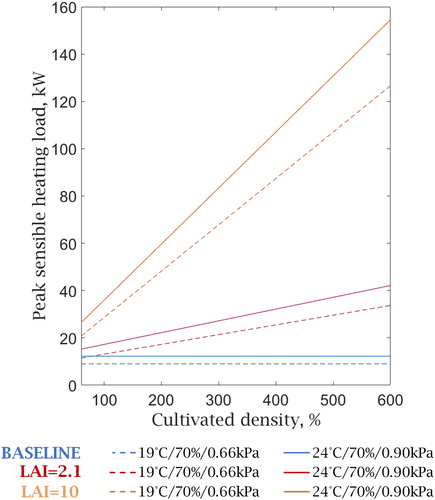
For a CD of 60%, the sensible heating load is 1.2 to 1.3 (for LAI = 2.1), and 2.2 (for LAI = 10) times higher than the baseline, while for a CD of 600%, it is 3.6 to 3.7 (for LAI = 2.1), and 13.3 to 14.0 (for LAI = 10) times higher. These variations are mainly driven by the total sensible heat exchange from crops (the cooling effect), which is influenced by the LAI and the indoor conditions.
Impact of crops on cooling load
The baseline peak sensible cooling load (LAI = 0) varies between 6.3 kW and 8.0 kW for a CD of 60% and between 83.1 kW and 85.5 kW for a CD of 600% when the BIA space indoor air conditions are between 24 °C/70% R.H and 21 °C/74% R.H.
The baseline peak latent cooling load varies between −2.5 kW and −1.3 kW for a CD of 60% and between −44.5 kw and −19.8 kW for a CD of 600% when the BIA space indoor air conditions are between 24 °C/70% R.H and 21 °C/74% R.H. As the cultivated density increases so do the lighting requirements: the lighting intensity is higher and consequently the sensible load of the baseline BIA space. Humidification is also required for the baseline since the sensible cooling load is high and the other gains are not sufficient to maintain the indoor air humidity set-point, explaining the negative baseline latent load ().
Fig. 7. Variation of the BIA space sensible and latent cooling peak loads with the cultivated density for a ventilation rate of 0.02 h−1.
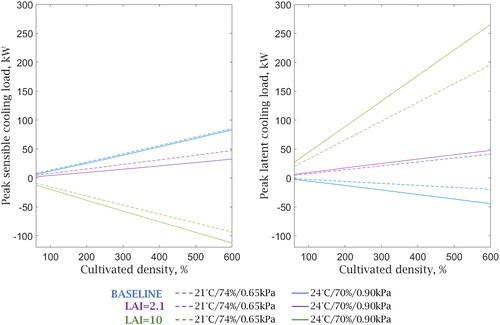
For a LAI of 2.1, the peak sensible cooling load varies between 2.1 kW and 4.8 kW for a CD of 60% and between 32.6 kW and 47.3 kW for a CD of 600%, while varying between −12.3 kW and −9.2 kW for a CD of 60% and between −112.6 kW and −93.6 kW for a CD of 600% for a LAI of 10. For a LAI of 2.1, the peak sensible cooling load is lower than the baseline due to the cooling effect of crops. However, for a LAI of 10, the rate of sensible heat loss induced by the crops is larger than the lighting heat gain leading to a heating load, i.e., heating being required rather than cooling to maintain the indoor conditions, explaining the negative sensible load.
For a CD of 60%, the peak latent cooling load is 2.5 to 3.5 (for LAI = 2.1), and 10.8 to 15.1 (for LAI = 10) times higher than the baseline, while for a CD of 600%, it is 1.1 to 2.1 (for LAI = 2.1), and 6.0 to 9.9 (for LAI = 10) times higher. The peak latent cooling load is mainly driven by the rate of latent heat gain induced by the crops, which is influenced by the LAI and the indoor conditions.
Discussion
The proposed workflow demonstrates the impact of crops on peak loads for different grower scenarios. The estimated rates of heat gain/loss induced by the crops tabulated in can be used to determine the sensible and latent crops heat gains of the BIA space. The integration of the crop model to an energy simulation software is considered as essential for future work since it provides the possibility of evaluating crop yield and the energy performance of the BIA space. This section discusses the impact of the grower’s choices on peak loads and the benefits and limits of the method proposed in this study to size HVAC equipment.
Impact of the growers’ choices
Growers’ choices considerably influence the rates of heat gain/loss induced by the crops used to estimate peak loads. The most influential parameters include the following:
The existence of the dark period (for sensible heating peak load only). Some growers schedule a 24-hour photoperiod for lettuce growth, thus influencing the assumptions used to estimate the peak sensible heating load.
The cultivated density. This could vary in terms of space dedicated to equipment and operation, as well as in the number of tiers of growing beds.
The crop growth management method (single-stage or diversified stages).
The indoor air condition set points (temperature and humidity or VPD).
The indoor air condition set points are of prime importance when they are controlled based on a VPD set-point since different combinations of temperature and relative humidity can lead to the same VPD value. As highlighted in , for the BIA space under study, at its highest density (CD = 600%) for a VPD set-point of 0.75 kPa, the total estimated peak cooling load (sensible and latent) is different (about 25 kW). It also leads to completely different sensible heat ratios of the space to be considered to size the HVAC equipment. In this case, it would be recommended to estimate the peak latent cooling load using the worst-case temperature/humidity combination to make sure the VPD set-point can be maintained at all times and the HVAC equipment properly sized. To our knowledge, there is currently no detailed approach available to address this issue: the use of a modeling tool, as proposed in this paper, could assist in the estimation of the peak sensible and latent cooling loads for BIA space.
HVAC equipment sizing: Benefits and limitations
The approach proposed to estimate the peak loads of a BIA space by considering crops can be used to size the HVAC equipment. The distribution between sensible and latent load has been previously highlighted as being a key factor for HVAC equipment sizing and energetic performance of plant factories (Graamans et al. Citation2017). For the heating equipment, sizing based on sensible heating load calculation that neglects crops could lead to periods where the temperature set-point would not be met. Since the humidity level in a BIA space is high, when the indoor temperature decreases and approaches the dew point, there is a risk of condensation on colder surfaces. This could also lead to condensation on leaves, which are generally colder than the temperature of the BIA space, causing various diseases, which is a well-known issue in horticulture (Huber and Gillespie Citation1992). Moreover, because of the heat losses by conduction through the envelope during winter in cold climates, the temperature of the walls, floor or ceiling could be below the air dew point temperature if the set-point is not maintained. This could jeopardize the integrity of the envelope.
The proposed approach to estimate the peak sensible heating load could lead to the load being overestimated as some growers choose to grow lettuces under 24-hour photoperiods (i.e., without dark periods). As illustrated in and , under a diversified stage crop growth management method, the lighting heat gains are larger than the crop cooling effect, thus there is no heating required. For this case, it is recommended to size the heating equipment using the sensible heating load when no internal gains/losses are considered, i.e., the baseline peak heating load (). On the other hand, for a 24-hour photoperiod under a single stage crop growth management method, the proposed approach adequately estimates the peak sensible heating load since the cooling effect induced by the crops exceeds the lighting heat gain ().
The sizing of the dehumidification equipment is based on the estimated peak latent cooling load, when rates of heat gain/loss induced by the crops are considered. When the BIA space dehumidification equipment is not properly sized, the humidity set-point cannot be easily maintained. This leads to a higher dew point temperature, increasing the risk of condensation on leaves, walls, ceiling and floor as the air temperature drops. Under such circumstances, when the initially installed dehumidification equipment does not have the capacity to maintain the humidity set-point, it is customary to add small portable and stand-alone dehumidification units. This makes it harder to reach and maintain the humidity set-point since the smaller pieces of equipment are more challenging to control and their lifespan is usually shorter (DCA Citation2018).
The estimated peak latent cooling load in this study may have been overestimated for the following reasons. First, the latent gain was considered instantaneous, which might not always be the case as highlighted by Jonlin and Lewellen (Citation2017). The latent cooling load is influenced by the choice of material made for the walls, floor and ceiling of the BIA space, which in this study, is a material that has no moisture-holding capacity, i.e., moisture is absorbed only by the air. The use of a different material with some moisture holding capacity for interior partitions, the floor and the ceiling in the BIA space would probably lower the peak latent cooling load. Moreover, a concrete floor in a BIA space could have an important effect on the latent cooling load because of the holding moisture capacity of concrete (Kavanaugh Citation2006).
Second, dehumidification equipment has commonly been sized according to dark period requirements (DCA Citation2018). This period has been targeted as critical since the sensible cooling system sized to manage the lighting heat gain and dehumidify the air is off. However, it was theoretically shown in a previous study (Talbot and Monfet Citation2018) that the highest latent cooling load occurs when the lights are on; additional comparative investigations of theoretical and real cases is thus required. This discrepancy can be explained by the use of the TRNSYS Type 2280, which could have underestimated the dehumidification of the air as it gets cooled, thus overestimating the latent cooling load during the photoperiod.
It was further shown by Zhang and Schulman (Citation2017) that when the lights are suddenly turned off in a controlled-environment agriculture space, the heating and dehumidification equipment may have difficulty maintaining the temperature and the relative humidity set points. This situation has been identified as critical since it triggers a temperature drop and a relative humidity rise, but in the present study, it was not considered in estimating the impact of crops on peak loads. In future work, heating and dehumidification equipment, sized according to the proposed estimated peak loads, could be modeled to further assess the performance and limits of the proposed approach when the lights are suddenly turned off.
Conclusion and future work
Based on a general case of a BIA space in cold climates, the results in the present study show the impact of considering crops on peak loads. Crop parameters have been proposed for their inclusion as additional internal heat gains/losses to estimate the peak sensible heating and latent cooling loads according to design conditions. A parametric study was completed to estimate the peak loads for different grower scenarios. Results of this study showed that crops had a significant impact on peak loads, and neglecting them could lead to inadequate equipment sizing. The peak sensible heating load shows that the cooling effect of crops is potentially important as well, and consequently, neglecting the rates of heat gain/loss induced by the crops could lead to an underestimation of the heating equipment capacity. On the other hand, the estimated peak latent cooling load was high and demonstrated the need for the use of independent dehumidification equipment to maintain the indoor conditions: the proposed modeling approach could be used to improve the sizing process. The results for the different grower scenarios showed that the LAI, the cultivated density, and the indoor air conditions (temperature and humidity) had a significant impact on peak loads, just as choosing to grow lettuces with or without a dark period. The growing parameters are usually determined by growers and influenced by horticultural methods, and some have been shown to be more influential than others on the estimated peak loads.
The main limitation of this study is that the results obtained only depicted BIA space loads for a space with limited thermal exchanges with the outdoor environment, which is typical for CEA space. However, the proposed modeling approach could easily be applied to cases where the thermal exchanges by conduction, ventilation and infiltration are more important. The versatility of the approach lies in the integration of a crop model to a building model in an energy simulation software.
The approach used in this study provided the basis for a valuable dialogue between growers and HVAC designers during the preliminary design of BIA space. The approach has not yet been validated with measured data, which would support the development of guidelines to include crops as an internal gain/loss to be considered as part of the load calculation, which is an essential step to adequately size the HVAC equipment. This study highlights the very distinct energetic behavior of crops and their various thermal impacts in a building space. Crops stand out from the existing internal gain categories and thus should form a new category of internal gain/loss.
In terms of future work, it is proposed to improve the versatility of the crop model for its easy implementation in energy modeling tools. The BIA space model could also be improved by modifying the TRNSYS Type 2280 and adding the thermal mass of the hydroponic system that is influenced by the cultivated density. A CFD study could also be completed in order to define the convective coefficient for walls and ceilings that takes into account the fans that are essential to air mixing in a BIA space.
NOMENCLATURE
| = | Carbon dioxyde concentration (ppm) | |
| = | PAR emitted by the horticultural electric lighting (W/m2) | |
| = | Extinction coefficient of diffuse radiation (-) | |
| = | Convective coefficient (W/(m2·0C)) | |
| = | Net long-wave radiation flux exchange between surfaces (W/m2) | |
| = | Convective exchange flux with ambient air, which can cause the crop cooling effect (W/m2) | |
| = | Latent exchange flux with ambient air, mostly by transpiration from the leaves (W/m2) | |
| = | Flux used for the photosynthesis (W/m2) | |
| = | Transmitted solar radiation flux absorbed by crops (W/m2) | |
| = | Flux stored within the leaves, stems and fruits (W/m2) | |
| = | Short-wave radiation flux absorbed by the crops from lights (W/m2) | |
| = | Aerodynamic layer (s/m) | |
| = | Stomatal resistance (s/m) | |
| = | Air temperature (0C) | |
| = | Sky temperature (0C) | |
| = | Crops temperature (0C) | |
| = | Air flow speed over crops (m/s) |
Greek symbols
| λ | = | Latent heat of vaporization of water (J/g) |
| = | Leaf reflection coefficient (-) | |
| = | Vapor concentration at the leaves (g/m3); | |
| = | Vapor concentration in the air (g/m3); | |
| = | Air relative humidity (%) |
Acronyms
| CAC | = | Cultivation Area Cover (%) |
| LAI | = | Leaf Area Index coefficient (-) |
| VPD | = | Vapor pressure deficit (kPa) |
References
- ASHRAE. 2007. Load Calculations. Chapter 4 In Air conditioning system design manual. 2nd ed. Burlington: Butterworth-Heinemann.
- ASHRAE. 2010. ASHRAE Standard 90.1-2010, Energy standard for buildings except low-rise residential buildings. Atlanta: ASHRAE.
- ASHRAE. 2013. Nonresidential cooling and heating load calculations. Chapter 18 In ASHRAE Handbook - Fundamentals. Atlanta: ASHRAE.
- Benis, K., C. Reinhart, and P. Ferrão. 2017. Development of a simulation-based decision support workflow for the implementation of Building-Integrated Agriculture (BIA) in urban contexts. Journal of Cleaner Production 147:589–602. doi:10.1016/j.jclepro.2017.01.130
- Brechner, M., A. Both, and C. Staff. 1996. Hydroponic lettuce handbook. Cornell Controlled Environment Agriculture: Cornell University.
- Crawley, D. B., J. W. Hand, M. Kummert, and B. T. Griffith. 2008. Contrasting the capabilities of building energy performance simulation programs. Building and Environment 43 (4):661–73. doi:10.1016/j.buildenv.2006.10.027
- Crawley, D. B., L. K. Lawrie, C. O. Pedersen, and F. C. Winkelmann. 2000. Energy plus: Energy simulation program. ASHRAE Journal 42 (4):49–56.
- DCA. 2018. Indoor farming: Ensuring high yield, high quality crops with custom dehumidification and air quality systems. Dehumidifier Corporation of America, Cedarburg, WI/USA. Accessed August 10, 2020. https://www.dehumidifiercorp.com/lp-growhouse-ebook.
- De Zwart, H. F. 1996. Analyzing energy-saving potentials in greenhouse cultivation using a simulation model. Ph. D. Thesis, Wageningen Agricultural University, Wageningen.
- Fraile-Robayo, R. D., J. G. Álvarez-Herrera, A. J. Reyes M, O. F. Álvarez-Herrera, and A. L. Fraile-Robayo. 2017. Evaluation of the growth and quality of lettuce (Lactuca sativa L.) in a closed recirculating hydroponic system. Agronomía Colombiana 35 (2):216–22. doi:10.15446/agron.colomb.v35n2.63439
- Fuchs, M. 1993. Transpiration and foliage temperature in a greenhouse. Proceedings of International Workshop on Cooling Systems for Greenhouses, Tel Aviv, Israel.
- Graamans, L., A. van den Dobbelsteen, E. Meinen, and C. Stanghellini. 2017. Plant factories; crop transpiration and energy balance. Agricultural Systems 153:138–47. doi:10.1016/j.agsy.2017.01.003
- Guglielmetti, R., D. Macumber, and N. Long. 2011. OpenStudio: An Open Source Integrated Analysis Platform. NREL. Building Simulation 2011, Sydney, Australia, November 14–6.
- Hézard, P., S. Swathy, L. Poughon, J.-P. Fontaine, and C.-G. Dussap. 2012. Experimental setup, modeling design and preliminary results for higher plant growth control in the bioregenerative life support systems. Proceedings of the 42nd International Conference on Environmental Systems 2012, San Diego, California, July 15–19.
- Huber, L., and T. J. Gillespie. 1992. Modeling leaf wetness in relation to plant disease epidemiology. Annual Review of Phytopathology 30 (1):553–77. doi:10.1146/annurev.py.30.090192.003005
- Jarvis, P. 1976. The interpretation of the variations in leaf water potential and stomatal conductance found in canopies in the field. Philosophical Transactions of the Royal Society of London B: Biological Sciences 273 (927):593–610.
- Jonlin, D. L., and D. J. Lewellen. 2017. A low-energy high managing energy use for commercial indoor cannabis cultivation. Energy Engineering 114 (4):69–79. doi:10.1080/01998595.2017.11876936
- Kavanaugh, S. P. 2006. HVAC Simplified. Atlanta, GA: American Society of Heating, Refrigerating and Air-Conditioning Engineers.
- Klein, S. A, et al. 2017. TRNSYS 18: A Transient System Simulation Program. Madison, USA: Solar Energy Laboratory, University of Wisconsin.
- Kokogiannakis, G., and P. Cooper. 2015. Evaluating the environmental performance of indoor plants in buildings. Proceedings of the 14th International Conference of IBPSA - Building Simulation, Hyderabad, India, December 7–9.
- Kozai, T., G. Niu, and M. Takagaki. 2015. Plant factory: an indoor vertical farming system for efficient quality food production. Academic press.
- Kuack, D. 2017. Growing in a “perfect” greenhouse climate. https://urbanagnews.com/blog/exclusives/growing-in-a-perfect-greenhouse-climate
- Liu, R., X. Zhou, S. J. Lochhead, Z. Zhong, C. V. Huynh, and G. M. Maxwell. 2017. Low-energy LED lighting heat gain distribution in buildings, part II: LED luminaire selection and test results. Science and Technology for the Built Environment 23 (4):688–708. doi:10.1080/23744731.2016.1250563
- Lomax, R. 2018. LED grow lamps for lettuce-LUX, PPFD, spectrums, and growth-observations during 2017. Accessed August 10, 2020. https://www.researchgate.net/publication/322228559_LED_Grow_Lamps_for_Lettuce-LUX_PPFD_Spectrums_and_Growth-Observations_during_2017.
- McCartney, L., and M. Lefsrud. 2018. Protected agriculture in extreme environments: A review of controlled environment agriculture in tropical, arid, polar, and urban locations. Applied Engineering in Agriculture 34 (2):455–73. doi:10.13031/aea.12590
- Monteith, J. L. 1965. Evaporation and environment: The state of the movement of water in living organisms. Symposia of the Society for Experimental Biology 19:205–34.
- Pamungkas, A. P., K. Hatou, and T. Morimoto. 2014. Evapotranspiration model analysis of crop water use in plant factory system. Environmental Control in Biology 52 (3):183–8. doi:10.2525/ecb.52.183
- Prenger, J. J., R. P. Fynn, and R. C. Hansen. 2002. A comparison of four evapotranspiration models in a greenhouse environment. Transactions of the ASAE 45 (6):1779.
- Puri, V., and T. Caplow. 2009. How to grow food in the 100% renewable city: Building-integrated agriculture. Chapter 12 In 100% renewable: Energy autonomy in action. London: Routledge.
- Royal Philipps. 2018. Horticulture LED solutions GreenPower LED toplighting. Accessed August 10,2020. https://www.lighting.philips.com/main/products/horticulture/products/greenpower-led-toplighting.
- Sethi, V. P., K. Sumathy, C. Lee, and D. S. Pal. 2013. Thermal modeling aspects of solar greenhouse microclimate control: A review on heating technologies. Solar Energy 96:56–82. doi:10.1016/j.solener.2013.06.034
- Spitler, J. D. 2014. Load calculation applications manual. Atlanta, GA: American Society of Heating, Refrigerating, and Air-Conditioning Engineers.
- Stanghellini, C. 1987. Transpiration of greenhouse crops: An aid to climate management. Ph. D. Thesis, Wageningen Agricultural University, Wageningen.
- Talbot, M., and D. Monfet. 2018. Impact des plantes sur les charges d’un espace d’agriculture intégré au bâtiment: Implantation d’un modèle de plantes [Impact of plants on loads of a building-integrated agriculture space: Implementation of a plants model]. Proceedings of eSIM 2018, Montreal, QC, May 9–10.
- Tei, F., A. Scaife, and D. P. Aikman. 1996. Growth of lettuce, onion, and red beet. 1. growth analysis, light interception, and radiation use efficiency. Annals of Botany 78 (5):633–43. doi:10.1006/anbo.1996.0171
- Thom, A., and H. Oliver. 1977. On Penman's equation for estimating regional evaporation. Quarterly Journal of the Royal Meteorological Society 103 (436):345–57. doi:10.1002/qj.49710343610
- Vanthoor, B. H. E., P. H. B. de Visser, C. Stanghellini, and E. J. van Henten. 2011. A methodology for model-based greenhouse design: Part 2, description and validation of a tomato yield model. Biosystems Engineering 110 (4):378–95. doi:10.1016/j.biosystemseng.2011.08.005
- Wang, J., W. Lu, Y. Tong, and Q. Yang. 2016. Leaf morphology, photosynthetic performance, chlorophyll fluorescence, stomatal development of lettuce (Lactuca sativa L.) exposed to different ratios of red light to blue light. Frontiers in Plant Science 7:250. doi:10.3389/fpls.2016.00250
- Ward, R., R. Choudhary, C. Cundy, G. Johnson, and A. McRobie. 2015. Simulation of plants in buildings; incorporating plant-air interactions in building energy simulation. Proceedings of the 14th Conference of International Building Performance Simulation Association, Hyderabad, India, December 7–9.
- Watson, D. J. 1947. Comparative physiological studies in the growth of field crops. I. Variation in net assimilation rate and leaf area between species and varieties, and within and between years. Annals of Botany 11 (1):41–76. doi:10.1093/oxfordjournals.aob.a083148
- Zhang, S., and B. Schulman, 2017. A numerical model for simulating the indoor climate inside the growing chambers of vertical farms with case studies. International Journal of Environmental Science and Development 8 (10):728–35. doi:10.18178/ijesd.2017.8.10.1047