Abstract
Urban building energy models (UBEM) are driving sustainable design and operations of cities by combining urban datasets with energy simulations. UBEMs are developed from a range of inputs on the spatial and semantic details of the buildings, and the systems affecting their energy performance. Large geographical scales with finer spatio-temporal details increase the challenges of data processing for a reliable UBEM. Thus, it is essential to understand the impact of increasing the resolution of model inputs on the outputs to balance the efforts spent on model development, filling data gaps and maintaining the reliability of the results. This research introduces a Fit-for-Purpose modeling strategy and extends the concept of Levels of Detail (LoD) used for 3 D models, to UBEM characteristics including occupancy, geometry, context, modeling methodology, and calibration with the proposed model characterization framework. A case study based on a 0.3 km2 area of Ahmedabad, India, is presented to demonstrate the framework. The results highlight a need for a higher LoD in occupancy modeling for the residential and educational buildings, whereas a higher LoD is more important for the commercial buildings’ envelope characteristics. These insights will enable a highly targeted supplementary data collection approach for the UBEM of the entire city.
Introduction
Urban development in India
India’s urbanization at a rate of 34% will bring 590 million urban residents by 2030 (McKinsey Citation2010). This will put immense pressure on the urban infrastructure systems, with an additional 20 billion m2 floor area required in the residential and 4 billion m2 in the commercial sector (GBPN CEPT. Citation2014; Kumar et al. Citation2010). Building operations account for 31% (AEEE Citation2018) of India’s total energy consumption,. Urban Local Bodies (ULBs) spend nearly 60% of their operational budget on the energy bills of municipal services including water supply (Iyer et al. Citation2020). With 70% of the building stock of 2030 yet to be constructed (GBPN CEPT Citation2014), development through contemporary practices will double the electricity consumed in buildings from 544 TWh to 1192 TWh (NITI Citation2015). Considering this, it is a daunting task to achieve India’s Nationally Determined Contribution of reducing emissions to 35% of the 2005 levels, and the Sustainable Development Goals 7, 11 and 13. Energy efficiency codes and policies like the Energy Conservation Building Code (ECBC) (BEE Citation2017), and the National Energy Policy will help to guide this sustainable development (Khosla and Janda Citation2019). However, there is an enormous gap in implementing these policies because of a lack of assessment of their effect on urban buildings & infrastructure dynamics, and the limited data currently available on a city’s building stock and energy consumption patterns.
The role of UBEMs in developing policy recommendations
UBEMs (Urban Building Energy Models) are emerging as powerful tools for addressing these challenges. UBEMs, as described by Hong, Chen, et al. (Citation2020) refer to the computational modeling and simulation of the energy performance of a group of buildings in the urban context in order to account for the interactions between buildings, urban infrastructure and microclimate. The concept of UBEM stems from the classification of Urban Energy Models into top-down or bottom approaches by Swan and Ugursal (Citation2009). Its definition in literature extends from being limited to only bottom-up physics-based simulation models of a group of buildings in the urban context (Reinhart and Cerezo Davila Citation2016); both bottom-up and top-down approaches that can be subdivided into statistical, data-driven or simulation based models (Hong, Chen, et al. Citation2020). While both top-down statistical and bottom-up data-driven UBEMs are widely used for estimating urban energy use, they have two important limitations: (1) accessibility of historic and current energy use data and (2), inability to account for design modifications (Abbasabadi and Mehdi Ashayeri Citation2019). For its applications Indian cities where such data are scarce (Shnapp and Laustsen Citation2013), these challenges are insurmountable. Combining the data generated in cities with energy simulations, bottom-up simulation based UBEMs can help assess the impact of energy efficiency codes, amend them to suit the regional context and guide sustainable urban development and governance policies. During the last decade, bottom-up simulation-based UBEMs have been extensively researched for urban and regional analyses where integrated energy supply-demand scenarios are being investigated (Johari et al. Citation2020). Successful applications of UBEMs include: energy benchmarking and retrofit strategies with lifecycle cost (Hong et al. Citation2016), developing energy performance based urban design (Bergerson et al. Citation2015), and designing district energy systems and municipal service network (Fonseca et al. Citation2016). This paper is focused on Bottom-up, simulation-based UBEMs due to its growing popularity in research and practice for the intended application in sustainable urban development.
Developing a UBEM requires both geometric and semantic data (non-geometric) for the building stock. This includes: (a) building geometry, floor area, glazing area; (b) year built/refurbished; (c) geographical location, neighboring context and climate; (d) building use type and operational patterns; (e) HVAC, lighting, equipment loads; and (f) construction details. These models can also account for the energy consumption in municipal services required for building operations, like water-pumping, waste disposal and common lighting provided inputs for plug loads, capacity, and operational hours, are available. Although bottom-up physics-based models are not solely dependent on metered energy consumption data, it is useful for validating the simulation results and reducing model uncertainties.
The need to extend the LoD concept
Biljecki (Citation2013) introduced the concept of Level of Detail (LoD) for geometric data, establishing a clearly defined framework of different levels of granularity in the detail provided about the geometric model. The LoD concept facilitates comparison between models and allows assessment of the impact of increasing detail on model results and accuracy. Like geometric model, various types and resolution of semantic urban data and modeling approaches have also been proposed by academics and practitioners to develop a UBEM (Hong, Chen, et al. Citation2020; Johari et al. Citation2020).
At present, there is a lack of consistency in nomenclature of these modeling approaches and urban datasets; identifying their resolution, and understanding their choice of selection with respect to the desired UBEM applications and outputs (Ferrando et al. Citation2020). While oversimplification of urban data and modeling approach might cause large inaccuracies, very detailed inputs are not always necessary to obtain consistent results from a UBEM, as demonstrated by Chen and Hong (Citation2018), Monteiro et al. (Citation2017), and Nouvel et al. (Citation2017). Their work indicates that there is no direct relation between increasing the resolution and complexity of the model inputs and methodology with the model accuracy or desired outputs.
For contexts like India’s where the current data on building stock and energy use is unstructured with many gaps (Shnapp and Laustsen Citation2013), maintaining data quality, collecting additional data and managing UBEM complexity with least uncertainty, becomes a huge challenge. To make the best use of the available data and streamline the resources required to collect additional data, there is a need to assess of how increasing detail in one aspect or characteristic of the UBEM affects overall model results.
This presses to shift focus toward a “fit-for-purpose” approach for developing a UBEM. Similar to the concept introduced by Gaetani, Hoes, and Hensen (Citation2016) for occupant behavior modeling in building energy simulations, there is a need to assess the best, most suitable LoD of the model characteristics that provide the most reliable results for the intended application of UBEM and cost the least in terms of effort.
This approach will enable a suitable tradeoff between the LoD, and the efforts and resources spent on filling input data gaps and complexity of model development, without compromising the reliability of the intended UBEM outcomes.
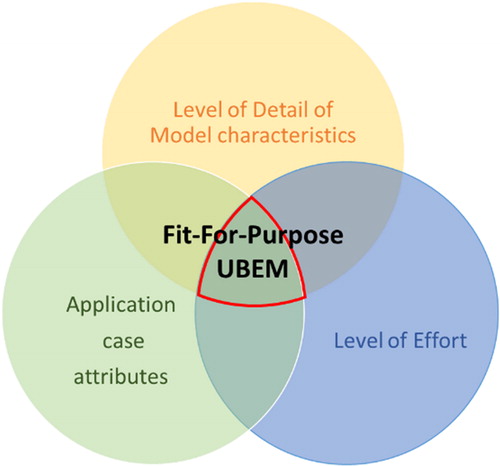
This research aims to develop a Model characterization framework, leading to a Fit-for-Purpose UBEM approach. This framework extends the LoD concept introduced for city 3 D models (Biljecki Citation2013) to a wider range of UBEM characteristics and uses a detailed literature review to identify the possible LoDs for each.
The “fitness” of the UBEM will vary contextually with the availability of data, resources, the intended application, and the objective of developing the UBEM for different projects. Therefore, along with identifying these LoDs in the model characteristics, this research introduces the concept of Application Case Attributes and Level of Effort (LoE) and ties all three of them in a broader perspective to approach Fit-for-Purpose UBEMs ().
Fig. 1. The concept of Fit-for-Purpose UBEMs being developed as an optimum balance between Level of Detail, Application attributes and Level of Effort.
The Model characterization framework is then applied to a case study in the city of Ahmedabad. It assesses the impact of increasing the LoD of certain characteristics on the model outcomes against the effort required to simulate these. This case study highlights the utility of the framework and the Fit-for- purpose approach and facilitates the development of targeted strategies for supplementary data collection.
Developing the model characterization framework
This section describes the development of the model characterization framework and the identification of different LoD for each characteristic through the literature review.
Previous attempts to develop classification frameworks
The growing popularity and utility of UBEMs has led to the development of various and wide ranged modeling approaches to explain the differences between different models.
Nouvel et al. (Citation2017) assessed the impact of data granularity on UBEM results by increasing details in one aspect of the model and comparing its results with a lesser detailed model for a case study of Ludwigsburg. The selection of input data for this comparison and the results obtained were highly specific to the case study and the information available to the researchers. However, their approach to categorize different UBEM simulation inputs based on their priority or sensitivity, motivated the development of the framework discussed in this paper. Ang, Berzolla, and Reinhart (Citation2020) addressed a similar problem of selecting an appropriate modeling methodology for different applications, by introducing a concept of a Minimum Viable UBEM. They identified four typical UBEM applications and suggested suitable details for geometry, archetype templates, weather data, measured energy data and calibration methods for each application through a literature review.
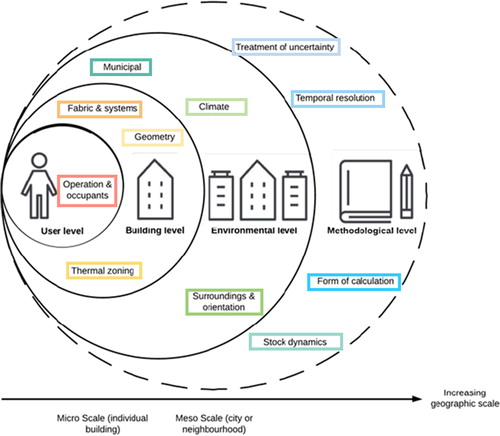
Ferrando, Causone, Hong, and Chen’s study (Ferrando et al. Citation2020) focused on the main bottom-up physics-based UBEM tools, comparing them from a user-oriented perspective,. They were classified based on: (i) the required inputs, (ii) the reported outputs, (iii) the exploited workflow, (iv) the applicability of each tool, and (v) the potential users. The review presented by them for the research and developments potential in the field of UBEM indicates the presence of different modeling approaches in various aspects like datasets for building geometry, occupant behavior, accounting for microclimate, inter-building heat exchange and model calibration techniques. The review indicated the impact of these approaches the model outcomes had in specific UBEM projects. They suggested that mixed used of databases, dissimilar nomenclature of methodologies, lack of structured framework and standardization for data collection and modeling methodologies leads to a difficulty in choosing an appropriate UBEM tool, balancing the level of complexity, accuracy, usability, and computing needs. Fennell et al. (Citation2019) aimed specifically to develop a framework which would allow the characteristics of the UBEM, and adequacy of the data to be assessed across different descriptors of the model characteristics for a regional context, especially where data is scarce. In their framework, eleven model characteristics were defined that represent a typical UBEM across four levels i.e., User, Building, Environment and Methodology as shown in . For each model characteristic a series of descriptors were established from the literature review to classify approaches of varying granularity.
Fig. 2. Model characterization framework developed by Fennel et.al 2019.
While all these researchers have addressed a similar problem, the challenge persists in formalizing the definition of the model characteristics and their LoD that exist in theory and practice.
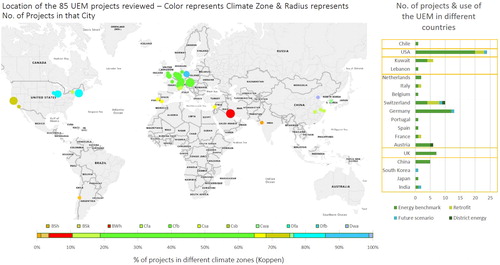
This study uses Fennell et al. (Citation2019) as a starting point and includes an additional model calibration layer. The literature review undertaken by Fennell et al. (Citation2019) is extended using a snowballing approach to encompass 85 UBEM studies. illustrates the geographic spread of the studies and helps to identify the most relevant case studies for new projects in those regions. Descriptions of each characteristic were recorded using Eppi Reviewer (ER4.5 Citation2018) and were sorted into themes from which definitions for different LoD were derived.
Fig. 3. Global coverage of the UBEM projects reviewed – color represents Climate Zone & radius represents number of studies in that city.
The complete details of the classification of each study can be found in Appendix 1. The following sections detail the updated categories of approach for each of the 11 model characteristics identified in Fennell et al. (Citation2019) and includes a new characteristic – the level of application of calibration. We begin by examining the use case of the UBEM before moving on to the characteristic framework.
Use case of the UBEM
highlights the trend of models developed for specific cases before being repurposed for different contexts and datasets. Consequently, it is anticipated that along with the required degree of accuracy and intended spatial scale, the use case of a particular UBEM will inform key decisions about the types and granularity of data required. Hong, Chen, et al. (Citation2020) identified 4 distinct use cases:
Energy use benchmark
Existing building retrofits
Energy forecasting and performance-based design
District energy system design and optimization.
From the observation of statistics and the review of the UBEM projects considered in this research it was found that 75% of the projects are developed to be used for End use energy benchmarking or developing baseline energy models. 17% of the projects performed Energy retrofit studies, followed by 6% projects for Future scenarios. Since data availability is a common challenge in most of the UBEM exercises (Johari et al. Citation2020), baseline model calibration is essential to minimize uncertainty in modeling assumptions across different model characteristics, which is essential for application in Retrofit and future scenario assessment. Apart from this, only 2% projects worked on district energy systems and municipal service integration. Cities with detailed urban datasets have been able to test advanced applications of UBEM with certain confidence in results post calibration (Romero, Fonseca, & Schlueter, 2017).
The model characteristics
Occupancy
Happle, Fonseca, and Schlueter (Citation2018) indicated that occupant behavior can be modeled as presence or activity that represents operation of equipment, lighting, and other systems. They categorized occupancy modeling methods as – deterministic and stochastic, that can be space or person-based. From these, only three combinations were practically observed: (1) deterministic space-based, (2) stochastic space-based, and (3) stochastic person-based approaches. Further these approaches can have or not have diversity. Diversity can again be space-based and may be introduced within the building archetypes or person based accounted by the kind of population, e.g., permanent v/s visitors. From this, 4 levels of detail were established:
Deterministic – single profile: These models use a repeatable hourly schedule of a typical day in the year. The same schedule is applied to all buildings from the same archetype e.g., T. Hong, Chen, Piette, et al. (Citation2018) who use a DOE benchmark survey or Heiple and Sailor (Citation2008), who based occupancy schedules on the ASHRAE benchmark survey. This approach lacks diversity so is unsuitable for modeling peak loads but is easy to define from reference buildings.
Deterministic – multi-profile: extend the single profile approach to include a variety of profiles for the same archetype, e.g. Quan and Li (Citation2015), which varies occupancy density or which includes diversity across archetypes. This approach is useful for creating seasonal diversity, and creating diversity across buildings in an archetype.
Stochastic space-based: Derived from statistical distributions to predict the occurrence of certain actions. The probability of each action depends upon the previous action. Richardson, Thomson, and Infield (Citation2008) use a Time of Use Survey (TUS) at 10 minute interval for multiple spaces, occupants and buildings in an archetype using several occupant surveys to derive stochastic profiles and create spatial & temporal variations.
Agent based (Stochastic person based): Models every individual’s presence, activities and actions based on probability distributions, for example Robinson et al. (Citation2007) developed occupancy models based on TUS with sensor data for occupant presence, time of arrival and window opening to account for mixed mode operations. Barbour et al. (Citation2019) proposed tracking the 3.5 million inhabitants of Boston from mobile phone usage using a statistical Time-Geo Framework. With this approach they observed that occupancy patterns are 5 times lower from deterministic approach. A difference of 15 to 21% was noted in the energy consumption due to this.
Building geometry
3D city models are required to define building’s geometry, envelop thermal properties, glazing ratio, ventilation rates, inter-building heat exchange and mutual shading. This geometry can be made available in the form of Semantic City 3 D models. Traditionally, 3 D city models can be developed with Levels of Detail ranging from 0 to 4 (Biljecki Citation2013). So far, no UBEM models have been developed with LoD4 due to high complexity and unnecessary detailing. The commonly adopted geometry LoDs are:
2D geometry (CityGML LoD0) – Buildings represented as footprints or roof edge polygons, in absence of building geometry arbitrary box models are developed. (Filogamo et al. Citation2014) used cubiod geometry based on typical floor area to generate a scaled dynamic UBEM. These approaches are suitable for statistical and data driven calculation and are often used to explore solar insolation potential, although over shadowing may compromise results.
2.5D extrusion (CityGML LoD1)– 2D geometry of the building footprint extruded to their respective heights. This is the most widely used approach for UBEMs. Cerezo Davila, Reinhart, and Bemis (Citation2016) combined a 2D GIS database with cadastral data for the number of floors to extrude the 2.5D model. They observed that the differences in conditioned volumes to the modeled volume resulted in some errors when not combined with other semantic details.
3D Geometry (CityGML LoD2) – represents the actual 3D geometry of the buildings accounting for different shapes of the roofs as opposed to the prismatic flat roof LoD1 geometry. Monien et al. (Citation2017) used LiDAR data and building reconstruction methods to develop the same for Essen, Germany. They found an increase in accuracy of 10% compared with LoD1. Nouvel et al. (Citation2017) also observed an increase of 15–20% in the result accuracy for buildings with pitched roofs and attics while modeling a 3D geometry as compared to 2.5D extrusion.
3D with external features (CityGML LoD3) – 3D models with detailed wall and roof structures including doors, windows and other external features. Saretta, Bonomo, and Frontini (Citation2020) used these models for estimating the potential of BIPV on an urban district in Switzerland. They found that exact glazing ratios and shading elements improved model accuracy but resulted in four times increased computational effort.
Thermal zoning
To perform thermal simulation, zones are created to represent and group interior spaces in a building with similar exposure to outdoors, operational patterns, HVAC systems and thermal conditions (set-point temperature, ACH etc) and report their average results. Four classes of approach were identified in the literature:
Single Zone per building – each building volume is a single thermal zone, e.g., (Robinson et al. Citation2009). This approach is suitable when the entire building has similar use and construction characteristics.
Zone per floor/Space – Separate thermal zone to account for the ground floor and top floor having different adjacencies and exposure e.g., (Chen, Hong, and Piette Citation2017). This is the most popular approach for dynamic UBEMs and accounts for different uses in a single building. Chen and Hong (Citation2018) used a variant approach in which floor multipliers are used to group similar floors, reducing simulation time by 3 times with marginal increase of 2.6% error.
Core-Perimeter zoning – Accounts for impact of different orientations. Perimeter zoning along the façade within 5m depth, is also prescribed by ASHRAE 90.1x G. Dogan, Reinhart, and Michalatos (Citation2016) proposed an autozoning algorithm to implement this approach. Chen and Hong (Citation2018) found an improved accuracy of predicted cooling & heating loads by 7.5% & 16.9% respectively with this zoning approach.
Detailed internal zoning – Further divides interiors spaces following the building’s interior layout e.g., (Yi and Peng Citation2019) and (Remmen et al. Citation2018). This approach requires detailed information of the internal layouts and is typically restricted to scaled dynamic and reduced order models.
Building archetypes
Reinhart and Cerezo Davila (Citation2016) indicated that development of archetype requires segmentation and characterization. In segmentation, the building stock is classified according to the building’s shape, age, use, energy consumption, systems, or other parameters. Characterization assigns a complete set of thermal properties including construction assemblies, schedules and building systems for the archetype. Johari et al. (Citation2020) highlighted that most studies relied on simple archetype development from the available data. Clustering algorithms can also be used for classification based on multiple parameters. They indicated that archetype classification and characterization can be either deterministic or probabilistic. Typically, classification by building use type represents the operational profile and the building age represents the construction materials and the systems. In this proposed framework, Building Archetypes only considers classification of archetypes. Characterization and calibration of the inputs is separately dealt with in the Treatment of Uncertainty. Three classes of approach were found:
Single criteria – based on use type (e.g., residential, commercial etc.) or vintage. Building use types are determined from literature or cadastral data. Archetype-based inputs (e.g., operating schedules, building fabric) are the same for all buildings, for e.g., (Darren Robinson et al. Citation2009).
Multiple with a single criterion – a variety of different archetypes are included within a single criterion, such as building use type. However, each building within the archetype uses the same inputs. To elucidate, residential buildings may be divided into types such as attached, detached, apartments, etc. The study conducted by Davila (Citation2017) found the error reduced from 16% to 4% by having multiple residential archetypes based on age group.
Multiple with multiple parameters – Multiple combinations across different parameters e.g., Use type and age – Apartment 20 yrs. old, Detached 40 yrs. etc. e.g., Monteiro et al. (Citation2017), Coffey et al. (Citation2015). This approach required detailed data on building type and class, age, roof shape, size, and neighborhood characteristic. The need to create multiple archetypes depends on the variability and the sensitivity of the parameters i.e. when their representativeness toward energy use is important.
Context
Effects of local shading, shared walls between buildings, radiation from sky & neighboring buildings and wind patterns can be accounted in a UBEM. The following approaches were found in the reviewed projects:
Standalone: Does not consider any urban context. They are typically used in Scaled dynamic UBEM where City 3D model is unavailable, e.g. Berthou et al., (Citation2019; Bhatnagar et al. (Citation2017)
Contextual shading: Mutual shading and adjacencies are considered in simulations. This requires 3D model of contextual buildings. e.g., Krayem et al. (Citation2019) included potential shading surfaces for each building with height H in a radius of 3.78H (calculated from the sun angles). Chen and Hong (Citation2018) used a pre-processing algorithm to remove blocked surfaces, only considering effective shading surfaces in the context. This improved simulation time by 70%.
Detailed contextual interaction: Includes long-wave radiant exchange between buildings, and microclimatic effects. This requires modeling surface properties of contextual structures, additional algorithms, and simulation tools. Hong, Ferrando, et al. (Citation2020) used this method to account for longwave radiant exchange and waste heat from HVAC systems with the details of system type and COP. Palme & Salvati, (Citation2018), modeled anthropogenic heat transfer and evapotranspiration rate, urban microclimate co-simulated with UBEM, to account for dynamic inputs. This method increases complexity of simulation and is typically adopted in reduced order models.
Climate
Usually, a single typical meteorological year (TMY) weather data either for the location or the closest city is used. Only a few models account for micro-climate data (T. Hong, Chen, et al. Citation2020). The following approaches for addressing climate in UBEMs were found:
Steady state – Long-range average values for outdoor weather conditions using historic weather data, e.g. Gupta (Citation2009).
Typical Meteorological year (TMY) – Weather data obtained from historic measurements, e.g. Reinhart et al. (Citation2013). This approach is the most used in dynamic UBEMs.
Urban Microclimate – Microclimate can either be measured from a local weather station or can be generated in the simulation model or separately. This approach can account for urban heat island when recorded for a long-time duration. Reduced average error in simulations to 10% as opposed to TMY were observed by using a Local weather station by Nouvel et al. (Citation2017). Hong and Luo (Citation2018) used simulated Microclimate data and observed reduced simulated energy values by 2–11% as opposed to TMY, but with a 15% increased simulation time.
Municipal services
Most of the reviewed projects do not account for energy consumption for municipal services. A UBEM can account for total municipal service energy derived from the publicly available dataset or calculations with or without Spatio-temporal simulations:
Included without spatial mapping – Energy use is calculated from total load, operational hours and benchmark values without spatially locating the services, e.g. Amado et al. (Citation2018). This method can be used to estimate energy consumed by services like street lighting, water supply and waste-water treatment.
Included with spatial mapping – energy use is calculated from mathematical models considering spatial configuration & layout, e.g. the studies conducted by Agugiaro, Robineau, and Rodrigues (Citation2017), Fonseca and Schlueter (Citation2015). This approach requires details of metered data for individual units and network layouts and is typically used with reduced order models and for calculating energy consumed by district heating or cooling and other renewable energy systems.
Stock dynamics
Depending upon the nature of the investigation, the building stock can be modeled as either static or dynamic:
Static – point in time/snapshot. Most of the reviewed models are static models.
Dynamic- Depicting temporal changes. Rawal and Sharma (Citation2019) presented a scaled-dynamic UBEM for Ahmedabad city, predicting future energy consumption scenario till the year 2047. Fonseca et al. (Citation2016) presented four development scenarios of an industrial neighborhood in Zug, Switzerland and predicted energy saving potential till the year 2040. Wang et al. (Citation2018) presented CESAR, a dynamic UBEM for predicting future scenario for Switzerland till 2050. They studied the effect of future weather on the dynamic building stock and potential energy & carbon savings by adopting retrofits also analyzing economic aspects.
Form of calculation
Hong, Chen, et al. (Citation2020) classified the existing UBEM methodologies as i) Physics based dynamic simulation, ii) Reduced order & iii) Data-driven models. Simulation based models can also be of different granularities with significant implications for computing time:
Scaled Dynamic – Prototype building for each archetype is dynamically simulated and results are scaled to the entire urban area e.g., Bhatnagar et al. (Bhatnagar et al. Citation2017) used this approach for modeling national level commercial building stock of India. Caputo, Costa, and Ferrari (Citation2013) observed that using this approach with more archetype simulation error reduced to 4%. They required the total building stock area in each archetype and prototype building geometry and characteristics for this approach. Nagpal and Reinhart (Citation2018) compared this method to dynamic simulation UBEM for the MIT campus and observed the simulation time reduced by 57% with marginal loss of accuracy.
Shoe box model – Clusters the building’s façade and creates smaller representative zones based on weighted area for each facade for ease of simulation e.g., Dogan and Reinhart (Citation2017) reported this approach to be 200 times faster than the dynamic method. Marginal error of 11–20% RMSE from metered energy data was observed. Zhu et al. (Citation2019) reported this method to have inaccuracy in capturing interbuilding effects like shading due to pre-simulated results for typical zones.
Reduced order simulation – Simplified thermal network model represented by nodes for each building surface like walls, roofs & floors. They also use mathematical models to speed up simulation time. Remmen et al. (Citation2018) used Modellica libraries & building geometry, reported that loss of accuracy in results was traded-off against large time savings. Emmanuel and Jérôme (Citation2015) used thermal network equations and building geometry. Performing Bayesian calibration in their model reduced result errors from 25% to 8%. Fonseca et al. (Citation2016) used Building 3D models with context. Solar insolation was calculated on actual geometry to improve accuracy and use actual surface temperatures at input nodes. Nagpal et al. (Citation2019) combined model geometry with machine learning model and training data. Models were auto calibrated to improve simulation accuracy.
Dynamic simulation – This involves simulating each building individually and allows spatial diversity and contextual interactions to be accounted for e.g., Cerezo Davila, Reinhart, and Bemis (Citation2016) and Chen, Hong, and Piette (Citation2017). This approach offers improved accuracy but increased time due to complexity of calculations and may require high performance computing resources.
Temporal resolution
UBEM can cover temporal scales from an hour to a day, a week, a month, a year, and one or multiple decades (Hong, Chen, et al. Citation2020). Many projects report the results in Annual Energy use intensity (EUI) kWh/m2 (Chen, Hong, and Piette Citation2017; Fonseca et al. Citation2016; Perez, Kämpf, and Wilke Citation2011). Some report monthly or bi-monthly energy consumption values to establish trends (Cerezo et al. Citation2017; Krayem et al. Citation2019). Cerezo Davila, Reinhart, and Bemis (Citation2016) reported hourly energy data to perform peak demand optimization scenarios.
Treatment of uncertainty
To reduce the discrepancies between predicted energy demand and actual measurements, calibration methods are needed in building energy studies. Uncertainty in the input data is reduced through model calibration and subsequently, the assumptions must be validated for consistency in obtained results. The approaches for treating uncertainty were classed as:
Deterministic –An unstructured approach involving manual adjustment of a few uncertain parameters to a fixed defined value. It requires some metered energy data and typically observed range of values of these uncertain parameters. Krayem et al. (Citation2019) performed manual calibration and post-processing simulation results to improve result accuracy. Berthou et al., (Citation2019) followed an iterative process of calibrating the most sensitive parameters.
Probabilistic – Uncertain inputs adjusted based on probability distributions of a range of values e.g., Cerezo Davila et al. (Citation2017) used this approach with the range of values for input parameters, their probability of occurrence and sensitivity toward the results. Their approach leads to the creation of thousands of parametric combinations to simulate. The errors reduced error to 4% but with 40 times increase in simulation time.
Bayesian calibration – Combines probabilistic distributions of input parameters with prior knowledge of outputs. Cerezo et al. (Citation2017) found this to be the approach with the highest accuracy but with 5 times increase in simulation time as compared to the probabilistic approach. C. K. Wang et al. (Citation2020) found significant improvements in the performance of reduced order models following Bayesian Calibration with less than 5% errors in results
Model calibration level
To improve reliability of simulation results, UBEMs are calibrated to match metered energy data. However, a large no. of UBEM projects were found to not being calibrated due to lack of available data (Ang, Berzolla, and Reinhart Citation2020). UBEM can be calibrated at multiple temporal and spatial scales e.g., annual, monthly, or hourly on the building, block, or district. Calibration data for different UBEM projects ranges from 10 minutes time step at building level through monthly data to annual aggregate data (Berthou et al., Citation2019). The level must depend on the use case, temporal resolution and, more importantly, to the measured energy data available to the modeler (Davila Citation2017). The granularities in calibration level are: -
Archetype level – UBEMs are calibrated to match the extremes, average and distribution of benchmark or representative energy consumption values e.g.,Cerezo Davila, Reinhart, and Bemis (Citation2016), Berthou et al., (Citation2019). This approach is the most frequently used in the absence of granular data. Typically, annual metered energy bills of sample buildings and national level monitoring campaign data is used for calibration. Cerezo Davila, Reinhart, and Bemis (Citation2016) observed that due to variation in building level results the Archetype values average out to give error in the range of 1–20%. However, high inaccuracy in the range of 12–55% were observed at regional scale and 5–99% at the urban scale.
Aggregate level – Single aggregate demand values used to calibrate models of complete districts, typically measured annually for validation, e.g., Cerezo Davila, Reinhart, and Bemis (Citation2016) used total metered energy consumption at ZIP code level from all buildings, and reported average errors of 5–20% at the annual level. Remmen et al. (Citation2018) reported 5.6% average discrepancy after calibration at annual level from the District level energy consumption data.
Building Level – Metered energy data for each building being simulated in UBEM used for calibration building by building. Cerezo et al. (Citation2017) used annual consumption while Krayem et al. (Citation2019) used bi-monthly data.
The model characterization framework
The LoDs for each model were defined based on the evaluation of the literature. Two more characteristics were added to the framework proposed by Fennell et al. (Citation2019) in a new ‘Model Calibration’ layer, representing the level & data used for calibration, leading to 13 Model characteristics. Based on increasing complexity, the approaches within each characteristic were assigned a LoD from 0 to “n”, 0 being the simplest, and “n” being the most complex. As shown in , the first, second & subsequent rows represent the layers, the characteristics & the LoDs for each characteristic, respectively. A UBEM can be defined by combination of any of these LoDs across all model characteristics.
Table 1. Model characterization framework expanded from Fennell et al.’s study into level of details, with the addition of the model calibration layer.
The section ahead will demonstrate how the different model characteristics relate to UBEM attributes in the literature.
Patterns of application
After reviewing each study and assigning a Level of Detail for the approach to each characteristic, the results for all studies were compared. summarizes these summarizes these observations:
Fig. 4. Distribution of reviewed projects having different LoDs in each model characteristics.
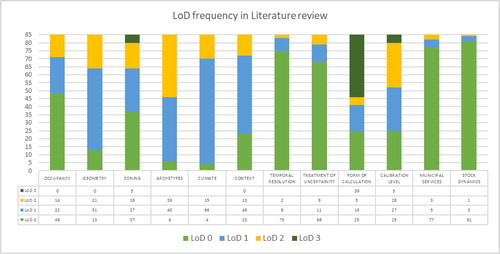
Four characteristics: Occupancy, Temporal resolution, Treatment of Uncertainty, Calibration level, Municipal services and Stock dynamics have over 50% projects with LoD 0 indicating coarser details due to lower complexity.
Only eight projects have incorporated municipal services showing that projects are focused more on building’s operational energy.
Point in time assessment of energy consumption is preferred over dynamic stock which may need a lot of historical data & future prediction on how the building stock & respective energy use would change.
Reduced order and Dynamic method are popular choices for form of calculation.
Overall LoD 0 and 1 are preferred in a greater percentage across all model characteristics.
Application case attributes
The most appropriate LoD for each model characteristic will depend on the specific application case of the UBEM project. These specifics of each project have been termed as “Application Case Attributes” in this research. These attributes include: i) Location and climate of the project, ii) Spatial scale, iii) Use case/application of the UBEM, iii) Source of urban datasets, iv) Required/Desired model accuracy with respect to measured data and v) Modeling infrastructure available including computation power and time, data collection equipment, meters, sensors etc.
Influence of application case attributes on model characteristics
Three Application Case Attributes were selected for further analysis based on their significant influence on the selection of LoDs as observed with the literature review conducted for this research − 1) Scale of the project; It was found to influence the level of effort, model complexity and model accuracy (C. F. Reinhart and Cerezo Davila Citation2016), 2) Use case of the UBEM;- impacts the sensitivity of different model characteristics, as observed by Ang, Berzolla, and Reinhart (Citation2020), and 3) Result accuracy desired or obtained; which is largely affected by the granularity or Level of Detail of the various inputs (Nouvel et al. Citation2017) and methodologies (Cerezo et al. Citation2017). Based on the learnings from different projects in the literature review, the model characteristics that were most sensitive were studied for their relationship with these application case attributes.
This understanding can help formulate a relationship between the LoDs and the factors that govern their relevance and guide the future development of new UBEM projects.
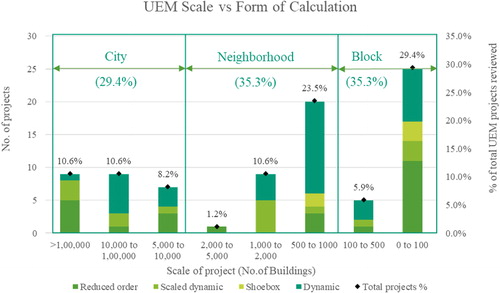
Scale of the project
The scale of each project in the literature review was recorded and compared, from these three groups of UBEM scales were identified: i) Block level – up to 500 buildings, ii) Neighborhood level − 500 to 5000 buildings, iii) City level −5000–1,00,000 buildings iv) Regional/National level – beyond 1,00,000. These scales are further subdivided to distinctly represent different urban levels. It was observed that choice of form of calculation is greatly affected by the scale of the project. suggests that maximum projects are conducted on block-level with less than 100 buildings with dynamic & reduced-order models. For scales greater than 100,000 buildings, Reduced Order & Scaled Dynamic method is preferred more than Dynamic simulations. This may be for faster simulation and less importance on finer details. Shoebox method is still being developed & only five projects have tried it (Dogan and Reinhart Citation2017; Krietemeyer & Kontar, Citation2019; Zhu et al. Citation2019).
Fig. 5. Relation between Scale and form of calculation of the model.
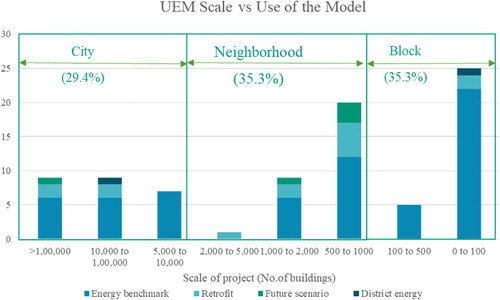
Use case of the model
The scale of the model was also found to influence the use case of the UBEM, as indicated in . 57% of retrofit projects are performed on the neighborhood scale & 28% on City scale. Most projects prefer Block & Neighborhood scale to develop new methodologies and test them with finer LoDs. 80% of Future scenario UBEM work on neighborhood scale. Only 2 projects have used the UBEM for District Energy systems. One on less than 100 buildings (Fonseca et al. Citation2016) and one on City scale (Agugiaro, Robineau, and Rodrigues Citation2017).
Fig. 6. Relation between Scale and use case of the model.
Model accuracy
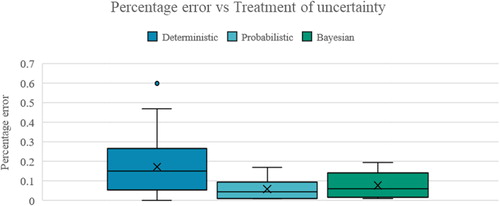
The metrics used for reporting a model’s accuracy were observed as: Percentage Error, KS test and Mean Absolute Percentage Error & Correlation Coefficient. Over 70% of projects reported percentage errors. shows the range of errors observed with different treatment of uncertainty for only these projects that reported model accuracy in percentage error. It was observed that the mean error in Deterministic method is more as compared to Bayesian and probabilistic methods. However, this trend may also be affected by other model characteristics having different LODs.
Fig. 7. Relation between Percentage error and treatment of uncertainty.
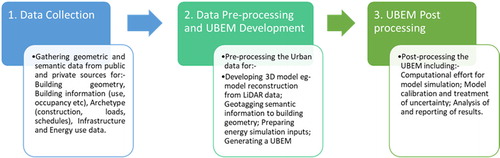
The concept of level of effort
The Fit-for-Purpose model will identify the most suitable LOD for each model characteristic that serves the intended application case with the least level of effort. The effort spent in performing a UBEM project can be conceptually divided into three stages as indicated in ; i) Efforts in Data collection, ii) Efforts in Pre-processing the data which includes Model development, preparing simulation inputs, validating the assumptions and iii) Efforts in Post processing which includes reducing uncertainty and analyzing the results for decision making. These efforts can be both manual e.g., – surveys, data collection and computational. As observed from the Literature review, for each UBEM project the degree or Level of Effort (LoE) across these three stages can significantly vary based on the availability of resources, technical know-how and the application case attributes. Thus, for each UBEM project the modeler will have to assess their own LoE across these three stages and decide rationally upon the usability of a higher LoD in the Model characteristics.
Fig. 8. The three stages of effort required for a UBEM project.
Observations from literature review
An attempt was made to group similar projects based on their LoD in different characteristics using K-modes clustering algorithm, however no coherent groups were formed. The observations show that it is unlikely that a meaningful relation between the LoD and modeling objectives can be established through literature. At present each research group makes its assessment of what is the required LoD for their purposes and depending on the other UBEM attributes. This is often implicit within their work and may be driven by practical considerations of data availability, rather than the actual requirements of the study. Parallel research is focused on developing new tools and methods to reduce simulation time and complexity. This indicates that the framework is essential in guiding newer research to optimize their resources to achieve what is desired.
Application of the model characterisation framework to Ahmedabad
This section attempts to understand the existing data and infrastructure available for Ahmedabad and identify the application of the developed framework studying the impact of various LoD to develop supplementary data collection approach for the UBEM of the entire city. The city of Ahmedabad in Gujarat has been one of the most important trade centers in western India and a major industrial and financial hub. Owing to a rapid development at a Compounded Annual Growth Rate (CAGR) of 3.18 for commercial & 3.61 in residential stock respectively (Rawal, Pandya, and Shukla Citation2018), robust planning through UBEM is required for achieving energy efficiency, analyzing the impact of implementing different policies and tailor them to suit both the existing and the upcoming building stock of Ahmedabad.
Public datasets in Ahmedabad
CEPT Geomatics Lab used the administrative data along with satellite imagery to extract building footprints and develop a GIS database. The plot’s details on its permissible use, Floor Space Index (FSI), setbacks & year of ownership were used to derive building use, footprint, building height & building age. However, there were several gaps and inaccuracies in this available dataset as identified by Rawal, Sharma, Poola, Ruyssevelt, & Fennell et al. (Citation2019).
The extracted building footprints didn’t match the plot boundaries and overestimated building area by including projections like balconies, porch, temporary structures and unoccupied areas like lift/staircase cores, shafts & corridors.
Building heights were estimated based on maximum permissible FSI and not on the actual existing building.
The Address on the tax assessment data did not locate the property on the GIS map for many properties.
Archetype characteristics were assigned from literature studies due to a lack of actual surveyed data for Ahmedabad.
Energy bills were inaccessible due to data privacy regulations. Only total energy sales in Ahmedabad were known from reports published by the electricity Distribution Company (DISCOM).
To overcome these challenges and fill the data gaps, the model characterization framework is applied to identify the impact of higher LoD in different characteristics on the simulation results. This will enable identifying the most sensitive parameters for different archetypes and inform where a higher LoD is beneficial. The test case presented here deals with identifying the effort in the Post processing stage and uses Simulation time against which the impact of different LoDs is assessed.
Test case
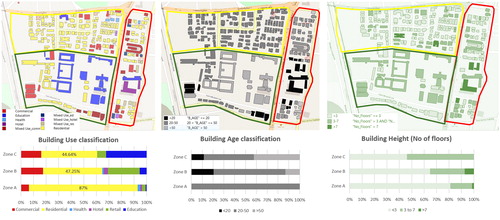
A UBEM for 0.3 km2 area of the Central Business District of Ahmedabad comprising 250 buildings was developed, as shown in . The area is distinguished into three clusters of buildings, referred to as 1) Zone A has 87% residential use. 2) Zone B has a diverse mix of uses with 18% commercial office, 25% retail and 47% residential. 3) Zone C has 32% educational buildings. The building ages have been classified into 3 categories less than 20 years, 20–50 years and older than 50 years. Age of the building determines the construction materials and efficiency of systems. Building heights will make an impact on mutual shading.
Fig. 9. Characteristics of the pilot study area of 0.3 km2 of Ahmedabad.
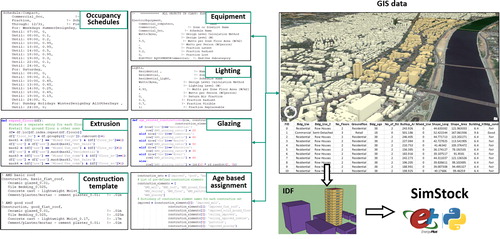
Simulation workflow
The UBEM is created through a customized python script, SimStock (Korolija Citation2020) shown in . The GIS data collected and developed by the Department of Planning at CEPT University contains shapefiles of the buildings with important data like building use, number of floors, age, linked with a unique building ID. Archetype characterization with occupancy, equipment, lighting, and HVAC details are associated with the building use. The building shapes and number of floors are then used to extrude a LoD1 geometry and glazing ratios are defined by use type to create thermal zones. After this construction, templates are assigned to the buildings based on archetypes or based on age. Once all the input data for thermal simulations is linked with the GIS data, IDF files are generated for each building with context buildings as shading objects. These IDF files are then batch simulated in Energy Plus using the SimStock python script.
Fig. 10. UBEM simulation workflow.
Input data sources
The inputs for the UBEM were largely derived through literature review as cited in . Some sample electricity bills were collected for residential buildings in an online survey and a walkthrough survey of the site was performed to note the discrepancy in the GIS data and to collect information on construction materials, glazing ratios and window shading.
Table 2. Sources of input data for the UBEM exercise.
Assessing the impact of increasing levels of detail
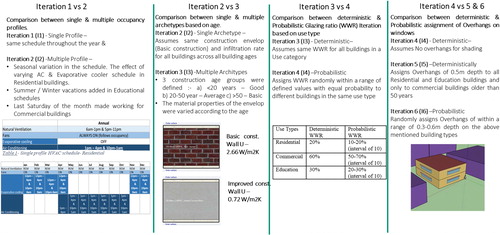
A baseline UBEM referred to as Iteration 1 was developed with LoD across each iteration for which data was available. Subsequent iterations (highlighted in green) were developed by incrementally changing LoDs in three key characteristics, i.e., Occupancy, Archetypes, and treatment of uncertainty, as shown in ; to study their impact on the UBEM results with respect to addition in simulation time.
Table 3. Selected combinations of LoDs to test the applicability of the framework.
The data required to develop the higher LoDs was sourced from field surveys and modelers assumption. The results discuss the EUI (kWh/m2) values for Residential, Education & Commercial Buildings across these combinations.
Iterations1 & 2 compare the difference between Deterministic single and multi-profile occupancy schedules with temporal diversity only. In iteration 2 for residential buildings, seasonal operation of air conditioners and evaporative coolers is included. For educational buildings, the vacations were considered and for commercial buildings working Saturdays were considered once a month.
Iterations 2 & 3 compare the impact of multiple archetypes based on age & building use. The construction envelope was changed based on the age of the building.
Iterations 3&4 compare the impact of probabilistic assignment of Window to Wall Ratio based on use types. Finally, in iterations 5&6 the comparison between Deterministic assignment of 0.5 m deep overhangs v/s Probabilistic with overhangs from 0.3 to 0.6m depth was made. In iteration 5 the overhangs were added to residential and educational buildings only and in iteration 6 overhangs are also added to commercial buildings older than 50 years. The details of input parameters varied across different iterations are reported in .
Fig. 11. Variation in parameters across different model iterations.
Results
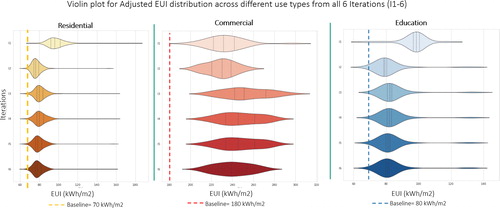
The simulated EUI (kWh/m2) of all the buildings in different zones were compared to a baseline reference value derived from the literature data noted in , to check the consistency of the results. The simulation considers the entire building area air-conditioned due to a single zone per floor. This overestimates the cooling energy since not over 80% in commercial and 50% in Residential & Education buildings is conditioned. Thus, simulation results were calibrated deterministically to bring the EUI values closer to the baseline. The adjusted EUIs for the different use types across all iterations (I1-I6) depicted through a Violin plot in shows the distribution shape with the median & interquartile range shown as dashed lines. The colored dashed line shows the baseline EUI value for each use type.
Fig. 12. Violin plots depicting the simulated EUI (kWh/m2) for the different iterations across three building types.
Significance of differences between EUIs
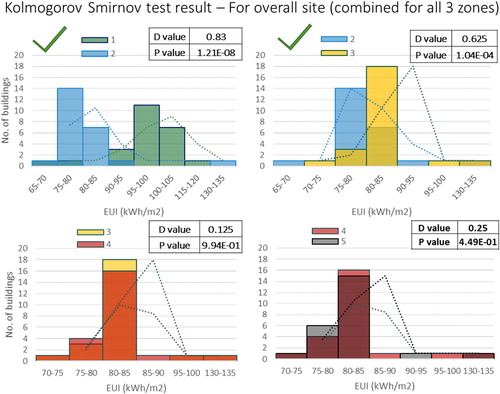
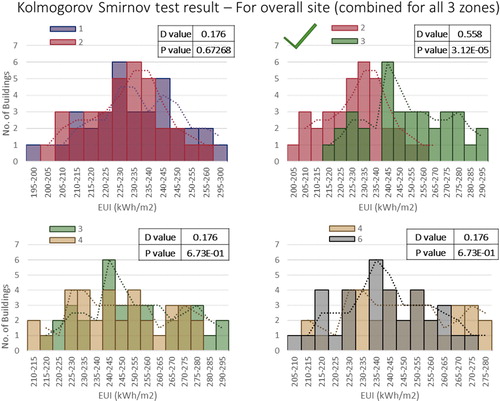
The Kolmogorov Smirnoff (KS) test was used to assess the significance of differences between results for each iteration for the different building classes. In the KS test, p-value greater than 0.05 means the null hypothesis that the two samples are drawn from the same distribution is rejected. If the null hypothesis is not rejected, the lesser complex LoD in that case would be adopted.
Residential & educational buildings
suggests Iterations 1 & 2 have maximum difference for Residential buildings due to seasonal operation of ACs. At the neighborhood level there is a difference between iteration 2 & 3 due to variation in building ages distributed in the area. Other iterations do not have a significant difference. Like residential buildings, the educational buildings are also affected the most with iterations 1-2 & 2-3, due to occupancy profiles and construction details ().
Fig. 13. Comparison of EUI distribution for Residential buildings accross sucessive LoD iterations.
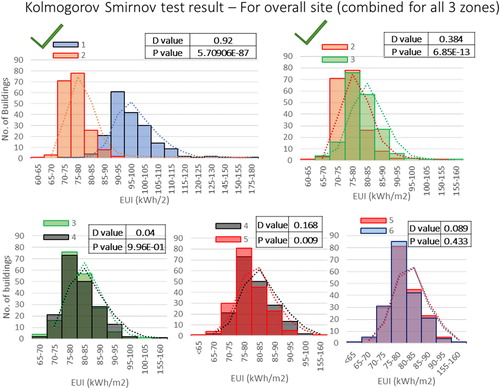
Fig. 14. Comparison of EUI distribution for educational buildings across successive LoD iterations.
Commercial buildings
suggests that for Commercial buildings occupancy patterns do not have significant variation seasonally thus iterations 1&2 have no comparable difference. At the neighborhood level there is a difference between iterations 2 & 3 due to variation in building ages distributed in the area. This implies differences in construction materials make more impact than other parameters.
Fig. 15. Comparison of EUI distribution for Commercial buildings across successive LoD iterations.
Evaluating the fit-for-purpose iterations
The effective difference between two LoD combinations represented by the p-value from the KS test is reported against the difference in simulation time in . This comparison will give a suitable tradeoff between different LoDs and suggest the path for maximum benefit with the least effort for this test case. On the graph, in the X-axis represents the difference in simulation time and the Y-axis represents the P-value. The iteration is defined by different shapes and colors across use types as shown in the . Based on the results we can divide this graph into 5 segments. i) Preference 1 – on the lower left corner represents extremely significant change with least effort, thus this change must be incorporated. ii) Preference 2 – top left below the gray band, has an acceptable change and does not cost much effort. iii) Preference 3 – on the bottom right corner has extremely significant change but requires more effort and needs a call for decision. iv) Preference 4 – the least priority to iterations having an acceptable change but extremely high time. At last, the values in the gray band are insignificant and may be avoided. Thus, the iterations highlighted in green in are the ones selected for different building types.
Fig. 16. Simulation time v/s P value to evaluate tradeoff between effectiveness of the results and simulation time.
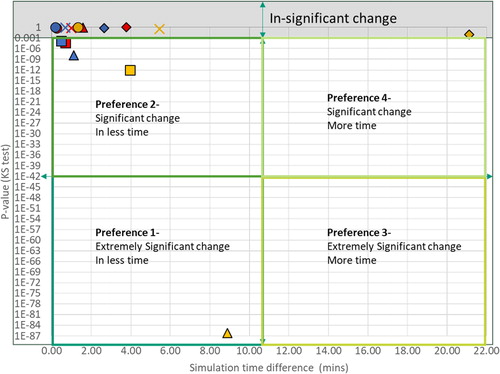
Table 4. Difference in simulation time and P value on comparing different iterations of LoDs across building use types.
Observations from test case simulation results
The simulation and data collection exercise for the pilot study in Ahmedabad indicates the need to focus on the following areas:
The impact of urban morphology in terms of density, height, age, & mixed use which is heterogeneous in the city. Similar areas and building types need to be grouped and the archetype definition must account for these differences.
Economic status is also vital while defining archetypes as it relates to appliance ownership, air-conditioned area and overall energy use (Garg, Maheshwari, and Upadhyay, Citation2010)
Not accounting mixed mode operation, the UBEM overestimate cooling energy use by 1.5–2 times in many buildings. Thus, data on operation of ACs needs to be collected in more detail especially in residential buildings. Core and perimeter zoning can separate conditioned and non-conditioned zones to account for spatial mixed mode.
Conclusion
The extensive literature analysis of 85 UBEM projects conducted in this research suggests:
There is no standardization made for data requirement for developing UBEMs. Each research group works with their available resources and technical know-how.
A lack of standardized nomenclature and classification of model inputs, methodologies, modeling objectives and consistency of metrics to report simulation results makes it challenging to compare or correlate different UBEM projects. This makes it difficult for new users to find relevant case studies and adopt standardized workflows to develop a UBEM.
The proposed model characterization framework in this research takes a step forward to bridge this gap. The application of this framework as demonstrated in the case study for Ahmedabad serves three purposes: − 1. It enables to identify the LoD of the existing data 2. Through pilot study of a sample area the modeler can identify suitable LoD across different Model characteristics required for different building types, 3. These pilot projects can help identify requirements of additional data which can then be prioritized by the modeler or the research group.
The developed framework and the application of the same through the case of Ahmedabad suggested that the choice selecting a higher LoD for different model characteristics may vary across building use types and the urban morphology. Also, these Model characteristics may not be consistently sensitive on all urban areas. Thus, it is important to conduct pilot projects with more granular data to understand this relationship on a particular urban context before scaling up the exercise. While different LoD may be suitable for different building types and locations, there needs to be a consistency in LoD on the overall UBEM of the city. Thus, the pilot projects will allow understanding the variation and address this problem by selecting the LoD that is more predominantly observed to maintain consistency.
This framework has a potential to be revised and updated with newer characteristics and LoD as processes change, data availability improves, and new methods are developed.
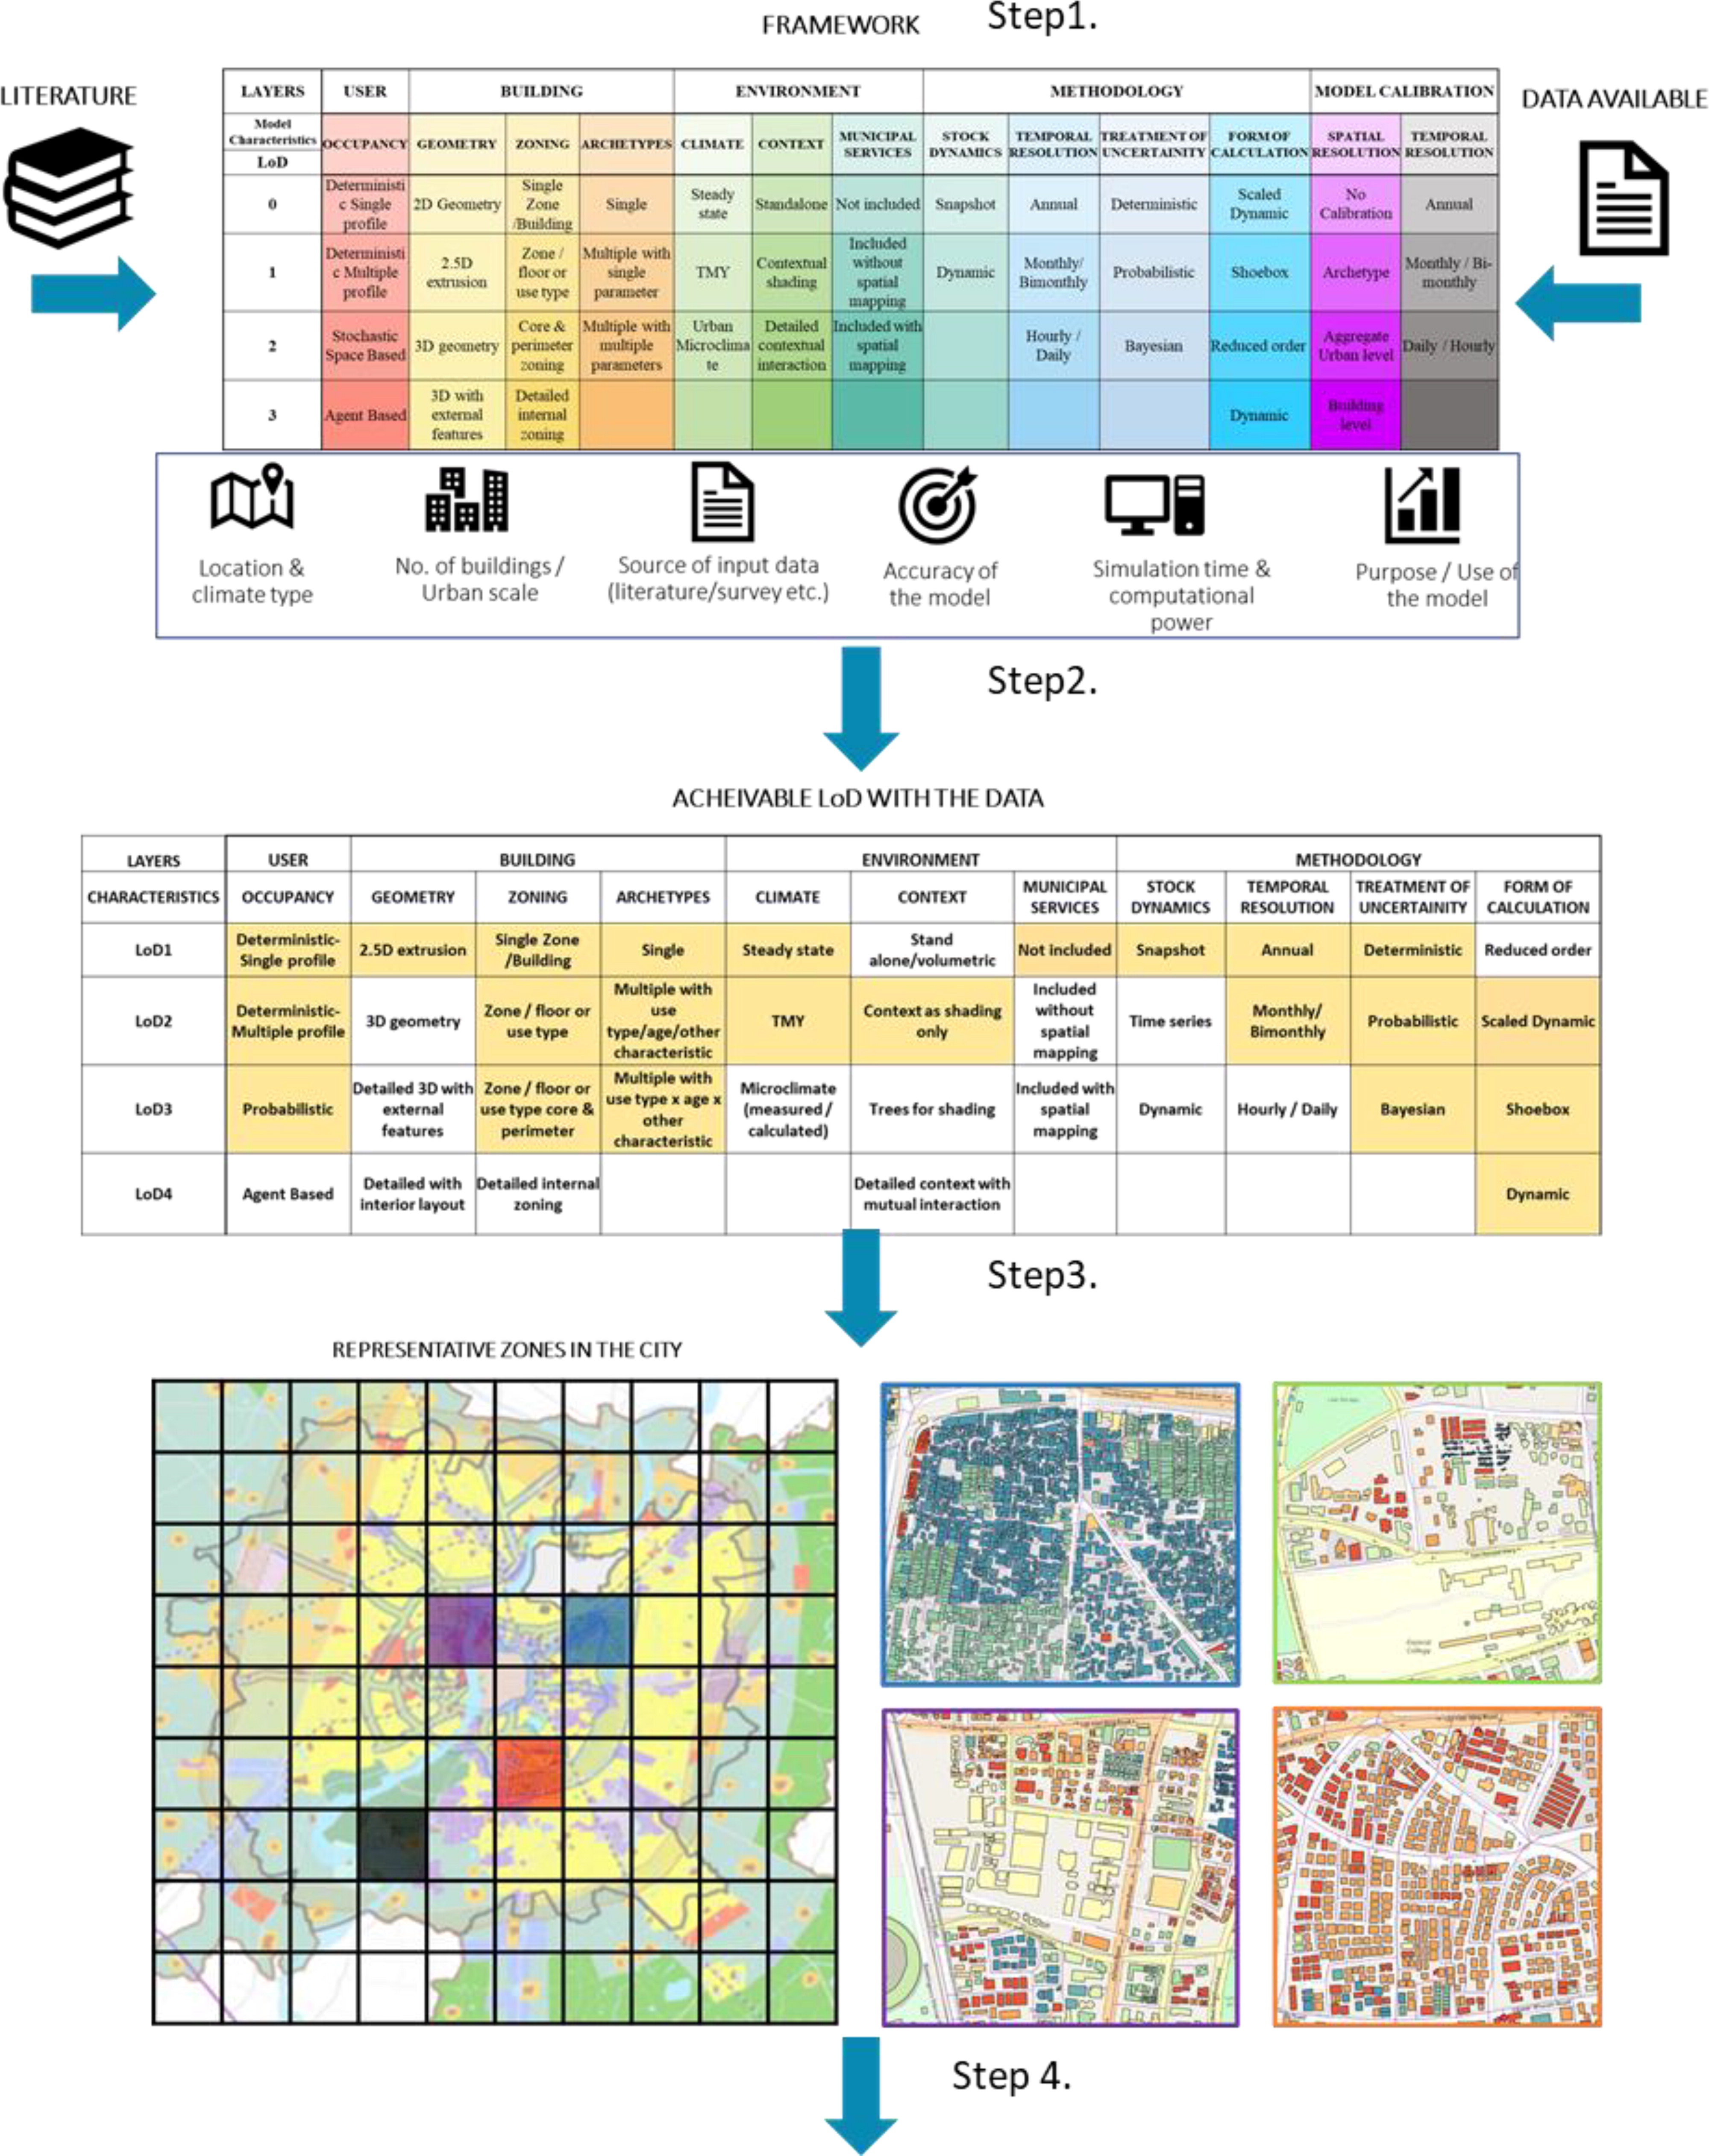
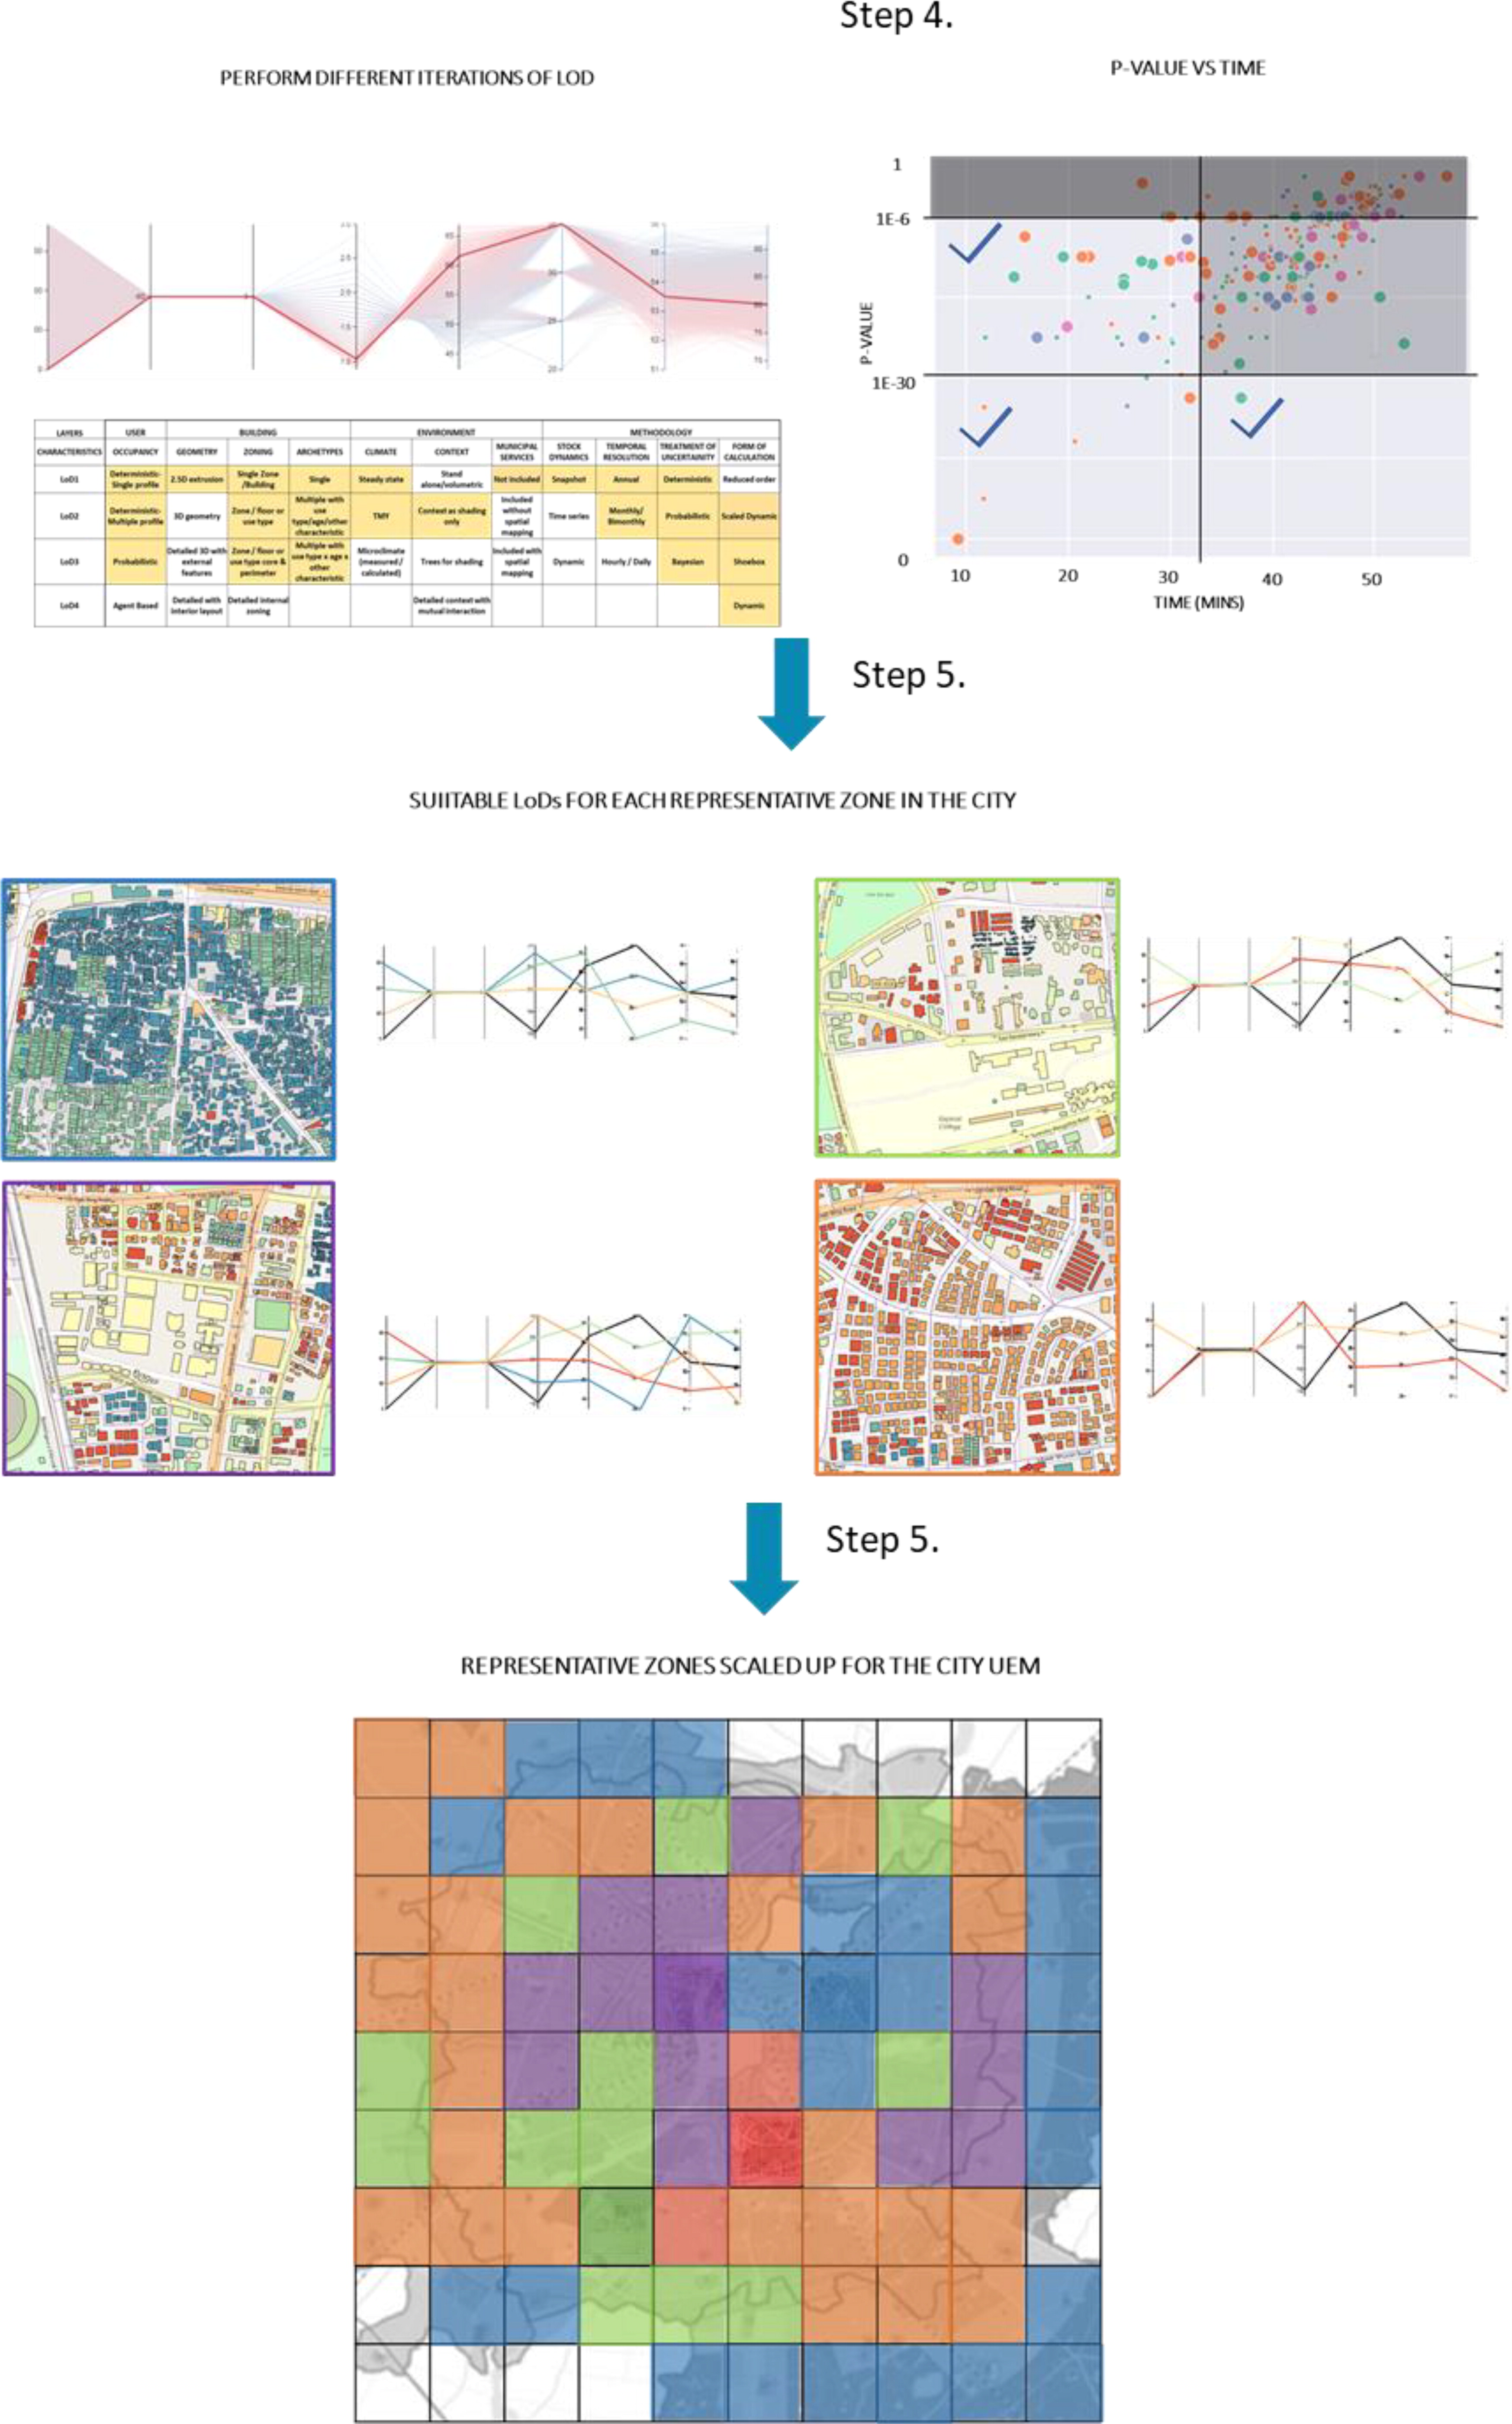
Appendix 2 gives a visual description of the framework and step-by-step application exercise, that can be used and scaled up to develop a fit-for-purpose UBEM for the entire city.
Application of the model characterization framework various UBEM projects
The Model characterization framework and the approach toward Fit-for-purpose UBEMs as presented in this research can be adopted by upcoming projects in the following manner:
Use the framework to study the most appropriate literature reference through its model characteristics and other attributes that match the application case attributes of your project.
Evaluate the available data through the framework to identify the LoDs that are achievable and gaps in the data.
Study the city’s urban morphology & use patterns to identify a few representative zones for conducting pilot/test projects. The zones are unique from each other but can represent other similar zones in the city.
A detailed analysis of these zones as pilot projects can help scale the modeling process for the entire city most effectively. These zones have distinct urban characteristics and must be dealt with individually.
For each zone through the framework of achievable LoDs, perform Urban simulations with different iterations possible through all characteristics.
Difference between the energy use patterns from subsequent iterations can be studied with respect to the effort spent. This enables the selection of different iterations to be adopted with a suitable tradeoff with different stages of effort; whichever is most significant for the user. Like in the test case presented in this research, simulation time was used to assess the tradeoff. The modeler may select any other quantifiable metrics to evaluate the level of effort.
For each representative zone, this detailed study helps in identifying the best LoD combinations through all characteristics for different building use types.
With the most suitable LoDs for each building type in each representative zone, we can now scale up the modeling exercise.
Suitable LoDs for each representative zone can now streamline data collection and modeling efforts for other zones like them.
Scale up the study and develop a Fit-for-purpose UBEM of the entire city with the least effort for the maximum benefit.
Acknowledgments
This research is part of the ongoing iNUMBER Integrated Urban Model for Built Environment Energy Research project (Rawal et al., Citation2019). The key objective of the project is to develop a UBEM that includes both the buildings and municipal services. An integration of public & private stakeholders can enable creating the UBEM and a City Information Model. The LoDs proposed in this research can be refined further into a global standard framework for developing UBEMs and would be especially useful for developing nations like India.
Additional information
Funding
References
- Abbasabadi, N., and J. K. Mehdi Ashayeri. 2019. Urban energy use modeling methods and tools: A review and an outlook. Building and Environment 161:106270. doi:10.1016/j.buildenv.2019.106270
- AEEE. 2018. Building stock modelling: Key enabler for driving energy efficiency at national level. Last Accessed September 4, 2020. http://www.aeee.in/wp-content/uploads/2018/09/Building-Stock-Modeling-Revised-pager.pdf
- Agugiaro, G., J. L. Robineau, and P. Rodrigues. 2017. Project CI-nergy: Towards an integrated energy urban planning system from a data modelling and system architecture perspective. ISPRS Annals of the Photogrammetry, Remote Sensing and Spatial Information Sciences IV-4/W3 (4W3):5–12. doi:10.5194/isprs-annals-IV-4-W3-5-2017
- Amado, M., F. Poggi, A. R. Amado, and S. Breu. 2018. E-city web platform: A tool for energy efficiency at urban level. Energies 11 (7):1857. doi:10.3390/en11071857
- Ang, Y. Q., Z. M. Berzolla, and C. F. Reinhart. 2020. From concept to application: A review of use cases in urban building energy modeling. Applied Energy 279:115738. doi:10.1016/j.apenergy.2020.115738
- Barbour, E., C. C. Davila, S. Gupta, C. Reinhart, J. Kaur, and M. C. González. 2019. Planning for sustainable cities by estimating building occupancy with mobile phones. Nature Communications (2019) 10:3736. doi:10.1038/s41467-019-11685-w
- BEE. 2010. Energy benchmarks for Commercial Buildings ECBC. Last Accessed June 28, 2021. http://eecbindia.com/%0Ahttps://www.beeindia.gov.in/sites/default/files/Flyer_22ndJan.pdf
- BEE. 2014. Design guidelines for energy-efficient multi-storey residential buildings composite and hot-dry climates. In www.beepindia.org (Vol. 066). https://beeindia.gov.in/sites/default/files/DesignGuideline_Book_0.pdf%0Awww.energyefficiencycentre.org%0Awww.aeee.in%0Ahttps://www.eceee.org/library/conference_proceedings/eceee_Summer_Studies/2015/6-policies-and-programmes-towards-a-zero-energy-buildin
- BEE. 2017. Energy Conservation Building Code. Retrieved January 18, 2018 from, https://beeindia.gov.in/sites/default/files/BEE_ECBC2017.pdf
- Bergerson, J., R. T. Muehleisen, B. O. Rodda, J. A. Auld, L. B. Guzowski, J. Ozik, and N. Collier. 2015. LakeSIM integrated design tool for assessing short- and long-term imapcts of urban scale conceptual designs. The International Society of City and Regional Planners (ISOCARP) REVIEW 11. Last Accessed April 11, 2020. https://www.researchgate.net/publication/281099639_Designing_Future_Cities_-_LakeSIM_Integrated_Design_Tool_For_Assessing_Short-_and_Long-Term_Impacts_of_Urban_Scale_Conceptual_Designs
- Berthou, T., B. Duplessis, P. Stabat, P. Rivière, D. Marchio, B. St, and M. Paris. 2019. Urban Energy Models Validation in Data Scarcity Context: Case of the Electricity Consumption in the French Residential Sector. Proceedings of Building Simulation 2019: 16th Conference of IBPSA. doi:10.26868/25222708.2019.210134.
- Bhatnagar, M., P. Varma, T. Tathagat, and S. Diddi. 2017. Model for assessing impact of energy conservation building code.
- Biljecki, F. 2013. The concept of level of detail in 3D city models. PhD Research Proposal, Delft University. http://repository.tudelft.nl/assets/uuid:cea5a207-e796-4691-9440-13362cf8654c/291180.pdf
- Caputo, P., G. Costa, and S. Ferrari. 2013. A supporting method for defining energy strategies in the building sector at urban scale. Energy Policy 55:261–70. doi:10.1016/j.enpol.2012.12.006
- Cerezo, C., J. Sokol, S. AlKhaled, C. Reinhart, A. Al-Mumin, and A. Hajiah. 2017. Comparison of four building archetype characterization methods in urban building energy modeling (UBEM): A residential case study in Kuwait City. Energy and Buildings 154:321–34. doi:10.1016/j.enbuild.2017.08.029
- Cerezo Davila, C., N. Jones, A. Al-mumin, A. Hajiah, C. F. Reinhart. 2017. Implementation of a calibrated Urban Building Energy Model (UBEM) for the evaluation of energy efficiency scenarios in a Kuwaiti residential neighborhood. Proceedings of the 15th IBPSA Conference, San Francisco, CA, USA, August 7–9, 1310–1319. doi:10.26868/25222708.2017.188.
- Cerezo Davila, C., C. F. Reinhart, and J. L. Bemis. 2016. Modeling Boston: A workflow for the efficient generation and maintenance of urban building energy models from existing geospatial datasets. Energy 117:237–50. doi:10.1016/j.energy.2016.10.057
- Chen, Y., and T. Hong. 2018. Impacts of building geometry modeling methods on the simulation results of urban building energy models. Applied Energy 215:717–35. doi:10.1016/j.apenergy.2018.02.073
- Chen, Y., T. Hong, and M. A. Piette. 2017. City-scale building retrofit analysis: A case study using CityBES. Proceedings of BS2017, San Francisco, CA, USA, August 7–9. doi:10.26868/25222708.2017.071.
- Coffey, B., A. Stone, P. Ruyssevelt, and P. Haves. 2015. An epidemiological approach to simulation-based analysis of large building stocks. 14th International Conference of IBPSA - Building Simulation 2015, BS 2015, Hyderabad, India, December 7–9, 2015 Conference Proceedings, 1916–1923.
- Davila, C. C. 2017. Building archetype calibration for effective urban building energy modeling, MIT Libraries, Massachusetts Institute of Technology, 1–156.
- Dogan, T., and C. Reinhart. 2017. Shoeboxer: An algorithm for abstracted rapid multi-zone urban building energy model generation and simulation. Energy and Buildings 140:140–53. doi:10.1016/j.enbuild.2017.01.030
- Dogan, T., C. Reinhart, and P. Michalatos. 2016. Autozoner: An algorithm for automatic thermal zoning of buildings with unknown interior space definitions. Journal of Building Performance Simulation 9 (2):176–89. doi:10.1080/19401493.2015.1006527
- Emmanuel, W., and K. Jérôme. 2015. A verification of CitySim results using the BESTEST and monitored consumption values. Proceedings of the 2nd Building Simulation Applications conference, Bozen-Bolzano, Italy, 4th–6th February 2015, 215–222.
- ER4.5. 2018. EPPI-Reviewer 4 Software for research synthesis user manual. https://eppi.ioe.ac.uk/cms/Portals/35/Manuals/ER4.5.0%20user%20manuala.pdf?ver=2015-10-12-122019-620
- Fennell, P. J., P. A. Ruyssevelt, R. Rawal, and V. Poola. 2019. Determining the most appropriate form of Urban Building Energy Simulation Model for the city of Ahmedabad. 16th IBPSA International Conference and Exhibition, Building Simulation, Rome, Italy, September 2019.
- Ferrando, M., F. Causone, T. Hong, and Y. Chen. 2020. Urban building energy modeling (UBEM) tools: A state-of-the-art review of bottom-up physics-based approaches. Sustainable Cities and Society 62:102408. doi:10.1016/j.scs.2020.102408
- Filogamo, L., G. Peri, G. Rizzo, and A. Giaccone. 2014. On the classification of large residential buildings stocks by sample typologies for energy planning purposes. Applied Energy 135:825–35. doi:10.1016/j.apenergy.2014.04.002
- Fonseca, J. A., T. A. Nguyen, A. Schlueter, and F. Marechal. 2016. City Energy Analyst (CEA): Integrated framework for analysis and optimization of building energy systems in neighborhoods and city districts. Energy and Buildings 113:202–26. doi:10.1016/j.enbuild.2015.11.055
- Fonseca, J. A., and A. Schlueter. 2015. Integrated model for characterization of spatiotemporal building energy consumption patterns in neighborhoods and city districts. Applied Energy 142:247–65. doi:10.1016/j.apenergy.2014.12.068
- Gaetani, I., P. J. Hoes, and J. L. M. Hensen. 2016. Occupant behavior in building energy simulation: Towards a fit-for-purpose modeling strategy. Energy and Buildings 121:188–204. doi:10.1016/j.enbuild.2016.03.038
- Garg, A., J. Maheshwari, and J. Upadhyay. 2010. Load research for residential and commercial establishments in Gujarat. Last Accessed March 25, 2020. https://www.beeindia.gov.in/sites/default/files/ctools/LoadResearchReportforGujarat-1024.pdf
- Garg, A., J. Maheshwari, P. R. Shukla, and R. Rawal. 2017. Energy appliance transformation in commercial buildings in India under alternate policy scenarios. Energy 140:952–65. doi:10.1016/j.energy.2017.09.004
- GBPN CEPT. 2014. Residential buildings in India: Energy use projections and savings potentials. Www.Aeee.In, 066, September, 209. Last Accessed September 26, 2019. https://beeindia.gov.in/sites/default/files/DesignGuideline_Book_0.pdf%0Awww.energyefficiencycentre.org%0Awww.aeee.in%0Ahttps://www.eceee.org/library/conference_proceedings/eceee_Summer_Studies/2015/6-policies-and-programmes-towards-a-zero-energy-buildin
- Gupta, R. 2009. Moving towards low-carbon buildings and cities: Experiences from Oxford, UK. International Journal of Low-Carbon Technologies 4 (3):159–68. doi:10.1093/ijlct/ctp028
- Happle, G., J. A. Fonseca, and A. Schlueter. 2018. A review on occupant behavior in urban building energy models. Energy and Buildings 174:276–92. doi:10.1016/j.enbuild.2018.06.030
- Heiple, S., and D. J. Sailor. 2008. Using building energy simulation and geospatial modeling techniques to determine high resolution building sector energy consumption profiles. Energy and Buildings 40 (8):1426–36. doi:10.1016/j.enbuild.2008.01.005
- Hong, T., and X. Luo. 2018. MODELING BUILDING ENERGY PERFORMANCE IN URBAN CONTEXT, Performance, Building, Analysis Conference, September 2018, Ibpsa-usa Chicago, and IL.
- Hong, T., Y. Chen, S. H. Lee, M. P. Piette, Y. Chen, and M. P. Piette. 2016. CityBES: A web-based platform to support city-scale building energy efficiency. 5th International Urban Computing Workshop, at San Francisco, Vol. 10. https://www.researchgate.net/publication/304824985_CityBES_A_Web-based_Platform_to_Support_City-Scale_Building_Energy_Efficiency
- Hong, T., Y. Chen, X. Luo, N. Luo, and S. H. Lee. 2020. Ten questions on urban building energy modeling. Building and Environment 168:106508. doi:10.1016/j.buildenv.2019.106508
- Hong, T., Y. Chen, M. A. Piette, and X. Luo. 2018. Modeling city building stock for large-scale energy efficiency improvements using City BES. ACEEE. doi:10.20357/B77G67
- Hong, T., M. Ferrando, X. Luo, and F. Causone. 2020. Modeling and analysis of heat emissions from buildings to ambient air. Applied Energy 277:115566. doi:10.1016/j.apenergy.2020.115566
- Iyer, M., R. Rawal, S. Sachin, H. Pandya, A. Joshi, and K. Janda. 2020. Water-Energy Nexus, Ahmedabad, India: Centre for Advanced Research in Building Science and Energy (CARBSE), CEPT University. Submitted to the India-UK Joint Integrated Urban Model for Built Environment Energy Research (iNUMBER).
- Johari, F., G. Peronato, P. Sadeghian, X. Zhao, and J. Widén. 2020. Urban building energy modeling: State of the art and future prospects. Renewable and Sustainable Energy Reviews 128:109902. doi:10.1016/j.rser.2020.109902
- Khosla, R., and K. B. Janda. 2019. India’s building stock: Towards energy and climate change solutions. Building Research & Information 47 (1):1–7. doi:10.1080/09613218.2019.1522482
- Korolija, I. 2020. SimStock-A modelling platform generating dynamic building energy simulation models. Last Accessed June 28, 2021. Retrieved from UCL Energy Institute Models website: https://www.ucl.ac.uk/energy-models/models/simstock
- Krayem, A., A. Al Bitar, A. Ahmad, G. Faour, J.-P. Gastellu-Etchegorry, I. Lakkis, J. Gerard, H. Zaraket, A. Yeretzian, and S. Najem. 2019. Urban energy modeling and calibration of a coastal Mediterranean city: The case of Beirut. Energy and Buildings 199:223–34. doi:10.1016/j.enbuild.2019.06.050
- Krietemeyer, B., and R. E. Kontar. 2019. A method for integrating an UBEM with GIS for spatiotemporal visualization and analysis. Proceedings of the Symposium on Simulation for Architecture and Urban Design, April 2019. Article No.: 36, 1–8.
- Kumar, S., R. Kapoor, R. Rawal, S. Seth, and A. Walia. 2010. Energy Conservation and Commercialization (ECO-III) Developing an Energy Conservation Building Code Implementation Strategy in India. In In ACEEE Summer Study on Energy Efficiency in Buildings. https://www.aceee.org/files/proceedings/2010/data/papers/2174.pdf.
- McKinsey, 2010. India’s urban awakening: Building inclusive cities, sustaining economic growth. McKinsey Quarterly :1–33.
- Monien, D., A. Strzalka, A. Koukofikis, V. Coors, and U. Eicker. 2017. Comparison of building modelling assumptions and methods for urban scale heat demand forecasting. Future Cities and Environment 3:2. doi:10.1186/s40984-017-0025-7
- Monteiro, C. S., A. Pina, C. Cerezo, C. Reinhart, and P. Ferrão. 2017. The use of multi-detail building archetypes in urban energy modelling. Energy Procedia. 111:817–25. doi:10.1016/j.egypro.2017.03.244
- Nagpal, S., C. Mueller, A. Aijazi, and C. F. Reinhart. 2019. A methodology for auto-calibrating urban building energy models using surrogate modeling techniques. Journal of Building Performance Simulation 12 (1):1–16. doi:10.1080/19401493.2018.1457722
- Nagpal, S., and C. F. Reinhart. 2018. A comparison of two modeling approaches for establishing and implementing energy use reduction targets for a university campus. Energy and Buildings 173:103–16. doi:10.1016/j.enbuild.2018.05.035.
- NITI. 2015. India energy security scenarios 2047, Version 2.0, 28–30. http://iess2047.gov.in/pathways/22202222222222220222222222012222202222222211202220222022222/primary_energy_chart.
- Nouvel, R., M. Zirak, V. Coors, and U. Eicker. 2017. The influence of data quality on urban heating demand modeling using 3D city models. Computers, Environment and Urban Systems 64:68–80. doi:10.1016/j.compenvurbsys.2016.12.005
- Palme, M., and A. Salvati. 2018. UWG -TRNSYS simulation coupling for urban building energy modelling. Proceedings of BSO 2018: 4th Building Simulation and Optimization Conference, September 11–12, 2018, Cambridge, UK, 635–641.
- Perez, D., J. Kämpf, and U. Wilke. 2011. CITYSIM simulation: the case study of Alt-Wiedikon, a neighbourhood of Zürich City. Proceedings of CISBAT 2011 - CleanTech for Sustainable Buildings, Lausanne, Switzerland, September 14–16, 937–940. http://infoscience.epfl.ch/record/174435
- Quan, S. J. Q., and Q. Li. 2015. Urban data and building energy modeling: A GIS-based urban building energy modeling system using the urban-EPC engine. Lecture Notes in Geoinformation and Cartography 213:447–69. doi:10.1007/978-3-319-18368-8
- Rawal, R., H. Pandya, and Y. Shukla. 2018. Impact of ECBC on building energy consumption at the city level, Phase 3. Ahmedabad: Centre for Advanced Research in Building Science and Energy.
- Rawal, R., and K. Sharma. 2019. Impact of Building Energy Code at City Level Energy Consumption – A Study in the Context of Ahmedabad, India. Proceedings of Building Simulation 2019: 16th Conference of IBPSA. doi:10.26868/25222708.2019.210741
- Rawal, R., K. Sharma, V. Poola, P. Ruyssevelt, and P. J. Fennell. 2019. Approaches to Urban Stock Model, Ahmedabad, India: Centre for Advanced Research in Building Science and Energy (CARBSE), CEPT University. Submitted to the India-UK Joint Integrated Urban Model for Built Environment Energy Research (iNUMBER).
- Reinhart, C., T. Dogan, A. Jakubiec, T. Rakha, and A. Sang. 2013. UMI - An urban simulation environment for building energy use, daylighting and walkability. In 13th Conference of International Building Performance Simulation Association, August 26–28, ed. C. F. Reinhart, T. Dogan, J. A. Jakubiec, T. Rakha, and A. Sang, 476–483. Chambéry, France: Massachusetts Institute of Technology, Department of Architecture. http://web.mit.edu/SustainableDesignLab/publications/umi_introduction.pdf
- Reinhart, C. F., and C. Cerezo Davila. 2016. Urban building energy modeling - A review of a nascent field. Building and Environment 97:196–202. doi:10.1016/j.buildenv.2015.12.001
- Remmen, P., M. Lauster, M. Mans, M. Fuchs, T. Osterhage, and D. Müller. 2018. TEASER: An open tool for urban energy modelling of building stocks. Journal of Building Performance Simulation 11 (1):84–98. doi:10.1080/19401493.2017.1283539
- Richardson, I., M. Thomson, and D. Infield. 2008. A high-resolution domestic building occupancy model for energy demand simulations. Energy and Buildings 40 (8):1560–6. doi:10.1016/j.enbuild.2008.02.006
- Robinson, D., N. Campbell, W. Gaiser, K. Kabel, A. Le-Mouel, N. Morel, J. Page, S. Stankovic, and A. Stone. 2007. SUNtool - A new modelling paradigm for simulating and optimising urban sustainability. Solar Energy 81 (9):1196–1211. doi:10.1016/j.solener.2007.06.002
- Robinson, D., F. Haldi, J. Kämpf, P. Leroux, D. Perez, A. Rasheed, and U. Wilke. 2009. Citysim: Comprehensive micro-simulation of resource flows for sustainable urban planning. IBPSA 2009 - International Building Performance Simulation Association 2009, 1083–90, https://www.collective.in/ps/sites/default/files/CBERD_2.1TR_006JULY2014.pdf.
- Saretta, E., P. Bonomo, and F. Frontini. 2020. A calculation method for the BIPV potential of Swiss façades at LOD2.5 in urban areas: A case from Ticino region. Solar Energy 195:150–65. doi:10.1016/j.solener.2019.11.062
- Sarraf, S., S. Anand, and P. Mathew. 2014. Exploratory data analysis of Indian hotel benchmarking dataset: Key findings and recommendations. July.
- Shnapp, S., and J. Laustsen. 2013. Robust building data: A driver for policy development. Global Buildings Performance Network (GBPN). February.
- Swan, L. G., and V. I. Ugursal. 2009. Modeling of end-use energy consumption in the residential sector: A review of modeling techniques. Renewable and Sustainable Energy Reviews 13 (8):1819–35. doi:10.1016/j.rser.2008.09.033
- USAID India. 2009. Energy Efficiency in Hospitals Best Practice Guide, https://www.keralaenergy.gov.in/files/Energy_Efficiency_in_Hospitals-_Best_Practice_Guide.pdf.
- Wang, C. K., S. Tindemans, C. Miller, G. Agugiaro, and J. Stoter. 2020. Bayesian calibration at the urban scale: A case study on a large residential heating demand application in Amsterdam. Journal of Building Performance Simulation 13 (3):347–61. doi:10.1080/19401493.2020.1729862
- Wang, D., J. Landolt, G. Mavromatidis, K. Orehounig, and J. Carmeliet. 2018. CESAR: A bottom-up building stock modelling tool for Switzerland to address sustainable energy transformation strategies. Energy and Buildings 169:9–26. doi:10.1016/j.enbuild.2018.03.020
- Yi, C. Y., and C. Peng. 2019. An archetype-in-neighbourhood framework for modelling cooling energy demand of a city’s housing stock. Energy and Buildings 196:30–45. doi:10.1016/j.enbuild.2019.05.015
- Zhu, P., D. Yan, H. Sun, J. An, and Y. Huang. 2019. Building Blocks Energy Estimation (BBEE): A method for building energy estimation on district level. Energy and Buildings 185:137–47. doi:10.1016/j.enbuild.2018.12.031
Appendix 1
Classification of the reviewed UBEM projects in the Model Characterization framework. The color indicates the LoD in respective Model characteristic.
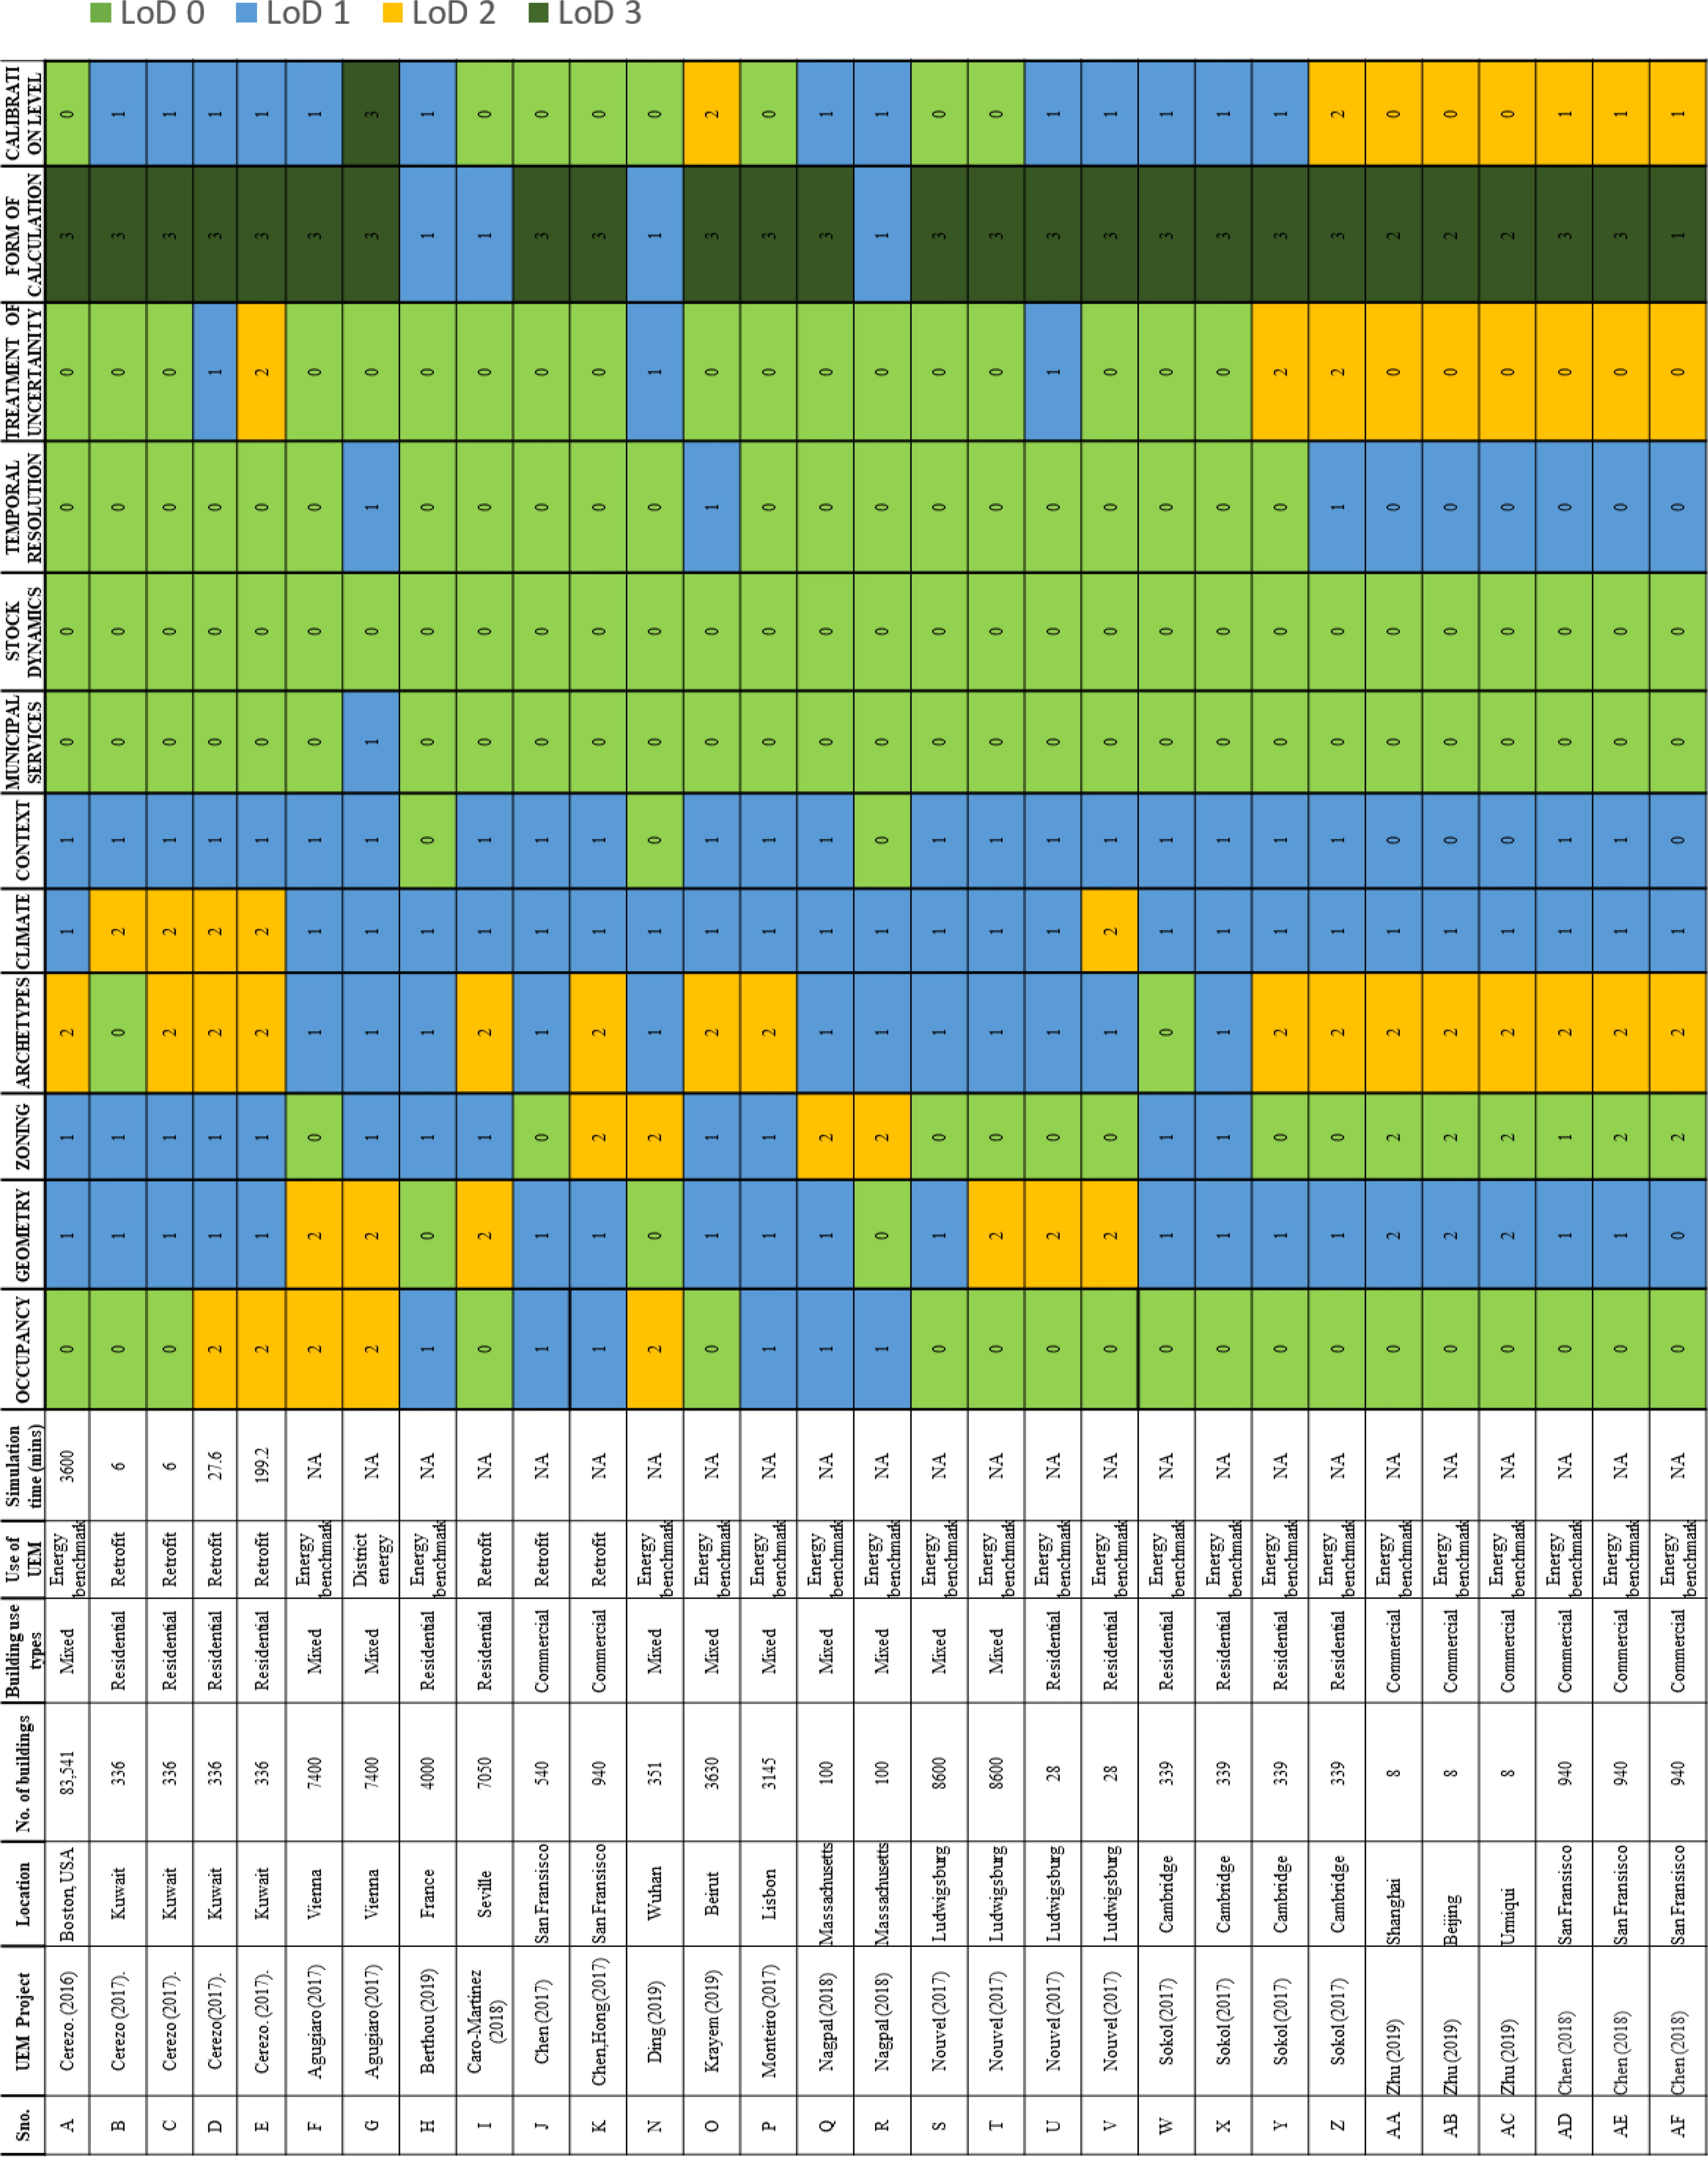
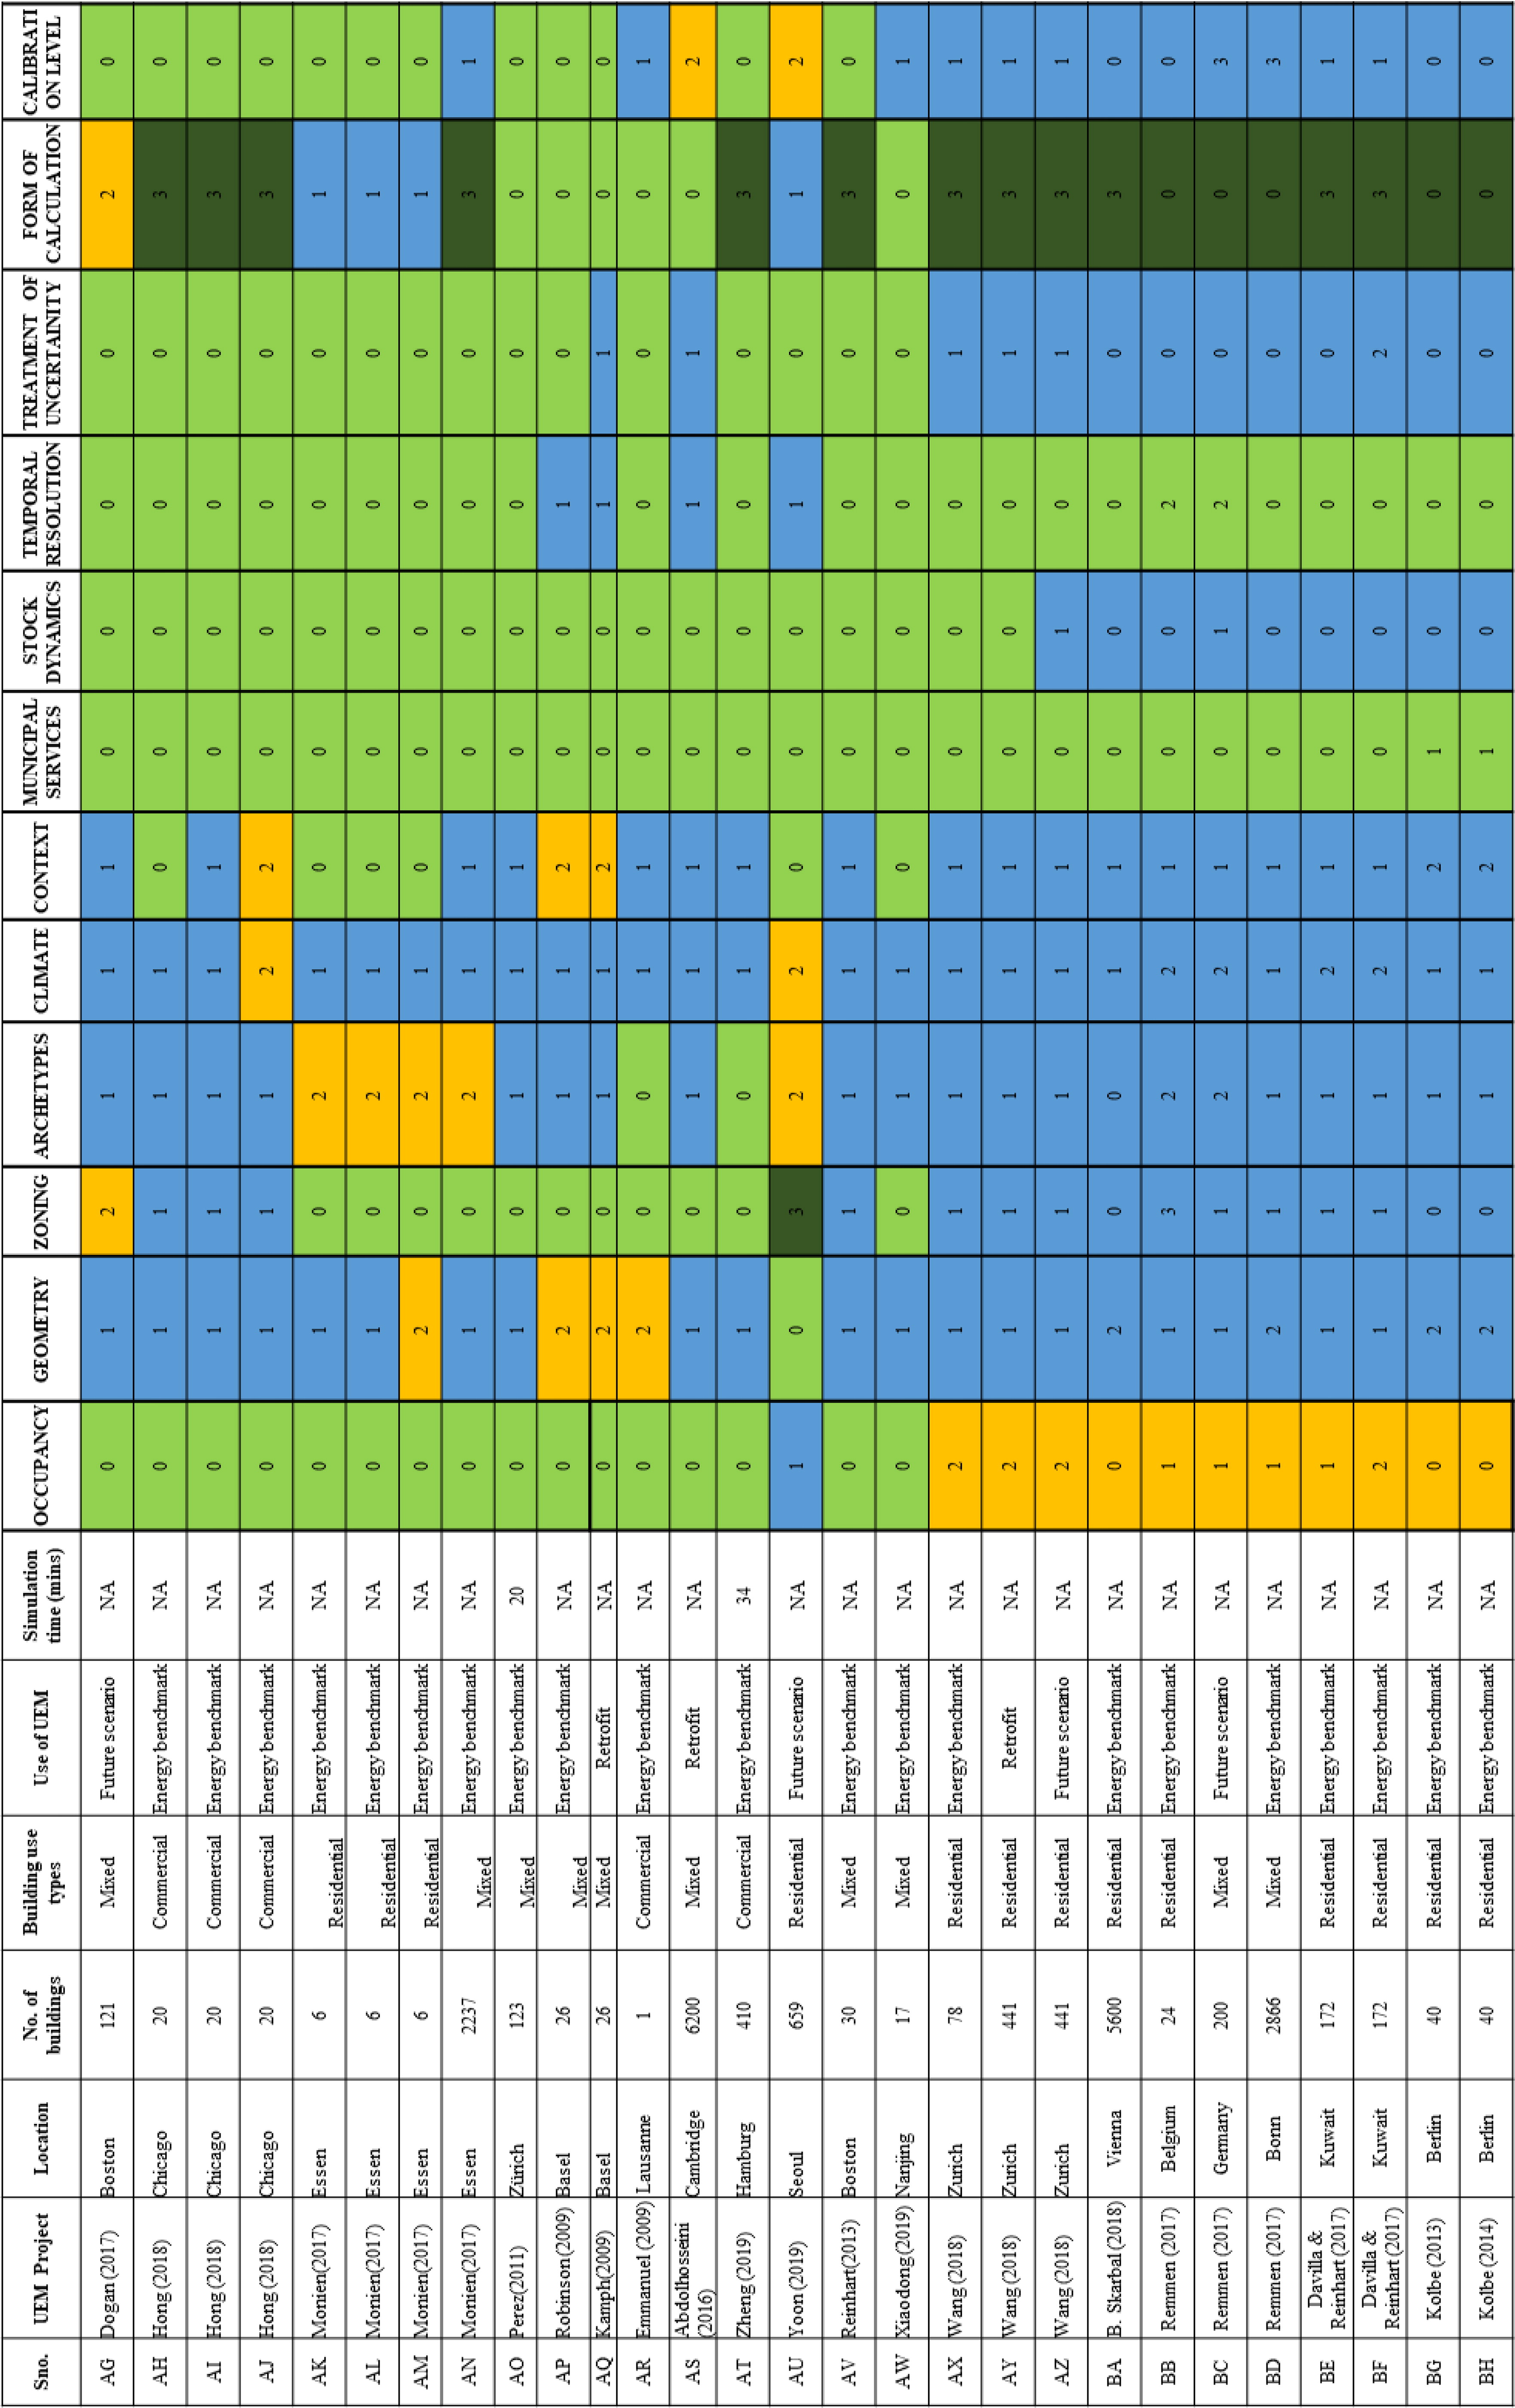

Appendix 2
Application of the proposed Model characterization framework