
 ?Mathematical formulae have been encoded as MathML and are displayed in this HTML version using MathJax in order to improve their display. Uncheck the box to turn MathJax off. This feature requires Javascript. Click on a formula to zoom.
Abstract
Many district cooling systems suffer from low delta-Ts due to faults in the substations and buildings. This causes increased pumping costs, congested distribution networks and operation of more chillers. To enable fault detection and further diagnosis of district cooling substations, knowledge about the actual performance is needed. In this paper, a method using performance indicators to assess the performance of individual district cooling substations was developed along with a ranking system for substation comparison purposes. The performance assessment method was tested on 26 substations in a district cooling system by developing an algorithm. The input to the method was historical operational data collected from the substations’ primary and secondary sides from four years. The output summarized the performance of the substation in a few seconds and the ranking indicated which substation is in most need of improvement. The performance assessment can be conducted with only primary data as input but including secondary data from the building system provides additional information about the substation efficiency along with potential improvement measures. The method can be implemented by a utility company to serve as decision support and facilitate continuous follow-up of the substations to subsequently enable fault detection of district cooling substations.
Introduction
The cooling demand in buildings is increasing globally and by 2050 the energy use for space cooling is expected to threefold compared to 2016 (IEA Citation2018). In Sweden, approximately 25% of the cooling demand in commercial buildings is supplied by district cooling (DC). The development of DC in Sweden was initiated in the 1990s and today there is 530 km of DC piping in 40 Swedish cities, delivering around 1.0 TWh of cooling annually. Cooling supplied by DC in Sweden is projected to double over the next decades (Renström, Johnsson, and Ludvig Citation2021). However, faults and problems in DC systems and the connected buildings lead to low return temperatures (also called “the low delta-T syndrome”) which cause inefficient cooling production and congested distribution networks, ultimately increasing the costs and wasting energy. The counterpart to DC is district heating (DH), which experiences similar issues although the problem is the opposite, with high return temperatures being a problem. For DH systems, faults that oftentimes lead to high return temperatures have been investigated by several previous studies under the research domain “fault detection and diagnosis” (FDD) in DH substations (Ntakolia et al. Citation2022; Buffa et al. Citation2021). Although research outcome on FDD in DH substations to some extent is applicable to DC, no previous studies have been conducted on FDD in DC substations specifically. Conversely, a large number of studies have been conducted on HVAC and chilled water (CHW) systems supplied by district cooling (G. Li et al. Citation2021; Gao et al. Citation2012; Gao, Wang, and Shan Citation2016; Gao, Wang, Gang, et al. Citation2016; Dai, Lu, and Xu Citation2021), which are the systems on the secondary side, connected to the DC system. In DC systems, it is possible for a substation to operate with a delta-T well below the optimal level for the DC system without necessarily experiencing significant faults. This is mainly due to the expansion strategy of many DC systems in the early development phase. By pursuing a high connection rate with lenient compliance to the design guidelines, buildings that were non-compatible with the DC system’s design temperature criteria were still connected. For this reason, a substation with a low delta-T may or may not be the cause of faults in the substation.
Literature review
The literature review approaches FDD for DC applications from two perspectives. The first section investigates FDD from a DH perspective and the second section from a building HVAC system perspective, including different subsystems and components of the HVAC system.
Fault detection in DH systems and substations
Many different faults can occur in the DH substation and cause different symptoms. Three types of fault symptoms were identified by Gadd and Werner (Citation2015): (1) unsuitable heat load patterns, (2) low average annual temperature difference, (3) poor substation control. According to Swedish utility companies, faults in the DH substations include leakages, malfunctioning control values and actuators as well as faults in the secondary systems. For faults related to the heat exchanger (HX) in the substation, leakage is one of the most common and fouling one of the least common (Månsson et al. Citation2019).
Pakanen et al. (Citation1996) suggested different approaches to FDD in DH substations. These included static, physical and energy balance modeling, classification using performance indexing as well as fault tree reasoning and statistical tests. Lately, methods based on data mining have become popular, which can be divided into two categories: data-driven and knowledge-driven. Knowledge-driven methods simulate the diagnostic thinking of experts (Fan et al. Citation2018; Miller, Nagy, and Schlueter Citation2018; Y. Zhao et al. Citation2019), whereas data-driven methods include different machine learning techniques, generally categorized as supervised learning (for example classification and regression) or unsupervised learning. Supervised data-driven methods require the input data to be labeled. This is a recognized problem for FDD in DH substations since the data typically lack labels on normal, faulty and atypical (neither normal nor faulty) operational behavior (Farouq et al. Citation2020; Bode et al. Citation2020; Månsson, Benzi, et al. Citation2021). With unsupervised learning the data can be unlabeled and such methods can be used to for example expose hidden patterns within the data (Ntakolia et al. Citation2022).
Fault detection and diagnosis of DH systems based on physical modeling have previously been conducted in Modelica (Zimmerman, Dahlquist, and Kyprianidis Citation2017) and TRNSYS together with EnergyPlus (Brès et al. Citation2019). However, it is difficult to model a DH system with associated substations and building systems due to the large number of substations typically present (Gustafsson and Sandin Citation2015). Data-driven FDD methods may therefore be more suitable when handling a large number of substations where one commonly used method is clustering. It has previously been used with DH billing data as input (Sebastian Kiluk Citation2012; S. Kiluk Citation2014; Sebastian Kiluk Citation2017) and together with sequential pattern mining to monitor the DH substation performance (Abghari et al. Citation2019, Citation2020). Clustering has also been used to identify different substation operation strategies (Lu et al. Citation2019) as well as seasonal and daily operating patterns (Xue et al. Citation2017). Other data-driven methods include fleet-based monitoring to identify DH substation operational behavior based on its reference group (Farouq et al. Citation2020), classification and regression for prediction and fault identification (Månsson, Kallioniemi, et al. Citation2018), regression and outlier identification (Månsson, Davidsson, et al. Citation2018) and neural networks (F. Zhang and Fleyeh Citation2020; M. Li et al. Citation2020). These previous studies show both physical modeling and data-driven methods successfully have been deployed for FDD in DH systems and substations.
To identify faults and fault symptoms in DH substations a range of different performance indicators (PIs) have been developed, tested, and evaluated. Gadd and Werner (Citation2014) developed the temperature difference signature as a performance indicator (PI) to identify faults in substations in a Swedish DH system. Zinko et al. (Citation2005) developed a performance analysis method and a ranking procedure for DH substations based on the excess flow method, also called overflow, and a target primary return temperature. The overflow method is also commonly used among Swedish utility companies to rank substations with poor performance (Månsson, Thern, et al. Citation2021). Bergstraesser et al. (Citation2021) used the overflow method to evaluate faulty substations and identify measures to reduce the DH return temperature in three German DH systems. Månsson, Kallioniemi, et al. (Citation2018) used the PIs primary delta-T, return temperature signature and energy signature together with thresholds to identify the performance of substations in an actual DH system. The energy signature has also been used with neural networks (F. Zhang and Fleyeh Citation2020), and to construct models of the buildings supplied by DH (Lin et al. Citation2022). Abghari et al. (Citation2020) linked the substation behavior profiles with the PIs substation effectiveness (defined as primary delta-T divided by maximum delta-T) and least temperature difference (defined as the difference between primary and secondary return temperatures, also called return temperature approach). Farouq et al. (Citation2020) used the primary return temperature as a PI to monitor the substation operational behavior. To identify fouling of the HX, the relation between thermal power and logarithmic mean temperature has been shown to be an effective PI (Guelpa and Verda Citation2020).
What the previous studies above have in common are the use of PIs to assess the performance of the DH substations and detect faults. Although the DC system and substation share many similarities with DH, results from studies based on FDD in DH systems and substations may not be directly applicable to DC systems, despite being suggested in previous studies (Zimmerman, Dahlquist, and Kyprianidis Citation2017; M. Li et al. Citation2020). For example, cooling demands in buildings are less outdoor temperature dependent than the heating demands and PIs such as temperature signature and energy signature (where the outdoor temperature is one variable) may be less useful for fault detection in DC substations. To the authors’ knowledge, no previous studies have applied the results of FDD in DH systems to DC. Neither are there any studies exclusively investigating FDD in DC substations based on actual operational data from existing DC substations. Moreover, some of the previous studies have approached FDD in DH substations by diagnosing the symptoms of a fault, for example detecting high primary return temperature faults (Brès et al. Citation2019). However, since the delta-T between the supply and return water of the DC system is much lower than in DH systems, return temperature or delta-T alone is insufficient to describe the DC substation performance. This is because the substation may be operating normally yet deliver a too low return temperature. For DC systems, PIs in addition to those developed for DH substations are needed to assess the DC substation’s performance and subsequently enable fault detection in the DC substation. Therefore, a method facilitating a quick audit of the DC substation’s performance, similar to the individual substation analysis method developed by Zinko et al. (Citation2005) for DH substations, could be a potential solution. Such a method should also have some practical value for utilization by the utility company owning the district cooling system. Knowledge about the performance status of all substations in the DC system is a prerequisite to actively work with improvements of the DC system’s delta-T (Walletun and Johnsson Citation2005). It has previously been established that increased delta-Ts from the substations can be achieved through good customer relationships (Månsson et al. Citation2019; Buffa et al. Citation2021) and by continuous work of the utility company (Zinko et al. Citation2005; Petersson and Dahlberg-Larsson Citation2013). A method to quickly determine the performance of the substation could therefore enable a systematic substation analysis on a regular basis, aid the customer relationship building and enhance the collaboration if used for follow-up together with the customers.
Fault detection in HVAC systems
Despite the lack of FDD for DC substations, ample research on FDD has been conducted on the secondary side of DC systems, in the buildings’ HVAC and CHW systems. Previous studies on FDD in HVAC systems can be separated into system, subsystem, and component level. Faults can occur at each of these levels and affect the operation of the related subsystems and components (McIntosh Citation1999). Examples of faults in HVAC systems as identified by Y. Li and O’Neill (Citation2018) are: duct leakage, dampers not working properly, airflow not balanced, improper commissioning, control component failure or degradation, valves not closing properly, cooling coil valve stuck or leaking, HX faults (scaling, leaking, fouling) and pipe clogging. A fault in the ventilation system may be transferred to the water side of the HVAC system and affect its performance, but also obscure the cause and effect of the fault (R. Zhang and Hong Citation2017). Fouling of cooling coils or other end terminals reduce the overall heat transfer which cause an increased chilled water flow rate and ultimately a low delta-T, transferred from the building CHW system to the primary side of the DC substation.
Zhou, Wang, and Ma (Citation2009) proposed an FDD method for an HVAC system where the performance of the subsystems cooling towers, chillers, secondary chilled water pumps and heat exchangers were characterized with PIs. The PIs for the HX system were overall heat transfer coefficient (UA-value) and temperature effectiveness. The method was further developed to include sensor faults with two fault severity levels by the use of principal component analysis and a support vector regression-based reference model. Faulty operation with low delta-T was identified by the use of the PIs primary delta-T and UA-value of the HX (S. Wang, Zhou, and Xiao Citation2010; Y. Zhao, Wang, and Xiao Citation2013b; Gao, Wang, Shan, and Yan Citation2016). Principal component analysis has also been used by Chen and Lan (Citation2010). Other methods for HVAC system FDD include energy balance paired with support vector machine (Liang and Du Citation2007) and clustering together with a model of the system built in TRNSYS (Luo et al. Citation2019). FDD on HVAC component level has been conducted for chillers (S. Wang and Cui Citation2005; Y. Zhao, Wang, and Xiao Citation2013a; Y. Zhao, Xiao, and Wang Citation2013; Audivet Durán and Sanjuán Citation2016; P. Wang and Gao Citation2017; X. Zhao, Yang, and Li Citation2014; Namburu et al. Citation2007), shell and tube heat exchangers (P. Wang, Gao, and Fan Citation2015) and air handlings units (Du et al. Citation2014; Bruton et al. Citation2014; Yu, Woradechjumroen, and Yu Citation2014).
Similar to previous studies on FDD in DH substations, a majority of previous FDD studies on HVAC systems and components use PIs to detect faults. For FDD in HVAC systems the PIs are typically compared with benchmark PI values obtained from simulations of a reference model of the system or component. The deviation between the benchmark PI and the measured PI is called residual. If the absolute value of the residual is greater than a set threshold, a fault is detected, whereby the threshold needs to be appropriate to not generate false alarms (Calikus et al. Citation2018). The reference models are usually based on highly correlated parameters, shown to work well when the input data is of decent quality and labeled for normal and faulty operation. However, these models need to be validated with operational data before applied in real-world operation (Bode et al. Citation2020). Moreover, the majority of previous FDD studies in HVAC systems use steady-state and only a few account for transient conditions and sudden events. This is a major problem for FDD in HVAC systems and makes it difficult to obtain reliable results (G. Li et al. Citation2021; Mirnaghi Sadat and Haghighat Citation2020) since faulty operation is challenging to distinguish from transient operation. Therefore, simpler models based on knowledge and expert rule approaches seem to be more appropriate solutions for FDD (Verhelst et al. Citation2017), for example using operational and fault signatures based on operational data from the system (Lee, Yoon, and Won Citation2022). However, using operational data without labels on normal and faulty operation limits the possibilities of creating a data-driven reference model to which the PIs can be compared for fault detection. Transient conditions have been shown to be a problem when analyzing data from DC substations (Jangsten, Lindholm, and Dalenbäck Citation2022) along with lack of labeled data. Therefore, there is a need to develop a performance assessment method based on operational data without the requirement of a reference model based on labeled data.
The majority of secondary systems in buildings connected to a DH system are radiator systems. The secondary systems in buildings connected to a DC system are usually more diverse and complex, containing components and end terminals typical in the prior investigated studies for FDD in HVAC systems (Jangsten, Filipsson, et al. Citation2020). Månsson, Thern, et al. (Citation2021) and Buffa et al. (Citation2021) highlighted the issue with addressing faults in the customers secondary systems due to the ownership situation. This could potentially be aided by accessing the customer’s data in the secondary system, such as the customer’s secondary supply and return temperatures. However, this may be a contractual issue as well as it needs to be justified economically. Guelpa and Verda (Citation2020) developed an automatic fouling detection method in DH substations by the inclusion of secondary data. Brès et al. (Citation2019) achieved higher prediction accuracy with secondary temperature data when modeling four different DH substation faults. Similarly, studies on DC substations are needed to value the added knowledge from including secondary data as part of assessing the substation’s performance.
Based on the above literature review it can be concluded that numerous faults can occur in both DH substations and the HVAC systems on the secondary side. Both physical modeling and data-driven methods have formerly been used for fault detection and performance assessment in DH substations and HVAC systems, typically requiring either labeled data or a reference model of the system. What the majority of the previous studies have in common is the use of PIs to assess the performance and detect faults. However, no previous studies have been conducted on FDD in DC substations and there is a need to develop a method with appropriate PIs to assess the performance of DC substations. Such a method will provide knowledge about the actual performance of DC substations which is a prerequisite to subsequently work with detecting and diagnosing faults in DC substations.
Aim of study
The aim of this study is to develop and test a method with suitable performance indicators (PIs) to assess the performance of an individual DC substation and indicate some potential improvement measures. The developed method builds upon previous research on the DC system in Gothenburg, where issues with low delta-Ts have been investigated as well as control strategies and design aspects of the DC substation have been evaluated to resolve the low delta-Ts. The objectives of this article are threefold: (1) to develop PIs based on both primary and secondary data from the substation, (2) to automate the substation performance assessment by the use of an algorithm based on the developed method and (3) to develop a ranking system for comparison of the substation performance between different time periods and between several substations. The developed PIs should be able to describe and summarize the performance of the DC substation along with indicating some potential improvement measures for the assessed substation. By developing PIs based on data from the secondary side, a valuation of including secondary data will be provided. The performance assessment method can serve as decision support on which substation improvement measures primarily should be direct to.
District cooling substation
The method focuses on the performance of the DC substation, see for a general layout including measurement points. The data have been collected from 26 substations in the DC system in Gothenburg, Sweden, in cooperation with the utility company and building owners. The DC system in Gothenburg comprises 84 MW installed capacity and 181 substations as of the year 2021 (more information about the system can be found in Jangsten (Citation2020)). The substation layout according to is the most common configuration among the substations in the study, although five substations have two heat exchangers instead of one. The most common form of substation ownership is by the building manager, including the primary side control valve(s), the HX and equipment on the secondary side. The utility company only owns the energy meter and equipment for billing purposes.
Fig. 1. Outline of the DC substation with measurement equipment.
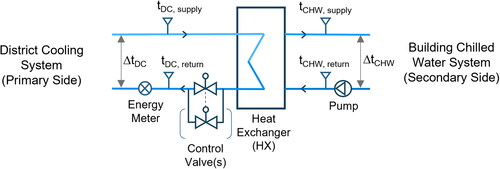
The building manager can connect with M-bus to the programmable logic controller (PLC) on the primary side data acquisition system by using the “customer access port.” This can be done for example to monitor or implement control strategies based on the readings of the primary supply and return temperatures and the primary flow. However, due to both contractual and technical aspects, the utility owner cannot connect the customer’s secondary temperature sensors to the data acquisition system on the primary side.
Data collection
The data in this paper are operational data, collected from the energy meters used for billing purposes on the primary side of 26 substations from the years 2018–2021. Data have also been collected from the buildings’ Supervisory Control and Data Acquisition (SCADA) systems on the secondary side of the substation of 2018 and 2021. See for data variables and relevant information. Two substations are missing a CHW-return temperature sensor. Another two substations are missing secondary data for one year, and one is missing primary data for one year. Moreover, the substations and their equipment are of different age, sizes and design. The buildings are commercial with different types of businesses, primarily offices with retail spaces, restaurants, cafés, and grocery stores.
Table 1. Data collected to develop and test the substation performance assessment method.
The temperature sensors on both primary and secondary sides of the HX are of the type Thermowell RTD. The primary temperature sensors conform to the standard EN 60751, class A, with an accuracy of ±0.1 °C. The temperature sensors on the secondary side do not have to conform to the standard but are usually also of the type Thermowell RTD with an accuracy of ±0.2 °C. The data measured by the temperature sensors are recorded by two separate data collection systems, the primary side (for billing purposes as owned by the utility company) and the secondary side (the SCADA system as owned by the building manager). The temperature sensors on the primary and secondary sides are not co-calibrated, and the recording intervals are different between the two systems. The primary temperature sensors record the temperatures instantaneously once per hour whereas the secondary temperature measurements typically are hourly averages based on more frequent readings during an hour.
The performance assessment method
First, the developed performance assessment method is outlined. Second, the performance indicators are explained and lastly the ranking system of the substations is described. The method and the performance indicators have been developed in close collaboration through an iterative process together with a utility company. Representatives from the utility company have through meetings and presentations acted as discussion partners providing feedback, recommendations, experiences and practical limitations. The rationale for the selected performance indicators and the substation ranking system demonstrates outcomes of the collaborative research process together with the utility company.
Outline
The performance assessment method is divided into two parts, each with a separate dataset for input, see for an outline. Part one is based on data from the primary side of the substation and includes variables 1–4 in . Part two includes the secondary data and uses all six variables in . An algorithm to automate the performance assessment method was developed in MATLAB and tested on the 26 substations.
Fig. 2. Outline of performance assessment method.
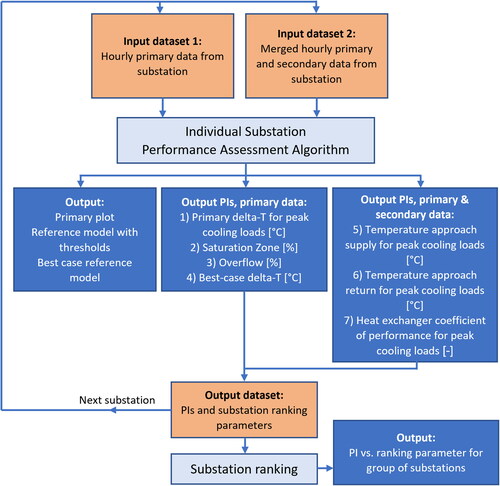
The performance assessment method outlined in is executed individually on one substation in an offline mode. Input dataset 1 contains primary data from all hours for a predetermined time period for which the substation performance should be analyzed, for example, the previous cooling season. The data simply have to be accessed from the utility company’s database used for billing purposes and no prior data treatment is needed. In addition to calculating the PIs and underlying variables, the algorithm also finds for example the maximum cooling power and corresponding flow. Potential flaws with the operational dataset such as missing values due to disconnections from the data collection system or maintenance shut-downs are accounted for by the algorithm by omitting those hours. If secondary data are available from the substation, input dataset 2, containing both hourly primary and secondary data, has to be merged manually. The algorithm extracts the data for weekdays between the hours 10:00–16:00, checks for one or two heat exchangers and any missing temperature sensors on the secondary side. The performance indicators obtained as the output dataset are stored separately for compilation if more than one substation are to be compared by using the ranking system.
Selection of performance indicators
As shown by the literature review, the performance of the DC substation can be captured by the use of performance indicators. The substation performance can be analyzed from various perspectives and in this method the PIs will be selected based on what is optimal from a DC system point of view.
Performance indicators primary side data
The PIs based on data from the primary side of the substations are the following and are further described below.
Primary delta-T for peak cooling loads,
[°C].
Saturation zone,
Overflow,
Best case
The dataset for which the PIs on the primary side are calculated contains all hours from the selected period for analysis (including hours when the flow or cooling power may be zero) and is indexed N. The temperature difference on the primary side is the most relevant and important indicator of the substation’s performance and is defined as:
(1)
(1)
From the DC utility company point of view, the most important operating scenarios are during high cooling loads, also called peak cooling loads. During such hours the DC system’s installed capacity is utilized close to its maximum and it is crucial that all substations achieve their highest possible delta-Ts to avoid excessive strain on the system. The primary delta-T is therefore extracted for hours with peak cooling loads. Peak cooling loads have been defined as the hours of operation when the cooling power is 75–100% of the maximum hourly cooling power for the period analyzed. Energy weighted delta-T is a common indicator used by utility companies and defining the PI primary delta-T for peak cooling loads is one type of energy weighting. The peak cooling load dataset is extracted from the dataset N and indexed p:
(2)
(2)
The PI primary delta-T is the median or mean delta-T for peak cooling loads as defined by EquationEquation (2)(2)
(2) , depending on the resemblance of a normal distribution. If the distribution is skewed to the right or left, the median value will be used, otherwise the mean value:
(3)
(3)
or
(4)
(4)
The saturation zone of the DC substation starts when the maximum cooling power has been reached, but the water flow rate continues to increase. This means the additional flow rate does not contribute to a higher cooling power and instead causes the delta-T to decrease (Thuillard, Reider, and Henze Citation2014). The saturation zone has previously been shown to cause low delta-T’s in DC substations (Jangsten, Lindholm, et al. Citation2020, Jangsten, Lindholm, and Dalenbäck Citation2022). The saturation zone flow as a PI for the substation is defined as the share of flow rate greater than the corresponding lowest flow rate for maximum cooling power:
(5)
(5)
where
is the hourly maximum measured flow rate and
is the lowest measured hourly flow rate for
as obtained from the dataset N, see . The PI saturation zone is thereby defined based on two values of the analyzed dataset.
Fig. 3. Example of substation primary plot with input data: cooling power, flow rate and delta-T. Illustrated are operating line (substation reference model) with upper and lower thresholds, best-case operating line, along with and
used to define the saturation zone.
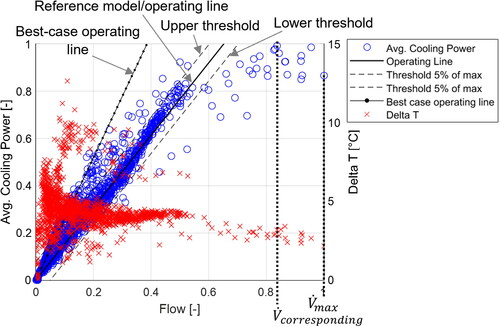
The relationship between the variables on the primary side in the substation is explained by the heat transfer equation of the heat exchanger (Incropera et al. Citation2007). This relationship is the reference model of the substation, also called the operating line of the substation due to the linear relationship, see :
(6)
(6)
In Zinko et al. (Citation2005), a reference model of the substation (based on either a 1- or 2-stage configuration) was used to find the ideal or target return temperature of the substation. DC substations are typically installed with one HX or two in parallel, but regardless, well-performing substations exhibit a linear relationship between the cooling power and flow rate according to EquationEquation (6)(6)
(6) at all times. In EquationEquation (6)
(6)
(6) ,
is the median or mean
from to EquationEquation (3)
(3)
(3) or (4). Aiming to achieve a delta-T equal to
of the substation for all hours,
becomes the target or ideal delta-T for the specific substation to be assessed. Using this delta-T, the physical preconditions of the specific substation are accounted for, as opposed to selecting an ideal delta-T with respect to all substations in the system (Zinko et al. Citation2005) or the DC system design value. This is because there are different underlying reasons as to why a delta-T less than the design value cannot be achieved by a specific substation. Using the ideal delta-T, the ideal flow rate of the substation can be found by rearranging EquationEquation (6)
(6)
(6) :
(7)
(7)
The difference between the actual and the ideal flow rate (reference model flow rate) is the residual:
(8)
(8)
The upper and lower thresholds of the reference model are defined as ±5% of Values below the lower threshold are overflow data and values above the upper threshold are best-case data, see . The datasets are indexed k and l respectively:
(9)
(9)
(10)
(10)
Based on the residuals below the lower threshold, the PI overflow is defined as:
(11)
(11)
Using EquationEquation (11)(11)
(11) , the overflow of the substation is based on the realistic ideal delta-T of the substation.
The residuals above the upper threshold are used to calculate the best-case delta-T of the substation, corresponding to the median or mean value of dataset l:
(12)
(12)
or:
(13)
(13)
The best-case delta-T, defines the best-case operating line of the substation, see . It indicates the improvement potential of the substation in comparison to the ideal delta-T,
and is useful for utility companies when discussing the substation performance and improvements with their customers.
Selection of secondary dataset
Commercial buildings supplied by district cooling commonly use time schedule operation as part of the control strategies for their HVAC systems (Jangsten, Lindholm, and Dalenbäck Citation2021). For this reason, it can be expected that a majority of the building’s chilled water systems are started up in the morning between 5:00 and 11:00 depending on day of the week or holiday and type of cooling demand present. Similarly, the chilled water system is expected to shut-off between 14:00 and 19:00. For the method in this paper, a dataset is extracted for weekdays between the hours 10:00 to 16:00 to calculate the PIs based on data from the secondary side of the substation. This is because a cooling demand is likely to be present in the building during office hours and temperature measurements for other hours may be misrepresented due to the time schedule operation.
An alternative to extracting data between the hours 10:00 to 16:00 is to find the start and stop hour for the specific building to be assessed based on changes in cooling power. This was tested on 13 buildings as part of developing the performance assessment method. Although the time schedule operation was apparent for 4–6 of the investigated buildings, where one specific hour could be assigned as the start hour and one as the stop hour, it was indistinguishable for the remainder. Increases and decreases of the cooling power also reoccurred throughout the day in some of the buildings leading to fluctuations and transient conditions of the secondary chilled water system despite utilizing time schedule operation strategies.
Performance indicators primary and secondary side data
If secondary data (variables 5 and 6 in ) are available for the substation performance assessment, an additional three PIs are obtained. These PIs are based on data from both primary and secondary sides of the substation and are calculated for the dataset extracted for office hours as described in the section “Selection of Secondary Dataset,” indexed w. The PIs are the following and further described below:
Temperature approach supply for peak cooling loads,
Temperature approach return for peak cooling loads,
Heat exchanger temperature effectiveness on the primary side multiplied with the normalized primary return temperature, called heat exchanger coefficient of performance HXCOPDC [-] for peak cooling loads.
Previous research have shown the temperature approaches to be of importance when analyzing primary and secondary temperature data of the DC substation HX (Jangsten, Lindholm, et al. Citation2020). The temperature approaches are defined as:
(14)
(14)
(15)
(15)
Many DC customers control the CHW-supply temperature setpoint according to outdoor temperature compensated curves (Jangsten, Filipsson, et al. Citation2020). For this reason, the PIs temperature approach supply and return are most important to evaluate when the lowest setpoints according to the outdoor temperature curve are in effect. This occurs for high outdoor temperatures typically corresponding to peak cooling loads. Data for the peak cooling load as defined in EquationEquation (2)(2)
(2) is extracted from dataset w and is indexed p. The PIs temperature approach supply and return are defined as:
(16)
(16)
(17)
(17)
Median values are used to reduce the influence from the occurrence of negative temperature approaches. Negative temperature approaches are thermodynamically impossible but can occur due to the following reasons:
Calibration of the primary and secondary temperature sensors is not done collectively.
Calibration of the secondary temperature sensors is lacking, done incorrectly or not been followed up and revised over time.
The recording intervals and recording methods may be different between the primary and the secondary sides data acquisition systems.
The most important indicator from the perspective of the DC system is the temperature effectiveness on the primary side of the HX. This is because it reveals the potential of achieving the highest possible return temperatures on both secondary and primary sides along with the greatest temperature difference of the HX. The temperature effectiveness on the primary side, is expressed by:
(18)
(18)
where:
(19)
(19)
Another important indicator of the substation performance is a high primary return temperature. Ideally it should as a minimum be equal to the design return temperature of the DC system. For this reason, the actual substation primary return temperature has been normalized with the design return temperature of the DC system and multiplied by the primary side temperature effectiveness from EquationEquation (18)(18)
(18) . This is because it is possible for a substation to have a high temperature effectiveness, yet a low primary return temperature. The variable is called heat exchanger coefficient of performance (HXCOPDC) and is defined as:
(20)
(20)
The PI is calculated as the median HXCOPDC for the dataset peak cooling load:
(21)
(21)
The design temperatures of the DC system in Gothenburg are 6 °C for the primary supply temperature, 16 °C for the primary return temperature and according to the design guidelines of the DC substation the secondary return temperature should be 18 °C (Göteborg Energi AB Citation2021). The design value of is then equal to 0.83.
Substation ranking system
One way of addressing poorly performing substations is in collaboration with the property owner. As established by Zinko et al. (Citation2005) and (Månsson, Thern, et al. Citation2021), ranking substations based on order of importance is a method of aiding the decision-making process on which property owner to contact first. Moreover, from a utility company’s perspective, the most poorly performing substation with the greatest impact on the entire DC system should be addressed first. Therefore, ranking the output PIs based on the substation’s size as well can direct the efforts to the substation with the largest improvement potential on the DC system. After each individual substation’s performance is assessed, the output PIs are saved to an output dataset. In addition to PIs, the following ranking parameters, indicating the size of the substation, are also obtained as part of the performance assessment, and saved to the output dataset:
maximum cooling power,
total volume flow rate:
Ranking the substations is sequentially done by plotting the PI with the ranking parameter of preference and extracting the substation order of importance from the plot. For example, overflow vs. total volume flow rate and delta-T vs. cooling power.
The ranking can also be done by combining the PIs overflow and delta-T:
(22)
(22)
Plotting this combined PI with the maximum hourly cooling power will indicate which substations exhibit the poorest performance in terms of both overflow and delta-T. Using the combined PI reduces the number of output plots from two to one, which speeds up the decision-making process when analyzing a large number of substations.
Results
Here the results from applying the performance assessment method to the 26 substations are presented. First, an example of the individual substation performance assessment for four different years is shown. Secondly, a comparison of the PIs obtained from the four analysis periods for the 26 substations is presented. Lastly, the substation ranking is provided.
Results from individual substation performance assessment
The developed performance assessment algorithm was successfully applied to the 26 selected substations where the output obtained was the primary plot with reference model, best-case reference model and the PIs. In , the output primary plot is shown for substation no. 7 for the four analyzed periods corresponding to the cooling seasons of 2018–2021. In the output PIs are summarized.
Fig. 4. Example of individual substation performance assessment for substation no. 7 for the cooling seasons of 2018–2021.
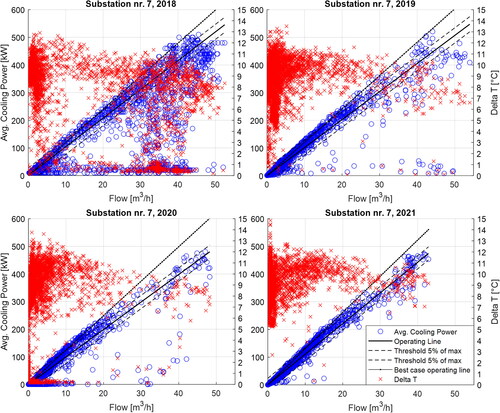
Table 2. Performance indicators from the assessment of substation no. 7 for the cooling seasons of 2018–2021.
In the performance of substation no. 7 can be seen for the four analyzed years. The building owner has applied different upgrades and energy efficiency measures to the building’s chilled water and HVAC systems. It should be noted that the summer of 2018 was significantly warmer than the summers of 2019–2021 which affected the cooling demand but also the substation performance. One observed improvement of the substation is the reduction of high flow rates for low cooling powers, captured by the PI overflow. In the overflow has been reduced from 33.1% in 2018 to 2% in 2021. It can also be seen that the PI primary delta-T was the highest for 2021. Moreover, based on both and , the saturation zone has decreased from 2018 to 2021.
In , the PIs based on secondary data can also be found for cooling seasons 2018 and 2021. The temperature approach supply was 3.1 °C in 2018 and 2.9 °C in 2021. This is positive since a value <2 °C could cause a low primary return temperature. A temperature approach supply >2 °C indicates the setpoint on the secondary side is appropriate in relation to the actual primary supply temperature. However, the temperature approach return has increased from 1.5 °C to 2.6 °C between 2018 and 2021. This is a negative trend and shows there is a potential of obtaining a higher primary return temperature in relation to the secondary return temperature. This trend is related to the decreased heat exchanger coefficient of performance, HXCOPDC, from 0.87 to 0.78. Although the PIs overflow, saturation zone and primary delta-T have improved from 2018 to 2021, the secondary side’s PIs nevertheless show there is an improvement potential of the substation in relation to the operation on the secondary side of the HX.
Comparison of PIs from 2018 to 2021
Here the performance indicators from the performance assessment of the 26 substations for the cooling seasons of 2018–2021 are presented. In and the PIs are sorted in ascending order with the year 2021 as the basis of comparison. For that reason, the substation cannot be identified by the use of the numbers on the x-axis.
Fig. 5. Left: performance indicator saturation zone for 26 substations based on data for the years 2018–2021. Right: performance indicator overflow for 26 substations based on data for the years 2018–2021.
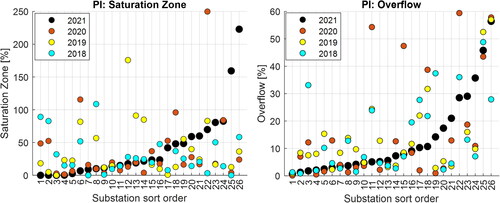
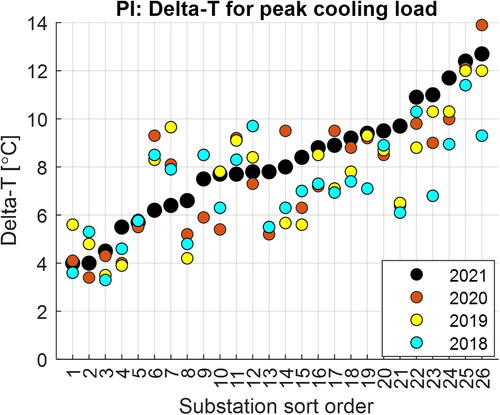
Fig. 6. Performance indicator delta-T for high cooling loads defined as 75–100% of maximum cooling power. This PI is also considered the ideal delta-T for the substation.
Primary data PIs
In the PIs saturation zone and overflow can be seen for the 26 assessed substations for the years 2018–2021. The individual substation performance assessment is conducted independent of the data from previous time periods analyzed. The PIs saturation zone and overflow are therefore calculated based on data which most likely varies between different time periods. This is a result of altering conditions in the building between the years and cooling seasons, for example changes of tenants and cooling demands, renovation, and energy efficiency implementations. Regardless, the PIs indicate the performance of the substation and improvements such as a reduced saturation zone can be seen for substations 1 and 6 for 2021 compared to the three previous years. The opposite can be observed for substations 21, 23, 25 and 26. For such substations a flow restriction control strategy as evaluated by Jangsten, Lindholm, and Dalenbäck (Citation2022) is one potential improvement measure.
For the PI overflow, 18 of the analyzed substations have reduced the overflow in 2021 compared to previous years. This does not necessarily mean that (which the overflow calculation is based on) has increased. Instead, the control of the substation has improved as a result of optimized substation operation through the implementation of improvement measures by the building owner. Such improvement measures could for example be ensuring proper control valve functioning or optimizing the temperature curves for the secondary supply temperature setpoint. The lowest overflow obtained from the four cooling seasons of the 26 substations is 0.1%, indicating an overflow close to zero is possible to achieve.
In , the PI delta-T for peak cooling load can be seen for the 26 substations. It ranges from a low of 3.3 °C to a high of 13.9 °C, and only five substations have a delta-T of 10 °C or more, conforming to the DC system design criteria. Overall improvements of delta-T between the analyzed years can be seen for 19 substations, whereas six have worsened and one is unchanged.
Primary and secondary data PIs
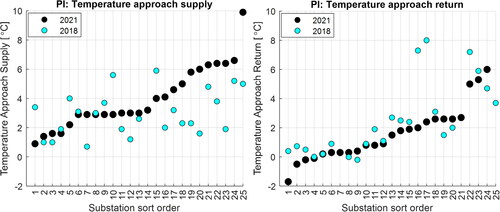
In the PIs supply and return temperature approach can be seen for 25 of the substations for the cooling seasons 2018 and 2021. For PI temperature approach supply it can be observed that only four substations have a value less than 2 °C for 2021. This suggests these buildings have setpoints violating the requirement of maintaining a minimum of 2 °C between the primary and secondary supply temperatures, which in turn could cause low primary return temperatures. Conversely, the remaining 21 buildings have supply temperature approaches greater than 2 °C, which is desirable since it enables a high primary return temperature (Jangsten, Lindholm, et al. Citation2020). For the temperature approach return it can be seen that values of zero or less than zero are obtained for four substations. This is impossible since it violates the heat exchanger’s thermodynamical laws. Instead, it highlights the problems with merging temperature measurements from two separate data collection systems on either side of the HX, despite extracting the data for calculation of the PIs for office hours and peak cooling loads. Lastly, a majority of the substations have increased the supply temperature approach and decreased the return temperature approach, which is a positive outcome between the two years.
Fig. 7. Performance indicators temperature approach supply (left) and return (right) for 25 substations for the cooling seasons of 2018 and 2021.
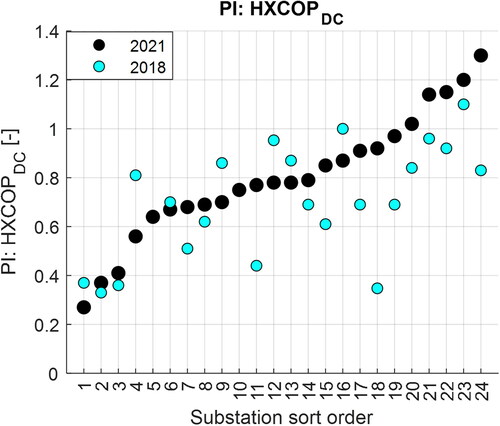
In the performance indicator HXCOPDC is shown for 24 of the substations. Based on the design temperatures of the DC system the minimum optimal value is 0.83. Ten substations reach 0.83 or more and five have a value greater than 1, viable with a primary return temperature greater than 16 °C. The remaining 14 substations have values less than the design value. It is possible that the HX has a high temperature effectiveness, but still returns a low primary return temperature. The temperature effectiveness alone as a PI could therefore indicate a satisfactory substation performance when the primary return temperature would suggest the opposite. Some of the low HXCOPDC values could therefore be due to primary return temperatures being significantly lower than 16 °C or return temperature approaches being high (greater than 2 °C). A majority of the substations have increased HXCOPDC in 2021 compared to 2018 which indicates performance improvements are possible without HX replacements.
Fig. 8. Performance indicator heat exchanger coefficient of performance for 24 substations.
Substation ranking
To identify which substation improvement measures would have the greatest impact on the DC system, the substations are ranked based on size. In the left graph of , the PI overflow is plotted against total volume flow rate and in the right graph delta-T is plotted against maximum hourly cooling power for the 26 substations from the cooling season of 2021. Based on the previous analysis, well-functioning substations should have an overflow close to zero and a delta-T of at least 10 °C. However, as shown in , only two substations fulfill the overflow criteria, and five substations achieve the delta-T criteria. Therefore, it is evident that improvement efforts are needed for many substations. In the left graph of , the two substations with the largest total volume flow rate, numbers 16 and 19, have an overflow between 20 and 30%. Reducing the overflow for these two substations would have a larger impact on the DC system compared to a substation with a smaller total volume flow rate. When examining the right graph of it can be seen substation no. 19 is one of the larger substations with a maximum hourly cooling power of 476 kW and a delta-T of 7.5 °C. Substation no. 16 has a lower delta-T of 6.6 °C but also a lower cooling power equal to 224 kW. Therefore, substation no. 19 should be ranked at the top of the priority list. However, when comparing substations 11–13, 16, 19 and 26 between the left and the right graph of , a ranking to find the substation in most need of improvement is not evident. For this reason, the two PIs overflow and delta-T have been combined according to EquationEquation (22)(22)
(22) as shown in .
Fig. 9. Substation ranking for PI overflow based on total volume flow rate (left) and PI delta-T based on cooling power (right).
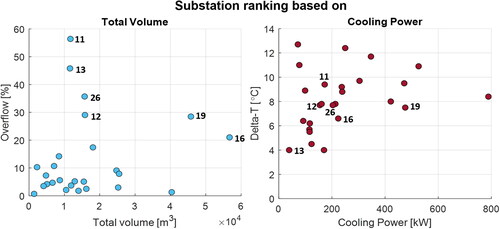
Fig. 10. Combined PIs overflow and delta-T vs. maximum hourly cooling power to rank 26 substations based on data from the cooling season of 2021.
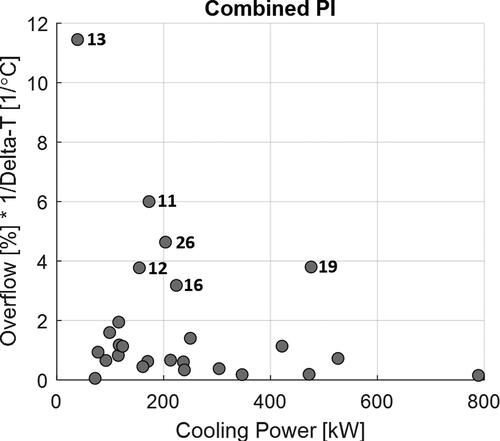
In the combination of the PIs overflow and delta-T is plotted against the maximum hourly cooling power. Using the combination of the two PIs, substations with both high overflows and low delta-Ts can be identified. According to , these substations are number 11–13, 16, 19 and 26. The subsequent ranking of these substations can be done for example in descending order of cooling power, total substation volume or energy. However, to evaluate the actual impact on the DC system, a performance assessment of all 181 substations in the system is needed.
The PIs based on both primary and secondary data for the six numbered substations in are summarized in . For example, substation no. 13 has temperature approaches >2 °C and a HXCOPDC significantly lower than the design value of 0.83. This indicates the secondary setpoint is most likely not the cause of a low HXCOPDC. Instead, it could be problems with the HX or the relation between the primary and secondary flow rates causing both temperature approaches to be >2 °C. On the contrary, substation no. 11 has a high temperature approach supply, a low temperature approach return as well as an HXCOPDC > 0.83. This shows the HX is performing well with appropriate temperature levels. The poor performance of substation 11 based on the PI overflow is instead related to the control of the primary flow rate. The PIs based on secondary data as well do not necessarily alter the ranking order, but instead provide additional information about potential reasons to a high overflow and low delta-T.
Table 3. PIs based on primary and secondary data for substations number 11–13, 16, 19 and 26.
Discussion
Having knowledge about the substation performance is a prerequisite to be able to detect and diagnose faults in the DC substation. Moreover, the process of implementing improvement measures needs to be systematic and documented, as suggested by Månsson, Benzi, et al. (Citation2021). Many DC companies in Sweden contact customers with poorly performing substations to initiate a collaboration for improved substation performance. For a utility company with more than 180 substations and a majority of these performing poorly, a systematic assessment of the substations’ performance and ranking can aid the decision-making process on which customer to begin with. Moreover, to continuously ensure proper substation performance and avoid ad hoc attempts, the substation assessment needs to be done recurringly, for example once per month. The average algorithm execution time based on primary data was a couple of seconds per substation. Since the dataset input to the performance assessment algorithm is data used for billing purposes, no further preprocessing of the dataset is needed, other than what is already done by the utility company’s data collection system for generating invoices. The developed method provides a framework for how the performance of DC substations can be assessed. It can be used in the presented offline mode to assess the substation performance, for example after the cooling season or before a customer meeting. It can also be integrated into the utility companies’ software for continuous online monitoring. Prior to initiating an online performance assessment, the substation PIs need to be evaluated based on historical data to determine the substation reference model and obtain the PIs threshold values, something which could be a difficult and time-consuming task (Calikus et al. Citation2018). The threshold values can then be used for online monitoring to detect suboptimal substation operation.
The algorithm was developed in the program MATLAB, however any programming language suitable for the utility company’s existing data collection software can be used. The algorithm can be integrated into the existing data collection system as a plug-in or can be a standalone application if data transfer between the data collection system and the performance assessment application can be arranged. Although the performance assessment method was developed in collaboration with one utility company based on data from one DC system, it is considered to be applicable to other DC systems provided there is HX separation in the substation. This is because DC systems typically are constructed similarly, and the method is based on plate frame heat exchanger fundamentals. However, aspects potentially affecting the developed method’s applicability among DC utility companies are organizational and workflow aspects as well as different forms of substation ownership.
Another opportunity based on the substation performance assessment is to use the operating line (reference model) as a control strategy of the substation. Using the ideal delta-T of the substation as a control parameter for the primary flow could be a potential improvement measure to ensure proper operation of the substation. Such a control method needs to be tested and evaluated on an actual substation.
Including the PIs based on temperature measurements on the secondary side of the HX as part of the substation performance assessment give an indication on how efficiently the HX is working and how well the secondary side is operating in relation the primary side. However, the temperature measurements on the secondary side are accompanied with errors as outlined in the section “Data Collection” and shown by the negative temperature approaches in the section “Primary and Secondary Data PIs.” For this reason, it may not be valuable for a utility company to directly connect the temperature sensors on the customer’s side to its data acquisition system for online substation monitoring, even if it would be technically and contractually feasible. Minimizing the uncertainties from the temperature measurements on the secondary side in relation to the primary side is essential to ensure an accurate substation performance assessment, whereby the following is suggested:
The temperature sensors on both primary and secondary sides need to be of the same quality, have the same uncertainty and be co-calibrated and revised jointly.
The temperatures on the secondary and primary sides have to be measured and recorded with the same method and recording intervals.
Essentially, the substation performance is assessed with the PIs overflow, delta-T, and saturation zone based on primary data. However, the PIs based on secondary data as well provide supplemented information for poorly performing substations and can be used to identify improvement measures. For example, if the PI temperature approach supply is detected as low (<2 °C) it can be rectified by the use of a control strategy limiting the secondary supply temperature setpoint as evaluated by Jangsten, Lindholm, and Dalenbäck (Citation2022).
Conclusions
A novel method for assessing the performance of a district cooling substation was developed including performance indicators. The method was individually tested in an offline mode on 26 substations in Gothenburg district cooling system by the use of an algorithm with historical operational data from the cooling seasons of 2018–2021 as input. The results showed the method successfully assessed the performance of the substations using the developed performance indicators. The substation performance was compared both between the four analyzed years and between the 26 substations using the developed ranking system. The ranking was done according to performance and size and indicated to which substation potential improvement efforts primarily should be directed. The performance assessment method could be used only with primary data as input, but when supplemented with secondary data, some improvement measures for poorly performing substations were identified as well. The method was developed in close collaboration with a utility company and could be implemented for use by utility companies in an offline mode without the need of additional preprocessing of the input data. The output from the individual substation performance assessment provides knowledge about the actual performance of district cooling substations and can be used as decision support when addressing poorly performing substations. It can also be used to obtain required thresholds to further enable fault detection of district cooling substations.
| Nomenclature | ||
| = | Cooling power [kW] | |
| = | Volumetric flow rate [m3/h] | |
| t | = | Temperature [°C] |
| Δt | = | Temperature difference [°C] |
| cp,water | = | Specific heat capacity of water [kJ/kg K] |
| ρwater | = | Density of water [kg/m3] |
| Indices | ||
| N | = | Dataset all hours |
| p | = | Dataset extracted for peak cooling load (75–100% of max) |
| w | = | Dataset extracted for office hours (weekdays 10:00–16:00) |
| k | = | Dataset for residual below lower threshold |
| l | = | Dataset for residual above upper threshold |
| Subscripts | ||
| CHW | = | Chilled water, substation secondary side |
| CHW, supply | = | Supply stream to building: outlet warm side heat exchanger |
| CHW, return | = | Return stream from building: inlet warm side heat exchanger |
| DC | = | District cooling, substation primary side |
| DC, supply | = | Supply stream to heat exchanger: inlet cold side heat exchanger |
| DC, return | = | Return stream from heat exchanger: outlet cold side heat exchanger |
| max | = | Maximum |
| corresponding | = | Corresponding flow for maximum cooling power |
| PI | = | Performance indicator |
| Abbreviations | ||
| CHW | = | Chilled water |
| DC | = | District cooling |
| DH | = | District heating |
| FDD | = | Fault detection and diagnosis |
| HX | = | Heat exchanger |
| PI | = | Performance indicator |
| PIs | = | Performance indicators |
| PLC | = | Programmable logic controller |
Acknowledgments
This work was financially supported by the utility company Göteborg Energi AB. The authors would like to thank involved employees at Göteborg Energi AB for valuable input and knowledge. What made this study possible was the collaboration with the building owners, providing access to the buildings’ data acquisition systems for data collection. The authors would like to express their sincere gratitude to Vasakronan AB, Platzer AB, Higab AB, Älvstanden Utveckling AB, and Castellum AB.
Disclosure statement
The authors report there are no competing interests to declare.
References
- Abghari, S., V. Boeva, J. Brage, and C. Johansson. 2020. District heating substation behaviour modelling for annotating the performance. In Machine learning and knowledge discovery in databases. Vol. 1168. Springer International Publishing. doi:10.1007/978-3-030-43887-6
- Abghari, S., V. Boeva, J. Brage, C. Johansson, H. Grahn, and N. Lavesson. 2019. Higher order mining for monitoring district heating substations. Proceedings - 2019 IEEE International Conference on Data Science and Advanced Analytics, DSAA 2019, 382–91. doi:10.1109/DSAA.2019.00053
- Audivet Durán, C., and M. E. Sanjuán. 2016. On-line early fault detection of a centrifugal chiller based on data driven approach. Proceedings of the ASME 2016 10th International Conference on Energy Sustainability, Charlotte, NC. doi:10.1115/ES2016-59291
- Bergstraesser, W., A. Hinz, H. Braas, J. Orozaliev, and K. Vajen. 2021. Lessons learned from excess flow analyses for various district heating systems. Smart Energy 1:100005. doi:10.1016/j.segy.2021.100005
- Bode, G., S. Thul, M. Baranski, and D. Müller. 2020. Real-world application of machine-learning-based fault detection trained with experimental data. Energy 198:117323. doi:10.1016/j.energy.2020.117323
- Brès, A., C. Johansson, R. Geyer, P. Leoni, and J. Sjögren. 2019. Coupled building and system simulations for detection and diagnosis of high district heating return temperatures. Building Simulation Conference Proceedings, vol. 3: 1874–81. doi:10.26868/25222708.2019.210629
- Bruton, K., P. Raftery, B. Kennedy, M. M. Keane, and D. T. J. O’Sullivan. 2014. Review of automated fault detection and diagnostic tools in air handling units. Energy Efficiency 7 (2):335–51. doi:10.1007/s12053-013-9238-2
- Buffa, S., M. F. Hossein, G. Franchini, I. G. Lozano, and M. A. Chicote. 2021. Advanced control and fault detection strategies for district heating and cooling systems—A review. Applied Sciences 11 (1):455. doi:10.3390/app11010455
- Calikus, E., S. Nowaczyk, A. Sant’Anna, and S. Byttner. 2018. Ranking abnormal substations by power signature dispersion. Energy Procedia.149:345–53. doi:10.1016/j.egypro.2018.08.198
- Chen, Y., and L. Lan. 2010. Fault detection, diagnosis and data recovery for a real building heating/cooling billing system. Energy Conversion and Management 51 (5):1015–24. doi:10.1016/j.enconman.2009.12.004
- Dai, M., X. Lu, and P. Xu. 2021. Causes of low delta-T syndrome for chilled water systems in buildings. Journal of Building Engineering 33 (May 2020):101499. doi:10.1016/j.jobe.2020.101499
- Du, Z., B. Fan, X. Jin, and J. Chi. 2014. Fault detection and diagnosis for buildings and hvac systems using combined neural networks and subtractive clustering analysis. Building and Environment 73:1–11. doi:10.1016/j.buildenv.2013.11.021
- Fan, C., F. Xiao, Z. Li, and J. Wang. 2018. Unsupervised data analytics in mining big building operational data for energy efficiency enhancement: A review. Energy and Buildings 159:296–308. doi:10.1016/j.enbuild.2017.11.008
- Farouq, S., S. Byttner, M. R. Bouguelia, N. Nord, and H. Gadd. 2020. Large-scale monitoring of operationally diverse district heating substations: A reference-group based approach. Engineering Applications of Artificial Intelligence 90 (December 2019):103492. doi:10.1016/j.engappai.2020.103492
- Gadd, H., and S. Werner. 2014. Achieving low return temperatures from district heating substations. Applied Energy 136:59–67. doi:10.1016/j.apenergy.2014.09.022
- Gadd, H., and S. Werner. 2015. Fault detection in district heating substations. Applied Energy 157:51–9. doi:10.1016/j.apenergy.2015.07.061
- Gao, D.-c., S. Wang, W. Gang, and F. Xiao. 2016. A model-based adaptive method for evaluating the energy impact of low delta-T syndrome in complex HVAC systems using support vector regression. Building Services Engineering Research and Technology 37 (5):573–96. doi:10.1177/0143624416640760
- Gao, D.-c., S. Wang, K. Shan, and C. Yan. 2016. A system-level fault detection and diagnosis method for low delta-T syndrome in the complex HVAC systems. Applied Energy 164:1028–38. doi:10.1016/j.apenergy.2015.02.025
- Gao, D.-c., S. Wang, Y. Sun, and F. Xiao. 2012. Diagnosis of the low temperature difference syndrome in the chilled water system of a super high-rise building: A case study. Applied Energy 98:597–606. doi:10.1016/j.apenergy.2012.03.057
- Gao, D.-c., S. Wang, and K. Shan. 2016. In-situ implementation and evaluation of an online robust pump speed control strategy for avoiding low delta-T syndrome in complex chilled water systems of high-rise buildings. Applied Energy 171:541–54. doi:10.1016/j.apenergy.2016.03.077
- Göteborg Energi AB. 2021. Lokala Anvisningar För Fjärrkyla.
- Guelpa, E., and V. Verda. 2020. Automatic fouling detection in district heating substations: Methodology and tests. Applied Energy 258 (February 2019):114059. doi:10.1016/j.apenergy.2019.114059
- Gustafsson, J., and F. Sandin. 2015. District heating monitoring and control systems. Advanced district heating and cooling (DHC) systems. Luleå, Sweden: Elsevier Ltd. doi:10.1016/B978-1-78242-374-4.00012-4
- IEA. 2018. The future of cooling: Opportunities for energy-efficient air conditioning. Paris: IEA. doi:10.1787/9789264301993-en
- Incropera, F. P., D. P. Dewitt, T. L. Bergman, and A. S. Lavine. 2007. Fundamentals of heat and mass transfer. 6th ed. Hoboken, NJ: John Wiley & Sons, Inc.
- Jangsten, M. 2020. Gothenburg district cooling system - An evaluation of the system performance based on operational data. Licentiate Thesis, Chalmers University of Technology.
- Jangsten, M., P. Filipsson, T. Lindholm, and J.-O. Dalenbäck. 2020. High temperature district cooling: Challenges and possibilities based on an existing district cooling system and its connected buildings. Energy 199 (May):117407. doi:10.1016/j.energy.2020.117407
- Jangsten, M., T. Lindholm, and J. O. Dalenbäck. 2020. Analysis of operational data from a district cooling system and its connected buildings. Energy 203:117844. doi:10.1016/j.energy.2020.117844
- Jangsten, M., T. Lindholm, and J. O. Dalenbäck. 2021. Field test of active night cooling supplied by district cooling in three commercial buildings. E3S Web of Conferences. Vol. 246. doi:10.1051/e3sconf/202124611004
- Jangsten, M., T. Lindholm, and J. O. Dalenbäck. 2022. District cooling substation design and control to achieve high return temperatures. Chalmers University of Technology - Division of Building Services Engineering [Manuscript submitted for publication]. doi:https://dx.doi.org/10.2139/ssrn.3999151
- Kiluk, S. 2014. Dynamic classification system in large-scale supervision of energy efficiency in buildings. Applied Energy 132:1–14. doi:10.1016/j.apenergy.2014.06.054
- Kiluk, S. 2012. Algorithmic acquisition of diagnostic patterns in district heating billing system. Applied Energy 91 (1):146–55. doi:10.1016/j.apenergy.2011.09.023
- Kiluk, S. 2017. Diagnostic information system dynamics in the evaluation of machine learning algorithms for the supervision of energy efficiency of district heating-supplied buildings. Energy Conversion and Management 150:904–13. doi:10.1016/j.enconman.2017.05.006
- Lee, T., S. Yoon, and K. Won. 2022. Delta-T-based operational signatures for operation pattern and fault diagnosis of building energy systems. Energy and Buildings 257:111769. doi:10.1016/j.enbuild.2021.111769
- Li, G., Y. Hu, J. Liu, X. Fang, and J. Kang. 2021. Review on fault detection and diagnosis feature engineering in building heating, ventilation, air conditioning and refrigeration systems. IEEE Access 9:2153–87. doi:10.1109/ACCESS.2020.3040980
- Li, M., W. Deng, K. Xiahou, T. Ji, and Q. Wu. 2020. A data-driven method for fault detection and isolation of the integrated energy-based district heating system. IEEE Access 8:23787–801. doi:10.1109/ACCESS.2020.2970273
- Li, Y., and Z. O’Neill. 2018. A critical review of fault modeling of HVAC systems in buildings. Building Simulation 11 (5):953–75. doi:10.1007/s12273-018-0458-4
- Liang, J., and R. Du. 2007. Model-based fault detection and diagnosis of HVAC systems using support vector machine method. International Journal of Refrigeration 30 (6):1104–14. doi:10.1016/j.ijrefrig.2006.12.012
- Lin, X., Z. Tian, Y. Lu, J. Niu, and Y. Cao. 2022. An energy performance assessment method for district heating substations based on energy disaggregation. Energy and Buildings 255:111615. doi:10.1016/j.enbuild.2021.111615
- Lu, Y., Z. Tian, P. Peng, J. Niu, and J. Dai. 2019. Identification and evaluation of operation regulation strategies in district heating substations based on an unsupervised data mining method. Energy and Buildings 202:109324. doi:10.1016/j.enbuild.2019.07.041
- Luo, X. J., K. F. Fong, Y. J. Sun, and M. K. Leung. 2019. Development of clustering-based sensor fault detection and diagnosis strategy for chilled water system. Energy and Buildings 186:17–36. doi:10.1016/j.enbuild.2019.01.006
- Månsson, S., K. Davidsson, P. Lauenburg, and M. Thern. 2018. Automated statistical methods for fault detection in district heating customer installations. Energies 12 (1):113–8. doi:10.3390/en12010113
- Månsson, S., P. O. J. Kallioniemi, K. Sernhed, and M. Thern. 2018. A machine learning approach to fault detection in district heating substations. Energy Procedia 149:226–35. doi:10.1016/j.egypro.2018.08.187
- Månsson, S., P. O. J. Kallioniemi, M. Thern, T. Van Oevelen, and K. Sernhed. 2019. Faults in district heating customer installations and ways to approach them: Experiences from Swedish utilities. Energy 180:163–74. doi:10.1016/j.energy.2019.04.220
- Månsson, S., I. L. Benzi, M. Thern, R. Salenbien, K. Sernhed, and P.-O J. Kallioniemi. 2021. A taxonomy for labeling deviations in district heating customer data. Smart Energy 2:100020. doi:10.1016/j.segy.2021.100020
- Månsson, S., M. Thern, P.-o. J. Kallioniemi, and K. Sernhed. 2021. A fault handling process for faults in district heating customer installations. Energies 14 (11):3169. doi:10.3390/en14113169
- McIntosh, I. 1999. A model-based fault detection and diagnosis methodology for HVAC subsystems. University of Wisconsin.
- Miller, C., Z. Nagy, and A. Schlueter. 2018. A review of unsupervised statistical learning and visual analytics techniques applied to performance analysis of non-residential buildings. Renewable and Sustainable Energy Reviews 81 (May 2017):1365–77. doi:10.1016/j.rser.2017.05.124
- Mirnaghi Sadat, M., and F. Haghighat. 2020. Fault detection and diagnosis of large-scale HVAC systems in buildings using data-driven methods: A comprehensive review. Energy and Buildings 229:110492. doi:10.1016/j.enbuild.2020.110492
- Namburu, S. M., M. S. Azam, J. Luo, K. Choi, and K. R. Pattipati. 2007. Data-driven modeling, fault diagnosis and optimal sensor selection for HVAC chillers. IEEE Transactions on Automation Science and Engineering 4 (3):469–73. doi:10.1109/TASE.2006.888053
- Ntakolia, C., A. Anagnostis, S. Moustakidis, and N. Karcanias. 2022. Machine learning applied on the district heating and cooling sector: A review. Energy Systems 13 (1):1–30. doi:10.1007/s12667-020-00405-9
- Pakanen, J., J. Hyvärinen, J. Kuismin, and M. Ahonen. 1996. Fault diagnosis methods for district heating substations. Oulu, Finland: VTT.
- Petersson, S., and C. Dahlberg-Larsson. 2013. Samband Mellan Flödespremie Och Returtemperatur. Svensk Fjärrvärme AB.
- Renström, J., J. Johnsson, and K. Ludvig. 2021. Kartläggning Av Kylamarknaden. Värmemarknad Sverige, no. December.
- Thuillard, M., F. Reider, and G. P. Henze. 2014. Energy efficiency strategies for hydronic systems through intelligent actuators. In 2014 ASHRAE Winter Conference, 1–8.
- Verhelst, J., G. Van Ham, D. Saelens, and L. Helsen. 2017. Model selection for continuous commissioning of HVAC-systems in office buildings: A review. Renewable and Sustainable Energy Reviews 76 (March):673–86. doi:10.1016/j.rser.2017.01.119
- Walletun, H., and J. Johnsson. 2005. Grundläggande Faktorer För Lyckosamma Avkylningsprojekt. Svensk Fjärrvärme AB.
- Wang, P., R. X. Gao, and Z. Fan. 2015. Switching local search particle filtering for heat exchanger degradation prognosis. Conference Record - IEEE Instrumentation and Measurement Technology Conference, 2015-July: 539–44. doi:10.1109/I2MTC.2015.7151325
- Wang, P., and R. X. Gao. 2017. Automated performance tracking for heat exchangers in HVAC. IEEE Transactions on Automation Science and Engineering 14 (2):1–12.
- Wang, S., and J. Cui. 2005. Sensor-fault detection, diagnosis and estimation for centrifugal chiller systems using principal-component analysis method. Applied Energy 82 (3):197–213. doi:10.1016/j.apenergy.2004.11.002
- Wang, S., Q. Zhou, and F. Xiao. 2010. A system-level fault detection and diagnosis strategy for HVAC systems involving sensor faults. Energy and Buildings 42 (4):477–90. doi:10.1016/j.enbuild.2009.10.017
- Xue, P., Z. Zhou, X. Fang, X. Chen, L. Liu, Y. Liu, and J. Liu. 2017. Fault detection and operation optimization in district heating substations based on data mining techniques. Applied Energy 205 (73):926–40. doi:10.1016/j.apenergy.2017.08.035
- Yu, Y., D. Woradechjumroen, and D. Yu. 2014. A review of fault detection and diagnosis methodologies on air-handling units. Energy and Buildings 82:550–62. doi:10.1016/j.enbuild.2014.06.042
- Zhang, F., and H. Fleyeh. 2020. Anomaly detection of heat energy usage in district heating substations using LSTM based variational autoencoder combined with physical model. In 2020 15th IEEE Conference on Industrial Electronics and Applications (ICIEA), 153–58. doi:10.1109/ICIEA48937.2020.9248108.
- Zhang, R., and T. Hong. 2017. Modeling of HVAC operational faults in building performance simulation. Applied Energy 202:178–88. doi:10.1016/j.apenergy.2017.05.153
- Zhao, X., M. Yang, and H. Li. 2014. Field implementation and evaluation of a decoupling-based fault detection and diagnostic method for chillers. Energy and Buildings 72:419–30. doi:10.1016/j.enbuild.2014.01.003
- Zhao, Y., T. Li, X. Zhang, and C. Zhang. 2019. Artificial intelligence-based fault detection and diagnosis methods for building energy systems: Advantages, challenges and the future. Renewable and Sustainable Energy Reviews 109 (April):85–101. doi:10.1016/j.rser.2019.04.021
- Zhao, Y., S. Wang, and F. Xiao. 2013a. A statistical fault detection and diagnosis method for centrifugal chillers based on exponentially-weighted moving average control charts and support vector regression. Applied Thermal Engineering 51 (1–2):560–72. doi:10.1016/j.applthermaleng.2012.09.030
- Zhao, Y., S. Wang, and F. Xiao. 2013b. A system-level incipient fault-detection method for HVAC systems. HVAC and R Research 19 (5):593–601. doi:10.1080/10789669.2013.789371
- Zhao, Y., F. Xiao, and S. Wang. 2013. An intelligent chiller fault detection and diagnosis methodology using Bayesian belief network. Energy and Buildings 57:278–88. doi:10.1016/j.enbuild.2012.11.007
- Zhou, Q., S. Wang, and Z. Ma. 2009. A model-based fault detection and diagnosis strategy for HVAC systems. International Journal of Energy Research 33 (10):903–18. doi:10.1002/er
- Zimmerman, N., E. Dahlquist, and K. Kyprianidis. 2017. Towards on-line fault detection and diagnostics in district heating systems. Energy Procedia 105:1960–6. doi:10.1016/j.egypro.2017.03.567
- Zinko, H., L. Hoon, K. Bong-Kyun, K. Youn-Hong, H. Lindkvist, A. Loewen, H. Walletun, and M. Wigbels. 2005. IEA-DHC-project: Improvement of operational temperature differences in district heating systems. Sittard, The Netherlands. http://www.verenum.ch/Dokumente/2005_IEA_ImprovementDT.pdf.