
 ?Mathematical formulae have been encoded as MathML and are displayed in this HTML version using MathJax in order to improve their display. Uncheck the box to turn MathJax off. This feature requires Javascript. Click on a formula to zoom.
Abstract
The groundwater heat pump (GWHP) system at Lena terrasse in Melhus, Norway has suffered from clogging by iron oxide incrustations, sediment deposits, organic slimes and gas entrapment. This has necessitated annual rehabilitations of the injection well and heat exchanger, and questioned how the submersible pump should be regulated to maximize the seasonal performance factor (SPF = heat output/power input) and reduce the clogging risk. The submersible pump operates with variable speed drive to yield groundwater pumping rates (Q) between 4 and 16 l/s. The GWHP system has been continuously monitored by pressure, temperature, flowmeter and energy meter sensors for 2.5 years, and with semimonthly step-discharge tests. During three step-discharge tests hydrochemistry and suspended solids content were also measured. Monitoring data show that the monthly performance factor (SPFM) is negatively correlated with Q. At Q > 12-13 l/s, suspended solids concentrations increase. Heat exchanger clogging rates increase at Q < 6 l/s. Hydrochemistry is stable, regardless of pumping rate. All clogging rates appear to be independent of pumping rate in the range 6-12 l/s. Therefore, pumping rates are advised to be kept between 6-12 l/s, and minimized but adjusted to the heating demand to avoid freezing of the groundwater.
Introduction
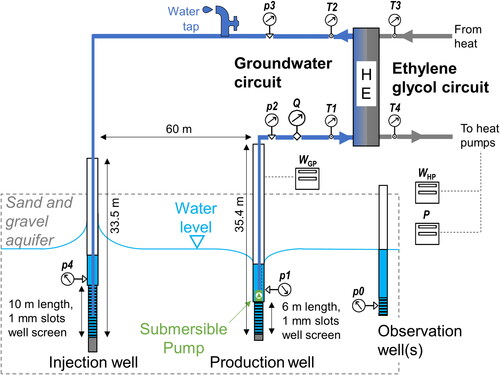
Groundwater heat pump (GWHP) systems use aquifers as their heat sources and/or sinks. The aquifer loop includes extraction, heat exchange and re-injection of groundwater, see . GWHP systems utilize convection of heat stored in the groundwater, which is more effective than the predominantly conductive heat transfer of conventional closed-loop ground source heat pump energy wells. This makes GWHP systems favorable in areas with permeable aquifers of sufficient size and temperature to cover the design heating and/or cooling load (Banks Citation2012). In Norway, this is typically found in unconsolidated, (glacio)fluvial sand and gravel aquifers (Gaut and Ellingsen Citation1992).
Fig. 1. Conceptual groundwater heat pump (GWHP) system design in Melhus, Norway. HE = heat exchanger. System monitoring of p = pressure, T = temperature, P = heat output, W = power input, Q = groundwater pumping rate is displayed (modified from Gjengedal et al. Citation2021).
On the downside, groundwater contains dissolved and suspended substances of both organic and inorganic origin that may precipitate, deposit or degas to clog GWHP systems. Clogging occurs in well screens, pump inlets, heat exchangers etc., and increases the pumping costs and reduces the heat transfer capacity of the system. Costly rehabilitations or even reconstruction measures are required to remediate the clogging issues. This impedes the systems’ economical profitability (Jenne, Andersson, and Willemsen Citation1992; Bakema Citation2001; Eggen and Vangsnes Citation2005; Banks Citation2012; Gjengedal et al. Citation2020).
The operation of the submersible groundwater pump is a key aspect with respect to the heat performance and clogging risk, both influencing the system economy. Firstly, pumping power consumption (WGP) and costs, increase with groundwater pumping rate (Q) (as quoted in Çengel and Cimbala Citation2010)
(1)
(1)
where is the water density,
is the gravitational acceleration,
is pumping head and
is the submersible pump efficiency. Q also influences the groundwater temperature change ΔTgw in the heat exchanger for a set heat exchange rate PHE (as quoted in Banks Citation2012):
(2)
(2)
where is the specific heat capacity of water (= 4182 J/kg/°C). In heating mode, a too low Q may reduce the groundwater temperature below water’s freezing point, which would be detrimental to the GWHP system. Conversely, a higher pumping rate Q will lower ΔTgw, and increase the evaporation temperature of the heat pump. This means the required compressor power consumption (
), which is needed to lift the temperature of the heat pump’s working fluid to the level required by the heat distribution system, will be reduced.
will be converted to heat (PHP) which can be utilized by the heat distribution system (Stene Citation2001). The groundwater pumping rate Q is therefore a fit parameter to maximize the seasonal performance factor SPF. SPF is the time integrated GWHP coefficient of performance (COPGWHP) over a period Δt = t2 – t1 (modified from equation as quoted in Banks Citation2012):
(3)
(3)
where Δt is typically one year and is the pump power consumption of the secondary circuit fluid between the heat exchanger and the heat pump (i.e., the ethylene glycol circuit in ).
Optimum submersible pump operation to avoid clogging depends on the clogging type (Pérez-Paricio and Carrera Citation1998; Bakema Citation2001; Houben and Treskatis Citation2007; Kerner Citation2011; Martin Citation2013; Stuyfzand and Osma Citation2019; Banks and Birks Citation2020):
High groundwater flow rates in and around the GWHP system increase the nutrient supply rate (Huisman and Olsthoorn Citation1983 as quoted in Houben and Treskatis Citation2007) and erosion of sediments in the aquifer formation outside the well screen (Bakema Citation2001). This facilitates biological (i.e., biofilms) and mechanical clogging (i.e., sediment deposits), respectively. The eroded and transported sediments may deposit and clog production wells (van Beek, Breedveld, and Stuyfzand Citation2009), heat exchangers (Kerner Citation2011) and injection wells (Olsthoorn Citation1982). Filter pack erosion is sought avoided by not exceeding a critical entrance velocity through the production well screen vcrit (= Q/Aeff, where Aeff is the perforated screen area). The vcrit is much debated, with typical empirical guideline values ranging from 3 cm/s (Driscoll Citation1986) to 0.6-1.2 m/s (Williams Citation1985).
Chemical clogging by iron oxide incrustations are typically triggered by mixing of shallow, oxygen-rich and deep, iron-rich groundwater in production wells (van Beek Citation1989). The mixing can be amplified by frequently switching on and off the pump. Therefore, iron oxide clogged well systems are advised to operate at constant pumping rates to reduce the mixing effect (van Beek, Breedveld, and Stuyfzand Citation2009). The increasing turbulence from higher flow rates (i.e., higher Reynolds numbers) have been shown to kinetically accelerate the precipitation of calcite (Zeppenfeld Citation2005) and iron oxide (Du et al. Citation2018) in laboratory experiments. This may explain why production well filters have been observed to be more heavily incrusted in sections of higher inflow velocities (Houben Citation2006).
Low pumping rates could be problematic for the heat exchanger. The wall shear stress () of a plate heat exchanger is advised to be high, to avoid sedimentation of fine particles and biofilms (Novak Citation1982, Citation1983; Kerner Citation2011):
(4)
(4)
where is the heat exchanger pressure drop,
is the hydraulic mean diameter of the heat exchanger channels and L is the effective plate length.
increases with Q. Thus, the wall shear stress criterion can be met by increasing the pumping rate Q.
Low pressures, especially vacuum pressures, may induce gas in-leakage through improperly sealed pipes or degassing of dissolved gases (i.e., gas clogging). Therefore, vacuum pressures are sought avoided in groundwater well systems. Pipe overpressure is achieved by either (1) narrowing or constricting the end of the injection pipe or (2) increasing the flow rate (Olsthoorn Citation1982).
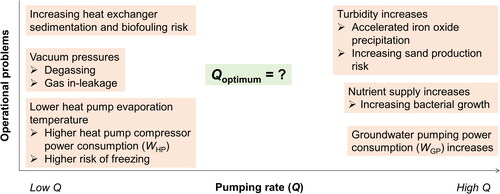
The pros and cons of high vs. low groundwater pumping rates are summarized in .
Fig. 2. Operational problems of GWHP systems related to low and high groundwater pumping rates (Q).
The Lena terrasse GWHP system, located in a glaciofluvial aquifer in Melhus, Mid-Norway, is one of the most thoroughly investigated and monitored GWHP systems in Norway (Riise Citation2015; Gjengedal et al. Citation2021; Stenvik et al. Citation2022a; Stenvik et al. Citation2022b). The current GWHP system started its operation in 2015, and supplies floor heating and hot water to 119 apartments at a capacity of 350 kW. Lena terrasse’s submersible pump is regulated with variable speed drive (VSD) capable to deliver 4-16 l/s of groundwater. The current regulation strategy seeks to lower the pumping rate, but limit freezing and the risk of vacuum pressures. The groundwater temperature is reduced from 6-7 °C (natural aquifer temperature) to 2-5 °C in the heat exchanger, with temperature reduction depending on the heat demand. The GWHP system has been demonstrated to suffer from various clogging issues, including iron oxides, sediments, biofouling, and gas entrapment, especially in the heat exchanger and injection well (Riise Citation2015; Stenvik et al. Citation2022a, Citation2022b).
System monitoring and water quality data retrieved from the Lena terrasse GWHP system facilitates optimizing the submersible groundwater pump regulation with regards to clogging prevention and SPF maximation (Equationeq. 3(3)
(3) ).
Materials and methods
The monitoring scheme at Lena terrasse’s GWHP system includes flowmeter measurements of groundwater flow rate (Q), pressure measurements in the production well (p1), before (p2) and after (p3) the heat exchanger, and in the injection well (p4), power consumption of the submersible groundwater pump (WGP) and heat pump compressor (), and heat delivered from the heat pump to the heat distribution system (
), see . This facilitated calculation of the monthly performance factor (SPFM) (Equationeq. 3
(3)
(3) ), assuming
was negligible, and analyzing how it links with groundwater pumping rate (Q) and the delivered heat (
).
Clogging increases the flow resistance. Therefore, step-discharge tests were used to assess the hydraulic performance of the production well, injection well, heat exchanger and submersible pump at different pumping rates Q. The tests were carried out semimonthly in the period August 2019-April 2022, according to a procedure described in detail in Gjengedal et al. (Citation2021). The procedure comprised operating the submersible pump at four or more speeds (i.e., steps) in set time intervals, while system performance parameters (p1-4, Q, WGP) were monitored. Typically, each step lasted 15 minutes (i.e., until steady state conditions were reached). The measured pressure and Q data were fitted to the equation (Jacob Citation1947 as quoted in Kruseman, de Ridder, and Verweij Citation1990)
(5)
(5)
where is the pressure drop or drawdown over i = production well filter (p1-p0), injection well filter (p4-p0) or heat exchanger (p3-p2), and Bi and Ci are the linear and non-linear loss coefficients, respectively. Higher Bi and Ci values correspond to more hydraulic resistance (i.e., clogging). Water level measurements from nearby observation wells were used as proxies for the natural water level (p0) in the production and injection wells (i.e., when Q = 0), see . Generally, good fits between data and Equationeq. 5
(5)
(5) were achieved for the production well, injection well and heat exchanger (R2 > 0.99).
Combining Equationeq. 1(1)
(1) with Equationeq. 5
(5)
(5) for the whole GWHP system, and defining pumping head
as the sum of all dynamic (
) and static losses (
) (i.e., due to elevation differences), yields
(6)
(6)
where and
are the cumulative linear and non-linear loss coefficients for the whole GWHP system, respectively.
and Q data measured during step-discharge tests were fitted to Equationeq. 6
(6)
(6) . After each step-discharge analysis,
(Equationeq. 5
(5)
(5) ) and
(Equationeq. 6
(6)
(6) ) were calculated for Q = 8 l/s, to keep a Q-referenced clogging record with time. Q = 8 l/s approximately represents the average pumping rate during the last two years of measurement.
During the measurement period, there were several rehabilitation actions in the heat exchanger and injection well. The injection well filter was rehabilitated by a combined hydraulic and thermal technique, developed by Hilmo and Gurigard (Citation2017). The technique comprised pouring hot water (100 °C, 30 l/min) into the well for ≥ 12 hours, before performing sectional filter cleaning with an airlift aerator. The heat exchanger was “cleaned in place” (CIP) by Øwre-Johnsen AS with their own mixture of citric acid and a complexing agent (“Bio Gen Active”). The rehabilitation chemicals were circulated through the heat exchanger at elevated temperature (
50 °C). Additionally, flow reversal through the heat exchanger were carried out three times during autumn-winter 2021/2022 for preventive maintenance. The flow reversal comprised reversing the flow through the heat exchanger and discharging it to the local stormwater system for
2 hours, without increasing the Q.
The correlation between pumping rate Q and clogging risk, was further assessed by measuring how the groundwater quality changed during step-discharge tests. The measurements were facilitated through a water tap installed right after the heat exchanger in the groundwater circuit, see .
Hydrochemistry was measured during one step-discharge test by a combination of field measurements and water samples, according to a procedure described in Stenvik et al. (Citation2022b). Field measurements comprised continuous measurements with electrodes (e.g., dissolved oxygen (WTW FDO 925) and electric conductivity (WTW TetraCon 925/C) sensors) submerged in a flow-through cell leading water from the above-mentioned water tap. Water samples were filtered (0.45 µm) and acidified (65% HNO3) in the field, and analyzed for major cations by ICP-MS (Thermo Scientific Element 2 - ICP-HR-MS) in the laboratory at the Department of Chemistry, NTNU, Trondheim, Norway.
The suspended solids concentration of the abstracted groundwater was measured during two step-discharge tests. The procedure comprised sampling groundwater three times during each step of the step-discharge test, and analyzing the water samples in the laboratory with a turbidity meter (WTW Turb® 430 T) and by manual particle counting. The turbidity analyses were carried out the same day as the sampling, to reduce the influence of chemical reactions (e.g., oxidation of iron) on turbidity. Particle counting of suspended solids which had settled in the water sample containers was carried out manually by visual inspection after the turbidity measurements.
Results
Heat performance data
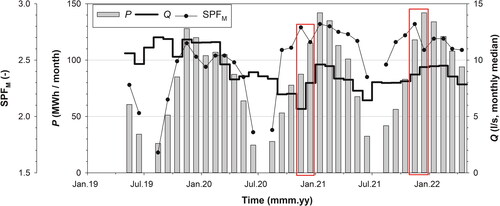
Heat performance data are presented in . The system SPFM correlates well with the delivered heat (P). Exceptions are found in the periods when the groundwater pumping rate Q does not positively correlate with P (delimited with red lines). In these periods the SPFM decreases with increasing Q. This trend is further confirmed when comparing the winter season 2019/2020 with the winters 2020/2021 and 2021/2022. The SPFM was much higher during the last two winters when the pumping rates Q generally were lower than during the winter season 2019/2020. This shows that the effect of increasing submersible pump work is more pronounced than the effect of decreasing heat pump compressor work, as the groundwater pumping rate and heat pump evaporation temperature increases concurrently.
Fig. 3. Heat performance data from Lena terrasse GWHP system between May 2019 and April 2022. Red outline = data periods when changes in SPFM do not positively correlate with delivered heat. P = delivered heat from heat pump, SPFM = monthly performance factor (Equationeq. 3(3)
(3) ), Q = average groundwater pumping rate.
Step-discharge tests
Summary of the step-discharge tests between August 2019 and April 2022 are displayed in . Results represent pressure drop or drawdown Δpi (in meter water column at Q = 8 l/s) in extraction and injection well filters and heat exchanger, and pumping power demand (in kW at Q = 8 l/s) of the submersible pump.
Fig. 4. Hydraulic performance of production well (a), injection well (b), heat exchanger (c) and submersible groundwater pump (d) between August 2019 and April 2022. Data points are calculated from step-discharge test results (Bi- and Ci-values) to the reference groundwater pumping rate Q = 8 l/s (Equationeq. 5(5)
(5) and Equation6
(6)
(6) ). Δpi = pressure drop/drawdown, WGP = submersible pump power consumption, rehab. = rehabilitation.
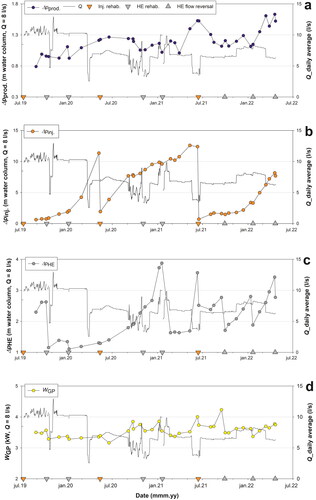
Different clogging trends are observed for the production and injection well, heat exchanger and submersible pump. The production well drawdown was relatively stable during the measurement period, indicating little or no clogging (). The heat exchanger and injection well suffer from severe clogging problems, necessitating semiannual rehabilitations ( and ). The pressure build-up accelerated some time after the rehabilitations for both the heat exchanger and the injection well. The pumping power demand (WGP) was relatively stable, indicating sparse clogging of the pump inlet, and correlated with the heat exchanger clogging ( and ). This is because the pump only lifts the water up to the heat exchanger, from which it is “cascaded” down through the injection well (Stenvik et al. Citation2022a).
The rehabilitation and maintenance actions in the heat exchanger and injection well achieved varying degrees of success. For instance, the injection well rehabilitation in May 2020 was less efficient than the ones in 2019 and 2021. The pressure also increased more rapidly after the well cleaning in 2020, although well rehabilitations were needed within approximately one year after the more successful cleanings in 2019 and 2021. The varying degree of success of heat exchanger rehabilitations can be ascribed to testing of a different chemical blend (January 2020) and to leaky valves (November 2020). The flow reversal had a pronounced effect on the pressure drop through the heat exchanger, which decreased 1 m (at Q = 8 l/s) after the maintenance actions (). This indicates that the clogging material was partly made up of loose particles, which could be easily removed without rinsing chemicals. Consequently, the annual heat exchanger cleaning was deemed unnecessary before/during the heating season 2021/2022. However, the effectiveness of the flow reversals appeared to decrease with time, which led to a gradual pressure build-up during winter/spring 2021/2022.
Water quality
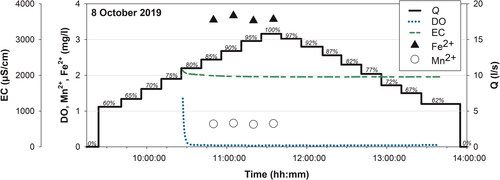
The hydrochemistry of the abstracted water did not change significantly during the extended step-discharge test displayed in . The dissolved oxygen (DO) and electric conductivity (EC) sensors appeared to require some time initially to stabilize, but displayed little variation after that (DO ≤ 0.05 mg/l; 1950 < EC < 2000 µS/cm). The four water samples were almost constant in dissolved iron (3.53-3.67 mg/l) and manganese (0.63-0.66 mg/l).
Fig. 5. Hydrochemistry measurements during a prolonged step-discharge test 8 October 2019. Q = groundwater pumping rate, DO = dissolved oxygen, EC = electrical conductivity, Fe2+ = dissolved iron, Mn2+ = dissolved manganese. Percentages refer to pumping frequency relative to the maximum.
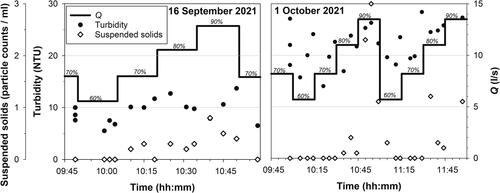
The concentration of suspended solids increased with pumping rate. displays turbidity measurements and particle counting of water samples taken during two step-discharge tests. The particle counts showed a marked increase at 90% pumping rate (i.e., Q = 12.9-13.5 l/s).
Turbidity trends were harder to identify during the step-discharge tests (). The turbidity varied considerably both during and between the two step-discharge tests. This is probably due to analytical errors, with inevitable contact with oxygen during sampling and too long storage periods (i.e., a few hours) before analysis. This may have facilitated oxidation and precipitation of the initially dissolved iron. Thus, turbidity measurements performed in laboratory does not seem like a reliable method to determine suspended solids loading.
Fig. 6. Turbidity and suspended solids (from manual particle counting) of water samples taken during two step discharge tests at Lena terrasse 16 September (left) and 1 October (right) 2021. Percentages refer to pumping frequency relative to the maximum.
Optimizing submersible pump regulation
SPFM data presented in indicates that the groundwater pumping rate should be kept as low as possible, but without freezing the groundwater or the secondary circuit fluid (Equationeq. 2(2)
(2) ) with regards to heat performance.
Differences in SPFM between winter (January-April) 2021 and 2022 may be related to clogging of the heat exchanger. The heat exchanger was less clogged in 2021, after the rehabilitation in January 2021 (). Clogging material is a less efficient heat conductor than the steel plates of the heat exchanger and will thus increase the temperature difference between the groundwater and secondary circuit fluid in the heat exchanger (Kerner Citation2011). This will lower the evaporation temperature of the heat pump and lower the heat pump’s coefficient of performance (COPHP) (Stene Citation2001). Temperature measurements on the in- and outlet of the groundwater and secondary circuit of the heat exchanger are therefore advised to monitor clogging (Kerner Citation2011). The temperature sensors T1-T4 () at Lena terrasse are inaccurate. Still, measurements at T4 (i.e., a proxy for the heat pump evaporation temperature) were lower in January-April 2022 (4.2 ± 0.7 °C) than the same period in 2021 (4.7 ± 0.8 °C), despite similar pumping rates Q and heat delivery P (). This underlines the importance of performing heat exchanger rehabilitation also from a heat performance point of view.
The effect of operating conditions (i.e., heat exchanger plate shear stress, ) on clogging rate (dΔpHE/dt) of the heat exchanger is shown in . Literature suggests that the clogging risk is larger at lower
(Novak Citation1982, Citation1983; Kerner Citation2011). This implies that the clogging rate (dΔpHE/dt) will decrease as the heat exchanger becomes more and more clogged, since
is proportional to ΔpHE (Equationeq. 4
(4)
(4) ). To account for this, the baseline shear stress
prior to clogging dΔpHE in the period dt = tn – tn-1, was calculated as (Equationeq. 4
(4)
(4) and Equation5
(5)
(5) )
(7)
(7)
where and
are the heat exchanger loss coefficients at time tn-1 and
is the median pumping rate in the period dt = tn – tn-1. The heat exchanger manufacturer provided values for
= 10.4 mm and L = 1384 mm.
was plotted versus dΔpHE/dt in the period dt = tn – tn-1.
The recommendations (Novak Citation1982, Citation1983; Kerner Citation2011) seem applicable for Lena terrasse’s heat exchanger, with the largest clogging rate observed when the operating conditions are “poor” (
< 25 Pa), see . This corresponds to an event in June 2021 when the pumping rate was kept constant and low (
5.6 l/s) over a long period (). Thus, keeping pumping rates Q ≥ 6 l/s seems reasonable when it comes to heat exchanger clogging.
Fig. 7. Operating conditions for heat exchanger (a) and injection well (b) versus clogging rate (dΔpi/dt) in the period dt = tn-tn-1. = background plate shear stress prior to clogging (Equationeq. 7
(7)
(7) ). Heat exchanger plate shear stress (
) categories (“bad”, “poor”, “good” and “excellent”) are from Novak (Citation1982, Citation1983) and Kerner (Citation2011). Qm = median pumping rate in the period (dt = tn-tn-1).
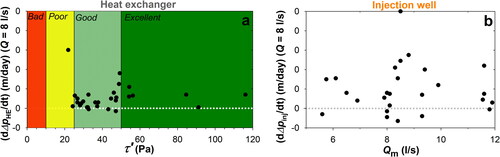
There are less obvious trends between the median pumping rate (Qm) for any period dt = tn – tn-1 and injection well clogging rate (dΔpinj/dt), see . According to Olsthoorn (Citation1982)
(8)
(8)
for an injection well suffering from mechanical clogging by sediment particles. This relationship is not observed between 5.6-11.9 l/s median pumping rates.
At higher pumping rates (Q > 12-13 l/s), the suspended solids concentrations of the extracted groundwater increase, see . Q = 12-13 l/s corresponds to entrance velocities ve in the range 1.26-1.37 cm/s through the 6 meter long 161 mm inner diameter production well screen with 31.3% perforation. This is well below typical literature values for vcrit ≥ 3 cm/s (Williams Citation1985; Driscoll Citation1986). However, ve = 1.26-1.37 cm/s are in the same range as critical groundwater flow velocities to mobilize adhesive, subsurface particles with d < 0.2 mm (Muckenthaler Citation1989). The production well filter was naturally developed after drilling in May 2014, and has measured consistently high non-linear loss coefficients (Cprod = 14285 ± 5636 s2/m5) in the measurement period (2019-2022). Some of the non-linear losses could be related to elevated flow velocities past the pump motor, caused by a too large submersible pump (OD = 139.5 mm) relative to the production well diameter (ID = 158 mm) (Gjengedal et al. Citation2021). However, high and stable C-values (≥ 1900 s2/m5) may also indicate improper well design (Walton Citation1962). Improper production well design (i.e., screen slot dimensions) or deficient well development could explain the observed suspended solids trends, and why critical velocities for aquifer matrices (Muckenthaler Citation1989) seem more applicable than customized production well threshold values (Williams Citation1985; Driscoll Citation1986).
Alternatively, some of the suspended solids could stem from corrosion of the production well steel, accelerated by the saline water quality (EC = 1950-2000 µS/cm, see ). Regardless of the cause, higher suspended solids loading would increase the injection well’s mechanical clogging risk. Despite sparse suspended solids monitoring, pumping rates should be kept ≤ 12 l/s, at least until a decrease in suspended solids loadings has been documented.
The clogging rate of both heat exchanger and injection well seems to be dependent on time since last rehabilitation ( and ). Increasing clogging rate with time could correspond to the oxidation of iron. Oxidation of iron will usually accelerate with time due to the self-catalytic effect of iron oxides on oxidation of iron (Tamura, Goto, and Nagayama Citation1976). Especially, the kinetics will speed up if the iron oxide surfaces inhabit iron-oxidizing bacteria (IOB), gaining energy solely or partly from oxidation of iron (Houben and Treskatis Citation2007). The observation of high dissolved iron concentrations, iron oxide incrustations and specialized IOB at Lena terrasse (Stenvik et al. Citation2022b) backs up the hypothesis of iron oxides causing the observed clogging acceleration. van Beek, Breedveld, and Stuyfzand (Citation2009) advice pumping production wells suffering from iron oxide clogging continuously (i.e., not on/off or with variable speed drive) to restrict mixing of vertical redox zones. Furthermore, increasing pumping rates during step-discharge tests lead to larger water table drawdowns. Consequently, the flow toward the well filter becomes more vertically oriented, and more water entering from the shallow part of the aquifer would be expected (Kruseman, de Ridder, and Verweij Citation1990). It would thus have been expected to see changes in the hydrochemistry if the production well extracted water from different vertical redox and/or fresh-/saltwater zones. Since this does not occur in the Lena terrasse GWHP (), the vertical hydrochemical variation around the production well filter was deemed minimal, and changing the pumping rate seems unproblematic from a chemical mixing point of view. Still, the bacteria nutrition and turbulence generally increase with pumping rate, which both may speed up iron oxide encrustation. Consequently, operating the pump at variable but low pumping rates does seem appropriate with regards to iron oxide clogging.
It has been demonstrated that lower pumping rates also increases the risk of vacuum pressures in the groundwater circuit at Lena terrasse. However, it is economically more profitable to avoid vacuum pressures through design measures (e.g., constricting the flow in the injection pipe), instead of constantly operating the GWHP system at elevated pumping rates (Stenvik et al. Citation2022a).
Overall, operating the submersible pump at Lena terrasse at the lowest possible pumping rate between 6 and 12 l/s seems to be the optimum regulation strategy. Here, “possible” means “without freezing the groundwater or secondary circuit fluid”. Thus, the pumping rate should be adjusted according to the heating demand.
The effect of variable speed drive of the submersible pump on clogging rate is hard to determine from the Lena terrasse monitoring data. This is because the pumping rate mostly has been kept constant over longer periods. Still, comparison of Δpi before and after step-discharge tests shows that the injection well benefits while the heat exchanger is slightly impeded by the tests. These implications should be further investigated by performing and analyzing longer periods with a more variable pumping scheme.
Even with improved operation of the submersible pump, the heat exchanger and injection well are likely to require frequent rehabilitation measures. The ease of performing the flow reversal justifies adding it to the GWHP operating scheme. Although extending the longevity of rehabilitations, flow reversals cannot fully replace chemical CIP rinsing according to Müller-Steinhagen (Citation2010). The increasing pressure drop across the heat exchanger during winter 2021/2022 despite performing flow reversals testifies to this. Though, more frequent flow reversals may further extend the periods between rehabilitation actions.
The clogging develops rather rapidly in the heat exchanger, and especially the injection well, after rehabilitations. This indicates that not all iron oxides are removed during rehabilitations, which leaves self-catalytic surfaces “available” for rapid oxidation and precipitation of iron. It is recommended that rehabilitation of both the heat exchanger and the injection well are tested with a new chemical rinsing method, using the reducing agent natrium dithionite (Na2S2O4). This chemical has proven to be very effective in dissolving even mature iron oxides (Houben Citation2003), and could help to prolong the operational periods between rehabilitation actions.
Conclusions
From the presented investigations we conclude that:
The monthly performance factor (SPFM) for the groundwater heat pump (GWHP) system at Lena terrasse in Melhus, Norway is higher at lower pumping rates (Q).
The heat exchanger and injection well suffer from clogging. The heat exchanger clogging rate increases at Q < 6 l/s, while the suspended solids concentrations increase at Q > 12-13 l/s. The latter involves risk of mechanical clogging by sediments in the injection well. Clogging rate appears to be independent of the pumping rate in the range 6-12 l/s.
Hydrochemistry does not seem to change with pumping rate, indicating that vertical redox mixing does not accelerate if the pumping rate is varied.
The clogging rate of both the heat exchanger and the injection well increases with time after rehabilitation, resembling the self-catalytic effect of iron oxides on oxidation of iron. This matches previous studies which have revealed iron oxide incrustations in the same GWHP system.
It is advised that the Lena terrasse GWHP system operate the submersible groundwater pump in the range 6 ≤ Q ≤ 12 l/s. The pumping rate should be minimized, but be high enough to avoid freezing the groundwater or secondary circuit fluid, meaning Q should be adjusted to the heating demand.
Acknowledgments
This study was conducted as part of the research project Optimal Utilization of Groundwater for Heating and Cooling in Melhus 2 (ORMEL 2). This project is a cooperation between Melhus municipality, the Norwegian University of Science and Technology, Asplan Viak AS, the Geological Survey of Norway and Gjøvaag AS, receiving funding from the Regional Research Funds in Mid-Norway. We would like to thank all the involved institutions and persons for cooperation and financial support. A special thanks is directed to Gry Tangvik Amundsen, former janitor at Lena terrasse’s GWHP system, for always welcoming our field visits and for constructive discussions. Finally, the authors would like to thank the two reviewers for their constructive comments and feedback.
Disclosure statement
No potential conflict of interest was reported by the authors.
Data availability statement
The authors agree to share their research data. These will be made available at a Mendeley Data repository (reserved doi: 10.17632/pc69rcs94y.1).
Additional information
Funding
Notes on contributors
Lars A. Stenvik
Lars A. Stenvik, M.Sc, is a PhD candidate.
Randi K. Ramstad
Randi K. Ramstad, PhD, is an Associate Professor II.
Bjørn S. Frengstad
Bjørn S. Frengstad, PhD, is a Professor.
References
- Bakema, G. 2001. Well and borehole failures and solutions in underground thermal energy storage. 2/9805/GW. Arnhem, Netherlands: IF Technology.
- Banks, D. 2012. An introduction to thermogeology: Ground source heating and cooling. 2nd ed. Oxford: Wiley‐Blackwell.
- Banks, D., and D. Birks. 2020. Heat from the ground. Geoscientist 30 (2):12–7. doi:10.1144/geosci2020-070
- Çengel, Y. A., and J. M. Cimbala. 2010. Fluid mechanics: fundamentals and applications. 2nd ed. Boston: McGraw-Hill.
- Driscoll, F. G. 1986. Groundwater and wells. 2nd ed. St. Paul, MN: Johnson Division.
- Du, X., H. Zhang, X. Ye, and Y. Lu. 2018. Flow velocity effects on Fe(III) clogging during managed aquifer recharge using urban storm water. Water 10 (4):358. doi:10.3390/w10040358
- Eggen, G., and G. Vangsnes. 2005. Heat pump for district cooling and heating at Oslo airport, Gardermoen. In 8th IEA Heat Pump Conference 2005: global advances in heat pump technology, applications, and markets. Conference proceedings, ed. M. Axell. Borås: IEA Heat Pump Centre.
- Gaut, A., and K. Ellingsen. 1992. Grunnvannsmuligheter i Norge. GiN-veileder nr. 8 [Groundwater exploitation potential in Norway]. Trondheim, Norway: Skrifter 107, Geological Survey of Norway.
- Gjengedal, S., R. K. Ramstad, B. O. Hilmo, and B. S. Frengstad. 2020. Fouling and clogging surveillance in open loop GSHP systems: A systematic procedure for fouling and clogging detection in the whole groundwater circuit. Bulletin of Engineering Geology and the Environment 79 (1):69–82. doi:10.1007/s10064-019-01556-5
- Gjengedal, S., L. A. Stenvik, R. K. Ramstad, J. I. Ulfsnes, B. O. Hilmo, and B. S. Frengstad. 2021. Online remote-controlled and cost-effective fouling and clogging surveillance of a groundwater heat pump system. Bulletin of Engineering Geology and the Environment 80 (2):1063–72. doi:10.1007/s10064-020-01963-z
- Hilmo, B. O., and R. Gurigard. 2017. Rehabilitering av filterbrønner – erfaringer fra Norge [Rehabilitation of groundwater wells - experience from Norway]. Paper presented at Grundvattendagarna, Uppsala, Sweden, 7–8 November.
- Houben, G. 2003. Iron oxide incrustations in wells. Part 2: Chemical dissolution and modeling. Applied Geochemistry 18 (6):941–54. doi:10.1016/S0883-2927(02)00185-3
- Houben, G. 2006. The influence of well hydraulics on the spatial distribution of well incrustations. Ground Water 44 (5):668–75. doi: 10.1111/j.1745-6584.2006.00216.x.
- Houben, G., and C. Treskatis. 2007. Water well rehabilitation and reconstruction. New York: McGraw-Hill.
- Huisman, L., and T. N. Olsthoorn. 1983. Artificial groundwater recharge. Marshfield: Pitman Publishing Inc.
- Jacob, C. E. 1947. Drawdown test to determine effective radius of artesian well. Transactions of the American Society of Civil Engineers 112 (1):1047–64. doi:10.1061/TACEAT.0006033
- Jenne, E. A., O. Andersson, and A. Willemsen. 1992. Well, hydrology, and geochemistry problems encountered in ATES systems and their solutions. SAE Technical Paper 929153. Warrendale: SAE International.
- Kerner, J. 2011. Compact, high-efficiency heat exchangers: Understanding fouling. Chemical Engineering 118 (6):35–41.
- Kruseman, G. P., N. A. de Ridder, and J. M. Verweij. 1990. Analysis and evaluation of pumping test data. 2nd ed. Wageningen: International Institute for Land Reclamation and Improvement.
- Martin, R., ed. 2013. Clogging issues associated with managed aquifer recharge methods. Australia: IAH Commision on Managing Aquifer Recharge.
- Muckenthaler, P. 1989. Ergänzende Modellvorstellungen Für Erosions-Und Suffosion kriterien [Supplementary model presentations for erosion and suffosion criteria]. Wasserwirtschaft 79 (7/8):405–9.
- Müller-Steinhagen, H. 2010. C4 fouling of heat exchanger surfaces. In VDI heat atlas, ed. VDI-Gesellschaft Verfahrenstechnik und Chemieingenieurwesen. 2nd ed., 79–104. Berlin: Springer Berlin Heidelberg.
- Novak, L. 1982. Comparison of the Rhine River and the Öresund Sea water fouling and its removal by chlorination. Journal of Heat Transfer 104 (4):663–9. doi:10.1115/1.3245183
- Novak, L. 1983. Fouling in plate heat exchangers and its reduction by proper design. In Heat exchangers: Theory and practice, ed. J. Taborek, G. F. Hewitt, and N. Afgan, 871–83. Washington: Hemisphere Pub. Corp.
- Olsthoorn, T. N. 1982. The clogging rate of recharge wells, main subjects. KIWA-communications 72. Rijswijk, Netherlands: KIWA.
- Pérez-Paricio, A., and J. Carrera. 1998. Operational guidelines regarding clogging. In Artificial recharge of groundwater, ed. J. H. Peters, 441–5. London: CRC Press.
- Riise, M. H. 2015. Praktisk guide for grunnvarmeanlegg basert på oppumpet grunnvann [Practical guide for ground water heat pump systems]. Master thesis., Norwegian University of Science and Technology.
- Stene, J. 2001. Varmepumper: grunnleggende varmepumpeteknikk [Heat pumps: Engineering Basics]. STF84 A97302, SINTEF Energi, Klima- og kuldeteknikk, Trondheim, Norway.
- Stenvik, L. A., S. Gjengedal, R. K. Ramstad, and B. S. Frengstad. 2022a. How to avoid gas clogging in groundwater heat pump systems: A case study from the Lena terrasse system in Melhus, Norway. Bulletin of Engineering Geology and the Environment 81 (4):152. doi:10.1007/s10064-022-02652-9
- Stenvik, L. A., S. Gjengedal, R. K. Ramstad, and B. S. Frengstad. 2022b. Hydrochemical and biotic control on iron incrustations in groundwater heat pump systems: Case study from a saline, anoxic aquifer in Melhus, Norway. Geothermics 100:102349. doi:10.1016/j.geothermics.2022.102349
- Stuyfzand, P. J., and J. Osma. 2019. Clogging issues with aquifer storage and recovery of reclaimed water in the brackish werribee aquifer, Melbourne, Australia. Water (Basel) 11 (9):1807. doi:10.3390/w11091807
- Tamura, H., K. Goto, and M. Nagayama. 1976. The effect of ferric hydroxide on the oxygenation of ferrous ions in neutral solutions. Corrosion Science 16 (4):197–207. doi:10.1016/0010-938X(76)90046-9
- van Beek, C. G. E. M. 1989. Rehabilitation of clogged discharge wells in the Netherlands. Quarterly Journal of Engineering Geology 22 (1):75–80. doi:10.1144/GSL.QJEG.1989.022.01.06
- van Beek, C. G. E. M., R. Breedveld, and P. J. Stuyfzand. 2009. Preventing two types of well clogging. Journal - American Water Works Association 101 (4):125–34. doi:10.1002/j.1551-8833.2009.tb09880.x
- Walton, W. C. 1962. Selected analytical methods for well and aquifer evaluation. Bulletin 49, Illinois State Water Survey, Urbana, Illinois.
- Williams, D. E. 1985. Modern techniques in well design. Journal - American Water Works Association 77 (9):68–74. doi:10.1002/j.1551-8833.1985.tb05608.x
- Zeppenfeld, K. 2005. Untersuchungen über den Einfluss der Strömungsgeschwindigkeit auf die Kalkabscheidung aus calciumhaltigen Wässern [Studies of the effect of the flow velocity on calcium carbonate precipitation from water containing calcium]. Vom Wasser 103 (2):11–9.