
Abstract
Over half of commercial building floor area in the US is served by packaged rooftop units (RTUs). With a typical useful life in the 10-20 years range, RTU replacement is a periodic necessity in commercial buildings and an opportunity for upgrading to higher-efficiency units. We designed a package of energy efficiency measures that can be used in conjunction with an RTU replacement, including advanced controls, high-efficiency low pressure-drop air filters, energy monitoring and, optionally, window films and cool-roofs to reduce loads and size of the replacement RTUs. We conducted side-by-side laboratory testing of the package to evaluate energy savings and thermal comfort relative to an existing building baseline. Daily HVAC energy savings for the RTU replacement package averaged 61% across all seasons. The test data showed that the ASHRAE Guideline 36 controls significantly reduced thermal loads and this was a key contributor to the savings, in addition to the higher efficiency of the RTU itself. The laboratory testing also revealed some challenges with installation and commissioning of Guideline 36. Overall, the results demonstrate that significant savings can be realized in existing office buildings by incorporating relatively low-risk, proven measures in conjunction with an RTU replacement.
Introduction
Rooftop units in the U.S. building sector
Rooftop units (RTUs) are packaged HVAC systems that include cooling, heating, and air handling in one unitary device, as opposed to built-up central systems including chillers and boiler plants common in large buildings. Packaged HVAC systems such as RTUs are commonly used to condition buildings throughout the US, and over half of commercial building floor area is served by packaged HVAC (DOE Citation2017). Packaged equipment is responsible for annual primary energy usage of almost 4 quads of electricity and natural gas per year (Deru et al. Citation2021). In terms of number of installations, RTUs are the majority of HVAC systems in the US and are particularly common in the small to medium commercial sector, including one and two-story commercial buildings (Better Buildings n.d.).
Building design normally calls for sizing heating and cooling equipment to meet worst-case, or highest load, condition, though the equipment operates well below full capacity most of the time. High efficiency RTUs take advantage of variable speed controls for fan and compressor motors and/or staged compressor design to reduce energy for those common part-load operating hours. With a typical useful life in the 10-20 years range, RTU replacement is a periodic necessity in commercial buildings and an opportunity for upgrading to higher-efficiency units. However, high efficiency packaged equipment is still relatively uncommon, with the majority of units sold in the low-to-medium efficiency range. One study found 61–65% of packaged equipment shipped met only minimal efficiency requirements for code compliance (DOE Citation2015). This gap between installed packaged unit efficiency and higher-efficiency options represents a large energy savings potential nationally. Another study found that replacing minimally compliant packaged HVAC systems with the highest-efficiency options could save 3.1 quads of energy over 30 years (including small to very large packaged units) (Garbesi et al. Citation2011).
Motivation for integrated system packages for retrofits
Office buildings comprise 1.5 billion m2 (16 billion ft2) of floor area in the U.S. (EIA n.d.) with energy usage of 1.3 Exajoules (1241 TBtu) annually. Market studies for commercial offices identify large opportunities for energy savings from energy efficiency retrofits in these spaces (Amann Citation2017; Kwatra and Essig Citation2014; Nadel and Hinge Citation2020; Navigant Citation2014; Zhai, LeClaire, and Bendewald Citation2011; Granade et al. Citation2009), at 25%–50% energy savings potential per building (PNNL Citation2011; RMI n.d.; Regnier et al. Citation2018; Che et al. Citation2019).
However, energy efficiency retrofits, even with significant energy savings potential, still face adoption challenges in the market. Overall retrofit activity in the commercial sector is low, at 2.2% of floor area annually (Amann Citation2017). To help address the gap between retrofit potential and adoption, the U.S. Department of Energy (DOE) sponsored the Integrated Systems Packages (ISP) project, which developed a suite of retrofit packages optimized for implementation during routine real-estate life-cycle events like tenant fit-outs, renovations, and equipment replacements (Mathew et al. Citation2020). This approach has two advantages: (1) it minimizes additional disruption to occupants and business function beyond what is already happening due to the event; and (2) it improves the cost effectiveness of energy efficiency measures because some of the costs are borne by the base event itself, reducing the incremental cost for efficiency measures. While there are numerous publications, guides, and tools on how to implement energy efficiency in existing buildings, there appear to be very few publications that address energy efficiency in the context of real estate life-cycle events.
The intent of the ISP approach is to better align energy efficiency retrofits with real estate and portfolio management business processes, introducing packages with reduced transaction cost. The ISPs were designed to achieve at least 20% site energy savings and to be scalable and require minimal expertise and engineering. Packages are laboratory-tested to validate energy savings potential and de-risk the packages from the standpoint of potential implementors. Package development also includes field validation, and toolkits for standardizing and streamlining implementation, including template specifications, applicability checklists, and functional test procedures. For example, (Mathew et al. Citation2020) describe a package that can be applied with tenant fit-outs, with combined savings of 33–40% for HVAC, lighting and plug loads. This article presents a package of measures that can be applied with a rooftop unit replacement. We first describe the package, how it was developed, and simulation-based savings estimates. Next, we describe the methods used for validating the package with laboratory testing. Finally, we present and discuss the results of the laboratory testing.
The RTU replacement package
To determine a set of efficiency measures applicable to a commercial office RTU replacement project, we first developed an expansive list of relevant efficiency measures based on commercially available technologies. Measures were then screened for alignment with the scope of an RTU replacement; in other words, complimentary to an RTU upgrade and not interfering with or involving other building systems outside of the scope of such a project (lighting fixtures and controls, plug loads, interior shades, etc.). Complimentary measures chiefly involved HVAC controls upgrades at the time of RTU replacement and optional measures that might reduce HVAC load and allow for equipment downsizing. The strategic choice to group complimentary measures into one package is based on previous research showing that integrated approaches addressing multiple features, components, or end uses have the potential to achieve more savings than approaches targeting single technology retrofits (Regnier et al. Citation2018; Shackelford et al. Citation2020). Finally, measures were screened for the extent to which they could be standardized, excluding those that require significant customization.
lists the set of measures selected for the RTU retrofit package. Measures are categorized as “core” meaning they are mandatory package elements, and “optional” meaning measures that can be implemented with core elements for additional performance benefits.
Table 1. Core and optional measures in the RTU replacement package.
The most important core measure of the RTU replacement package is the high-efficiency RTU upgrade itself. Additional core measures include advanced efficient RTU controls, high-efficiency low pressure drop air filters, and energy monitoring. The HVAC sequences in the RTU replacement package specification draw heavily upon ASHRAE Guideline 36: High-Performance Sequences of Operation for HVAC Systems, which includes a detailed set of best-in-class control sequences (ASHRAE Citation2018). These cover zone sequences, demand-controlled ventilation, trim-and-respond for resetting supply air temperature and duct pressure, VAV minimum flow rate retuning (e.g., from 30% to 15%), and intermittent ventilation.Footnote1 High capacity, low-pressure drop filters avoid extra fan energy usage due to their greater surface area and thickness, for example using filters with a 4-inch depth instead of 2-inch depth. Finally, metering and performance monitoring allows for ongoing measurement and verification of energy performance. While metering does not save energy in and of itself, per se, several studies have shown that on-going energy monitoring and management enables savings and is critical to savings persistence (e.g., Granderson et al. 2020).
Along with those core measures, package options to broaden applicability and increase savings potential where feasible include window films and cool roofs (minimum emittance and solar reflectance requirements) that reduce solar heat gain to reduce the HVAC load served by the RTU, potentially allowing for smaller sizing of equipment. Also included as an optional measure for the RTU package are enthalpy recovery wheels, a class of energy recovery ventilators (ERVs) that exchange heat and humidity between the supply and exhaust air, salvage energy for use in building conditioning and reduce cooling in the summer and heating in winter. All of the individual core and optional measures are themselves generally proven, commercially available technologies and strategies.
For the RTU replacement package, the minimum efficiency levels are based on specifications developed by the Consortium for Energy Efficiency (CEE) High Efficiency Commercial Air Conditioning and Heat Pump (HECAC) Initiative (CEE Citation2018). The goal of the initiative is to promote high efficiency retrofits and new installations for commercial AC heat pump technologies in US and Canadian markets. The initiative’s primary activity in line with this goal is the development, maintenance, and support of common performance specifications for high efficiency AC and HP equipment (CEE Citation2019). The CEE HECAC specification includes cooling efficiency requirements in terms of energy efficiency ratio, or EER (cooling capacity in Btu/hr. per input wattage), as well as integrated EER (IEER), and seasonal EER (SEER), performance metrics that represent part load efficiency and efficiency through range of seasonal ambient conditions, respectively, to better characterize annual performance.Footnote2 For the RTU replacement package, equipment must meet or exceed Tier 2 performance from the CEE (Citation2019) specifications or Tier 1 performance for cases where no Tier 2 requirement is defined. The EER, IEER, and SEER minimum requirements in the CEE specification vary for different packaged equipment type (e.g., air-cooled or water-cooled unitary air conditioners with electric or gas heating, air cooled or water source unitary heat pumps, air cooled or water source variable refrigerant flow systems) and capacities, from < 65000 Btu/hr (5.4 tons) to over 760,000 Btu/hr (approximately 60 tons). For packaged heat pump air conditioning, minimum heating performance requirements are listed in coefficient of performance (COP) terms, ranging from 2.1 to 3.4 for air cooled units, depending on equipment size and outside air temperature.
Various resources have been developed to facilitate implementation of the RTU replacement package. These include an applicability checklist to help sites determine whether the RTU package is a good fit; specification templates with performance details for equipment, execution and sequences of operation; standardized test procedures intended to ensure at project commissioning that the package functions per the specification and project intent; and an operations and maintenance (O&M) manual template to support ongoing operation of the package.
Energy savings estimates
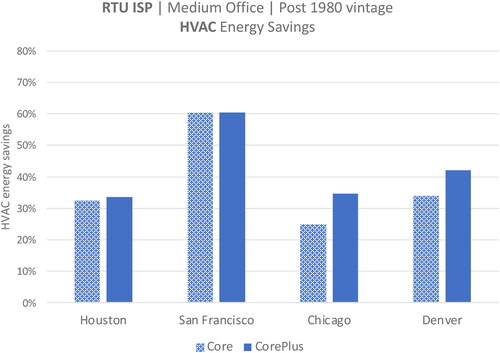
Prior to laboratory testing of the RTU Replacement ISP, we conducted energy simulations using the DOE prototype models (DOE n.d.) to provide whole building savings estimates. Results from the simulation studies for medium office show 12% to 18% whole building site energy savings relative to an existing building baseline across four cities representing different climate zones for Core and Core with optional measures (“CorePlus”) package configurations ( and ). shows the HVAC energy savings, which are as high as 60% for San Francisco and in the range of 25–40% for the other locations. The CorePlus configuration mainly benefits the colder climates, likely because energy recovery is more impactful in colder climates. Savings at any given site will depend on a host of site-specific factors such as building orientation, the relative proportion of perimeter and interior zones, envelope materials like insulation and glazing, as well as usage attributes such as the relative proportions of space types like offices, conference, server rooms, bathrooms, kitchens, etc. Quantifying the influence of all of these variables on package performance is beyond the scope of laboratory testing. Rather, the intent of laboratory testing was to validate HVAC energy savings with measured data in a controlled experiment that provides a true measured counterfactual of savings attributable to the package. The objectives of laboratory testing are further described in the next section.
Fig. 1. Simulated whole building site energy use intensity for baseline and from RTU replacement package, medium office, post 1980 vintage.
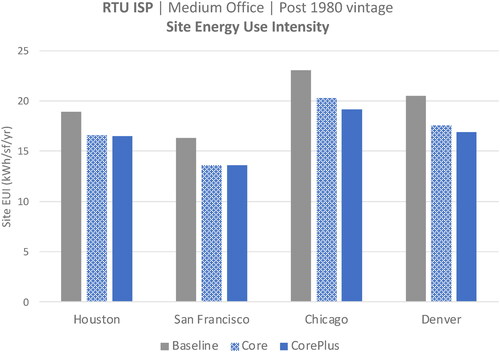
Fig. 2. Simulated whole building energy savings from RTU replacement package, medium office, post 1980 vintage.
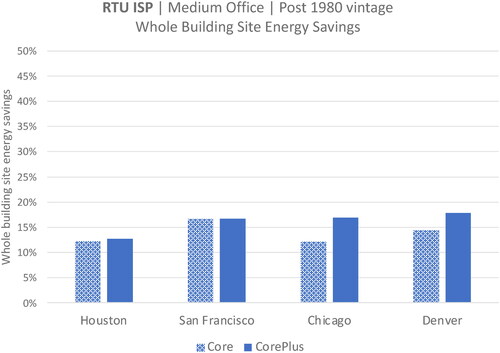
Fig. 3. Simulated HVAC end use energy savings from RTU replacement package, medium office, post 1980 vintage.
Methods
Objectives of laboratory testing
Laboratory testing provides valuable empirical performance data under controlled conditions for validation of the tested system. Laboratory testing was primarily conducted to evaluate the energy savings aspects of the RTU package, though technology performance with respect to thermal comfort was also evaluated. Testing in the lab allows for measurement of energy performance under a range of conditions, including performance through seasonal variations in solar loads and exterior temperatures. Lab testing can also evaluate the influence of variables such as alternative space and equipment configurations, and different baseline options, though for the RTU replacement package these features were held constant. Validation of package performance in the lab can “de-risk” package implementation for prospective adopters such as building owners, managers, and tenants. While implementation at the scale of the lab test is not suitable for evaluating costs in realistic scenarios, other implementation aspects like integration, installation and commissioning procedures were evaluated.
Laboratory test facility
Laboratory testing to validate performance of the RTU package involved side-by-side operation of a “reference case” and a “test case” in a lab facility specifically designed to test the performance of integrated systems, located in the San Francisco Bay area (FLEXLAB n.d.). The reference case represents a baseline existing building, while the test case represents the package performance applied to the baseline condition. There are a wide range of different existing building conditions that might apply. The U.S. Department of Energy (DOE) reference models (DOE n.d.) have three vintages: pre-1980, post-1980, and new construction (which corresponds to ASHRAE standard 90.1-2004 (ASHRAE Citation2019)). We chose the post-1980 model as the reference case as it corresponds to the middle level of baseline efficiency.
The reference and test cases are set up in laboratory cells that were identical in spatial dimensions, construction attributes (e.g., window type and performance, wall construction and thermal resistance, and infiltration), furniture layout, surface finishes, lighting system (LED fixtures with integrated sensors), and occupant and equipment loads. The only difference between the cells was the implementation of the RTU package in the test cell.
The lab cells were operated in parallel in the manner of a typical office over the course of several consecutive days at different times of year to capture seasonal effects from outdoor temperature and thermal conditions on the package energy performance. While thermal load and HVAC energy usage were the primary quantities evaluated, all aspects of operation were monitored through time, so that performance could be compared cell-to-cell, including thermal conditions and comfort, and visual parameters such as illuminance and glare.
Test conditions for reference and test cells
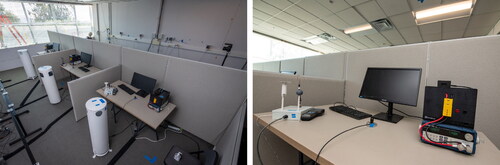
The RTU package was designed for implementation in commercial office spaces, so the layout of the test space was configured as an open office plan. Six cubicle-style workstations were set up in the 56 m2 (600 ft2) of cell floor area, which also includes hallways along the perimeter walls and rear of the cell. 1.5 m (5 ft) high cubicle partitions separated work stations across from one another and 1 m (3.5 ft) high partitions separated adjacent workstations (longitudinal with respect to the window-wall). This open office layout design concept is typical of commercial office spaces, accommodating separation of work spaces while allowing daylight penetration deeper into the zone. The lighting plan was a typical general lighting scheme with 0.6 × 1.2 m (2′ × 4′) recessed troffers over the desks spaced at 2.4 × 3.0 m (8′ × 10′) on center. shows the test cell layout and shows an interior view.
Fig. 4. Test cell layout for RTU replacement package lab tests. Six cubicle-partitioned workstations are arranged in a simple grid, with windows on the south wall (top). Icons show locations of the workstation desks, partitions, and programmed plug loads and occupant thermal generators as well as sensors for illuminance and thermal comfort (dry bulb air temperature, mean radiant temperature, relative humidity, and air velocity).
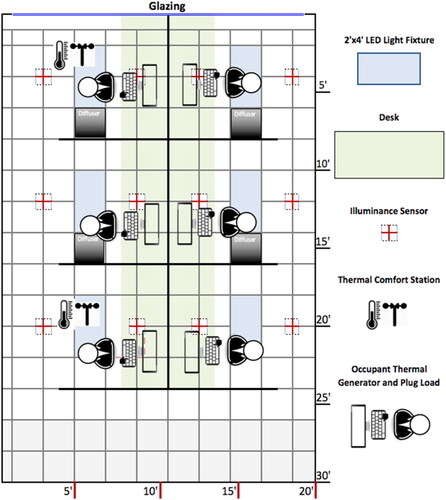
Fig. 5. Photograph of cubicle-partitioned workstation layout in test cell (left), with programmable plug loads visible on desks. White cylinders are occupant thermal generators at each workstation. A close-up view of a workstation is visible in the photograph on the right, showing programmable load on the desktop as well as illuminance sensor and thermal comfort station measuring dry bulb temperature, mean radiant temperature, relative humidity, and airflow velocity.
The HVAC condition in the reference cell was baseline efficiency RTU operation emulated with existing HVAC equipment at the laboratoryFootnote3. For the test cell, in addition to the efficient RTU replacement, the primary HVAC efficiency measure was implementation of ASHRAE Guideline 36 control sequences, which included:
supply air temperature (SAT) and duct static pressure reset (“trim and respond”);
demand controlled ventilation;
economizing, with an outside air high-limit set to 23.9 °C (75 °F);
zone sequences enhancements such as variable morning warmup schedule.
The cooling and heating setpoints and night setback, economizer operation and other features of the HVAC system in the reference and test case are detailed in . Other building parameters relevant to HVAC load and performance, including lighting systems and other internal load sources (plug loads and emulated occupants), as well as façade configuration are also described.
Table 2. System features in reference and test cells.
The test laboratory is a small-scale single-zone testing environment. Accordingly, VAV retuning, which is recommended for multi-zone systems, did not apply for the test condition and was not implemented. Similarly, intermittent ventilation strategies as outlined in Guideline 36 did not apply at the scale of the single-zone test condition and were not implemented. Additionally, packaged HVAC systems like RTUs will typically be larger in real-world commercial buildings, especially for multi-zone VAV RTUs, than what was appropriate sizing for the test. Therefore, in specifying the efficiency of the RTU used in laboratory testing, the CEE efficiency requirements for larger heat pump RTUs were selected as the minimum performance criteria. Specified minimum performance was based on CEE cooling and heating requirements for air cooled heat pump units in the 20 to 60 ton cooling capacity range. For that size, minimum EER for cooling is 10.1. For heat pump heating, the minimum required COP for any unit over 11 tons is 2.1 to 3.3 depending on outside air temperature. The test RTU selected for testing met these specifications.
The RTU package does not include any lighting retrofit measures, so the same lighting system was implemented in the reference and test cells. The LED lighting system was representative of an upgraded system relative to a standard existing building baseline such as three-lamp fluorescent T8 troffers with simple scheduled on/off control. LED troffers with luminaire level lighting controls were used in both cells, with occupant – responsive on/off switching as well as daylight dimming. The system included 2′ × 4′ LED troffer fixtures with efficacy around 114 lumens per Watt (LPW) and total output of 5000 lumens (CRI of 90, and CCT of 4000 K). The lighting power density (LPD) of this system at full power was around 4.7 W/m2 (0.44 W/ft2).
The window configuration for both cells included tinted double-pane insulated glazing units (IGUs) with performance characteristics also detailed in . Standard venetian blinds are used as the shading system for the windows, and the angle of the louvers is adjusted seasonally to prevent direct sunlight at workstations. The seasonal adjustment schedule is based on research showing that manual shade devices in offices are typically adjusted infrequently based on longer-term solar trends rather than daily solar conditions.
Occupant thermal loads (heat emitted by human bodies) are an important contribution to a building zone’s overall HVAC load, along with thermal load from electronic equipment at occupant workstations (computers, monitors, etc.), collectively, plug loads. Therefore, emulating occupancy and plug load patterns for each occupant and workstation in the space was important. Because the test space is not used by actual occupants in the way a real office space would be, occupancy thermal loads are emulated by thermal generators that emit heat equivalent to a human body. These are placed at each workstation and cycled on and off based on daily occupancy profiles developed for the test and described in the following section. Additionally, each workstation includes a programmable load to emulate a desktop computer, including a standard LCD monitor, to add realistic plug loads to the space. The programmable loads are scheduled to turn on when the respective workstation is first occupied in the morning and off when it is vacated for the last time at the end of the workday. The programmable plug load was set to approximately 89 W per workstation, resulting in an installed plug load density of 9.6 W/m2 (0.9 W/ft2) when all workstation computers were on. Importantly occupant thermal load and plug load schedules were identical in the reference and test cell so that internal loads were equivalent on the respective HVAC systems.
Occupancy, DCV, and HVAC integration
The RTU replacement package includes occupancy-responsive demand-controlled ventilation (DCV) controls that rely on occupancy data, so variable occupancy was important for demonstrating DCV. Plausible schedules of occupancy and vacancy were established for each occupant in the zone, solving for a summed occupancy in the zone that was close to DOE prototype model standard hourly assumptions for existing building occupant loads, but building in occupant variability (diversity of individual schedules) from workstation to workstation to test occupancy-based demand-controlled ventilation.
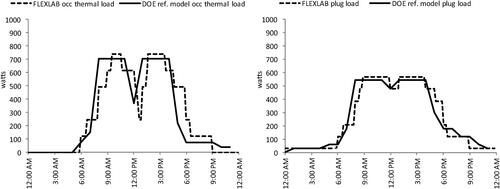
To emulate occupancy patterns in the test space for the six workstations, consumer level Wi-Fi connected programmable outlet controllers were used to turn occupant thermal loads on and off based on occupancy and vacancy schedules. Programmable plug loads were also located at each workstation with on/off schedules programmed to coincide with workstation occupancy. The recurring (daily) occupant load patterns and plug load patterns for the sum of the loads at the six work stations are shown in , plotted alongside DOE reference model hourly occupant and plug load profiles.
Fig. 6. The summed daily occupancy pattern for the six workstations, compared to the DOE reference model occupancy load schedule (left) and summed daily plug loads for the six workstations, compared to the DOE reference model plug load schedule (right). Summed occupant and plug load shows a daily routine of zonal occupancy build-up in the morning, a lunch-time dip, and gradual zone vacancy at the end of the workday.
Implementation of DCV based on occupancy was achieved in the laboratory test via customized occupancy schedule programming in the HVAC system. Based on the sum of the six work station occupancy profiles generated for the test, a total number of occupants (0 − 6) and occupancy fraction (0% to 100%) is known at any given time and demand control ventilation rates respond to the occupancy fraction. In practice, DCV may be accomplished based on occupancy sensor input, or CO2 concentration data (zone-level sensors or return air measurement) depending on local code requirements and technologies deployed. This measure can be accomplished with advanced lighting controls if high resolution occupancy data from the lighting system can be shared with the HVAC controls, but requires additional commissioning procedures.
Sensors and measurements
The laboratory cells are heavily instrumented with measurement devices to capture conditions at high spatial and temporal resolution, typically recorded at one-minute intervals. The electrical characteristics of all loads (current, voltage, power factor) are individually monitored. Thermal parameters in the cell, such as temperature in conditioned space, above the plenum, and in the slab, are monitored, along with HVAC parameters, such as airflow, damper positions, and air handler or RTU power. Air-side and hydronic-side measurements (flow rate through heating and cooling coil, and temperature change) capture the thermal load conditions in each cell on an ongoing basis.
HVAC cooling and heating load, energy use and savings were determined through measurements and calculations. In the reference cell, as noted earlier, a baseline efficiency RTU was emulated with the existing HVAC equipment. The measured heating and cooling loads were converted to RTU heating and cooling energy that would be required to meet that load, as follows. For cooling energy, thermal load was converted to mechanical energy via regression equation developed from annual whole building energy simulation data for a prototype commercial building with baseline RTU. The regressions related cooling load served by the RTU (i.e., the direct expansion, or DX, cooling load) and cooling energy usage of the RTU (DX cooling energy). For heating energy calculations, the measured heating load was converted to energy based on an assumed 80% gas furnace efficiency. RTU fan energy was calculated from the measured air handler fan energy usage for the reference cell scaled for RTU emulation based on the differences in fan sizing and motor efficiency between the air handler and the emulated RTU.
For the test cell, total electric energy usage of the high-efficiency heat pump RTU was measured. This quantity represents the total HVAC energy usage in the test case, encompassing heating, cooling, and fan energy.
For lighting systems, visual parameters are monitored at high temporal resolution, including illuminance at a one-minute interval. Desk level illuminance was monitored by two sensors per workstation: one on each desk and one on a rail behind the desk at equal height and equal distance from the overhead fixtures. However, since the RTU package did not include lighting and window shade changes, lighting performance data was not evaluated in detail here. It was tracked to confirm proper operation of the lighting systems in both cells.
To monitor parameters associated with thermal comfort, two thermal comfort stations were located in the reference cell and in the test cells, one on a front desk and one on a desk in the rear of the cell. Each station measures dry bulb air temperature, mean radiant temperature, air velocity, and relative humidity.
Test schedule
The reference and test cells were operated for several consecutive days and all relevant performance data were collected for analysis. shows the number of test days per month for each month from February through June of 2021 and total days per season. Testing was conducted over ranges of days covering winter, spring, and summer conditions, to the extent possible.
Table 3. Test days schedule and outdoor dry bulb temperature data.
Results and discussion
Energy savings
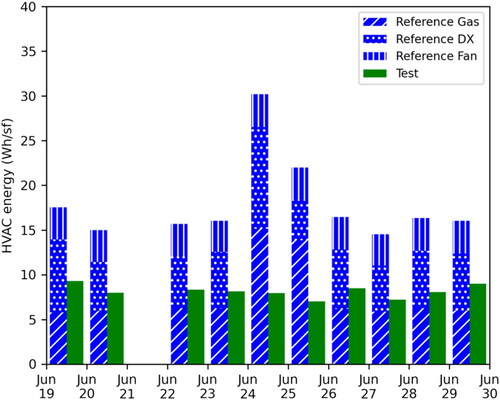
show the daily total HVAC energy for the reference and test cells in the winter, spring, and summer test periods respectively. The reference cell gas heating energy, direct expansion (DX) cooling energy, and fan energy are summed in the stacked blue bars, while the test cell measured RTU energy is shown by the green bars. For the test cell, electric power was monitored at the level of the entire heat pump RTU, which includes DX energy for cooling and for heating as well as supply air fan energy. While gas heating and DX cooling are disaggregated in the blue reference bars, heating and cooling cannot be disaggregated in the green test bars. The bar graphs clearly illustrate lower energy usage by the high-efficiency RTU replacement package relative to the reference case. Note that in San Francisco climate, it is common to use some heating energy even in the summer particularly in the morning, when outside air temperatures are typically well below setpoint.
Fig. 7. Winter test period HVAC energy usage for reference and test cells. Test cell HVAC energy includes heating DX, cooling DX and fan energy.
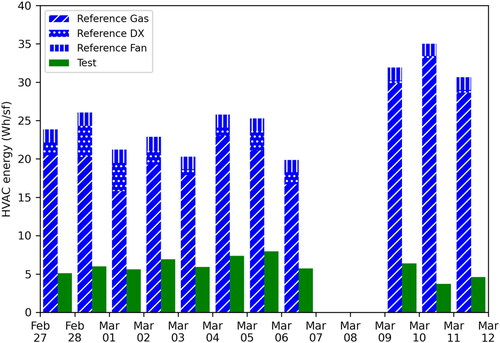
Fig. 8. Spring test period HVAC energy usage for reference and test cells. Test cell HVAC energy includes heating DX, cooling DX and fan energy.
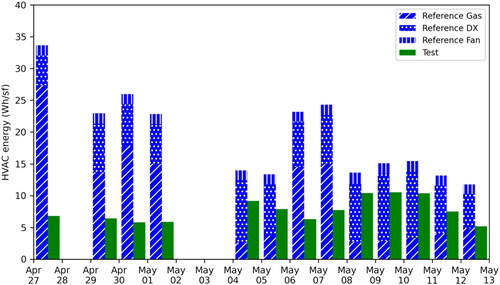
Fig. 9. Summer test period HVAC energy usage for reference and test cells. Test cell HVAC energy includes heating DX, cooling DX and fan energy.
shows the range of daily HVAC energy savings in relative terms (%) for each season, including maximum, average, and minimum values. These same results are tabulated in . Overall, the results show substantial HVAC energy savings for all seasons. Combining the seasonal results, daily HVAC energy savings for the RTU replacement package averaged around 61%. Recall from the whole building energy simulations that HVAC savings from the RTU package for the medium office model in San Francisco was 60%. Clearly, the savings from the laboratory testing and simulation show very good agreement despite being at different scales; i.e., simulation was for a whole building while the lab testing is only for a portion of a building. As noted earlier, the actual savings in any given building will vary based on a host of site-specific factors, but this degree of corroboration from two distinct evaluation methods suggests confidence in the overall level of savings that can be expected from the RTU package. Of course, a key limitation of this study is that the laboratory test results are specific to the climate of the San Francisco Bay Area and the savings percentages would be different in other locations. In particular, San Francisco has a mild climate, and heat pump operation under low temperatures has several limitations that were not covered in this test. Similarly, some features of Guideline 36, such as demand controlled ventilation, may perform quite differently under more extreme temperature conditions. Additional laboratory testing in more extreme outdoor temperature and humidity conditions would be needed to properly assess these impacts. However, the “first-order” agreement between the lab results and the simulation results for San Francisco arguably provide at least a modest degree of additional confidence in the simulation results for the other locations.
Fig. 10. Maximum, average, and minimum HVAC energy savings for each season from RTU replacement package testing.
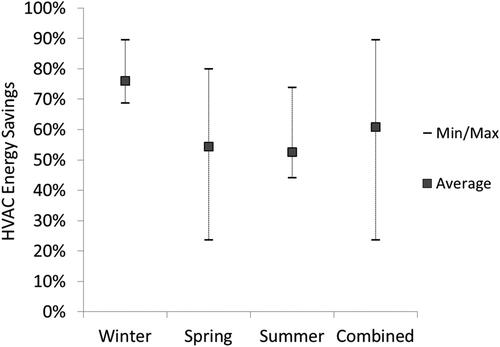
Table 4. HVAC energy savings for each season from RTU replacement package testing.
We also sought to understand the relative impacts of the controls measures in the package. lists the features of the RTU retrofit package and indicates where the HVAC energy savings occur. Note again that the measures include mechanical system changes such as higher efficiency rating for the RTU, and heat pump heating instead of gas furnace heating, as well as changes to controls sequences to improve energy efficiency. Mechanical and controls changes can affect HVAC energy in various ways, including reducing thermal load served by the system, changing the amount of energy required to meet thermal load, and the amount of fan energy used to move air for ventilation and conditioning through the space.
Table 5. RTU retrofit package HVAC system and control features and impacted savings categories (mechanical thermal load, DX energy, and fan energy).
The higher-efficiency RTU saves energy relative to standard efficiency RTU primarily in mechanical cooling energy savings in the refrigeration cycle, i.e., DX cooling, as well as DX heating via heat pump technology (reversible refrigerant cycle) compared to use of gas furnace heating. However, test data clearly show that the test cell also experienced lower overall heating and cooling load on the mechanical system. Given that the occupant and plug loads are equivalent and on identical schedules and that the reference and test cell experience the same external environmental conditions, any differences in thermal loads on the mechanical system, (“mechanical thermal load”) are then attributable to HVAC controls from the retrofit package, such as economizer operation that takes better advantage of free cooling from outside air, as well as other controls changes such as DCV that affect how much conditioning of outside air required.
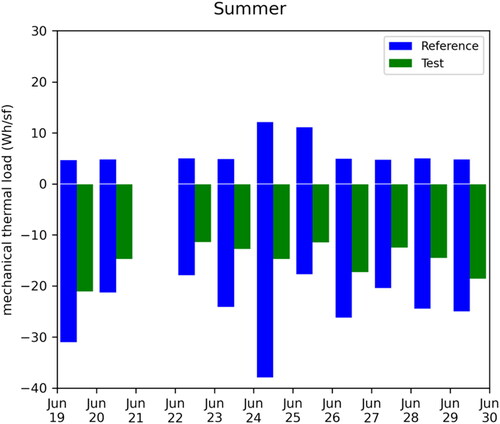
We computed the hourly and daily mechanical cooling load and heating load from minutely load data. As an example, shows the daily mechanical heating and cooling load for the summer season test period. Values below zero are cooling loads and values above zero are heating loads. The figure shows that for this period no mechanical heating load was experienced in the test cell, in contrast to the reference cell, and significantly lower cooling load was experienced in the test cell. These load differences are attributable to differences in zone sequences and other Guideline 36 controls implemented in the test cell, and demonstrate that the controls features contributed significantly to the overall package savings.
Fig. 11. Daily mechanical thermal loads for test and reference cells for summer test period. Values below zero are cooling loads. Values above zero are heating loads.
Indoor environmental quality
The primary objective of the ISPs is to reduce energy use while maintaining or improving indoor environmental quality (IEQ) relative to the baseline. Toward that end, we measured various IEQ metrics: thermal comfort parameters (air temperature, mean radiant temperature, air velocity, humidity), as well as illuminance and daylight glare probability. Illuminance and glare were measured only to track that the lighting and shade systems were working properly in each cell. The illuminance values were also within the ranges specified in IES standard RP-1-20 (IES Citation2020). Data was not analyzed for performance comparison between cells because the lighting and shade systems were identical, and were not changed in any way as part of the RTU package. The indoor temperatures were maintained per the specifications shown .
Installation, commissioning and operation
As noted earlier, one of the objectives of laboratory testing was to identify any issues with the installation, commissioning and operation of the package. In particular, we were seeking to identify unexpected skill, effort, or time requirements. The only notable aspect in this regard was the ASHRAE Guideline 36 controls. As currently written, Guideline 36 leaves considerable decision making to the programmer and requires a fairly experienced programmer to ensure proper implementation. This increases the overall effort for implementing the package and detracts from its goal of reducing transaction costs. The guideline could be improved by including programming recommendations that apply to common RTU controls configurations and installations. This study did not include a cost analysis since the costs in a laboratory testing context cannot be meaningfully translated into more generalized cost information.
Conclusions
This article presented the design and performance of a package of energy efficiency measures that can be applied in conjunction with an RTU replacement. The package includes a high efficiency rooftop unit, advanced efficient RTU controls, high-efficiency low pressure-drop air filters, energy monitoring and, optionally, window films and cool-roofs to reduce loads and size of the replacement RTUs. We conducted side-by-side laboratory testing of the package to evaluate energy savings and thermal comfort relative to an existing building baseline. The tests were conducted over a total of 34 days across different seasons, from February through June. Daily HVAC energy savings for the RTU replacement package averaged around 61% across all seasons, which also agrees very well with whole-building simulation analysis. The test data showed that the ASHRAE Guideline 36 controls significantly reduced thermal loads and this was a key contributor to the savings, in addition to the higher efficiency of the RTU itself. Thermal comfort parameters were also verified for both the baseline and test cases. The laboratory testing also revealed some challenges with installation and commissioning of HVAC controls. Guideline 36 leaves considerable decision making to the programmer and requires a fairly experienced programmer to ensure proper implementation, which increases the overall effort for implementing the package. Other than that, the package did not have any significant installation, commissioning or operational issues. In summary, the results demonstrate that significant savings can be realized in existing office buildings by incorporating relatively low-risk, proven measures in conjunction with an RTU replacement. These could be incorporated into the standard specifications used by building owners and facilities managers. However, field validation in real buildings is necessary to provide further evidence in this regard, and one such demonstration is currently underway for an office building in Modesto, California.
Data repository
The EnergyPlus simulation data input and results files are available on github at: https://bit.ly/3fOURLO.
Disclosure statement
The authors declare no conflict of interest. The funders had no role in the design of the study; in the collection, analyses, or interpretation of data; in the writing of the manuscript, nor in the decision to publish the results.
Additional information
Funding
Notes
1 Minimum ventilation rates are dictated by energy code and industry standard requirements (e.g., ASHRAE Standard 62.1). Intermittent ventilation can be an energy saving measure when targeted for certain situations and is an allowed practice under most conditions, providing the same ventilation over time as a continuously ventilating system, by pulsing ventilation on and off. For spaces that are not densely occupied but otherwise have significant heating and cooling load, such as a single occupancy perimeter office, the amount of ventilation airflow needed is low compared to the flow rate needed for conditioning. Often the required airflow rate is even lower than the lowest setting that can be accurately controlled at the terminal zone unit; in this case intermittent ventilation can manage outside airflow better and with greater accuracy since when the unit is ventilating it is doing so at a higher flow rate.
2 For units less than 65,000 Btu/h (5.4 tons) EER or SEER is tested per the ANSI/AHRI 210/240 standard, and for units greater or equal to 65,000 Btu/h, EER or IEER is tested per the ANSI/AHRI 340/360 standard.
3 The reference cell in the test laboratory has a VAV air handling unit with chilled water and hot water coils served by a chiller and boiler respectively. To emulate two stage heat pump operation, for example, valve positions for chilled and hot water coils at the air handler were limited to create a boundary between the first and second heat pump stages, with delays and other limits put on valve control to offer similar anti-cycling controls that would typically be seen in heat pump systems.
References
- Amann, J. 2017. Unlocking ultra-low energy performance in existing buildings. Washington D.C.: American Council for an Energy Efficient Economy. https://www.aceee.org/white-paper/unlocking-ule-0717.
- ASHRAE. 2018. Guideline 36-2018 – High-performance sequences of operation for HVAC systems. ASHRAE. https://www.techstreet.com/ashrae/standards/guideline-36-2018-high-performance-sequences-of-operation-for-hvac-systems?product_id=2016214.
- ASHRAE. 2019. ASHRAE standard 90.1 energy standard for buildings except low-rise residential buildings. ASHRAE. https://www.ashrae.org/technical-resources/bookstore/standard-90-1.
- Better Buildings. n.d. Toolkit: Upgrade your RTU to high-efficiency. Accessed May 23, 2022. https://betterbuildingssolutioncenter.energy.gov/toolkit-upgrade-your-rtu-high-efficiency.
- CEE. 2018. High efficiency commercial air conditioning and heat pumps initiative. Boston, MA: Consortium for Energy Efficiency. https://library.cee1.org/system/files/library/13655/Final_2018_CEE_HECAC_Initiative_Description.pdf.
- CEE. 2019. CEE commercial unitary air-conditioning and heat pumps specification. https://library.cee1.org/content/cee-commercial-unitary-ac-and-hp-specification-0.
- Che, W., Wei, C. Y. Tso, Li, S. D. Y. K. Ip, H. Lee, Christopher, Y. H. Chao, and A. K. H. Lau. 2019. Energy consumption, indoor thermal comfort and air quality in a commercial office with retrofitted heat, ventilation and air conditioning (HVAC) system. Energy and Buildings 201:202–15. 10.1016/j.enbuild.2019.06.029.
- Deru, M., H. Miles, V. Katie, B. Carly, J. Amy, and B. Cedar. 2021. Long and winding road to higher efficiency – The RTU story. Preprint, February. https://www.osti.gov/biblio/1766847.
- DOE. 2015. Technical support document: Energy efficiency for consumer products and commercial and industrial equipment: Small, large, and very large commercial package air conditioning and heating equipment. U.S. Department of Energy. https://www.regulations.gov/document/EERE-2013-BT-STD-0007-0105.
- DOE. 2017. Energy savings potential and RD&D opportunities for commercial building HVAC Systems. U.S. Department of Energy. https://www.energy.gov/sites/prod/files/2017/12/f46/bto-DOE-Comm-HVAC-Report-12-21-17.pdf.
- DOE. n.d. Commercial reference buildings. Energy.Gov. Accessed September 14, 2020. https://www.energy.gov/eere/buildings/commercial-reference-buildings.
- DOE. n.d. Prototype building models | Building energy codes program. Accessed October 18, 2021. https://www.energycodes.gov/prototype-building-models.
- EIA. n.d. Energy Information Administration (EIA) – Commercial Buildings Energy Consumption Survey (CBECS) data. Accessed September 14, 2020. https://www.eia.gov/consumption/commercial/data/2012/.
- FLEXLAB. n.d. Accessed September 14, 2020. https://flexlab.lbl.gov/.
- Garbesi, Louis, L.-B. Desroches, C. Bolduc, G. Burch, G. Hosseinzadeh, and S. Saltiel. 2011. Max tech appliance design: Potential for maximizing U.S. Energy Savings through standards. In 6th International Conference on energy efficiency in domestic appliances and lighting EEDAL 2011. Copenhagen, Denmark. https://eta-publications.lbl.gov/sites/default/files/max_tech_appliance_design_eedal_2011_lbnl_report_5-6-2011.pdf.
- Granade, H. C., J. Creyts, A. Derkach, P. Farese, and S. Nyquist. 2009. Unlocking energy efficiency in the U.S. economy. McKinsey & Company. https://www.mckinsey.com/∼/media/mckinsey/dotcom/client_service/epng/pdfs/unlocking%20energy%20efficiency/us_energy_efficiency_exc_summary.ashx.
- Granderson, Jessica, Guanjing Lin, Claire Curtin, Eliot Crowe, and Granderson, Jessica. 2020. Proving the business case for building analytics. 10.20357/B7G022.
- IES. 2020. Recommended practice: Lighting office spaces. ANSI/IES RP-1-20. New York: Illumination Engineering Society. https://store.ies.org/product/rp-1-20-recommended-practice-lighting-office-spaces/.
- Kwatra, S, and C. Essig. 2014. The promise and potential of comprehensive commercial building retrofit programs. American Council for an Energy Efficient Economy. https://www.aceee.org/sites/default/files/publications/researchreports/a1402.pdf.
- Mathew, P., C. Regnier, J. Shackelford, and T. Walter. 2020. Energy efficiency package for tenant fit-out: Laboratory testing and validation of energy savings and indoor environmental quality. Energies 13 (20):5311. 10.3390/en13205311.
- Nadel, S, and A. Hinge. 2020. Mandatory building performance standards: A key policy for achieving climate goals. American Council for an Energy Efficient Economy. https://www.aceee.org/white-paper/2020/06/mandatory-building-performance-standards-key-policy-achieving-climate-goals.
- Navigant. 2014. Energy efficiency retrofits for commercial and public buildings. Navigant Consulting Inc. https://guidehouseinsights.com/reports.
- PNNL, P. E. C. I. 2011. Advanced energy retrofit guide – Office buildings. Pacific Northwest National Laboratory. https://www.pnnl.gov/main/publications/external/technical_reports/PNNL-20761.pdf.
- Regnier, C., K. Sun, T. Hong, and M. A. Piette. 2018. Quantifying the benefits of a building retrofit using an integrated system approach: A case study. Energy and Buildings 159:332–45. 10.1016/j.enbuild.2017.10.090.
- R. M. I. n.d. Deep energy retrofits using energy savings performance contracts: Success stories. Accessed October 6, 2020. rmi.org/wp-content/uploads/2017/03/Deep_Energy_Retrofits_Using_ESPC.pdf.
- Shackelford, J., P. Mathew, C. Regnier, and T. Walter. 2020. Laboratory validation of integrated lighting systems retrofit performance and energy savings. Energies 13 (13):3329. 10.3390/en13133329.
- Zhai, J., N. LeClaire, and M. Bendewald. 2011. Deep energy retrofit of commercial buildings: A key pathway toward low-carbon cities. Carbon Management 2 (4):425–30. 10.4155/cmt.11.35.