
 ?Mathematical formulae have been encoded as MathML and are displayed in this HTML version using MathJax in order to improve their display. Uncheck the box to turn MathJax off. This feature requires Javascript. Click on a formula to zoom.
Abstract
Ventilation is an active control method that can improve the indoor environment by removing indoor air pollution. The membrane-based air-to-air energy recovery ventilator is a ventilation device that utilizes the heat exchange between the discharged polluted air and fresh outdoor air during ventilation. This study analyzed the pressure drop characteristics of the ventilator core and aimed to develop an equation to predict the pressure drop using polynomial regression based on the size of the core, the airflow rate, and the opening ratio of the core. Within elements having the same opening ratio, the channel velocity (uc) and equivalent pressure drop (Pe) values showed a linear relationship, regardless of the element size. The opening ratio of the elements varied depending on the cell height. To analyze the correlation between the opening ratio of the element, substantial flow rate inside the element, and equivalent pressure drop, a multivariate polynomial regression analysis was conducted for the three variables. The difference between the values of the derived prediction formula and the experimental value was found to be within 5% across the entire range in which the experiment was conducted. Using the interaction formula of equivalent pressure drop, channel velocity, and opening ratio derived in this study, the pressure drop across the entire driving area could be predicted for an arbitrary cell height and width of the ventilator core, as well as the operating airflow rate.
Introduction
Recently, human life has changed from agricultural to industrialized-oriented societies. Along with rapid changes in society, the space where people spend most of their time during the day has shifted from being outside to being inside. Owing to these changes, humans spend more than 80% of their time in indoor spaces, such as offices, houses, and schools, and many efforts have been made to make these environments more pleasant (Lim et al. Citation2012).
Ventilation is an active control method that can make indoor environments more pleasant by removing indoor air pollution (Bearg Citation1993; Cho, Oh, and Ahn Citation2017; Huizing, Chen, and Wong Citation2015). The trend of constructing high-rise buildings, such as apartments and offices, with increased airtightness has increased the importance of ventilation equipment because significant amounts of harmful chemicals accumulate indoors (Daisey, Angell, and Apte Citation2003; Jan, Curtiss, and Rabl Citation2002). As ventilation replaces polluted indoor air by bringing in fresh outdoor air, the heating and cooling loads of a building significantly increase in summer and winter when the indoor–outdoor temperature difference is large (Drost Citation1993; Fisk and Turiel Citation1983). Such problems have generated the need for an eco-friendly ventilation system that can secure a pleasant indoor air environment while reducing energy consumption by reducing heating and cooling loads (Kalbasi, Ruhani, and Rostami Citation2019; Ke and Yanming Citation2009).
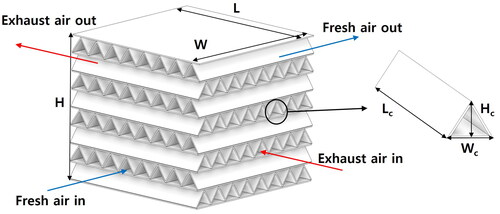
The membrane-based air-to-air energy recovery ventilator (MERV) is a ventilation device that utilizes the heat exchange between discharged polluted air and fresh outdoor air during ventilation (Connor et al. Citation2016; Swiercz Citation2021; Zhang et al. Citation2000). It recovers and recycles the heat energy generated through the heating and cooling of a building, saving energy while simultaneously purifying and supplying outdoor air, making it an effective ventilation device that can supply fresh air indoors using a simple system (Lekshminarayanan, Croal, and Maisonneuve Citation2020; Mansur et al. Citation2021; Souifi et al., Citation2021). The core part of an MERV is the enthalpy exchanger, where the heat exchange takes place, which comprises a membrane and spacer, as shown in .
Fig. 1. A schematic of an element core.
Heat exchange occurs via the transfer of temperature and moisture between the internal and external air through a liner. The spacer forms an airflow path and maintains the overall phase of the enthalpy exchanger (Armatis and Fronk Citation2017; Busto et al. Citation2017; Masitah, Ahmad, and Yatim Citation2015). The paper used in the liner of an enthalpy exchanger is often coated with a moisture absorbent to increase its absorption ability. Additionally, to prevent the mixing of the inflow and outflow air, the fiber spacing is often made denser by pressing the paper through a cylindrical roller (calendering). However, because the main purpose of a spacer is to maintain the airflow path and shape of the element, papers that have not undergone such special processing were used for these experiments (Kim Citation2016; Kwak et al. Citation2007).
Significant research has been conducted on MERV performance, with recent studies seeking to predict the performance of the ventilator core through experimentation, numerical and effective number of transfer units (NTU) methods, and computational analysis (computational fluid dynamics [CFD]). The numerical and effective NTU method can reflect the variables for shape and material more easily than other methods; therefore, it is widely used for the analysis of variables that are difficult to implement experimentally (Min and Duan Citation2016; Min and Su Citation2010; Zhang Citation2016). Experimental methods are most frequently used because they can analyze both energy efficiency and differential pressure (Engarnevis et al. Citation2018; Gao et al. Citation2021; Kwak and Bai Citation2009; Papakostas and Kiosis Citation2015; Siegele Citation2019; Zhang et al. Citation2017). These methods can be combined to analyze the energy efficiency performance of the MERV, and a comparative analysis of their results can be performed (Kim and Kim Citation2018; Lee et al. Citation2012; Qiu et al. Citation2019; Siegele and Ochs Citation2019; Zhang Citation2012). Computational fluid dynamics is used less frequently than other methods; however, it can be useful when the flow rate and temperature distribution inside an element are important (Waked et al. Citation2015; Waked et al. Citation2013; Xiana, Tang, and Mo Citation2018). Energy efficiency performance can also be analyzed using polynomial regression (Gao et al. Citation2021; Qiu et al. Citation2019).
While many studies analyzing the energy efficiency performance of MERV have been conducted, few studies have attempted to predict the pressure drop of the ventilator core, which is essential for the design of a blower fan, the MERV component that consumes the most energy. No existing studies have focused on predicting the pressure drop of a core based on the size and the opening ratio of the core and the airflow rate. This study analyzed the pressure drop characteristics of the ventilator core through experimentation and, using polynomial regression, aimed to develop a pressure drop prediction equation based on the size and the opening ratio of the core and airflow rate.
Methodology
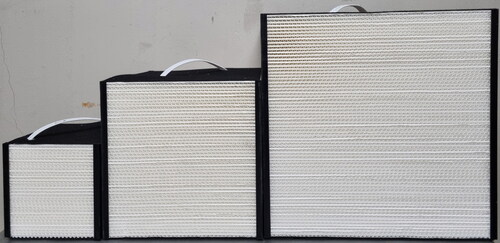
The pressure drop was measured under the condition of changing the airflow rate for the nine ventilator cores, as shown in .
Table 1. The test-core dimensions.
The thicknesses of the membrane and spacer used in this experiment are listed in .
Table 2. Membrane and spacer specifications.
The actual flow velocity inside the element was calculated to analyze the pressure drop and predict the pressure drop under conditions such as the size and airflow rate of an arbitrary element. The flow velocity at the front end of the core element of the enthalpy exchanger is presented in EquationEquation 1(1)
(1) as a value obtained by dividing the cross-sectional area of the ventilator core by the measured airflow rate (V). The ventilator core comprised the intersection of a membrane and spacer, with high- and low-temperature sides each occupying 50% of the flow space and blocking 50% of the front part of the ventilator cores. As a portion of the remaining 50% of the space was occupied by the spacer and membrane, the actual cross-sectional flow area was less than 50% of the front surface of the ventilator core. EquationEquation 2
(2)
(2) presents the ratio of the actual flow space to the front surface of the ventilator core obtained from the height, width, and thickness of the element defined in and . Through the flow rate at the front end of the ventilator core and the opening ratio, the channel velocity within the element was obtained, as shown in EquationEquation 3
(3)
(3) .
(1)
(1)
(2)
(2)
(3)
(3)
shows the ventilator cores used in this study.
Fig. 2. The ventilator cores used in the experiment under three size conditions. (L = 150, 250, and 350 mm).
The pressure drop was measured in the flow rate range of 50–549 cubic meters per hour for the nine ventilator cores. The experimental volumetric flow rate, flow velocity, channel velocity, and Reynolds number for each ventilator core are presented in .
Table 3. Test conditions.
(a) Volumetric flow rate and flow velocity
(b) Channel velocity and Reynolds number.
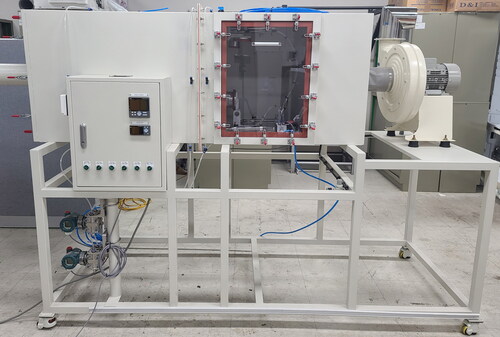
The airflow rate was measured using a chamber-type multi-nozzle fan tester, as shown in . The differential pressure before and after the flow nozzle was used to measure the airflow rate using the flow nozzle. A differential pressure transmitter (EJA110A) with an accuracy of ± 0.065% was used to measure the differential pressure.
Fig. 3. The multi-nozzle fan tester.
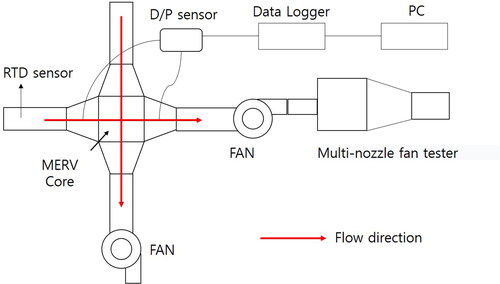
shows the connection of each ventilator core used for the pressure drop experiment, where the airflow rate was measured in a stabilized state and the pressure drop was measured at the front and rear ends of the ventilator cores.
Fig. 4. Pressure drop test setup schematic.
To measure the pressure drop, a differential pressure sensor (Beck 984 A.543) was connected to a data logger (KEASIGHT DAQ970A) to enable real-time measurement. The differential pressure sensor has an accuracy of ±1%. According to Gao and Qiu’s studies (Gao et al. Citation2021; Qiu et al. Citation2019), the expanded measurement uncertainties of P (pressure drop) and V (airflow rate) can be calculated using EquationEquations 4(4)
(4) and Equation5
(5)
(5) . In this study, K (coverage factor) was defined as 1.96, which obtains a 95% confidence level (Farrance and Frenkel Citation2012).
(4)
(4)
(5)
(5)
In this study, the maximum expanded measurement uncertainty of the Reynolds Number was ±0.13%. Expanded measurement uncertainties of pressure drop and friction factor are illustrated in and .
Fig. 5. Pressure drop by airflow rate change for each ventilator core.
Case study and results
The effects of core and channel sizes
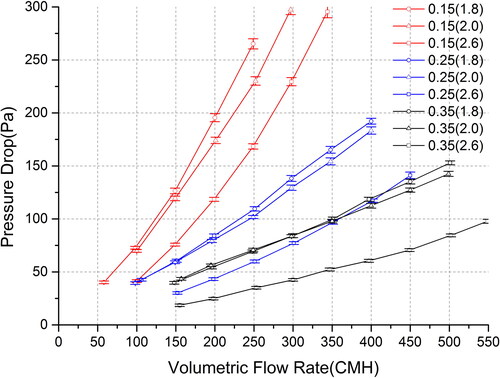
shows a plot of the pressure drops measured under the experimental conditions listed in .
The pressure drop also increased with an increased airflow rate. For Hc = 1.8 and 2.0 mm, the differences between the values were small. For Hc = 2.6 mm, with a large frontal area ratio, the pressure drop at the same airflow rate was smaller than that at 1.8 and 2.0 mm.
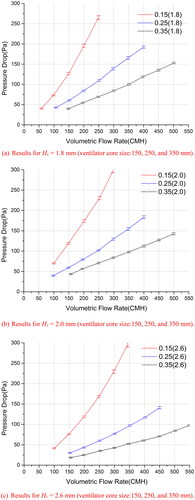
shows a set of plots summarizing the results by ventilator core size under the same conditions (Hc = 1.8, 2.0, and 2.6 mm). As the size of the ventilator core increased, the pressure drop decreased; when Hc increased, the pressure drop also decreased.
Fig. 6. Pressure drop by airflow rate change for each ventilator core with the same Hc.
The effects of channel velocity
shows the results of redefining the x-axis as the Reynolds number in the ventilator core, as obtained from EquationEquation 8(8)
(8) , based on the results shown in . This shows that there was a significantly greater pressure drop when the ventilator core size (L) was increased under the same channel velocity conditions within the element.
Fig. 7. Pressure drop by Reynolds number change for each ventilator core.
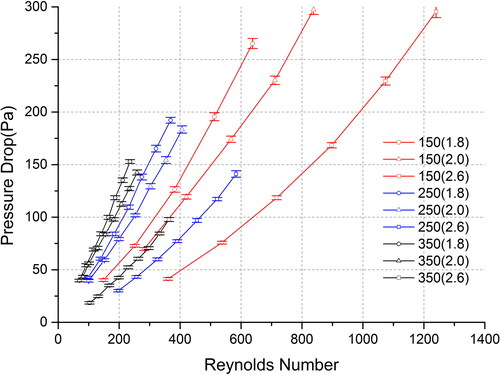
The smaller the Hc of the ventilator core, the larger the pressure drop. Assuming a steady-state and incompressible flow in each channel of the ventilator core, the pressure drop in the inner channel of the element can be expressed by the Darcy–Weisbach equation, that is, EquationEquation 4(4)
(4) (Cui et al. Citation2018). As the length of the ventilator core (L) and the length of the flow channel cross-section (Lc) were equal, the pressure drop increased as the length of the ventilator core increased.
(6)
(6)
With the help of the channel size of each test core, the hydraulic diameter and Reynolds number of the triangular channel can be calculated using (Gao et al. Citation2021)
(7)
(7)
(8)
(8)
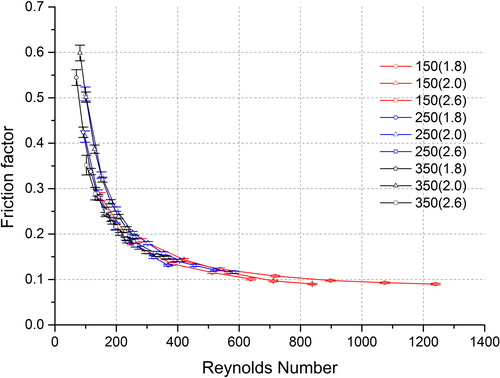
shows a plot of the friction factor results by core size for Hc = 1.8, 2.0, and 2.6 mm. As the channel velocity increases, the friction factor decreases.
Fig. 8. Friction factor by Reynolds number change within the ventilator core for each ventilator core with the same Hc.
Analysis of the prediction results
EquationEquation 7(7)
(7) shows the equivalent pressure drop (Pe), which is obtained by dividing the pressure drop of the ventilator core (Pc), which is the pressure drop value of the ventilator core for each experimental condition, by the element length L (the length of ventilator core) under the following experimental conditions:
(9)
(9)
shows a plot of the value of Pe against the channel velocity (uc) in the ventilator core. The pressure drops per unit length of ventilator cores with the same Hc and Wc values were similar.
Fig. 9. Equivalent pressure drop changes along the channel velocity.
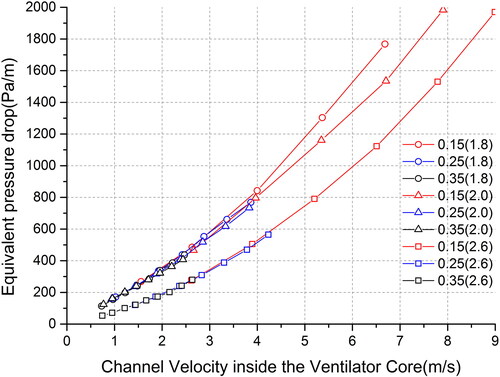
In the case of ventilator cores with the same cell height (Hc), the Pe value changed linearly with uc, although when L was different.
Based on the results shown in , the ratio of the frontal area (Rfa) was substituted with parameter x1 and uc with parameter x2 to perform multivariate polynomial regression. Parameter x1 is expressed as a function of Rfa of the ventilator core, as defined in EquationEquation 10(10)
(10) . Parameter x2 is expressed as a function of the channel velocity in the ventilator core, as defined in EquationEquation 11
(11)
(11) . lists the values used to obtain the x1 and x2 values corresponding to the upper and lower limits of Rfa and uc.
Table 4. The upper and lower limits of Rfa and uc.
Based on the results shown in , the multivariate polynomial regression analysis can be expressed in the form of EquationEquation 12(12)
(12) , with the coefficient values of α1–α7 presented in . With the Rfa obtained from the shape and thickness of the membrane and spacer according to EquationEquation 2
(2)
(2) and uc obtained at an arbitrary airflow rate according to EquationEquation 3
(3)
(3) , the differential pressure was predicted by multiplying the result of EquationEquation 12
(12)
(12) by the core size. This means that only when the core size (L) and airflow values were determined could the pressure drop in the overall area of a ventilator core be predicted. Multivariate polynomial regression analysis was conducted using the PIAnO 2021 Metamodeler PIDOTECH.
(10)
(10)
(11)
(11)
(12)
(12)
Table 5. The results obtained for s (i = 1–7).
EquationEquations 13–16 allow the prediction equation and coefficient of determination of the experimental value to be calculated through multivariate polynomial regression analysis. The coefficient of determination (R2) of the theoretical functional formula used in this study was 0.99895.
(13)
(13)
(14)
(14)
(15)
(15)
(16)
(16)
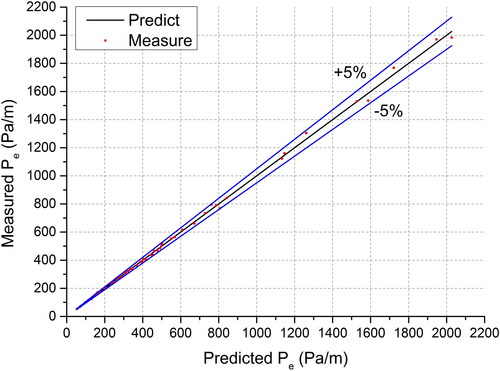
shows a comparison of the functional formula derived through multivariate polynomial regression using the experimental values, most of which were distributed within 5% of the prediction equation.
Fig. 10. A comparison of equivalent pressure drop values through experimental and predicted values.
Conclusions
In this study, experiments were conducted to measure the pressure drop as a function of airflow rate changes by manufacturing nine types of ventilator cores, using ventilator core sizes (0.15, 0.25, and 0.35 mm) and cell heights (1.8, 2.0, and 2.6 mm) as variables. To analyze the pressure drop characteristics of the ventilator core, the Rfa (ratio of frontal area) of the ventilator core to the uc (channel velocity) inside the ventilator core was calculated. This confirms that the Rfa of an element and the substantial flow rate inside an element are strongly correlated with the characteristics of the differential pressure. The concept of Pe(equivalent pressure drop) was introduced to correct the differential pressure characteristics according to the ventilator core size. In the ventilator cores with the same Rfa, ur and Pe inside the ventilator core showed a linear relationship, regardless of the ventilator core size. The Rfa of the ventilator core varied depending on the Hc (height of the flow channel cross section).
To analyze the correlation between the Rfa of the ventilator core, channel velocity inside the ventilator core, and equivalent Pe, a multivariate polynomial regression analysis was conducted for three variables to calculate the interaction formula for the equivalent pressure drop. The R2 value of the theoretical functional formula is 0.99895. The difference between the derived prediction formula and experimental values was found to be within 5% over the range in which the experiment was conducted.
The interaction formula of Pe, uc, and Rfa derived in this study can be used to predict the pressure drop across the driving area under conditions including an arbitrary cell height and width of the ventilator core and operating airflow rate.
| Nomenclature | ||
| u | = | Flow velocity (m/s) |
| uc | = | Channel velocity (m/s) |
| V | = | Air flowrate (m3/h) |
| Rfa | = | Ratio of frontal area |
| Re | = | Reynolds number |
| Pc | = | Pressure drop of ventilator core (Pa) |
| Pe | = | Equivalent pressure drop (Pa/m) |
| Hc | = | Height of flow channel cross-section (mm) |
| H | = | Height of ventilator core (mm) |
| Lc | = | Length of flow channel cross-section (mm) |
| L | = | Length of ventilator core (mm) |
| Wc | = | Width of flow channel cross-section (mm) |
| W | = | Width of ventilator core (mm) |
| Tm | = | Thickness of membrane (mm) |
| Ts | = | Thickness of spacer (mm) |
| yi | = | The ith measured value |
| = | The ith predicted value | |
| R2 | = | Coefficient of determination |
| SStot | = | The total sum of squares |
| SSreg | = | The regression sum of squares |
| SSerr | = | The sum of squared errors (residual sum of squares) |
| ΔP | = | Pressure drop (Pa) |
| Cf | = | Darcy friction factor |
| Dh | = | Hydraulic diameter (m) |
| ρ | = | Air density (kg/m3) |
| μ | = | Dynamic Viscosity (kg/m·s) |
| Subscripts | ||
| U | = | Upper |
| L | = | Lower |
Disclosure statement
No potential conflict of interest was reported by the author(s).
Additional information
Funding
References
- Armatis, P. D., and B. M. Fronk. 2017. Evaluation of governing heat and mass transfer resistance in membrane-based energy recovery ventilators with internal support structures. Science and Technology for the Built Environment 23 (6):912–22. doi:10.1080/23744731.2017.1325705.
- Bearg, D. W. 1993. Indoor air quality and HVAC systems. Florida: Lewis Publishers.
- Busto, J. B., C. M. Gómez, A. Z. Ros, E. Baquero, and R. Mirand. 2017. Performance simulation of heat recovery ventilator cores in cascade connection. Energy and Buildings 134:25–36.
- Cho, M., S. Oh, and Y. Ahn. 2017. Heat transfer and sterilization characteristics of an ERV element made of Hwang-to paper. Journal of the Korean Society for Power System Engineering 21 (1):50–6.
- Connor, D., J. Kaiser, S. Calautit, and B. R. Hughes. 2016. A review of heat recovery technology for passive ventilation applications. Renewable and Sustainable Energy Reviews 54:1481–93.
- Cui, C., X. Zhang, W. Cai, and G. Jing. 2018. A novel online air balancing method for the ventilation duct system via distributed cooperative control. Building and Environment 146:177–89.
- Daisey, J. M., W. J. Angell, and M. G. Apte. 2003. Indoor air quality, ventilation and health symptoms in schools: An analysis of existing information. Indoor air 13 (1):53–64.
- Drost, M. K. 1993. Air-to-air heat exchanger performance. Energy and Buildings 19:215–20.
- Engarnevis, A., R. Huizing, S. Green, and S. Rogak. 2018. Heat and mass transfer modeling in enthalpy exchangers using asymmetric composite membranes. Journal of Membrane Science 556:248–62.
- Farrance, I., and R. Frenkel. 2012. Uncertainty of measurement: A review of the rules for calculating uncertainty components through functional relationships. The Clinical Biochemist. Reviews 33 (2):49–75.
- Fisk, W., and I. Turiel. 1983. Residential air-to-air heat exchangers: Performance energy savings, and economics. Energy & Buildings 5 (3):197–211.
- Gao, H., Z. Li, S. Qiu, B. Yang, S. Li, and Y. Wen. 2021. Energy exchange efficiency prediction from non-linear regression for membrane-based energy-recovery ventilator cores. Applied Thermal Engineering 197:117353.
- Huizing, R., H. Chen, and F. Wong. 2015. Contaminant transport in membrane based energy recovery ventilators. Science and Technology for the Built Environment 21 (1):54–66.
- Jan, K., P. Curtiss, and A. Rabl. 2002. Heating and cooling of buildings: Design for efficiency. New York: McGraw-Hill.
- Kalbasi, R., B. Ruhani, and S. Rostami. 2019. Energetic analysis of an air handling unit combined with enthalpy air‑to‑air heat exchanger. Journal of Thermal Analysis and Calorimetry 139 (2):1–10.
- Ke, Z., and K. Yanming. 2009. Applicability of air-to-air heat recovery ventilators in China. Applied Thermal Engineering 29 (5–6):830–40.
- Kim, C. H., and N. Kim. 2018. An experimental study on heat and mass transfer in diagonal flow enthalpy exchangers. Korean Journal of Air-Conditioning and Refrigeration Engineering 30 (6):258–65.
- Kim, N. 2016. Performance comparison between indirect evaporative cooler and regenerative evaporative cooler made of plastic/paper. Journal of the Korea Academia-Industrial Cooperation Society 17 (1):88–98.
- Kwak, K., and C. Bai. 2009. A study on performance improvement of corrugated type total heat exchanger considering the structure of flow passage on surface. Journal of Mechanical Science and Technology 23:1528–35.
- Kwak, K., C. Bai, J. Kim, and E. Chu. 2007. A study on improvement of performance for perforated type total HEX element. Korean Journal of Air-Conditioning and Refrigeration Engineering 19 (7):529–36.
- Lee, E., J. Lee, H. Sim, and N. Kim. 2012. Modeling and verification of heat and moisture transfer in an enthalpy exchanger made of paper membrane. International Journal of Air-Conditioning and Refrigeration 20 (3):1–13.
- Lekshminarayanan, G., M. Croal, and J. Maisonneuve. 2020. Recovering latent and sensible energy from building exhaust with membrane-based energy recovery ventilation. Science and Technology for the Built Environment 26 (7):1000–12. doi:10.1080/23744731.2020.1761712.
- Lim, T., B. Jeon, J. Kim, S. Jung, S. Lee, and Y. Ahn. 2012. A study on performance change of total heat exchanger according to material change of spacer. The Korean Journal of Air-Conditioning and Refrigeration Engineering 24 (3):224–9.
- Mansur, F. Z., N. A. Keling, J. H. Ang, A. Salehabadi, S. Riffat, Y. Yusup, and M. I. Ahmad. 2021. Thermal performance of a fixed-plate air-to-air energy recovery system for building application in hot and humid environment. International Journal of Energy Research 45 (6):8900–18.
- Masitah, A., M. I. Ahmad, and Y. M. Yatim. 2015. Heat transfer and effectiveness analysis of a cross-flow heat exchanger for potential energy recovery applications in hot-humid climate. Energy Research Journal 6 (1):7–14.
- Min, J., and J. Duan. 2016. Comparison of various methods for evaluating the membrane-type total heat exchanger performance. International Journal of Heat and Mass Transfer 100:758–66.
- Min, J., and M. Su. 2010. Performance analysis of a membrane-based energy recovery ventilator Effects of membrane spacing and thickness on the ventilator performance. Applied Thermal Engineering 30 (8–9):991–7.
- Papakostas, K. T., and G. C. Kiosis. 2015. Heat recovery in an air-conditioning system with air-to-air heat exchanger. International Journal of Sustainable Energy 34 (3–4):221–31. doi:10.1080/14786451.2013.879139.
- Qiu, S., S. Li, F. Wang, Y. Wen, Z. Li, Z. Li, and J. Guo. 2019. An energy exchange efficiency prediction approach based on multivariate polynomial regression for membrane-based air-to-air energy recovery ventilator core. Building and Environment 149:490–500.
- Siegele, D. 2019. Measurement data of an air-to-air membrane enthalpy and a heat exchanger. Data Brief 26:104453.
- Siegele, D., and F. Ochs. 2019. Effectiveness of a membrane enthalpy heat exchanger. Applied Thermal Engineering 160:114005.
- Souifi, H., Y. Bouslimani, M. Ghribi, and S. Colin. 2021. Experimental investigation and modeling of a dual-core air-to-air exchanger. Energy and Buildings 231:110600.
- Souifi, H., Y. Bouslimani, M. Ghribi, and S. Colin. 2021. Modeling of an air-to-air exchanger with dual-core in cascade connection. MethodsX 8:101253.
- Swiercz, Z. E. A. 2021. Review of heat recovery in ventilation. Energies 14:1759.
- Waked, R. A., M. S. Nasif, G. Morrison, and M. Behnia. 2013. CFD simulation of air to air enthalpy heat exchanger. Energy Conversion and Management 74:377–85.
- Waked, R. A., M. S. Nasif, G. Morrison, and M. Behnia. 2015. CFD simulation of air to air enthalpy heat exchanger: Variable membrane moisture resistance. Applied Thermal Engineering 84:301–9.
- Xiana, Z., X. Tang, and H. Mo. 2018. CFD simulation different inner structure of air heat exchanger. In IOP Conference Series: Earth and Environmental Science. Vol. 199: 052032.
- Zhang, C., J. Xu, T. Ge, Y. Dai, and R. Wang. 2017. A study on enthalpy exchanger with modified functional layers based on chloride. Science and Technology for the Built Environment 23:72–80.
- Zhang, L. 2012. Progress on heat and moisture recovery with membranes: From fundamentals to engineering applications. Energy Conversion and Management 63:173–95.
- Zhang, L. 2016. A reliability-based optimization of membrane-type total heat exchangers under uncertain design parameters. Energy 101:390–401.
- Zhang, Y., Y. Jiang, L. Zhang, Y. Deng, and Z. Jin. 2000. Analysis of thermal performance and energy savings of membrane based heat recovery ventilator. Energy 25 (6):515–27.