
 ?Mathematical formulae have been encoded as MathML and are displayed in this HTML version using MathJax in order to improve their display. Uncheck the box to turn MathJax off. This feature requires Javascript. Click on a formula to zoom.
Abstract
Commercial building HVAC systems experience many sensing, mechanical, and control-related faults that increase energy consumption and impact occupant comfort. Fault detection & diagnostics (FDD) software has been demonstrated to identify and help diagnose these types of faults. Several studies have demonstrated FDD energy savings potential, but there is limited empirical data characterizing the quantity and type of faults reported by FDD tools. This paper presents results of an FDD fault reporting study, employing multi-year monitoring data for over 60,000 pieces of HVAC equipment, covering over 90 fault types, and using new metrics that we developed to characterize fault prevalence. Study results offer an unprecedented accounting of the quantity of faults reported, the most commonly occurring faults, and fault persistence. We find that 21 air handling unit (AHU) faults were reported on 20% or more AHUs in our dataset, and 18 AHU faults persisted for more than 20% of the time period covered by the data. On any given day, 40% of AHUs and 30% of air terminal units saw a reported fault of some kind. Based on in-depth analysis of these results we provide recommendations for building operators, FDD software developers, and researchers to enable more efficient commercial building operation.
Introduction
Commercial building heating, ventilation, and air-conditioning (HVAC) systems can experience a diverse variety of operational faults. For example, damper actuators may fail, control sequences may not meet design intent, and sensors may fail or drift out of calibration. These operational faults can have a negative impact on energy consumption/cost, occupant comfort, and long term equipment reliability (Roth et al. Citation2004).
Energy savings resulting from resolution of commercial HVAC system operational faults has been documented in several past studies. For example, Crowe et al. reported median whole building energy savings of 6% for implementing existing building commissioning (EBCx; a quality assurance process addressing HVAC operational faults), based on a study dataset of over 1,500 buildings (Crowe et al. Citation2020). Another study reported 29% energy savings potential from optimizing the operation of inefficient buildings, based on simulations across multiple building types and baseline/measure permutations (Fernandez et al. Citation2018). Such operational faults can equally apply to old and newer buildings.
Aggressive building decarbonization and energy efficiency goals are being set at national, regional, and corporate levels. For example the U.S. Department of Energy has set a goal to triple the energy efficiency of the buildings sector by 2030 relative to 2020 levels (Satchwell et al. Citation2021). To achieve these goals, energy waste in commercial buildings must be minimized.
EBCx has become increasingly popular over the past two decades as a strategy for addressing HVAC operational faults in commercial buildings on a periodic basis, being recommended every 3-5 years (U.S. DOE. Citation2014). In parallel, a class of software called energy management and information systems (EMIS) has emerged as a useful tool for supporting continuous Monitoring-Based Commissioning (MBCx) and ongoing operations management (LBNL Citation2021). Fault detection & diagnostics (FDD) software, a class of EMIS that is designed to identify a wide range of HVAC operational faults, has been studied at scale and found to achieve a median 9% whole building energy savings (Lin et al. Citation2022). The gap between operational energy savings potential of 29% (Fernandez et al. Citation2018) and examples of achieved savings such as 6% (Crowe et al. Citation2020) or 9% (Lin et al. Citation2022) gives a sense of the magnitude of untapped potential and the required urgency to better understand the nature and frequency of HVAC faults. In considering the factors that may limit operational savings potential, it has been reported that building analytics tools such as FDD can result in building operators experiencing data overload (Kramer et al. Citation2020), though the typical quantity of faults reported by FDD tools has not been studied in detail.
While energy savings potential from resolving operational faults in commercial buildings is now well documented, the exact nature and frequency of those operational faults has been less studied. Kim et al. carried out a comprehensive review on HVAC fault prevalence (Kim et al. Citation2021), to document the current state of knowledge, gaps and potential value of further research. The study featured a literature review (26 papers) and 25 expert interviews, synthesizing and documenting unmet needs and gaps. For example, the authors found little research to document occurrence and frequency of HVAC faults at the level of granularity, consistency, and scale desired by researchers, analytical tool developers, and building operators. Based on the study, the authors suggested a methodical assessment of HVAC fault prevalence to address knowledge gaps. The increasing adoption of FDD analytical tools presents an opportunity to gather granular HVAC fault data over an extended period, to address the questions raised in this study.
A comprehensive reporting of HVAC fault prevalence (for air handling units [AHUs] and air terminal units [ATUs] in the case of the current research project) can be valuable for several audiences:
Building operators can focus operations & maintenance (O&M) efforts on mitigating the most common and lingering fault types, and also plan for adequate resourcing for the expected quantity of faults reported;
FDD tool developers can enhance diagnostic algorithms, such as applying Bayesian inference to improve diagnostic accuracy, or developing algorithms to target faults that are found to be common;
Equipment manufacturers could alter design or selection of components that are found to frequently experience faults;
Researchers can determine the highest priority activities for further development & testing to better identify and more quickly resolve operational faults.
This paper presents findings from a comprehensive study of fault reporting for a subset of commercial building HVAC equipment (covering AHUs and ATUs). The study quantifies, through the introduction of four new fault reporting metrics and a methodical data analysis approach, how many faults are reported, and how frequently, for these common types of commercial HVAC systems. The impetus for this paper was to provide information that helps the audiences listed above to understand the patterns we found in fault reporting and to assess what that means for FDD tools and for the commercial building stock. This overarching objective is translated into:
What quantity of AHU/ATU faults are reported per building and per piece of equipment?
Which AHU/ATU faults are most commonly reported?
Which AHU/ATU faults persist/linger the most over time?
This paper presents a background literature review, research methods, data analysis results, discussion of the results and their implications, and summarizes conclusions and recommendations.
Literature review
As noted in the Introduction, Kim et al. (Citation2021) conducted a literature review relevant to the topic of commercial HVAC fault prevalence; across a body of 26 papers. That work concluded that there is a need for a methodical assessment of HVAC fault prevalence to address several knowledge gaps. Since publication of that comprehensive review article (which we do not duplicate here), additional papers of relevance to the topic have been published. For example, Katipamula et al. (Citation2021) analyzed project results from the application of Building Re-Tuning (a variant of EBCx). The study showed that the incidence of the top 20 opportunities recommended through Building Re-Tuning ranged between 23% and 74% across the 151 buildings and 140 opportunities at the system level (e.g., AHU, lighting, envelope, etc.).
Aguilera et al. (Citation2022) conducted a comprehensive review on common faults in 53 large-scale heat pumps. In the research, faults were characterized according to potential causes, mitigation or prevention implications as well as detection and diagnosis methods. A total of 129 faults, divided into 48 fault types, were identified in the heat pumps.
Torabi et al. (Citation2022) identified and categorized human-induced errors in variable air volume (VAV) AHU control systems (sensors, actuators, and sequencing logic) by reviewing the literature and conducting interviews with control expert professionals. The most common human-induced errors in VAV AHU control systems are classified, and examples from 11 interviews with industry professionals are listed for different building life cycle phases. However, the paper does not investigate the fault occurrence and distribution in terms of various components in HVAC systems, nor does it investigate equipment component failures caused by wear.
A few additional papers that are adjacent to the fault prevalence topic, but of less direct relevance, are also of note. Zhou and Dexter (Citation2009) developed estimates of fault impact of an actuator fault and air-side fouling fault in the cooling coil system of an AHU, but provided no analysis of data on actual occurrence of those faults. Carretero-Ayuso, Moreno-Cansado, and García-Sanz-Calcedo (Citation2020) evaluated design faults in HVAC systems and the recurrence of occupant complaints in response to those faults, with a dataset of 168 complaints in a residential application.
In addition to efforts focused on understanding HVAC fault occurrence, there has also been research to understand how faults relate to one another, how corrective actions can be managed by operators, and how the technology can be enhanced to automate corrective action. Chen et al. (Citation2021) developed and documented a standardized HVAC fault taxonomy that was employed by this study to enable granular definition of fault location and characteristics. In the context of managing a high quantity of reported faults, several publications address concepts concerning fault prioritization (Cook, Smith, and Meier Citation2012; Nzukam et al. Citation2019; Medal, Sunitiyoso, and Kim Citation2021). Further, the literature includes FDD-identified fault types demonstrated as having potential for automated fault correction (Lin et al. Citation2020; Pritoni et al. Citation2022). Finally, Ebrahimifakhar et al. (Citation2021) described the development of the methodology for the current paper, and illustrated the study approach with preliminary results for a subset of faults.
Method
The HVAC fault prevalence study involved multiple steps, from obtaining fault data to analyzing results:
Obtain and clean HVAC fault data & associated metadata;
Apply HVAC fault taxonomy and standard time resolution;
Calculate fault reporting prevalence metrics;
Analyze and chart results.
Each of these steps is described in detail below.
Obtaining and cleaning study data
Study data were drawn from six FDD software providers and one large building portfolio owner. The scope of the data request was limited to built-up air handlers (AHUs) and associated air terminal units (ATUs), and packaged rooftop HVAC units (RTUs). In total, we received data covering 3,660 AHUs, 53,865ATUs, and 7,974 RTUs. For 90% of the buildings covered by the study we received at least 12 months’ worth of reported faults, and in some cases over 24 months. In addition to receiving data on reported faults, we also received building metadata summarizing (at minimum) building type and building location. Metadata included full AHU/ATU equipment listings, including equipment for which there were no reported faults. To meet the study design objectives, FDD software was identified as a valuable source of data at scale. FDD data drawn from a relatively small number of software tools offers the benefit of some standardization (when compared to drawing directly from individual building automation systems [BAS]), and it may be assumed that data quality would have been checked in the course of developing and deploying fault detection rules. It is acknowledged that a study employing first-hand, site-level observations would ensure greater data accuracy; however, this would come at a cost that would limit this type of study to very few buildings and results that would be near impossible to generalize. Utilizing FDD data was viewed as offering a balance of scale and accuracy, but to better understand how this approach affects the results, some of the buildings that were included in the FDD reporting data were studied via intensive site visit measurements and analysis of BAS data. The details of the field verification portion of the study will be reported in a subsequent paper, but an overall conclusion from preliminary results is that the FDD data generally provided accurate insight into fault prevalence.
Data providers were consulted to gain a clear understanding of the data shared, for example:
Clarifying fault naming definitions;
Understanding linkages between different buildings and the inter-relationships between equipment;
Addressing data gaps and inconsistencies;
Clarifying date ranges over which buildings were monitored (i.e., the first and last dates of reported faults in a building are not necessarily the full monitoring time period);
Clarifying, where possible, the presence or absence of nonstandard components on specific buildings (e.g., a return air carbon dioxide sensor may not be present on all AHUs).
Once the data were fully reviewed, fault names and time intervals were standardized into a common format across the dataset.
Applying HVAC fault taxonomy and standard time resolution
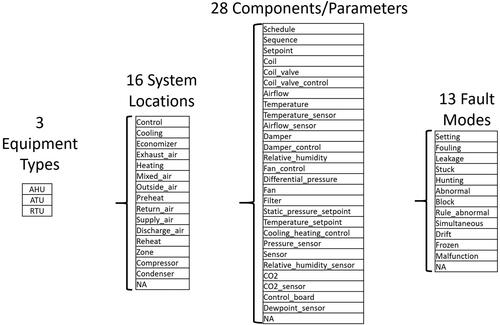
Applying a consistent fault naming structure is key to analyzing data from disparate sources. The data providers for the fault prevalence study all used unique fault naming approaches, and in some cases their datasets included several fault names for the same fault (e.g., they allowed FDD users to rename faults when initially configuring the software). For datasets covering AHUs/ATUs there were many hundreds of unique fault names (in one case there were 1,105 fault names). Through manual review, all raw fault names (i.e., names provided in datasets received from partners) were checked and, where applicable, manually mapped to standardized fault names based on the HVAC fault taxonomy published in Chen et al. (Citation2021). This taxonomy classifies HVAC faults at four levels:
Equipment type (currently limited to AHUs, ATUs, and RTUs)
Fault location in the system (e.g., supply air, mixed air, etc.)
Affected component or parameter (an example component is a temperature sensor, an example parameter is measured temperature)
Fault mode (e.g., frozen, stuck, abnormal)
An example of a fully resolved fault ID is “AHU-Supply_air-Temperature_sensor-Frozen,” where the levels are delimited by a dash (-), and words within a level are separated by an underscore (_). The taxonomy design allows for both condition-based (CB) faults and behavior-based (BB) faults. CB fault reporting specifies the component where the fault symptom is observed (e.g., return air temperature sensor frozen), whereas BB faults report the observed behavior without pinpointing the specific component (for example, ‘supply air temperature abnormal’ behavior could be due to a faulty sensor reading or the air temperature could truly be too high or low). Frank et al. (Citation2019) provided further detail on CB and BB fault definitions applied in this study. Although CB and BB faults can sometimes provide very different insight about root causes, and can potentially overlap, FDD software tools commonly report a mix of these fault types, so it makes sense to include both in a large scale fault reporting study.
Using this fault ID structure it is possible to analyze and aggregate data at various levels across the taxonomy. For example, the three-level fault ID “AHU-Supply_air-Temperature_sensor,” would be applied for reporting the prevalence of any of the possible faults on that specific component, regardless of the different fault modes that may have occurred (e.g., sensor frozen, drift, etc.).
In total, 1,563 fault names from the 7 data providers were mapped into 182 unique names for the study (in many cases multiple raw fault names were translated to a single mapped fault name for the study). illustrates the full scope of system locations, components/parameters, and fault modes represented in the study dataset (the identifier “NA” is used where a value could not be determined from the data provided). In this paper we document fault reporting based on the component or parameter experiencing the fault, i.e., fault mode is excluded. This reduces the list of unique fault names to a more manageable level for the purpose of addressing the main research questions.
Fig. 1. Fault naming framework used in the study.
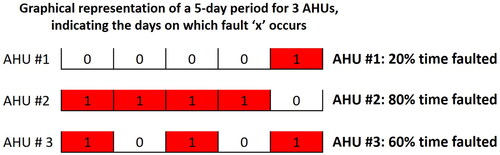
Raw fault reporting data were provided with different time resolutions, so following fault name mapping we standardized that representation to a common format, “binary daily fault” (BDF) format, where each row of BDF data represents a unique fault occurring on a specific piece of equipment on a specific date (Chen et al. Citation2022). BDF data uses a daily unit, irrespective of whether the raw fault data indicates fault symptoms were present for 1 h or 24 h on that specific day. provides a graphic representation of a given fault’s occurrence (represented by a “1”) across a short time frame for 3 pieces of equipment, as derived from BDF data.
Fig. 2. Percent Time Faulted (PTF) calculation concept (“1” represents a day on which a fault was reported).
Data analysis and metrics
Under this study, five HVAC fault reporting metrics were developed; four are described and reported here:
Percent of equipment experiencing a given fault (Pct_Affected);
Mean percent time faulted, applied to equipment experiencing a given fault at least once (MPTF_Affected);
Quantity of faults reported each month per building, per AHU, and per ATU;
Percent of equipment operating in a faulted state on any given day.
Pct_Affected represents the percent of the population of equipment for which a given fault was reported at least once in the study dataset, and is taken as a measure of how common a fault is. For example, cooling coil valve faults were reported on 35% of AHUs in the study dataset, whereas heating coil valve faults were reported on 22% of AHUs.
MPTF_Affected represents the mean percent time faulted for equipment that was affected by a given fault, and is a measure of how persistently a fault is reported (though ascertaining reasons for persistent reporting of faults is out of scope for this study). Percent time faulted (PTF) is calculated for a specific fault’s occurrence on a specific piece of equipment, as illustrated in and described in EquationEquation 1(1)
(1) .
(1)
(1)
where Fault_Dayi is the ith day on which the specific fault occurs on the specific piece of equipment (represented by a “1” in ), Equipment_Dayj is the jth day on which the specific equipment was monitored, n is the total number of days on which the specific fault occurs on the specific equipment (for any length of time), and m is the total number of days on which the specific equipment was monitored (e.g., the total number of days shown in ).
MPTF_Affected is the mean of the PTF values calculated for each piece of equipment in the study dataset (calculated separately for each fault reported on each piece of equipment), applied across the pieces of equipment on which the specific fault occurred (i.e., equipment/fault combinations with zero reported fault occurrences are excluded from MPTF_Affected), as described in EquationEquation 2(2)
(2) .
(2)
(2)
where is the PTF calculated from EquationEquation 1
(1)
(1) reported on the kth piece of equipment, n is the total number of the equipment, in which at least one occurrence of a given fault is reported in that piece of equipment in the data set.
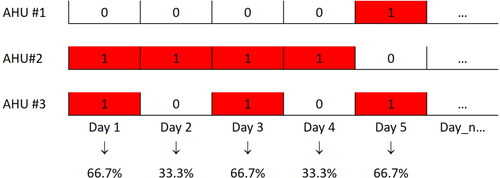
In 90% of cases, equipment includes a year or more of monitored days in the study dataset, though shows a 5-day time-series to illustrate the calculation approach. In this example, a given fault type has a PTF value of 20%, 80%, and 60% on the three individual AHUs, and the MPTF_Affected in this case would be the mean of those three values (53%).
Fig. 3. Illustration of method to calculate percent of equipment operating in a faulted state.
In addition to reporting the metrics described above, the results below also summarize the quantity of faults (within the scope of this study) reported each month per building, per AHU, and per ATU. Quantity of faults per month is calculated based on unique fault/equipment combinations and excludes duplicates, meaning:
One fault type (e.g., supply air temperature [SAT] sensor fault) being reported on two AHUs in the same building in a given month counts as two faults for that month;
One fault type being reported on an AHU multiple times in the same month counts as a single fault for that month.
Study data were also analyzed to calculate the portion of equipment operating in a faulted state on any given day, where “faulted” denotes a piece of equipment as having at least one fault reported on a given day. represents the approach to calculating the percent of equipment operating in a faulted state, where “1” indicates that one or more faults were reported on an AHU on a given day. indicates the percent of AHUs faulted for each day in a 5-day series, and the mean value across all days in this illustrative example is 53.3%.
When aggregating analysis results across the whole dataset for any given fault type, we excluded cases where that fault was not within the scope of a given FDD tool’s fault detection library (i.e., cases where zero fault reporting on a piece of equipment was due to lack of analytics to detect that specific fault, as opposed to being interpreted as fault-free operation).
At the time of writing, RTU fault reporting analysis is still being refined, and is not included here.
Results
FDD fault reporting analysis results are presented below, organized around the three key research questions: How many HVAC faults are reported per building and per piece of equipment? Which faults are most common? Which faults persist/linger most over time? Results are reported for buildings equipped with AHUs and ATUs. As noted above, fault-specific results (for the metrics Pct_Affected and MPTF_Affected) are presented at the component/parameter level, and do not include the specific fault mode.
Quantity of faults reported
As shown in , the average number of reported faults per building per month is 245; while giving a general indication of reporting quantity, buildings can vary significantly in terms of the quantity and complexity of installed equipment. When analyzing at the equipment level, we find an average of three faults reported per month for AHUs and one per month for ATUs. Based on these results per AHU and per ATU, a large building with 30 AHUs and 445 ATUs would, on average, see 535 reported faults per month, compared to a smaller building with 3 AHUs and 15 ATUs that would see 24 reported faults per month.
Table 1. Mean number of reported faults per month (AHU and ATU).
Moreover, a mean value of 40% of AHUs and 30% of ATUs were observed to be faulted (i.e., having at least one fault reported) on any given day across the study dataset (See for an illustrative example of how these values are calculated).
Most common faults
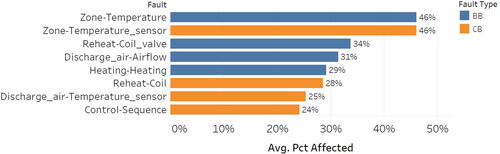
and show the average percentage of equipment (AHUs and ATUs respectively) affected by different faults, with higher values representing the most common faults. For brevity, the figures are limited to show faults with values 20% or higher, which accounts for 21 out of a total of 69 mapped faults for AHUs, and 8 out of a total of 20 mapped faults for ATUs. and show condition-based (CB) faults in orange and behavior-based (BB) faults in blue.
Fig. 4. Most commonly reported faults for AHUs, based on Pct_Affected value (chart shows faults 20% or higher).
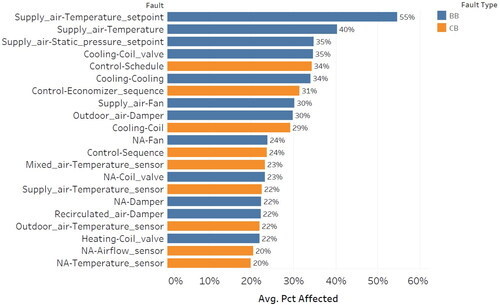
Fig. 5. Most commonly reported faults for ATUs, based on Pct_Affected value (chart shows faults 20% or higher).
Key observations from (AHUs) include:
The most common fault relates to supply air temperature (SAT) setpoint, appearing on 55% of AHUs in the study data set at some point. This is the only fault type to occur on over half the population of AHUs. This fault type relates to conditions where SAT setpoint is mismatched to measured conditions, such as temperature being higher/lower than setpoint or temperature not tracking setpoints. This is a BB fault, meaning that there could be many different potential causes, including problems in systems external to the AHU, such as the chilled water supply.
Behavior-based faults are prominent, representing the four most common, seven of the top ten most common, and over half (12 of 21) of the full set of most common faults.
The components most commonly affected by faults are sensors (5 faults with Pct_Affected value ≥20%), valves (3 faults with Pct_Affected value ≥20%), and dampers (3 faults with Pct_Affected value ≥20%).
The most common location for faults to be reported within the AHU is the supply air section (5 faults with Pct_Affected value ≥20%, including the top 3 most common faults).
Key observations from (ATUs) include:
The most commonly reported faults relate to faulty zone temperature sensors or abnormal zone temperature, each appearing on 46% of ATUs at some point in time.
The eight most commonly reported faults are evenly split between CB and BB faults.
Fault persistence over time
and indicate the percent of equipment for which certain faults are reported at some point in time, as a measure of how common a fault is. In contrast, and show the Mean Percent Time Faulted (MPTF_Affected) for AHUs and ATUs respectively, indicating the average portion of time a fault is reported (e.g., if the study data set covers 366 days for a given AHU, and a specific fault is reported on 183 of those days, the Percent Time Faulted value would be 50%). MPTF_Affected is a measure of how persistently/frequently a fault is reported over time, and is calculated only for those pieces of equipment on which a given fault occurred at some point across the data history. Therefore, the top value of 43% in does not mean that typical humidity sensors are faulted 43% of the time, but that humidity sensors that are faulted persist in reporting this fault 43% of the time. shows the 18 AHU faults with an MPTF_Affected value of 20% or greater, and shows 13 ATU faults.
Fig. 6. Mean Percent Time Faulted, for AHUs experiencing a given fault at least once (MPTF_Affected). Chart shows faults with MPTF_Affected of 20% or greater, i.e., a given fault is reported on 20% or more of the days across which a piece of equipment was monitored.
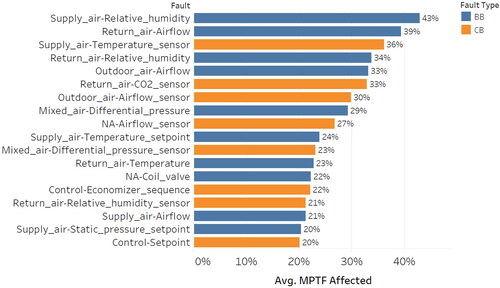
Fig. 7. Mean Percent Time Faulted, for ATUs experiencing a given fault at least once (MPTF_Affected). Excludes ATUs that never saw a given fault.
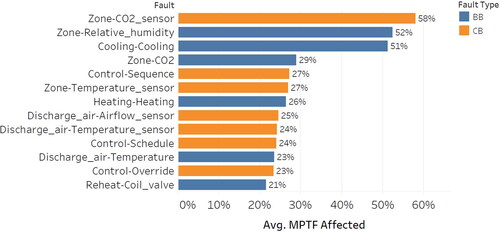
Key observations from (AHUs) include:
As with the Pct_Affected results (), the majority of faults (10 out of 18) that persist for at least 20% of the data history are BB fault types;
Supply air relative humidity faults are reported over the longest periods, close to half of the time (43%) on average;
Three of the top six faults shown in occur in the AHU return air section, and two are related to supply air; and
Nine faults are reported more than a quarter of the time (greater than 25% MPTF_Affected).
Key observations from (ATUs) include:
Three ATU faults are reported more than 50% of the time: Zone CO2 sensor, Zone relative humidity (RH), and cooling related faults. All other faults in are reported significantly less often (21% - 29% of the time);
Three of the top four faults shown in are BB faults, but BB faults make up the minority of faults overall (6 of the 13 shown);
shows results for 13 fault types, the majority of the total 20 ATU fault types covered in the study dataset, in contrast to which indicated only 8 ATU faults are commonly reported (Pct_Affected ≥20%). This illustrates that the most common faults do not necessarily correlate with the most persistently occurring faults.
Faults observed to be both common and persistent
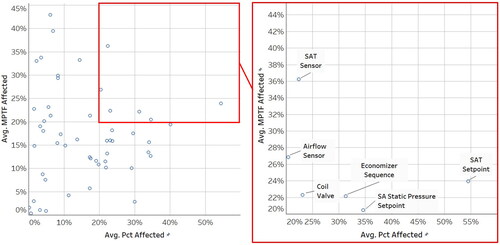
As shown in , six AHU fault types are reported on at least 20% of equipment (i.e., Pct_Affected ≥20%) and those faults are reported at least 20% of the time (i.e., MPTF_Affected ≥20%): supply air temperature setpoint, supply air static pressure setpoint, economizer sequence, supply air temperature sensor, coil valveFootnote1, and airflow sensor1.
Fig. 8. Scatter chart of Pct_Affected vs. MPTF_Affected for AHU faults, highlighting the six faults that are both common (Pct_Affected ≥20%) and persistent (MPTF_Affected ≥20%).
Five ATU fault types occur on at least 20% of equipment and have those faults occur at least 20% of the time (i.e., they are shown on and ): Zone temperature, reheat coil valve, discharge air temperature sensor, heating capacity faults, and faults relating to control sequences.
Discussion and implications of results
The fault reporting analysis results presented in this work offer signific2ant insights, enabled through the introduction of four new fault reporting metrics and a methodical data analysis approach. These research results have implications for motivating adoption of building data analytics tools, important analytics support services, priorities for O&M staff, and FDD algorithm development needs. We discuss each of these aspects in detail below, with additional consideration for the limitations in interpreting study results and the types of metrics applicable to the study of FDD fault reporting.
Implications for motivating adoption of building data analytics tools
Prior literature documented a median 9% whole building energy savings from FDD deployment, with less than two years’ simple payback. The results of this study demonstrated that the value proposition of FDD is not simply limited to identifying a short list of faults that could be uncovered without the support of analytics technology, or to a limited set of problematic equipment. Out of a total of 89 mapped faults for AHUs and ATUs, 29 faults were observed in at least 20% of the equipment in the study data set. On average, FDD reports three faults per AHU and one fault per ATU each month (median 245 airside faults per building per month). These results indicate the high quantity of faults reported, despite the study being limited only to AHU and ATU faults (i.e., excluding chillers, pumps, cooling towers, boilers, etc.). FDD technology can help building operators identify and prioritize reported faults, focusing on those that are most important to equipment health, comfort, energy and emissions. For example, a faulty AHU supply air temperature sensor (found to be both common and persistent in this study) could make occupied space temperature uncomfortable, and/or require excess reheat energy for terminal units. As another example, a valve that is cycling due to sensor error or a control sequence problem would be more likely to fail over time.
Support, services, and development recommended for FDD
FDD technology is designed to automate the process of identifying faults; operators are then tasked with addressing those faults. Emerging fault correction capabilities have been developed and demonstrated for a subset of HVAC fault types (Lin et al. Citation2020; Pritoni et al. Citation2022; Fernandez et al. Citation2009). Broader deployment of existing automated fault correction routines could significantly reduce the quantity of reported faults. For example, faults with SAT, discharge air temperature (DAT), and zone sensors’ calibration may be resolved automatically, and also heating or cooling coil valve hunting faults.
Based on the large number of HVAC system faults reported per month, developing fault prioritization methods/algorithms could have a significant impact on maximizing the benefits of FDD. Fault prioritization can ensure limited operational budgets are allocated where most beneficial for occupant comfort, maximizing operational savings, improving health, and increasing the reliability of buildings as grid assets. For example, zone temperature sensor faults, and ATU DAT sensor faults would impact occupant comfort and the ability to enact temporary zone temperature adjustments to reduce demand in response to a grid signal.
The naming taxonomy and metrics developed under this study, particularly Pct_Affected and MPTF_Affected, may be useful for FDD developers to assess fault reporting across their installed customer base. In contrast to this study, FDD vendors would have access to more detailed fault definitions and building automation system (BAS) trend data, as well as direct owner contact, so they can explore macro trends to inform better fault trigger thresholds, potential for predictive maintenance, insights into faults being ignored, root cause of lingering or recurrent faults, etc. This would require FDD developers to standardize their fault naming conventions & hierarchy, analogous to ongoing industry efforts to standardize BAS control point naming schemas/hierarchies.
Priorities for O&M staff time and attention
The results of this study emphasize the importance of scheduled sensor calibration. This is especially true of SAT sensors and airflow sensors for which common and persistent faults were reported. Beyond these two priority sensor types, faults relating to mixed air temperature (MAT) sensors, outdoor air temperature (OAT) sensors, and CO2 sensors were common or persistent. Sensor calibration issues not only affect HVAC system performance, they can also affect FDD algorithms’ ability to detect and diagnose more complex faults.
Anecdotally, economizer faults are believed to be a common HVAC problem area; the fault prevalence study results reinforce anecdotal evidence. Six economizer faults were observed to be common and five were persistent, with one economizer fault falling into both categories. A total of 18 economizer-related fault types were reported overall.
While not common, we observed several faults relating to relative humidity and airflow being persistent. This persistence aligns with anecdotal evidence that RH sensors and airflow measurement are prone to faults. These components are not always present in HVAC systems but, where installed, the results of this study suggest that O&M staff should develop remediation plans to deal with faults when they occur.
Recommended metrics for assessing FDD algorithm performance
Common test metrics such as false negative, false positive, and true positive can be applied to FDD algorithms’ detection and diagnostic performance. Given the high quantity of faults reported in this study, we hypothesize that false negative reporting is not likely a major practical issue. Gaining a deeper understanding of false positive and true positive detection would be valuable, especially for higher impact faults, but this area of research was out of scope for this study.
Study limitations
As noted earlier in the Method section, we consulted closely with study data providers to minimize data interpretation risks. Direct communications with data providers were complemented with data quality analysis to identify and address potential data anomalies. There remain some potential sources of uncertainty in results, however. For example, FDD tools may report false positives and false negatives, and there are likely differences in fault trigger thresholds between FDD tools. Our communications with data providers and data quality analysis were intended to reduce uncertainty in reported results, though it is not feasible to quantify that uncertainty within the scope of this work. It should also be noted that even though the study dataset is large and covers many building types and climate zones, it is a limited sample and not demonstrated to be representative of the U.S. commercial building stock; further, the data covers buildings/equipment of different ages/conditions and data monitoring periods varied between equipment. Study data may also be subject to availability bias; for example, building owners who have chosen to invest in FDD deployment may be more likely to own buildings that perform above average. By design, this study accepted and managed these data limitations as tradeoffs against the objective to source a large, highly detailed dataset from FDD historians (as opposed to gathering first-hand rigorous observations with lower uncertainty but limited to a very small number of buildings due to high cost).
Another limitation in the study results is the lack of data on why certain faults are reported persistently (i.e., having high MPTF_Affected values, as seen in and ). We can speculate on whether these faults are tolerated by building operators because they are perceived to have limited impact on building performance, are challenging and/or expensive to fully diagnose and resolve, or due to other reasons. Further research may be warranted in this area, in order to adequately prioritize and address root causes for persistent reporting.
Conclusions and future work
By mining FDD software output from multiple sources, harmonizing the outputs, and aggregating them using newly-developed fault reporting metrics, this study documents HVAC fault reporting characteristics at a level of detail not present in prior published work and also with a large breadth, from the combination of multiple vendors’ data. With a focus on AHUs and ATUs, we characterized the quantity, type, and persistence of the most commonly reported faults. FDD software has been demonstrated to achieve significant savings in prior studies, and the results of this study complement energy savings data with detail on the high incidence of certain faults and the overall diversity of fault types. Moreover, gaining an empirical understanding of the quantity of faults reported on a monthly basis adds quantitative data to prior reporting that building analytics software users are at risk of experiencing data overload (Kramer et al. Citation2020). Study results also reinforce the need to ensure that operations teams are adequately resourced (with in-house support or other third party commissioning/maintenance providers) to rapidly address reported faults and maintain optimal building performance. Recommended areas for further research and development include:
Extending research on fault reporting characteristics:
Extension of fault prevalence study to other HVAC equipment;
Deeper investigation of fault persistence, intermittency, and recurrence;
Characterization of the intensity of faults, such as the degree of sensor bias;
Study of the drivers that may correlate with fault prevalence.
FDD Algorithm development:
New fault self-correction algorithms for high prevalence faults;
Active testing and inference-based solutions to improve the diagnosis of behavior-based faults;
Standardized fault prioritization algorithms.
Estimation of nationwide energy and cost impacts associated with the distribution of faults found in this study may also be valuable to policymakers and program implementers as they work toward aggressive greenhouse gas reduction goals.
Acknowledgements
This work was supported by the Assistant Secretary for Energy Efficiency and Renewable Energy, Building Technologies Office, of the U.S. Department of Energy under Contract No. DE-AC02-05CH11231. The authors are grateful to Erika Gupta and Brian Walker at the U.S. Department of Energy for their support of this project. We are also grateful to the organizations who provided anonymized data for this study: BuildingFit (Bernhard), Cimetrics, Clockworks Analytics, Coppertree Analytics, Ezenics, the United States General Services Administration, and ProStar Energy Solutions.
Disclosure statement
No potential conflict of interest was reported by the authors.
Notes
1 Based on the data provided the exact type/location of coil valve (i.e., heating or cooling) and airflow sensor could not be determined
References
- Aguilera, J. J., W. Meesenburg, T. Ommen, W. B. Markussen, J. L. Poulsen, B. Zühlsdorf, and B. Elmegaard. 2022. A review of common faults in large-scale heat pumps. Renewable and Sustainable Energy Reviews 168 (October):112826. doi:10.1016/j.rser.2022.112826.
- Carretero-Ayuso, M. J., A. Moreno-Cansado, and J. García-Sanz-Calcedo. 2020. Evaluation of design faults in HVAC systems in housing: A study based on thermohygrometric variables. Science and Technology for the Built Environment 26 (2):177–84. doi:10.1080/23744731.2019.1611149.
- Chen, Y., E. Crowe, G. Lin, and J. Granderson. 2022. Integration of FDD data to aid HVAC system maintenance. In Proceedings of. the 9th ACM International Conference on Systems for Energy-Efficient Buildings, Cities, and Transportation, Boston. MA. doi:10.1145/3563357.3567405
- Chen, Y., G. Lin, E. Crowe, and J. Granderson. 2021. Development of a unified taxonomy for HVAC system faults. Energies 14 (17):5581. doi:10.3390/en14175581.
- Cook, J., D. Smith, and A. Meier. 2012. Coordinating fault detection, alarm management, and energy efficiency in a large corporate campus. In Proceedings of the 2012 ACEEE Summer Study on Energy Efficiency in Buildings. The American Council for an Energy-Efficient Economy.
- Crowe, E., E. Mills, T. Poeling, C. Curtin, D. Bjørnskov, L. Fischer, and J. Granderson. 2020. Building commissioning costs and savings across three decades and 1,500 North American buildings. Energy and Buildings 227:110408. doi:10.1016/j.enbuild.2020.110408.
- Ebrahimifakhar, A., D. P. Yuill, A. Smith, J. Granderson, E. Crowe, Y. Chen, and H. Reeve. 2021. Analysis of automated fault detection and diagnostics records as an indicator of HVAC fault prevalence: Methodology and preliminary results. In Proceedings of 6th International High Performance Buildings Conference, Paper 310088, West Lafayette, IN, May 24.
- Fernandez, N., M. R. Brambley, S. Katipamula, H. Cho, J. Goddard, and L. Dinh. 2009. Self-correcting HVAC controls project final report. Pacific Northwest National Laboratory.
- Fernandez, N., S. Katipamula, W. Wang, Y. Xie, and M. Zhao. 2018. Energy savings potential from improved building controls for the US commercial building sector. Energy Efficiency 11 (2):393–413. 2018. doi:10.1007/s12053-017-9569-5.
- Frank, S., G. Lin, X. Jin, R. Singla, A. Farthing, and J. Granderson. 2019. A performance evaluation framework for building fault detection and diagnosis algorithms. Energy and Buildings 192:84–92. doi:10.1016/j.enbuild.2019.03.024.
- Katipamula, S., R. M. Underhill, N. Fernandez, W. Kim, R. G. Lutes, and D. Taasevigen. 2021. Prevalence of typical operational problems and energy savings opportunities in U.S. commercial buildings. Energy and Buildings 253 (December):111544. doi:10.1016/j.enbuild.2021.111544.
- Kim, J., K. Trenbath, J. Granderson, Y. Chen, E. Crowe, H. Reeve, S. Newman, and P. Ehrlich. 2021. Research challenges and directions in HVAC fault prevalence. Science and Technology for the Built Environment 27 (5):624–40. doi:10.1080/23744731.2021.1898243.
- Kramer, H., C. Curtin, G. Lin, E. Crowe, and J. Granderson. 2020. Proving the business case for building analytics. Lawrence Berkeley National Laboratory. doi:10.20357/B7G022.
- Lawrence Berkeley National Laboratory (LBNL). 2021. A primer on organizational use of energy management and information systems (EMIS) (Second Edition). United States Department of Energy. https://betterbuildingssolutioncenter.energy.gov/sites/default/files/attachments/EMIS_Primer_Organizational_Use.pdf
- Lin, G., H. Kramer, V. Nibler, E. Crowe, and J. Granderson. 2022. Building analytics tool deployment at scale: benefits, costs, and deployment practices. Energies 15 (13):4858. doi:10.3390/en15134858.
- Lin, G., M. Pritoni, Y. Chen, and J. Granderson. 2020. Development and implementation of fault-correction algorithms in fault detection and diagnostics tools. Energies 13 (10):2598. doi:10.3390/en13102598%22. doi:10.3390/en13102598
- Medal, L., Y. Sunitiyoso, and A. A. Kim. 2021. Prioritizing decision factors of energy efficiency retrofit for facilities portfolio management. Journal of Management in Engineering 37 (2). doi:10.1061/(ASCE)ME.1943-5479.0000878
- Nzukam, C., D. Sauter, A. Voisin, and E. Levrat. 2019. Performances evaluation in view of Predictive Maintenance – A case study. In Proceedings of the 4th Conference on Control and Fault Tolerant Systems. (SysTol), Casablanca, Morocco. doi:10.1109/SYSTOL.2019.8864798
- Pritoni, M., G. Lin, Y. Chen, R. Vitti, C. Weyandt, and J. Granderson. 2022. From fault-detection to automated fault correction: A field study. Building and Environment 214:108900. doi:10.1016/j.buildenv.2022.108900.
- Roth, K. W., D. Westphalen, P. Llana, and M. Feng. 2004. The energy impact of faults in U.S. commercial buildings. In Proceedings of the International Refrigeration and Air Conditioning Conference. Paper 665.
- Satchwell, A., M. A. Piette, A. Khandekar, J. Granderson, N. M. Frick, R. Hledik, A. Faruqui, L. Lam, S. Ross, J. Cohen, et al. 2021. A national roadmap for grid-interactive efficient buildings. United States Department of Energy. https://eta-publications.lbl.gov/sites/default/files/a_national_roadmap_for_gebs_-_final_20210517.pdf
- Torabi, N., H. B. Gunay, W. O'Brien, and T. Barton. 2022. Common human errors in design, installation, and operation of VAV AHU control systems – a review and a practitioner interview. Building and Environment 221 (August):109333. doi:10.1016/j.buildenv.2022.109333.
- U.S. DOE. 2014. Commissioning for federal facilities. United States Department of Energy. https://www.wbdg.org/FFC/DOE/DOECRIT/commissioning_fed_facilities.pdf
- Zhou, Y., and A. Dexter. 2009. Estimating the size of incipient faults in HVAC equipment. HVAC&R Research 15 (1):151–63. doi:10.1080/10789669.2009.10390830.