?Mathematical formulae have been encoded as MathML and are displayed in this HTML version using MathJax in order to improve their display. Uncheck the box to turn MathJax off. This feature requires Javascript. Click on a formula to zoom.
Abstract
Refrigerants are a critical component of air conditioning and heat pump systems, but their high global warming potential has led to increasing concerns about their environmental impact. This research quantifies leakage from Schrader valves commonly used in air conditioning equipment. These valves serve as access points for refrigerant circuits and are often cited by service technicians as a source of leaks, contributing to greenhouse gas emissions. The study conducted laboratory testing of Schrader valves using an innovative experimental apparatus that tracked pressure and temperature of nitrogen gas contained by the valve over a 64-h test. The study found that 8 out of 61 used Schrader valves tested leaked at rates that would result in substantial refrigerant loss (M = 1,280 g/yr, SD = 3,168 g/yr, range = 9.4 to 9,117 g/yr). Gasketed caps were found to prevent refrigerant loss. Combining a Schrader valve with a gasketed cap significantly reduces the risk of leaks, and their use should be encouraged in air conditioning systems. The methodology developed for estimating leak rates from Schrader valves could be applied to other components in refrigeration systems, contributing to more comprehensive efforts to reduce refrigerant emissions.
Introduction
Refrigerants are used as the heat transfer fluid for air conditioning and heat pump systems. The most used refrigerants in residential and commercial building equipment are R-22 and R-410. These are potent greenhouse gases, with global warming potentials (GWP) of 1,810 and 2,088 times that of carbon dioxide, respectively (California Air Resources Board, n.d). Lower GWP refrigerants have been developed and are being commercialized, and California will prohibit use of refrigerants with GWP greater than 750 in most new air conditioning equipment as of January 1, 2025 (California Code of Regulations Citation2020). In consideration of high GWP refrigerants that will persist for next 20 years in existing air conditioning equipment and the continuing GWP concern for new refrigerants, containing and minimizing release of refrigerants to the atmosphere is critical.
The Western Cooling Efficiency Center (WCEC) at UC Davis conducted a recent study in a San Jose, California school district, which found that “R-22 emissions were estimated at 2.8% of system charge annually and R-410A emissions were estimated at 0.7% of system charge annually” (Pistochini et al. Citation2020). The lower leak rate observed for R-410a systems is counterintuitive, as they typically run at higher operating pressures than R-22 systems. At an ambient outdoor condition of 40 °C (104 °F), a typical high side operating gauge pressure is about 2960 kPa (430 psia) for R-410a and about 1840 kPa (270 psia) for R-22. The older age of the R-22 systems may explain the difference in observed leak rates, as R-22 systems were all manufactured prior to a ban on new R-22 systems that took effect in 2010. R-410A systems replaced R-22 systems in the market following the ban.
Analysis of a database for managing service calls determined that technicians noted Schrader valves used for servicing equipment as the most common leak location. Schrader valves are a common and convenient valve used to access the refrigerant circuits in most refrigeration and air conditioning equipment (). ASHRAE Standard 147, which aims to reduce refrigerant emissions, requires that Shrader valves be used with tethered metal caps and sealing O-rings designed for refrigeration systems (ASHRAE Citation2022). While those in the industry anecdotally report that uncapped valves are common, no data sources characterizing the prevalence of capped versus uncapped valves were found.
Fig. 1. Operational diagram with red circles highlighting gasketed surfaces and cut-away of a Schrader valve (HPAC Engineering Citation2023; HVAC Troubleshooting Citation2023).
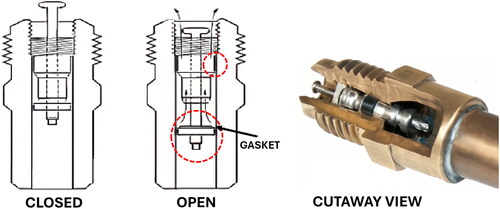
Schrader valves have two gaskets where leaks may occur. The first gasket seals the valve to the housing that it is installed in (, left, top red circle). A special tool is used to screw the threaded valve into the housing and torque the valve to seal the gasket against the housing to within the range of the industry standard, which is to .23 to .8 N⋅m (Schrader Pacific Advanced Valves, n.d.) (). Once the valve is installed, this seal is not further disturbed. The second seal is a spring-loaded gasket that seals when the pin is not depressed to force it open (, left, bottom red circle). Attaching a hose and a pressure gauge to measure refrigerant pressure depresses the pin. Each time a hose is attached and detached this seal is disturbed, making it more prone to failure than the other seal.
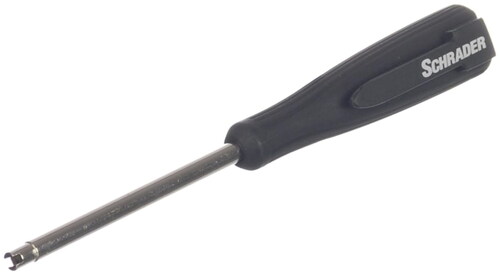
Fig. 2. Schrader valve core torque tool preset to 0.4 N⋅m (Schrader TPMS Solutions Citation2024).
Methods and data collection
Experimental apparatus
We developed an experimental apparatus to quantify the leak rate of Schrader valves in a laboratory. We constructed four small control volumes (), each as an independent test fixture. Each control volume was isolated by a refrigerant ball valve. The control volume had one Schrader port with a pressure sensor attached for continuous monitoring and a second Schrader valve under test. We acquired pressure and temperature data for each control volume with National Instruments Compact DAQ hardware and Labview software. Data was measured at 1 Hz, averaged, and saved at a 30 s interval. We continuously measured the temperature of each test fixture and reduced temperature fluctuations by housing the experimental apparatus in an insulated box inside the unconditioned laboratory. Over the course of all experiments, the temperature of the test fixtures was maintained between 17.5 and 26.8 °C. The maximum fluctuation over an individual test was 5.7 °C and the average was 2.5 °C.
Fig. 3. Test apparatus control volume.
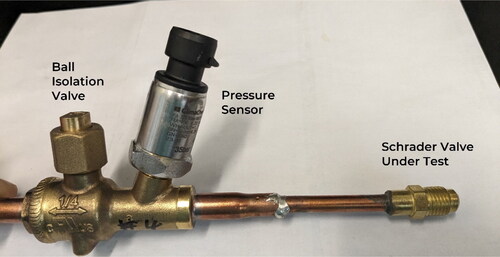
The control volumes were each connected to a refill tank to enable re-pressurization between tests. We charged each refill tank with 99.9% pure nitrogen gas at ∼2700kPa (∼390psia) to represent the operating pressure experienced by Schrader valves in air conditioning systems. We then used these tanks to refill our small control volumes for each test. Each control volume was isolated with the ball valve for the duration of leak test ().
Table 1. Sensors and data acquisition.
We chose nitrogen as the pressurization gas because it is inert, low cost, and one of the industry-standard gasses for pressure testing refrigerant systems (ASHRAE Citation2022). This simplified test system has the following limitations compared to an air conditioning system, in that the latter will have:
Compressor on/off cycles that change the operating temperatures and pressures of the refrigerant, as well as its density and viscosity,
Oil mixed in with the refrigerant that may change leak characteristics, and
Leaks of liquid refrigerant that are not considered here.
With these limitations in mind, is it helpful to compare the viscosity () of nitrogen and the most used refrigerants in small air conditioning systems, as the viscosity is the important physical property impacting leak rates in the laminar and turbulent flow regimes. In the laminar regime, the leak rate of refrigerant will be higher than nitrogen, as the viscosity of nitrogen is higher than the refrigerants (). The correction factor is
because the leak rate in the laminar regime is proportional to 1/
While the viscosity will also affect the leak rate in the turbulent regime, the relationship is non-linear and the difference in viscosity has less of an impact on leak rate than in the laminar regime. No corrections were made to account for differences in viscosity between nitrogen and refrigerant vapor since the details of the leak properties were not known. Thus, leaks in the laminar regime may be up to 30% greater than calculated in the results.
Table 2. Viscosity of gas at 300 K. For refrigerants the saturated vapor viscosity is shown.
Test procedure
We installed and removed the Schrader valves using the torque spec Schrader tool () that tightened the valve with a specification of .34 to .56 N⋅m. After the Schrader valve was installed, the control volume was pressurized and then the isolation valve was closed. To account for the fact that the temperature of the test fixture was not constant, we used the temperature of the fixture and the pressure of each control volume to continuously calculate the number of moles of gas remaining in the control volume using the ideal gas law:
where:
is absolute pressure [kPa]
The dominant source of measurement uncertainty in calculation of is associated with calculation of the volume. Calculation of the volume of the apparatus () requires nine measurements of wall thickness, lengths, and outer diameters. Each measurement was made twenty times with a pair of calipers. Then, a Monte Carlo simulation was used to calculate the volume 100,000 times by sampling with replacement from each distribution of measurements. Additionally, the Monte Carlo simulation assumed the calipers had three sources of uncertainty with the associated confidence intervals: linearity = 0.01 mm (95%), repeatability = 0.005 mm (95%), and calibration = 0.005 mm (95%). The resulting volume measurement with 95% confidence interval was 4,694 ± 686 mm3, which is an uncertainty of approximately 15%.
The small control volumes allowed us to measure and calculate leak rates using a short test duration. We continuously measured the pressure and temperature of each control volume for 64 h to characterize the loss of the gas in the control volume. We calculated the moles of gas above ambient pressure () (and therefore subject to leakage) by calculating the number of moles in the control volume at the current pressure and then subtracting the moles at ambient pressure and temperature.
where:
We characterized the tested valves as “not-leaking” or “leaking”. The experimental method allowed for characterizing a leak with a very low threshold: a loss of at least 0.0001 moles of nitrogen over the 64-h test period (1.6% of the small control volume). For valves that were characterized as leaking, we calculated at each 30 s timestep over the test period for the current pressure and temperature. We then fit an exponential decay function to the data series of
versus time:
where:
A [mol] and
Because HVAC systems contain a large mass of refrigerant existing in both the liquid and gas phases, we estimate that the operating pressure in the system would be relatively constant in the presence of a small leak until all liquid-phase refrigerants is lost. Therefore, we calculated the initial leak rate of the nitrogen system at 390 psia by taking the derivative of the exponential fit and evaluating the result at where the units of the leak rate is mols/hr:
The standard deviation of the curve fit parameters for A and were calculated and reported for each leaking valve (see Appendix). Then, a second Monte Carlo simulation was run to estimate the total uncertainty for
considering uncertainties in A,
and the control volume.
To present the data in more meaningful units, we assumed that the rate of refrigerant vapor loss would be equal to the rate of nitrogen gas loss and converted moles/hr to g/year by multiplying by the molecular weight of R-410A (72.6 g/mol) and 8,760 hrs/year. This means that the leak threshold of 0.0001 moles over 64 h equates to a refrigerant leak rate of 1 g/yr. Therefore, valves reported as “not leaking” were below the 1 g/yr threshold. Although our approach was different, our minimum leak detection threshold (1E-07 kg/hr) was similar to that for a method described by the US Environmental Protection Agency where a potential in situ leaking component is encased in a bag and the concentration of the leaked gas is measured over time (United States Environmental Protection Agency Citation1995). The advantage of our experimental approach is the ability to use nitrogen to characterize valve leakage rates, however, our approach cannot be used in operational equipment.
Valves and components tested
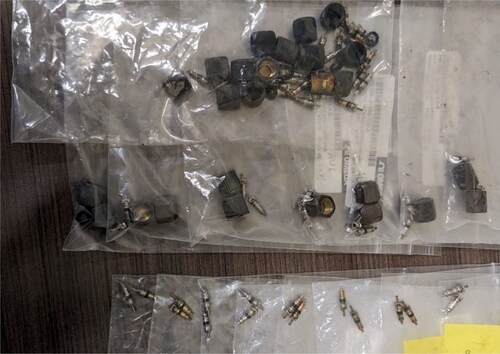
We purchased two new Schrader valves with non-locking gasketed caps for testing. We sourced a few used valves from an HVAC technician and collected most of the valves at a local air conditioner recycling center (). All the valves collected were in equipment that was being removed from service and recycled. The ages of the valves were unknown (since valves are replaceable, the valve may not be as old as the equipment). Additionally, we could not determine the age of the equipment from which the valves were removed because the HVAC system labels were generally inaccessible. Many of the refrigerant coils containing the valves had been separated from the HVAC system. The caps (if present) and valve cores were removed from the systems and placed in bags (). The caps recovered were non-locking gasketed caps. Tested valves were numbered for convenience based on the source of the valve. Valves labeled “v” were procured from a unit in a service company’s storage yard, valves labeled “r” were procured from complete units at the recycling center, and valves labeled “br” were procured from coils at the recycling center.
Fig. 4. Recycling center with complete units (left) and standalone coils (right) that valves were sourced from.
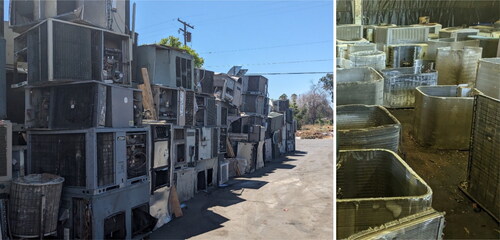
Fig. 5. Valves and caps removed from copper tubing and bagged (right).
Results
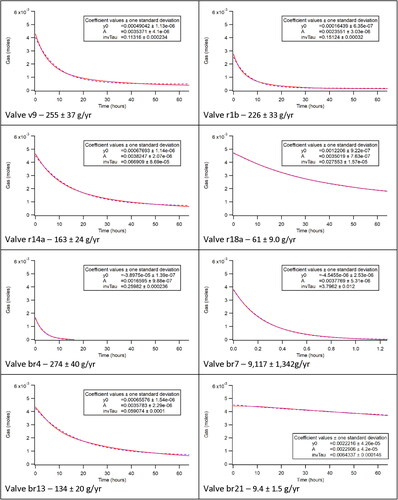
We observed no leakage in two new valves tested and observed leakage in eight out of 61 used valves tested (12%). A wide range of leak rates was estimated for the eight leaking valves (9.4 ± 1.5 to 9,117 ± 1342 g/yr) (). The leakage data and the associated curve fits used to calculate these results are included in the Appendix.
Table 3. Test results and estimated leak rates.
Valves r14a and v9 were retested in a series of four tests (). Estimated leak rates were within 10% when the valve was undisturbed between Tests 2 and 3. Disturbing the valve (removal and reinstallation or depressing the valve stem) resulted in a change in the estimated leak rate. This suggests a change in the leak size and/or shape occurs when the valve opens and closes.
Table 4. Estimated leak rates for repeat testing of same valve.
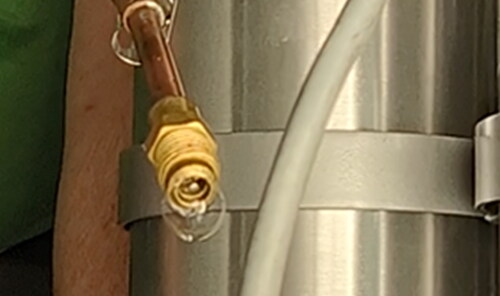
The two instances of very high leak rates (9,117 ± 1,342 and 18,065 ± 2,641 g/yr) were immediately obvious upon valve pressurization and a hissing noise was present. The lower leak rates (893 ± 131 g/yr and lower) were not immediately obvious and no noise was observed. We sprayed soapy water on valve r14a and v9 during the third test of these valves and detected soap bubbles, indicating that leaks of this magnitude (416 ± 61 and 854 ± 125 g/yr) can be detected with this method ( and ). We did not evaluate if the soap bubble method can detect smaller leaks.
Fig. 6. Soap bubble observed during leak test with soapy water of valve v9.
We tested five (three new and two used) brass caps with gaskets that had the Schrader valve stem removed, meaning that the cap was only the barrier to the loss of refrigerant. This simulates a worst-case scenario where the valve has a major leak. No caps leaked in testing. While testing a larger number of caps may demonstrate leakage in some percentage of caps, actual refrigerant loss would only happen when both the valve and the cap leak simultaneously. For example, if 10% of valves leak and 1% of caps leak, refrigerant loss would happen in capped valves on average only 0.1% of the time. This calculation is provided for illustrative purposes on the benefits of having a two-point system to stops leaks. The frequency of leaks for caps is unknown and could effectively be zero.
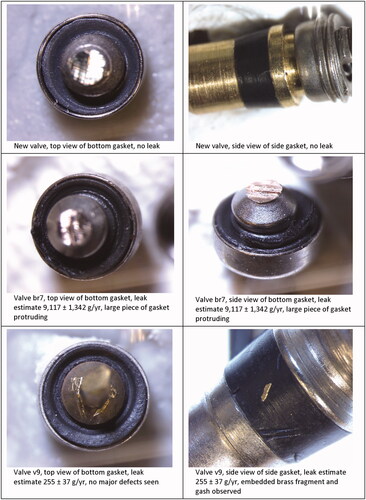
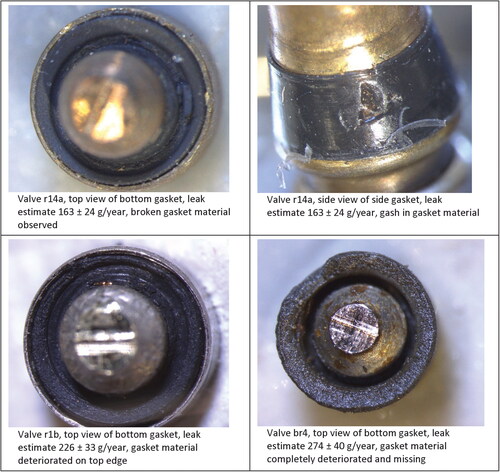
We used a compound microscope with magnification set to 20–30X to photograph the gasketed surfaces of the leaking valves. The valves were carefully cut in half without disturbing the gasket material. This destroyed the valves so that no further leak testing could be done. The images show a range of imperfections of the gasket material, although we cannot say conclusively that a particular defect is associated with a specific leak rate measured. Images show the following types of failures: piece of gasket torn and protruding, a piece of embedded brass fragment in the gasket, a gash in the side of the gasket, a piece of gasket broken off, and deteriorated gasket material. Pictures of new gaskets are shown for comparison ().
Fig. 7. Photos of a new gaskets and defects in leaking gaskets.
Conclusions and recommendations
Experimental testing of new and used Schrader valves found no measurable leaks in two new valves tested and measurable leaks in six out of 49 used valves tested (12%). A wide range of leak rates was estimated for the six leaking valves (9.4 ± 1.5 to 9,117 ± 1342 g/yr). Images of the gaskets obtained with a compound microscope show a variety of defects with the gaskets including deterioration and broken pieces.
The sample size of used valves tested here is small and the convenience sampling from end-of-life equipment may not accurately represent the population of in-service valves. The average age of the valves in the recycling yard is expected to exceed the average life of in-service valves. Therefore, the percentage of leaking valves observed here is likely to exceed the population average. This study could be extended to randomly sample valves from in-service equipment by removing existing valves for testing and replacing them with new valves.
Five gasketed caps tested (three new and two used) were effective at preventing refrigerant loss even when no valve was installed (as a simulation for a worst-case scenario for when a valve has a major leak). Installing gasketed caps on service ports is expected to substantially reduce or eliminate refrigerant loss. A combination of a valve and cap in series requires two simultaneous points of failure for a leak to occur. It is unknown how commonly gasketed caps are installed in air conditioning equipment as they can easily be removed and lost. A study surveying existing equipment across field sites could quantify their use. Compliance with ASHRAE 147 to tether caps to systems could help increase their use and persistence. Another more permanent solution would be for manufacturers to modify new equipment to use a different type of service valve less subject to leakage. Because these additional valves would increase cost without adding a clear competitive market advantage, a change of this magnitude would likely require regulatory action by an agency seeking to limit refrigerant emissions.
To our knowledge, this is the first published report demonstrating a methodology to estimate refrigerant leak rates from Schrader valves using a small, pressurized control volume to complete the testing in a few days for each valve. A challenge of this methodology is the uncertainty in calculating the volume of the fixture that contains the compressed nitrogen. A larger volume would be easier to measure with reduced uncertainty; however, it would decrease the resolution of the pressure drop as gas is lost due to a leak. In this case, the volume of the fixture was estimated using calipers. Other measurement methods are possible, such as filling the fixture with a measured amount of low-surface tension liquid. This methodology could also be applied to measure leak rates in other components of refrigeration systems, such as quick-connect fittings that are commonly used for installation of split systems.
Disclosure statement
No potential conflict of interest was reported by the author(s).
Additional information
Funding
References
- ASHRAE. 2022. ANSI/ASHRAE Standard 15-2022 Safety Standard for Refrigeration Systems. Peachtree Corners, GA: ASHRAE.
- California Air Resources Board. n.d. “High-GWP Refrigerants.” Accessed August 02, 2023. https://ww2.arb.ca.gov/resources/documents/high-gwp-refrigerants.
- California Code of Regulations, Title 17 § 95374, 2020.
- Geller, V. Z., D. Bivens, and and, and A. Yokozeki. 2000. “Viscosity of Mixed Refrigerants, R404A, R407C, and R410A, and R507C.” In International Refrigeration and Air Conditioning.
- HPAC Engineering. 2023. “Valve Selection Curcial in System Design.” Accessed October 30, 2023. https://www.hpac.com/air-conditioning/article/20928379/valve-selection-crucial-in-system-design.
- HVAC Troubleshooting. 2023. “Refrigeration System Service Valves – Schrader Valve.” Accessed October 30, 2023. http://www.hvacspecialists.info/service/consideration/refrigeration-system-service-valves-schrader-valve.html.
- Kongo, M., and S. Takahashi. 1982. Viscosity of Chlorodifluoromethane (R22) at High Pressures. Journal of Chemical Engineering of Japan 15 (2):155–8. “ 10.1252/jcej.15.155
- Pistochini, T., R. Silveira, D. Ross, R. McMurry, and A. Umarani. 2020. Analysis of Refrigerant Use For Maintenance and Operations of Air Conditioning Equipment at A School District. Davis, CA: Western Cooling Efficiency Center at UC Davis.
- Schrader Pacific Advanced Valves. n.d. “A/C Valve Cores.” Accessed October 08, 2023. https://schrader-pacific.com/wp-content/uploads/2021/06/AC-Valve-Application-and-Installation-Manual.pdf.
- Schrader TPMS Solutions. 2024. “Part No. 20141 Schrader Valve Core Torque Tool.” Accessed May 30, 2024. https://catalogue.schradertpms.com/en-US/ProductDetails/20141.html.
- The Engineering Toolbox. 2023. “Nitrogen – Dynamic and Kinematic Viscosity vs. Temperature and Pressure.” Accessed October 08, 2023. https://www.engineeringtoolbox.com/nitrogen-N2-dynamic-kinematic-viscosity-temperature-pressure-d_2067.html.
- United States Environmental Protection Agency. 1995. Protocol for Equipment Leak Estimates. Research Triangle Park, NC: United States Environmental Protection Agency.
Appendix
Fig. A1. Moles of nitrogen gas vs time for each valve characterized as leaking and estimated corresponding refrigerant leak rate. The solid line is the measured data and the dashed line is the exponential fit.