
 ?Mathematical formulae have been encoded as MathML and are displayed in this HTML version using MathJax in order to improve their display. Uncheck the box to turn MathJax off. This feature requires Javascript. Click on a formula to zoom.
Abstract
Air cleaning reduces indoor exposure to fine particulate matter (PM2.5) during wildfire smoke events. However, resource and cost constraints may limit access to air cleaning during such an event, as both commercial devices and the higher-rated MERV filters that do-it-yourself (DIY) assemblies typically rely upon tend to be expensive and in short supply. With these constraints in mind, we developed and evaluated several configurations of a novel, DIY air cleaner that uses common household fabrics as filtration media. Clean air delivery rates (CADRs) of the devices were experimentally evaluated in two ways: first, with independent measurements of flowrates and single pass removal efficiencies, and second, via pull-down testing in a large chamber. With two layers of cotton batting fabric and a flowrate-increasing cardboard shroud attached, the device achieved particulate matter CADRs of 162, 134, and 206 m3/h in 0.02–0.3, 0.3–1, and 1–2.5 µm particle diameter bins, respectively, during chamber testing. Results indicate that these simple, inexpensive, fabric configurations can meaningfully reduce PM2.5 levels in smaller zones of a home, and thus represent a viable option for improving indoor air quality during rapid-onset air pollution events, such as wildfires.
1. Introduction
Though outdoor air quality has been steadily improving in the United States since the passing of the Clean Air Act in 1963 (Environmental Protection Agency Citation2020a), the number of acres burned due to wildfires each year has grown significantly (Hoover and Hanson Citation2023; Abatzoglou and Williams Citation2016), generating emissions that are reversing this progress (McClure and Jaffe Citation2018). Wildfires pose a hazard to human health by increasing air pollutants such as fine particulate matter (PM2.5) to levels that increase respiratory morbidity (Liu et al. Citation2017; Reid et al. Citation2016; Reid and Maestas Citation2019) and can exacerbate adverse cardiovascular effects (Chen et al. Citation2021), especially in vulnerable populations such as children and the elderly (Liu et al. Citation2015; Holm, Miller, and Balmes Citation2021; Henry et al. Citation2021). While health agencies generally recommend sheltering indoors to reduce exposure to wildfire smoke, outdoor air (along with PM2.5) infiltrates all building envelopes (Park et al. Citation2021; Xu et al. Citation2017). While staying indoors during a rapid-onset wildfire smoke event may be beneficial, active air cleaning systems are necessary to substantially reduce indoor air pollutant concentrations.
Indoor air cleaning interventions have been proven to reduce exposure to PM2.5 during a wildfire smoke event (Holder, Halliday, and Virtaranta Citation2022; Stauffer et al. Citation2020; Henderson, Milford, and Miller Citation2005; Stinson, Laguerre, and Gall Citation2024). Efficacious air cleaners typically rely upon a fan to move air through a mechanical or fibrous media air filter in order to remove particles (United States Environmental Protection Agency Indoor Environmental Division Citation2009). However, traditional MERV and HEPA filters may be cost-prohibitive (Castillo et al. Citation2024), in short supply, or in many cases, unavailable during such an occurrence, as was observed during the Western U.S. wildfires of late 2020. Thus, it is critical that new, low-cost, rapidly deployable solutions are developed to help those affected by degraded air quality during wildfire smoke events. Access to these solutions may improve human health, quality of life, and in some cases, prevent untimely death.
With such cost and resource constraints in mind, we developed a prototype air cleaner that utilizes affordable, common household fabrics to create low-cost particle filters that can be attached to a box fan. This design allows for the creation of a large surface area of reusable filter, enabling the box fan to move high flowrates of air across the material. To verify the device’s general effectiveness, we conducted a preliminary field study in two residential homes. A target clean air delivery rate (CADR)—or the volumetric flowrate of clean air that an air cleaner is capable of distributing to an indoor space—was modeled based on the United States Environmental Protection Agency’s (U.S. EPA’s) Cleaner Indoor Air During Wildfires Challenge (Environmental Protection Agency Citation2020b), which tasked researchers with developing a solution that reduces indoor PM2.5 concentrations by 80% within an hour in a 14 m2 room with 2.4 m ceilings, all while operating at less than 45 decibels and costing less than $100. Field study results indicated that PM2.5 CADRs in excess of 150 m3/h were achievable; according to our model, the design was capable of meeting U.S. EPA Challenge criteria. While these results were encouraging, the field study was exploratory and not well-controlled. Thus, two independent, laboratory-based experimental efforts were pursued with the goal of rigorously evaluating our proposed design and investigating alterations that could increase its CADR. Details of the target CADR modeling and field study are discussed subsequently and in Appendices A and B.
In this paper, we present and discuss the results of the laboratory efforts to design, build, characterize, and improve a novel, low-cost solution for air cleaning during wildfire events. We also evaluate do-it-yourself (DIY) solutions that use MERV 13 filters that are increasingly popular—namely a single filter affixed to a box fan and the Corsi-Rosenthal Box. There is limited data in the literature regarding MERV 13 DIY air cleaner performance under indoor wildfire smoke conditions and, to our knowledge, the fabric-based designs developed as part of this work have not been experimentally evaluated. Our design is simple, effective, and inexpensive, such that it represents a viable option for improving indoor air quality during a wildfire event.
2. Materials and methods
The aim of this study was to evaluate low-cost air cleaner designs that employ a box fan to move air across a variety of particle filtration materials. After modeling an effective air cleaner during a wildfire event to determine a minimum target CADR (127 m3/h, described in Appendix A), field testing was conducted in two residential homes to verify the general effectiveness of the device (Appendix B). In a bedroom-sized environment, the device realized an average CADR ∼40% greater than the target CADR, and thus two phases of controlled experimental measurements were carried out. Sections 2.2.1 and 2.2.2 describe what will subsequently be referred to as “laboratory testing”, where air flowrates and single-pass removal efficiencies were characterized separately to determine CADRs from the product of these parameters. Section 2.2.3 describes what will be referred to as “large-scale chamber testing”, where a method of particle injection and decay within a 17.8 m3 chamber allowed determination of CADRs from measured particle loss rates. Results presented include a comparison of independent CADR estimates of the prototype air cleaner made using both testing approaches.
2.1. Low-cost air cleaner materials
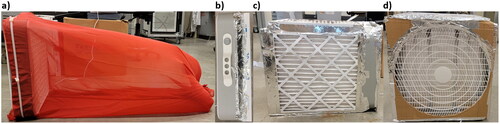
During laboratory testing, five fabrics (cotton batting, polyester, flannel, felt, and chiffon, all purchased from JOANN Fabric and Crafts) were sewn at both ends into 1–1.8 m long, 2.26–3.32 m2 “windsocks” (the length and surface area depending on the fabric) and affixed to a 53 × 57 × 13 cm box fan (Comfort Zone, Model CZ200A) with zip ties (). The side of the windsock that was not attached to the fan was folded neatly three times from the bottom and tied 8 cm from its end with two double-looped rubber bands. Two additional device configurations were tested for comparison during this phase: a single 51 × 51 × 5 cm filter (Tex-Air Filters, MERV 13) () and a modified Corsi-Rosenthal Box (which consisted of four MERV 13 filters arranged to form a cube, shown in ), both affixed to the same box fan with aluminum foil tape (TapePlus). Small swatches of each of the fabrics and a MERV 13 filter were cut and attached to filter holders with two, double-looped rubber bands during single-pass removal efficiency testing (Section 2.2.2). During large-scale chamber testing, two new cotton batting filters were sewn to fit snugly around a 53 × 61 × 18 cm box fan (Air King, Model 9723). A flowrate-increasing shroud () was cut from cardboard and attached to the outlet side of the box fan during select experiments.
Fig. 1. Images of the low-cost air cleaner with a (a) chiffon fabric filter, (b) single MERV 13 filter, (c) cube of MERV 13 filters (modified Corsi-Rosenthal box), and (d) cardboard shroud affixed to the box fan’s outlet side.
Additionally, triplicate CADR testing was conducted in the chamber with a single cotton batting filter and Comfort Zone box fan in order to directly compare results across the two experimental methods. presents the experimental testing matrix, including filter type, device configuration, test condition, and cost information at the time of the experimental campaign. Note that depending on the device configuration, total cost may include zip ties, rubber bands, sewing thread, foil tape, and cardboard, but excludes materials that may be necessary for construction but are not part of the finished device (sewing needles, box cutters, etc.).
Table 1. Experimental testing matrix including fabric or furnace filter type, additional configuration information where applicable, test condition, filter cost, and total cost of the device at the time of testing.
2.2. Experimental methods
2.2.1. Air flowrates
In order to measure air flowrates through the various air cleaners, a makeshift ducting system was constructed in the laboratory; a 0.6 × 0.6 m, 1.5 m long section of galvanized steel ducting was affixed to a 0.6 × 0.6 m, 1.7 m long section of cardboard ducting with aluminum foil tape ().
Fig. 2. Schematic of air flowrate testing apparatus.
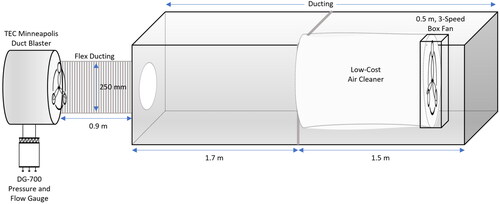
Dissimilar materials were selected due to time and cost constraints and to ensure a sufficient length of ducting—material composition was of low priority given the purpose of the experiment was to measure only air flowrates. On the metal side, the air cleaner assembly was placed near the intake (, right side of duct); gaps were closed with cardboard that was sealed with aluminum foil tape. A hot wire anemometer (TSI Alnor CompuFlow, Model 8585) was used to inspect for airflows around seals, consistently measuring <0.01 m/s. On the outlet side of the makeshift duct (, left side of duct), a piece of cardboard with a 250 mm diameter hole cut through its center was attached with aluminum foil tape; this allowed for connection via flex ducting to a calibrated fan (The Energy Conservatory, Minneapolis Duct Blaster). The flex ducting was sealed to the duct blaster fan and included a flow conditioner secured to its outer edge, which was equipped with the appropriate duct blaster ring, chosen based on its airflow range. A variable fan speed controller, used to adjust fan speed, and a pressure gauge (The Energy Conservatory, DG-700, accuracy ± 1%) were attached to the duct blaster fan via three pieces of 25 mm diameter tubing.
Prior studies show particle removal efficiency varies as a function of face velocity (Drewnick et al. Citation2021) and thus this parameter was necessary to inform subsequent single-pass removal efficiency experiments. Filter face velocities are often calculated from the continuity equation using a measured flowrate and projected surface area of filter (McDade, Dillner, and Indresand Citation2009). Effective face velocities were calculated as the summation of the area of a cylinder (main body) and cone (end) for fabric-based devices and the area of a MERV 13 filter with pleats flattened for MERV 13 filter-based devices. To measure flowrates, the pressure matching method (Minneapolis Duct Blaster Operation Manual Citation2011) was employed within the section of ducting for each configuration of the air cleaner.
The airflow testing matrix consisted of eight air cleaner configurations, run at three fan speeds each (low, medium, and high): the box fan with five different fabrics affixed to it (cotton batting, polyester, flannel, felt, and chiffon), the box fan with a single MERV 13 filter attached, the modified Corsi-Rosenthal Box, and the fan itself, as a control. The configurations with MERV 13 filters were tested both with and without a flow-enhancing shroud; a hole approximately equal to the diameter of the fan blades was cut into a 0.5 × 0.5 m piece of cardboard and affixed to the outlet side of the box fan. At each fan speed, flowrates were continuously averaged within the ducting over one minute in triplicate, and then the average of the three trials was taken. Between each trial, the air cleaner and duct blaster fan were powered off for a minimum of thirty seconds.
2.2.2. Single-pass removal efficiencies
To directly measure the single-pass removal efficiency of particles across filter material samples (the five chosen fabrics and MERV 13 filter), a bench-scale testing apparatus was constructed ().
Fig. 3. Schematic of single-pass removal efficiency testing apparatus.
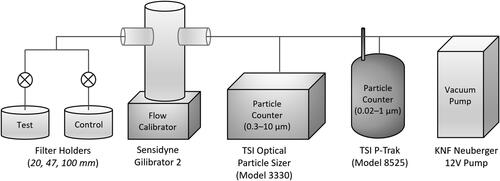
A vacuum pump (KNF Neuberger 12 V pump, Model NMP830KNDC) was used to draw air through the apparatus, which consisted of a primary flow calibrator (Sensidyne Gilibrator 2), used to measure flowrates, an optical particle sizer (TSI, Model 3330), which measured particles from 0.3 to 10 µm in 16 adjustable size channels in one second intervals, and a condensation particle counter (TSI, Model 8525), which measured total particle counts from 0.02 to 1 µm in one second intervals. Because the diameter ranges of the two particle counting instruments overlapped, particle number concentrations between 0.3 and 1 µm were subtracted from the optical particle sizer’s data to determine particle number concentration in a 0.02–0.3 µm size bin. Duplicates of three filter holders were constructed at diameters of 20-, 47-, and 100-mm. Conductive tubing (0.95 cm outer diameter, Bev-A-Line), cut at the minimum length possible, was used to reduce particle deposition to tubing walls.
As previously stated, our aim was to conduct bench-scale removal efficiency testing at face velocities representative of a full-scale device. Air flowrate results from the pressure matching test were used to calculate the face velocity of the air cleaner, which is given by the quotient of air flowrate (m3/h) and fabric surface area (m2). The diameter of filter holder necessary to match this face velocity during single-pass removal efficiency testing was back-calculated; diameters ranged from 24–108 mm. This range informed the selection of filter holders for testing (20-, 47-, and 100-mm) to encompass full-scale air cleaner device face velocities. in Appendix C presents total surface area (m2), face velocity (m/s), and filter holder diameter (mm) necessary to match face velocities across experiments for each of the air cleaner configurations at three fan speeds.
Air flowrates through the system were held constant at 4 L/min; they were measured using the primary flow calibrator, which was removed from the apparatus prior to particle testing. Samples of each of the five fabrics and a MERV 13 filter were cut and secured with two double-looped rubber bands to the test filter holder (, ‘Test’). This sample and a duplicate control filter holder with no sample attached (, ‘Control’) were exposed to simulated wildfire smoke conditions, achieved with the burning of wood-based incense (Indo Lao Shan Sandalwood Incense Powder) via a countertop hot plate (Elite Gourmet ESB-301BF). While biomass burning aerosol is likely to vary as a function of fuel, combustion conditions, and transport time, the challenge aerosol was selected based on compatibility with the experimental apparatus, was generated in a consistent manner, and was relevant to the air cleaner’s intended use, despite potential differences in emission factors when compared to active wildfires. Particulate matter concentrations were elevated to a maximum of ∼3000 particles/cm3 (the detection limit of the Model 3330 particle counter, which measures particles in the 0.3 to 10 µm range) inside of a 0.6 × 0.6 m, 1.5 m long section of well-sealed galvanized steel ducting. A manual switching valve (via two ball valves placed downstream of each filter holder) allowed for alternation of sampling between the test and control filter holders in 150 s intervals for 15 min. Each fabric/face velocity combination was tested in duplicate.
2.2.3. Large-scale chamber testing
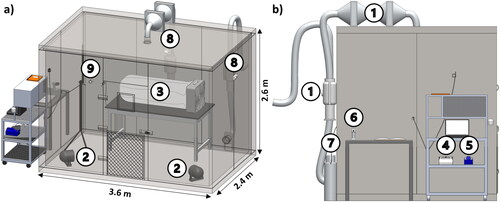
Large-scale chamber testing was conducted in an insulated, 3.6 × 2.4 × 2.6 m stainless steel chamber (with an interior volume of 17.8 m3), outfitted with supply and exhaust fans (TD-150S, Soler & Palau, USA) to ventilate the chamber at the conclusion of each experiment; ventilation fans were off during testing. Two three-speed desk fans (Vornado, Model CR1-0120-06) were placed in opposite corners of the chamber and operated at their highest setting to achieve well-mixed conditions, confirmed via multi-point CO2 testing. Briefly, eight low-cost CO2 sensors (Sensirion, Model SCD30, accuracy ± 30 ppm)—calibrated at known CO2 concentrations using a non-dispersive, infrared gas analyzer (Licor LI-820, accuracy <3% of reading)—were distributed at heights of either ∼0.1, 1.2, or 2.3 m from the chamber’s floor; three sensors were placed in the center of the chamber and the remaining five were positioned along its walls. Measurements were taken in three-second intervals while the chamber was sealed, the ventilation system was disengaged, and only the mixing fans were operating. CO2 concentrations throughout the chamber varied <10%, 25–40 s after CO2 injection, indicating well-mixed conditions. The air cleaner was placed atop a 0.75 m tall table against the back center wall of the chamber. The TSI Model 3330 and Model 8525 particle counters were again used to measure concentrations in the 0.02–1 µm and 0.3–10 µm ranges, respectively; a manual switching valve allowed for sampling inside and outside of the chamber. For the challenge aerosol, 0.25 g of pine needles local to the region (Portland, Oregon) were burned via a food smoking gun (Breville, Model BSM600SIL) for approximately six seconds. To calculate the air exchange rate of the chamber, CO2 was injected at the same time as the challenge aerosol. CO2 inside and outside of the chamber was measured with battery-powered loggers (Onset, HOBO MX1102)—these devices also measured temperature and relative humidity. presents a 3D model of the chamber, emphasizing relevant features and instrumentation.
Fig. 4. 3D model of testing chamber at (a) isometric and (b) left side views. Numeric icons correspond to chamber features and instrumentation in the order they were described in the manuscript: (1) ventilation system, (2) mixing fans, (3) air cleaner, (4) optical particle sizer, (5) condensation particle counter, (6) food smoking gun used for particle injection, (7) CO2 canister, (8) CO2 monitors, and (9) injection port.
Because the cotton batting fabric filter yielded the highest predicted CADR during laboratory testing, it was chosen for further analysis in the large-scale chamber. In addition to testing the device with a single layer of fabric attached, it was also tested with a second layer of cotton batting fabric, which we predicted would increase removal efficiency, and a second layer of cotton fabric paired with an air flowrate-increasing shroud, which we predicted would increase flowrate. During all trials the device was operated at its highest fan speed setting. To facilitate a direct comparison between laboratory and large-scale chamber testing results, triplicate experiments were also performed using the procedure described below on a configuration of the device with a single layer of cotton batting fabric, the same box fan used during laboratory testing operated at its highest fan speed, and incense burnt on a hot plate as the challenge aerosol.
Each trial began by taking background particle concentration and CO2 measurements, sampling laboratory air for five minutes and then air within the sealed chamber for ten minutes. The challenge aerosol and CO2 were then injected and allowed to decay for 30 min. The air cleaner was present in the chamber but remained non-operational for this portion of the experiment, which allowed us to account for background particulate matter losses to the chamber itself. After 30 min, the chamber’s ventilation system was engaged until particle and CO2 concentrations returned to near-background levels. The chamber’s ventilation system was turned off and the injection process was then repeated, but with the air cleaner operating. The air cleaner remained engaged until particle concentrations returned to steady-state levels for a minimum of ten minutes.
2.3. Calculations
For laboratory testing, measured data was collected with and without filters using a single set of instruments in parallel paths; gaps in the dataset existed due to manual switching between the two paths. For particulate matter concentrations measured along the control filter holder’s path, missing datapoints were filled by fitting an exponential model to measured concentrations. Particulate matter concentrations through the test filter holder could then be predicted with EquationEquation 1(1)
(1) .
(1)
(1)
where Cpredicted,test is the predicted particle concentration downstream the filter (#/cm3), Cmodeled,control is the modeled ambient particle concentration within the run of ducting (#/cm3), and η is the filter’s single-pass removal efficiency (%).
A non-linear regression tool was used to find the best fit value of Cpredicted,test by varying η. The tool minimized the sum of squared errors between Cpredicted,test and measured concentrations downstream the test filter holder. in Appendix C presents a representative example of the modeled and measured particulate matter concentration versus time plot used to determine removal efficiencies with this process.
Predicted CADRs for the devices were calculated using EquationEquation 2(2)
(2) .
(2)
(2)
where CADR is the air cleaner’s clean air delivery rate (m3/h), QAC is the volumetric air flowrate entering and exiting the air cleaner (m3/h), and η is defined previously in EquationEquation 1
(1)
(1) . Note that for predicted CADR calculations, η was linearly interpolated to match the calculated face velocities of the full scale devices, as presented in Appendix C, .
For large-scale chamber testing, the “pull-down” method was employed to determine CADRs (W. Chen, Zhang, and Zhang Citation2005). Using EquationEquation 3(3)
(3) , which describes the time-varying concentration of particulate matter, a linear regression was performed for portions of the experiment when the air cleaner was non-operational, and again when it was operational, to determine total particle loss rates (
as the regression coefficient.
(3)
(3)
where Ci,t is the particulate matter concentration at time t (#/cm3), Ci,t=0 is the particulate matter concentration at time t = 0 (#/cm3), Cbg is the average steady-state, background particulate matter concentration (#/cm3), λ is the chamber’s air exchange rate (h−1), and β is the particle loss rate to chamber surfaces via deposition and (when the device is operational) air cleaning (h−1).
Neglecting the term, the chamber’s air exchange rate (λ) was determined separately using EquationEquation 3
(3)
(3) with CO2 concentrations as inputs. For particulate matter, the Cbg term present in EquationEquation 3
(3)
(3) was determined by averaging steady-state concentrations inside of the chamber. For periods when the air cleaner was off, this averaging occurred just before injection, while for periods when the air cleaner was on, averaging occurred once particle concentrations returned to steady-state levels. For CO2, the Cbg term present in EquationEquation 3
(3)
(3) was determined by averaging steady-state concentrations outside of the chamber just before both injections.
Air exchange rates were subtracted from total particle loss rates ( and the difference between total particle loss rate constants when the air cleaner was on versus off was multiplied by the chamber’s volume to arrive at the air cleaner’s CADR (EquationEquation 4
(4)
(4) ).
(4)
(4)
where is the volume of the chamber (m3), and all other terms are defined previously. The subscripts on and off represent periods where the air cleaner was operational and non-operational, respectively.
3. Results and discussion
3.1. Laboratory testing
3.1.1. Airflows
Air cleaner flowrates measured using the pressure matching method are presented in . Three measurements (averaged over one minute) for each of the five fabrics and two MERV 13 filter-based configurations (with and without an airflow-increasing shroud) are shown. All air cleaners are powered by the same box fan (Comfort Zone, Model CZ200A).
Fig. 5. Comparison of average (± standard deviation) air flowrates (m3/h) through the air cleaning device.
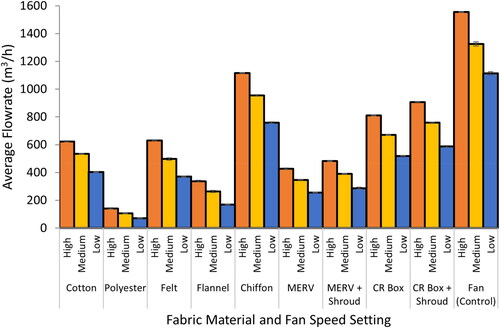
As an evaluation of the accuracy of our method, we measure the airflow from the box fan unimpeded by any filter (, Fan (Control)). While manufacturer specifications did not provide a maximum air flowrate for the box fan, a review of several common 0.5 m retail box fans found that a maximum flowrate of about 1700 m3/h is common. Several third-party retailers claim a flowrate of 1087 m3/h for the model we use, but do not report the associated fan speed setting. Our measurements, ranging ∼1100–1500 m3/h, appear to be in general agreement with expected flowrates from this box fan.
The volume of air that can be passed through the fabric filter depends upon the properties of the material—a thicker, less permeable fabric such as polyester adds static pressure to the system while a thin fabric such as chiffon allows air to pass through it easily. Thus, we expect a higher removal efficiency but lower air flowrate for polyester and the inverse for chiffon. The cotton batting and felt air cleaner configurations produce air flowrates within 10% of each other at each fan speed, which is expected considering the comparable nature of the material. The modified Corsi-Rosenthal Box’s flowrates are nearly double those of the single MERV 13 filter configuration; the cubic design’s 300% increase in surface area allows for lower pressure drop and greater airflow. The airflow-enhancing cardboard shroud increases flowrates for the MERV 13 filter-based configurations by ∼13% at each fan speed. in Appendix C presents the complete dataset of average (± standard deviation) air cleaner flowrates.
3.1.2. Single-pass removal efficiencies
Removal efficiencies are calculated for five fabrics and a MERV 13 filter across three filter holder diameters (20-, 47-, and 100-mm), which result in three face velocities (0.21, 0.04, and 0.009 m/s) consistent with the range of expected face velocities for the full-scale devices. Particle concentrations are summed and separated into three size bins (0.02–0.3, 0.3–1, and 1–2.5 µm), whose ranges are informed by the size bins presented in the MERV rating section of ANSI/ASHRAE Standard 52.2 (0.3–1, 1–3, and 3–10 µm) (ANSI/ASHRAE Standard 52.2 Citation2017). We opt to present a range capped at 2.5 µm, as doing so enables a more straightforward presentation of PM2.5 removal efficiency, which is widely used in characterizing the extent of wildfire air pollution. Particles in the 2.5–10 µm range are excluded from this study because the challenge aerosol does not contain enough coarse particles for accurate measurement; this is expected as the aerosol was generated via relatively efficient biomass combustion. displays average (± range/2) removal efficiencies for each of the five fabric and MERV 13 filters across two trials.
Fig. 6. Average (± range/2) single-pass removal efficiencies (%) determined at three face velocities (0.21, 0.04, and 0.009 m/s) for each of the five fabrics and MERV 13 filter in 0.02–0.3, 0.3–1, and 1–2.5 µm diameter particle size bins.
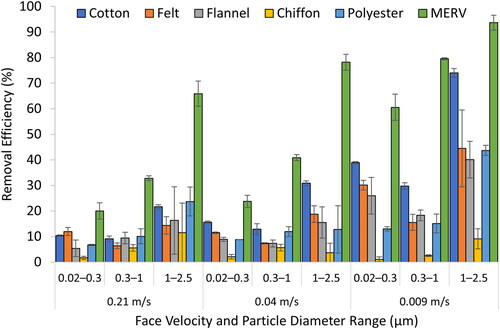
Of the fabrics analyzed, the cotton batting filter has the highest removal efficiency in each size bin—16% at 0.02–0.3 µm, 13% at 0.3–1 µm, and 31% at 1–2.5 µm—when evaluated at the face velocity (0.04 m/s) in closest agreement with the back-calculated face velocities presented in Appendix C, (0.034–0.052 m/s, depending on fan speed). Though MERV 13-rated filters are used, removal efficiencies are determined at face velocities appropriate for the system and with a challenge aerosol relevant to the portable air cleaner’s intended use (reducing indoor wildfire smoke exposure), and thus direct comparisons to the MERV 13 removal efficiencies outlined in ANSI/ASHRAE Standard 52.2 are not warranted. in Appendix C presents complete removal efficiency results.
3.1.3. Predicted CADRs
Using EquationEquation 2(2)
(2) , average predicted CADRs across two trials are calculated for prototype air cleaners with each of the five fabrics attached. CADRs are also calculated for four popular, homemade, MERV 13 filter-based air cleaning device configurations, namely a box fan with a single MERV 13 filter attached to it and a modified Corsi-Rosenthal Box, both tested with and without flow-increasing shrouds. presents a comparison of average predicted CADRs (± range/2) across three particle size bins for trials carried out at the high fan speed setting.
Fig. 7. Average predicted CADRs (m3/h) (± range/2) for (a) fabric filter configurations and (b) MERV 13 filter configurations. All predicted CADRs are from trials tested at the high fan speed setting. Note the vertical axes change in scale in panels (a) and (b). *Removal efficiencies varied considerably across experiments and thus maximum and minimum values are not shown; the reported CADR may be subject to high uncertainty.
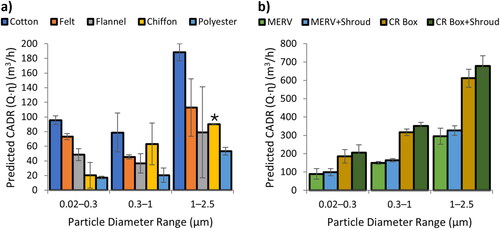
CADRs can be calculated as the product of air flowrates and filter removal efficiencies (Stephens et al. Citation2022); these two parameters vary depending on the material composition of the fabric. For example, while the polyester fabric filter yields relatively high single-pass removal efficiencies (compared to other fabrics in some size bins, see ), the thickness of the material causes a reduction in air flowrates. As a result, the polyester configuration produces the lowest predicted CADRs across all size bins. In contrast, though the chiffon fabric filter yields relatively low single-pass removal efficiencies in each size bin, large air flowrates result in measurable CADRs, greater than those predicted for fabrics with higher removal efficiencies, like polyester. In general, filtration theory demonstrates a trend where removal efficiency steadily decreases from 0.01 μm to ∼0.2 μm, after which it increases until ∼3 μm. While the other fabric-based air cleaners generally see a reduction in predicted CADR in the 0.3–1 µm size bin, the chiffon configuration’s predicted CADR is dominated by airflow with small differences in removal efficiency across particle size, and thus does not follow this trend. However, as noted previously, an effective air cleaner balances removal efficiency and flowrate. Of the fabric-based air cleaners, the device with a cotton batting filter attached proves to have the highest predicted CADR in each size bin—95 m3/h at 0.02–0.3 µm, 79 m3/h at 0.3–1 µm, and 188 m3/h at 1–2.5 µm—and was thus the configuration chosen for large-scale chamber testing.
MERV 13 filter-based configurations yield considerably higher CADRs in comparison to fabric-based configurations, which is expected due to the filter’s high removal efficiency. A single MERV 13 filter affixed to a box fan yields average (± range/2) predicted CADRs of 90 ± 29, 149 ± 9, and 296 ± 44 m3/h in the 0.02–0.3, 0.3–1, and 1–2.5 µm size bins, respectively. The addition of a shroud increases average predicted CADRs across all size bins by ∼10% in the case of the single MERV 13 filter and ∼11% in the case of the modified Corsi-Rosenthal Box. The Corsi-Rosenthal Box is designed in the shape of a cube, so that in addition to the high removal efficiencies of the MERV 13 filter, airflow is less restricted. The modified Corsi-Rosenthal Box with airflow-increasing shroud produces the highest average (± range/2) predicted CADRs of the experiment: 207 ± 41, 351 ± 20, and 679 ± 55 m3/h in the 0.02–0.3, 0.3–1, and 1–2.5 µm size bins, respectively. in Appendix C presents size-resolved predicted CADRs (average ± range/2) for the five fabric- and four MERV 13 filter-based configurations at each fan speed.
It is useful to compare our MERV 13 filter-based results to those present in the literature. Doing so provides validation that they are in general agreement with others’ independent results despite differing test methods, challenge aerosols, instrumentation, and filter surface areas. Note that because removal efficiencies were linearly interpolated based on results from three filter holder diameters (which are associated with three face velocities), the estimates presented in may not capture the MERV 13 filter-based devices’ true predicted CADR if the face velocity tested at differs from those tested at during this study.
Zeng, Heidarinejad, and Stephens (Citation2021) evaluated a five-panel, MERV 13 filter-based Corsi-Rosenthal Box (equipped with an air flowrate-increasing shroud) using the pull-down method in a large chamber. Burning incense was also used to generate particles 0.09–3 µm in diameter; they reported CADRs of 263, 442, and 545 m3/h in 0.01–0.4, 0.3–1, and 0.5–3 µm particle diameter ranges, respectively. There is a 24%, 23%, and 22% difference between our predicted CADRs in the 0.02–0.3, 0.3–1, and 1–2.5 µm particle diameter ranges when compared to the ranges reported in their study.
For a single, 2.5 cm thick MERV 13 filter affixed to a box fan with and without a cardboard shroud, Holder, Halliday, and Virtaranta (Citation2022) determined PM2.5 CADRs of 190 ± 2 and 265 ± 6 m3/h, respectively, at the highest fan speed setting. Adding a cardboard shroud to their single filter configuration caused a 40% increase in CADR, which is a higher increase than that realized due to the addition of a shroud during our study (∼10%). For a four-panel Corsi-Rosenthal Box constructed of 2.5 cm thick MERV 13 filters and including a cardboard shroud, Holder et al. reported a PM2.5 CADR of 681 ± 52 m3/h. Using a weighted average based on particle concentrations immediately after injection to estimate the PM2.5 CADR from our size-resolved bench-scale experiments, there is a 105% percent difference between the PM2.5 CADR that we predict and theirs. Similarly, PM2.5 CADR percent differences are >65% when comparing single MERV 13 filter configurations across studies, both with and without a shroud. This pattern is likely a result of Holder et al. using gravimetric particulate matter measurements to determine CADRs, an approach that emphasizes the influence of larger particles, which contribute strongly to mass and are more efficiently removed by MERV 13 filters. Dal Porto et al. (Citation2022) determined PM2.5 CADRs as high as 1450 m3/h when testing the Corsi-Rosenthal Box with a shroud at its highest fan speed setting. While this CADR is significantly larger than the predicted CADRs found as part of our experiments, the discrepancy between results could be explained by their use of a different challenge aerosol (NaCl), five MERV 13 filters instead of four, and an Aerodynamic Particle Sizer (APS 3321) to measure particulate matter, which records concentrations across 0.5–20 µm particle diameters. Because MERV 13 removal efficiency is highly dependent on particle diameter, a size-resolved presentation of the challenge aerosol and resulting CADRs may be appropriate for DIY air cleaners.
3.2. Large-scale chamber testing
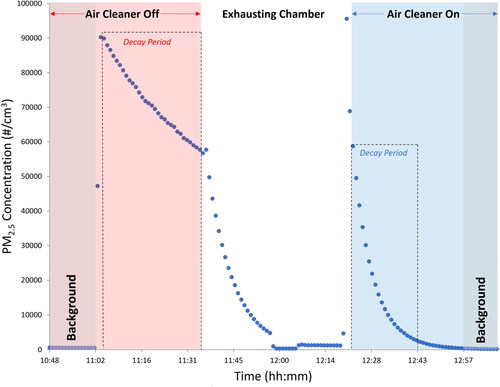
Triplicate experiments were conducted for the air cleaning device with a single cotton batting fabric filter attached, a double layer of cotton batting fabric filter attached, and a double layer of cotton batting fabric filter attached with a flow-increasing shroud affixed to the outlet side of the box fan. presents PM2.5 concentrations over the course of a representative experiment where the double layer of cotton batting fabric was tested. As expected, concentrations decrease more rapidly during the portion of the experiment where the air cleaner is operating versus when it is not.
Fig. 8. PM2.5 concentration (#/cm3) vs. time for trial 2 of the double fabric chamber experiment.
presents average size-resolved CADRs (m3/h) for the three configurations of air cleaner tested. The air cleaner with two layers of cotton batting filter and an airflow-increasing shroud attached proves to have the highest CADR across all particle size ranges. Adding a second layer of fabric increases CADRs by 40%, 50%, and 7% in the 0.02–0.3, 0.3–1, and 1–2.5 µm particle diameter ranges, respectively; additional filter surface area likely increases the removal efficiency of the device. The addition of a flowrate-increasing shroud to the double fabric configuration, however, only increases CADRs by 4%, 1%, and 11% in the 0.02–0.3, 0.3–1, and 1–2.5 µm particle diameter ranges, respectively. in Appendix D presents size-resolved CADRs and particulate matter loss rates (average ± standard deviation), as well as supplemental environmental information. These results indicate that modifications to air cleaners should include measurements of CADR as a function of particle size, as alterations to the configurations tested here result in variable and/or non-linear impacts on CADR. Put another way, a 10% increase in flowrate may not yield a uniform 10% increase in CADR due to dependencies between flowrate and removal efficiency across particle size.
Table 2. Large-scale chamber testing CADR averages (± standard deviation) (m3/h) for cotton fabric filter box fan air cleaners.
To achieve an 80% reduction of PM2.5 in one hour in a ∼34 m3 room (outdoor concentrations and dimensions given by the U.S. EPA’s Cleaner Indoor Air During Wildfires Challenge), a CADR of 127 m3/h (the target CADR outlined in Appendix A) is necessary. The double fabric configuration exceeds 127 m3/h in each of the three particle size bins, both with and without a shroud attached, while the single fabric configuration exceeds the target in the 1–2.5 µm size bin only. The Association of Home Appliance Manufacturers (AHAM) recommends that a portable air cleaner’s tobacco smoke (defined at a size range of 0.09–1 µm) particulate matter CADR (in ft3/min) be equal to two-thirds of an indoor space’s floor area (ANSI/AHAM AC-1-20152015, Citation2015). In the hypothetical room proposed by the U.S. EPA Challenge (which has a floor area of ∼14 m2), a PM2.5 CADR of ∼170 m3/h is necessary to be compliant with AHAM’s recommendation. While each configuration of the device exceeds 170 m3/h in the 1–2.5 µm size bin, average double-filter configuration CADRs are ∼10% and ∼20% short of meeting AHAM’s recommended minimum in the 0.02–0.3 and 0.3–1 µm size bins, respectively. Still, it is worth reiterating that the device—which is designed for emergency use and costs ∼$50 in total ()—is intended to be constructed from readily available, household materials and is capable of providing meaningful particulate matter reduction in smaller spaces.
3.3. Comparison of experiments
The purpose of this study is to determine and improve the CADR of low-cost, DIY air cleaning devices using two distinct methods to evaluate CADRs, namely laboratory and large-scale chamber testing. Variables such as type of fabric, fan speed, and challenge aerosol differ between experiments, making a direct comparison of results difficult. The testing method described in Section 2.2.3 is employed to facilitate such a comparison for the cotton fabric DIY air cleaner. Triplicate experiments are performed on a configuration of the device that includes the box fan used during laboratory testing operated at its highest setting and a single cotton batting filter, with incense burnt on a hot plate as the challenge aerosol (as was used during laboratory testing). compares the average CADRs determined during laboratory testing (which were predicted using airflows at the high fan speed setting and linearly interpolated single-pass removal efficiencies) and the large-scale chamber study described above across three particle diameter ranges.
Fig. 9. Comparison of laboratory testing (± range/2) and large-scale chamber testing (± standard deviation) CADRs (m3/h) for a single layer of cotton batting fabric at the highest fan speed setting with incense combustion emissions as the challenge aerosol.
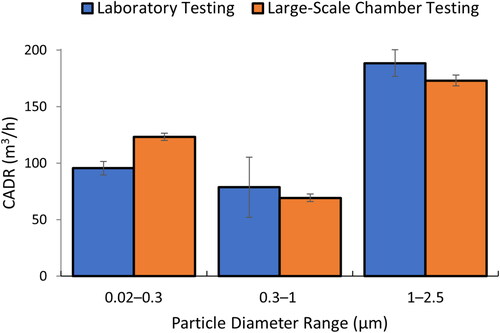
During large-scale chamber testing, the device yields average CADRs that are 29% higher in the 0.02–0.3 μm bin and 12% and 8% lower in the 0.3–1 and 1–2.5 μm bins, respectively; this demonstrates general consistency between the two fully independent experimental approaches. The observed 29% difference in the 0.02–0.3 μm size bin may be attributed to various particulate matter loss mechanisms occurring within the two different enclosures used, e.g., particle agglomeration due to increased relative humidity (Han et al. Citation2020; Li et al. Citation2015), particle agglomeration due to elevated peak particle concentrations (Holder, Halliday, and Virtaranta Citation2022), and short-term filter loading. To evaluate if such phenomena contribute to the higher difference in the 0.02–0.3 μm size bin, further testing with particulate matter instrumentation that has improved size resolution is necessary.
4. Conclusion
In this study, we evaluated a range of low-cost, DIY air cleaner designs that reduce exposure to indoor particulate matter. In addition to characterizing box fan-based air cleaners that rely on high MERV-rated filters, we characterized a novel alternative design where a simple fabric filter is used in place of a traditional mechanical filter. This alternative addresses several challenges, chiefly the cost and limited availability of high MERV-rated filters in affected areas during wildfire events. The fabric filter-based designs presented here are constructed from low-cost, sustainable materials that would be accessible to most during such an event.
Air cleaners and filter materials were tested using two distinct methods: 1) laboratory testing, where air flowrates and filter single-pass removal efficiencies were tested independently and combined to calculate a predicted CADR, and 2) large-scale chamber testing, which employed particle injection and decay testing inside of a well-sealed chamber. While, as expected, MERV filter-based devices yielded higher CADRs, the fabric-based design with a cotton batting filter attached proved to be effective in reducing particulate matter concentrations; configurations of the device that employed two filters exceeded the modeled, 127 m3/h PM2.5 CADR target across all particle size ranges. General agreement between two independent methods to determine particle CADRs for a cotton fabric DIY air cleaner demonstrate that fabric-based, DIY air cleaners may represent a viable option for improving indoor air quality during a wildfire event.
Brett W. Stinson contact information
Portland State University, Department of Mechanical and Materials Engineering, 1930 SW 4th Avenue, Suite 300, Portland, OR 97201.
Disclosure statement
The authors report there are no competing interests to declare.
Additional information
Funding
Notes on contributors
Brett W. Stinson
Brett W. Stinson, MS, Student Member ASHRAE, Mechanical Engineering, Research Assistant and Graduate Student.
Elliott T. Gall
Elliott T. Gall, PhD, Associate Member ASHRAE, Associate Professor at Portland State University.
References
- Abatzoglou, J. T., and A. P. Williams. 2016. Impact of anthropogenic climate change on wildfire across western US forests. Proceedings of the National Academy of Sciences of the United States of America 113 (42):11770–5. 10.1073/pnas.1607171113.
- ANSI/AHAM AC-1-2015. 2015. ANSI/AHAM AC-1-2015 - method for measuring performance of portable household electric room air cleaners. Accessed July 21, 2021. https://webstore.ansi.org/standards/aham/ansiahamac2015.
- ANSI/ASHRAE Standard 52.2. 2017. ANSI/ASHRAE Standard 52.2. - Method of testing general ventilation air-cleaning devices for removal efficiency by particle size. Accessed July 21, 2021. https://www.ashrae.org/File%20Library/Technical%20Resources/COVID-19/52_2_2017_COVID-19_20200401.pdf.
- Castillo, C., R. Dittrich, V. Shandas, E. Gall, and O. Starry. 2024. Mitigating wildfire smoke inside homes: Evidence from Oregon, September 2020. Risk Analysis: An Official Publication of the Society for Risk Analysis 44 (5):1114–27. 10.1111/risa.14252.
- Chen, H., J. M. Samet, P. A. Bromberg, and H. Tong. 2021. Cardiovascular health impacts of wildfire smoke exposure. Particle and Fibre Toxicology 18 (1):2. 10.1186/s12989-020-00394-8.
- Chen, W., J. Zhang, and Z. B. Zhang. 2005. Performance of air cleaners for removing multi-volatile organic compounds in indoor air. ASHRAE Transactions111:1101–14.
- Dal Porto, R., M. N. Kunz, T. Pistochini, R. L. Corsi, and C. D. Cappa. 2022. Characterizing the performance of a do-it-yourself (DIY) box fan air filter. Aerosol Science and Technology 56 (6):564–72. 10.1080/02786826.2022.2054674.
- Drewnick, F., J. Pikmann, F. Fachinger, L. Moormann, F. Sprang, and S. Borrmann. 2021. Aerosol filtration efficiency of household materials for homemade face masks: Influence of Material properties, particle size, particle electrical charge, face velocity, and leaks. Aerosol Science and Technology 55 (1):63–79. 10.1080/02786826.2020.1817846.
- Environmental Protection Agency. 2020a. Air Quality | National Summary | US EPA. Air Quality Trends. https://www.epa.gov/air-trends/air-quality-national-summary.
- Environmental Protection Agency. 2020b. Cleaner indoor air during wildfires challenge. Overviews and Factsheets. December 17, 2020. https://www.epa.gov/air-research/cleaner-indoor-air-during-wildfires-challenge.
- Han, J., X. Liu, D. Chen, and M. Jiang. 2020. Influence of relative humidity on real-time measurements of particulate matter concentration via light scattering. Journal of Aerosol Science 139:105462. 10.1016/j.jaerosci.2019.105462.
- Henderson, D. E., J. B. Milford, and S. L. Miller. 2005. Prescribed burns and wildfires in colorado: Impacts of mitigation measures on indoor air particulate matter. Journal of the Air & Waste Management Association (1995)55 (10):1516–26. 10.1080/10473289.2005.10464746
- Henry, S., M. B. Ospina, L. Dennett, and A. Hicks. 2021. Assessing the risk of respiratory-related healthcare visits associated with wildfire smoke exposure in children 0–18 years old: A systematic review. International Journal of Environmental Research and Public Health 18 (16):8799. 10.3390/ijerph18168799.
- Holder, A. L., H. S. Halliday, and L. Virtaranta. 2022. Impact of do-it-yourself air cleaner design on the reduction of simulated wildfire smoke in a controlled chamber environment. Indoor Air 32 (11):e13163. 10.1111/ina.13163.
- Holm, S. M., M. D. Miller, and J. R. Balmes. 2021. Health effects of wildfire smoke in children and public health tools: A narrative review. Journal of Exposure Science & Environmental Epidemiology 31 (1):1–20. 10.1038/s41370-020-00267-4.
- Hoover, K., and L. A. Hanson. 2023. Wildfire statistics. Congressional Research Service. https://sgp.fas.org/crs/misc/IF10244.pdf.
- Li, C., Z. Ma, J. Chen, X. Wang, X. Ye, L. Wang, X. Yang, H. Kan, D. J. Donaldson, and A. Mellouki. 2015. Evolution of biomass burning smoke particles in the dark. Atmospheric Environment 120:244–52. 10.1016/j.atmosenv.2015.09.003.
- Liu, J. C., G. Pereira, S. A. Uhl, M. A. Bravo, and M. L. Bell. 2015. A systematic review of the physical health impacts from non-occupational exposure to wildfire smoke. Environmental Research 136:120–32. 10.1016/j.envres.2014.10.015.
- Liu, J. C., A. Wilson, L. J. Mickley, F. Dominici, K. Ebisu, Y. Wang, M. P. Sulprizio, R. D. Peng, X. Yue, J.-Y. Son, et al. 2017. Wildfire-specific fine particulate matter and risk of hospital admissions in urban and rural counties. Epidemiology (Cambridge, Mass.)28 (1):77–85. 10.1097/EDE.0000000000000556.
- Long, C. M., H. H. Suh, P. J. Catalano, and P. Koutrakis. 2001. Using time- and size-resolved particulate data to quantify indoor penetration and deposition behavior. Environmental Science & Technology 35 (10):2089–99. 10.1021/es001477d.
- McClure, C. D., and D. A. Jaffe. 2018. US particulate matter air quality improves except in wildfire-prone areas. Proceedings of the National Academy of Sciences of the United States of America 115 (31):7901–6. 10.1073/pnas.1804353115.
- McDade, C. E., A. M. Dillner, and H. Indresand. 2009. Particulate matter sample deposit geometry and effective filter face velocities. Journal of the Air & Waste Management Association (1995)59 (9):1045–8. 10.3155/1047-3289.59.9.1045.
- Minneapolis Duct Blaster Operation Manual. 2011. The energy conservatory. https://www.oregon.gov/ohcs/energy-weatherization/Documents/Train-Tech-Assist/operations-manual-minneapolis-duct-blaster.pdf.
- Murray, D. M., and D. E. Burmaster. 1995. Residential air exchange rates in the United States: Empirical and estimated parametric distributions by season and climatic region. Risk Analysis 15 (4):459–65. 10.1111/j.1539-6924.1995.tb00338.x.
- Park, B. R., Y. S. Eom, D. H. Choi, and D. H. Kang. 2021. Estimation of Outdoor PM2.5 infiltration into multifamily homes depending on building characteristics using regression models. Sustainability 13 (10):5708. 10.3390/su13105708.
- Reid, C. E., M. Brauer, F. H. Johnston, M. Jerrett, J. R. Balmes, and C. T. Elliott. 2016. Critical review of health impacts of wildfire smoke exposure. Environmental Health Perspectives 124 (9):1334–43. 10.1289/ehp.1409277.
- Reid, C. E., and M. M. Maestas. 2019. Wildfire smoke exposure under climate change: Impact on respiratory health of affected communities. Current Opinion in Pulmonary Medicine 25 (2):179–87. 10.1097/MCP.0000000000000552.
- Rice, A., and G. Bostrom. 2011. Measurements of carbon dioxide in an oregon metropolitan region. Atmospheric Environment 45 (5):1138–44. 10.1016/j.atmosenv.2010.11.026.
- Stauffer, D. A., D. A. Autenrieth, J. F. Hart, and S. Capoccia. 2020. Control of wildfire-sourced PM2.5 in an office setting using a commercially available portable air cleaner. Journal of Occupational and Environmental Hygiene 17 (4):109–20. 10.1080/15459624.2020.1722314.
- Steinle, S., S. Reis, C. E. Sabel, S. Semple, M. M. Twigg, C. F. Braban, S. R. Leeson, M. R. Heal, D. Harrison, C. Lin, et al. 2015. Personal exposure monitoring of PM2.5 in indoor and outdoor microenvironments. The Science of the Total Environment 508:383–94. 10.1016/j.scitotenv.2014.12.003.
- Stephens, B., Gall, E. T. Heidarinejad, Mohammad, and Farmer, D. K. 2022. Interpreting air cleaner performance data. ASHRAE Journal 64 (3):9.
- Stinson, B. W., A. Laguerre, and E. T. Gall. 2024. Particle and gas-phase evaluation of air cleaners under indoor wildfire smoke conditions. ACS ES&T Air 1 (6):492–501. 10.1021/acsestair.3c00083.
- Thatcher, T. L., A. C. K. Lai, R. Moreno-Jackson, R. G. Sextro, and W. W. Nazaroff. 2002. Effects of room furnishings and air speed on particle deposition rates indoors. Atmospheric Environment 36 (11):1811–9. 10.1016/S1352-2310(02)00157-7.
- United States Environmental Protection Agency Indoor Environmental Division. 2009. Residential air cleaners: A summary of available information, 2nd ed. Washington, DC: USEnvironmental Protection Agency, Office of Air and Radiation, Indoor Environments Division.
- Xu, C., N. Li, Y. Yang, Y. Li, Z. Liu, Q. Wang, T. Zheng, A. Civitarese, and D. Xu. 2017. Investigation and modeling of the residential infiltration of fine particulate matter in Beijing, China. Journal of the Air & Waste Management Association (1995) 67 (6):694–701. 10.1080/10962247.2016.1272503.
- Zeng, Y., M. Heidarinejad, and B. Stephens. 2021. Portable air cleaner test report: ‘Corsi-rosenthal’ box fan air cleaner w/MERV 13 filters. September 2021. https://www.built-envi.com/wp-content/uploads/IIT-CADR-Testing-C-R-Box-September-2021.pdf.
Appendices
Appendix A.
Target CADR mass balance modeling
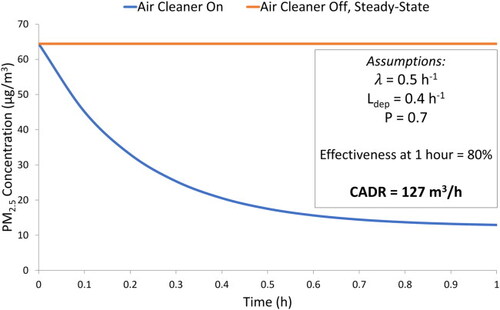
The initial prototype was constructed in accordance with the requirements of the U.S. EPA’s Cleaner Indoor Air During Wildfires Challenge (US EPA and ORD 2020). Challenge requirements dictated that for an air cleaning solution to be considered successful, it must achieve greater than an 80% reduction of PM2.5 concentration in one hour versus the PM2.5 concentration in the same room without the air cleaner present. For the dimensions of the room given (14 m2 floor area with a height of 2.4 m) and an outdoor PM2.5 concentration of 165 µg/m3 (which was determined by averaging the minimum (30 µg/m3) and maximum (300 µg/m3) concentrations given as a range of realistic wildfire PM2.5 levels), typical residential conditions were assumed: an air exchange rate of 0.5 h−1 (Murray and Burmaster Citation1995), a PM2.5 penetration factor of 0.7 (Long et al. Citation2001), and an indoor PM2.5 deposition loss rate of 0.4 h−1 (Thatcher et al. Citation2002). EquationEquation A.1(A.1)
(A.1) is the solution to a differential equation describing the time-varying PM2.5 concentration in the hypothetical space when accounting for air exchange, removal to background, and removal to the air cleaner, the three loss mechanisms present in EquationEquation A.2.
(A.2)
(A.2)
(A.1)
(A.1)
(A.2)
(A.2)
where Ci,t is the indoor pollutant concentration (µg/m3) at time t (h), Ci,t=0 is the indoor pollutant concentration (µg/m3) at time t = 0 (h), P is the penetration factor (-), λ is the air exchange rate (h−1), Co is the outdoor pollutant concentration (µg/m3), S is the indoor pollutant source term (µg/h), assumed to be 0, V is the volume of the indoor space (m3), QAC is the volumetric air flowrate entering and exiting the air cleaner (m3/h), η is the air cleaner’s removal efficiency (%), and L is the indoor pollutant loss rate (h−1).
presents the results of indoor PM2.5 concentration (EquationEquations A.1(A.1)
(A.1) and EquationA.2
(A.2)
(A.2) ) versus time for the given conditions. In the hypothetical indoor space, absent air-cleaning, the PM2.5 concentration will reach steady-state at approximately 64 µg/m3 (, red line). If an air cleaner is added to the room (, blue line) with an initial condition of 64 µg/m3, a dynamic mass balance using the same inputs shows that a CADR of 127 m3/h results in an 80% reduction of PM2.5 in one hour. Thus, a minimum CADR of 127 m3/h was targeted.
Fig. A.1. Plot of PM2.5 concentration vs. time in the hypothetical space; assumptions were made in compliance with U.S. EPA challenge criteria.
Appendix B.
Field testing description
After modeling an effective air cleaner during a wildfire event to determine a target CADR (Appendix A), particle injection and decay testing was carried out under real-world environmental conditions to estimate the CADR of the device with a fabric filter affixed to it. This experimental campaign will henceforth be known as “field testing”. Note that field testing results are described in this appendix for context regarding the overall motivation and experience in designing, building, and evaluating the air cleaning approach studied here. The field experiments were not conducted during a wildfire event, instead, particle injection from incense burning provided a challenge aerosol that allowed an early prototype of the air cleaner to be evaluated in a real-world environment. Field studies were informative, though limited in scope, but are included as they provided important motivation for the more controlled study presented in the main manuscript.
B.1 Field testing air cleaner materials
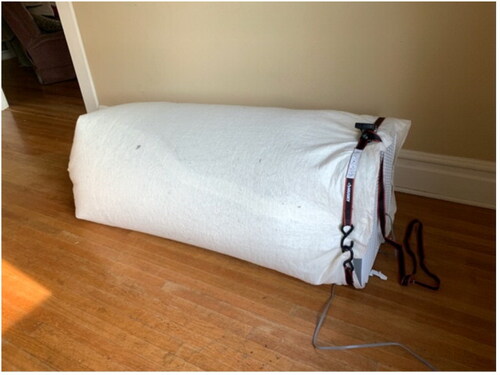
During field testing, a 1.8 m long windsock—cut from a roll of cotton batting fabric purchased from JOANN Fabric and Crafts—was sewn to be open at both ends and affixed to a 53 × 54 x 11 cm Holmes box fan (Model HBF2010A-WM) with either a ratchet strap or zip ties, depending on the location of the field study (). The side of the windsock that was not attached to the fan was folded neatly three times from the bottom and tied 8 cm from its end with two double-looped rubber bands.
Fig. B.1. Image of low-cost air cleaner with a cotton batting filter attached during preliminary field testing.
B.2 Field testing experimental design
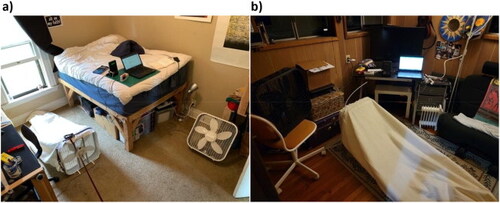
Field testing was carried out a total of four times: twice at location 1, in the bedroom of a home constructed in 1890 in Portland, OR, and twice at location 2, in the bedroom of a home constructed in 1920 in Rhododendron, OR. Location 1 is a 3 × 3.7 × 3 m, 34 m3 carpeted bedroom with walls and ceiling constructed of painted drywall. There are three shared walls, one wall to the exterior, and one window. The furniture included a raised, full-sized mattress, corner couch, desk, two computer monitors, and five pieces of unfinished wood furniture. The first and second trials of the experiment at location 1 were carried out on 05/01/21 and 05/02/21, respectively. Location 2 is a 2.6 × 2.7 × 2.4 m, 16.5 m3 office with wood floors, and walls and ceiling constructed of wood paneling. There are two shared walls: one between the office and a bedroom, the other with a door that led to a large living area with high ceilings; three small windows lined the opposite, exterior-facing walls. The furniture included a desk, office chair, couch, electronic keyboard, computer monitor, printer, two small suitcases, filing cabinet, and a rug placed in the center of the room. The first and second trials of the experiment at location 2 were carried out on 04/22/21 and 04/23/21, respectively. presents images of the experimental setup at both locations.
Fig. B.2. Images of the experimental setup at (a) Location 1 and (b) Location 2.
To monitor PM2.5 levels, a laser particle counter (Dylos DC1700) was employed, operating continuously in intervals of 1 min. Because this particle counter reports PM2.5 concentrations in units that are distinct from more common metrics (such as µg/m3 or particles/cm3), conversions were made from particles/ft3/100 to μg/m3 via regression equations present in Steinle et al. (Citation2015). To monitor CO2 levels, a battery-powered CO2 logger (Onset HOBO MX1102) was employed, operating continuously and reporting in units of ppm in intervals of 1 min. The CO2 logger also recorded temperature, relative humidity, and dew point. To elevate indoor PM2.5 levels, Mainichi-Koh sandalwood incense was burned. A second box fan was present in each location to ensure proper mixing.
The room’s air exchange rate was found before each experiment by elevating CO2 concentrations above 1000 ppm through excessive breathing and talking with the windows and doors closed. Once 1000 ppm was reached, the space was vacated and the CO2 concentration was allowed to decay for approximately 100 min. An outdoor CO2 concentration of 420 ppm was assumed for air exchange rate calculations—a conservatively low estimate based on average outdoor CO2 levels in and near Portland, OR, U.S.A (Rice and Bostrom Citation2011).
Each trial began by recording background PM2.5 measurements for a minimum of ten minutes inside of the sealed room. The mixing fan was then engaged, and three sticks of incense were lit simultaneously and placed upright into a small jar containing sand for 1–2 min. Upon extinguishing the incense in the same jar of sand, the mixing fan was immediately turned off and the experimenter left the room—particles were allowed to decay for 30–45 min. The air cleaner was present in the room but remained non-operational for this portion of the experiment, which allowed us to account for background losses of PM2.5 to the room itself. Between experiments, windows and doors were opened, the mixing fan was turned on, and the room was flushed out until PM2.5 levels returned to previous background concentrations—this process took between 15 and 30 min. Once this occurred, the doors and windows were closed and the room was vacated for 30 min, allowing for PM2.5 concentrations to return to steady state. The injection process was then repeated, but with the air cleaner operating. The air cleaner remained engaged until particle concentrations returned to steady-state levels for a minimum of ten minutes. The order in which experiments were carried out (having the air cleaner off versus having it on) was varied randomly.
Particle loss rates, air exchange rates, and CADRs were determined via linear regressions using the method described in Section 2.3 of the main manuscript.
B.3 Field testing results
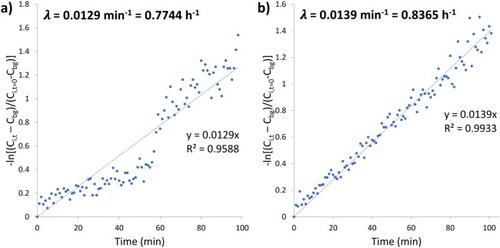
Air exchange rates at locations 1 and 2 were found to be 0.77 h−1 and 0.84 h−1, respectively. These are slightly higher than the average air exchange rate (0.5 h−1) typical of residential buildings (Murray and Burmaster Citation1995). presents the regression analysis used to arrive at air exchange rates.
Fig. B.3. Air exchange rates as determined by a CO2 tracer decay test at locations (a) 1 and (b) 2. Regression analysis is shown. Slopes correspond to air exchange rates: 0.77 h−1 at location 1 and 0.84 h−1 at location 2.
presents a sample plot of PM2.5 concentration vs. time for the air cleaner and background tests at location 1 on 05/02/21. displays the linear regression for both tests, the corresponding slopes (particle loss rate constants), and the resulting CADR calculation during the same experiment.
Fig. B.4. (a) PM2.5 concentration vs. time plot and (b) linear regression plot for the air cleaner on and air cleaner off tests at location 1 on 05/02/21; slopes correspond to particle loss rate constants and CADR calculation is shown.
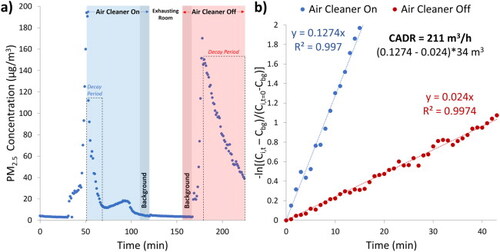
As described in Appendix A, a CADR of 127 m3/h was targeted. The air cleaner proved to be quite effective, yielding a CADR well above this metric for each experiment at both locations, delivering its most impressive results (211 m3/h) on 05/02/21, shown below in . In all cases, the air cleaner began working immediately, yielding an average net PM2.5 reduction of 84% after 30 min of operation following peak concentrations. Across four replicate experiments in two different bedrooms, the average CADR was 177 ± 24 m3/h (average ± standard deviation); a CADR in excess of the modeled target was consistently achieved with this prototype design. Complete field testing results are presented in .
Table B.1. Supplemental and environmental field testing results over the course of four days in two separate locations.
Appendix C.
Laboratory testing results
Fig. C.1. Representative example of 0.02–0.3 µm diameter particulate matter concentration vs. time plots for the cotton batting filter at a face velocity of 0.04 m/s. Measured data (dots) and the modeled data fit to it via an exponential model (lines) are shown for analyses with and without a fabric filter. A non-linear regression tool was used to find best fit values of the modeled data with filter by varying the filter’s single-pass removal efficiency.
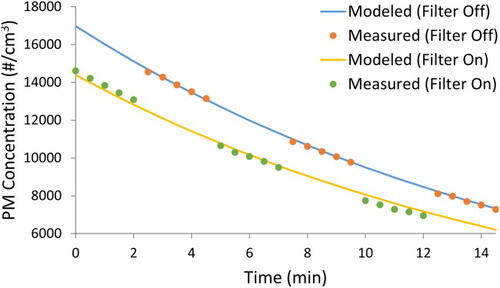
Table C.1. Air cleaner flowrates (average ± standard deviation), filter surface areas (m2), face velocities (m/s), and filter holder diameters necessary to match face velocities during removal efficiency experiments (mm) for five fabrics and two MERV 13 filter configurations, with and without a shroud. Three readings for each configuration were averaged over one minute.
Table C.2. Size-resolved (0.02–0.3, 0.3–1, and 1–2.5 µm) single-pass removal efficiencies (average ± range/2 in %) for five fabrics (cotton batting, felt, flannel, chiffon, and polyester) and a MERV 13 filter. Duplicate experiments were performed at three face velocities (0.21, 0.04, and 0.009 m/s).
Table C.3. Size-resolved (0.02–0.3, 0.3–1, and 1–2.5 µm) predicted CADRs (average ± range/2 in m3/h) for five fabric configurations (cotton batting, polyester, felt, flannel, and chiffon) and four MERV 13 filter-based configurations. Duplicate single-pass removal efficiency experiments were performed at three face velocities (0.21, 0.04, and 0.009 m/s); removal efficiencies were linearly interpolated to match the calculated face velocities of the full scale devices (as presented in ) for predicted CADR analysis.
Appendix D.
Large-scale chamber testing results
Table D.1. Size-resolved (0.02–0.3, 0.3–1, 1–2.5, and <2.5 µm) CADRs (m3/h) and particulate matter loss rates (h−1), air exchange rates (h−1), temperatures (°C), and relative humidities (%) (average ± standard deviation) for three configurations of the device with cotton batting filter attached. “Off or On” refers to whether or not the air cleaner was operational during the given period. “Inside or Outside” refers to whether measurements were taken inside the chamber or outside of it (ambient laboratory conditions).