
 ?Mathematical formulae have been encoded as MathML and are displayed in this HTML version using MathJax in order to improve their display. Uncheck the box to turn MathJax off. This feature requires Javascript. Click on a formula to zoom.
ABSTRACT
The European Parliament (EP) has seen a gradual increase in its powers since the introduction of direct elections in 1979. Scholars have focused on both individual-level and aggregate factors to explain turnout rates in EP elections over time, including increased levels of EU politicization and the rise in support for Eurosceptic parties. However, one strand of analysis seems to partially have been overlooked: Some earlier research on EP election turnout claimed that absolute turnout rates across the EU should be used with care, as a number of ‘structural factors’ influences these shares and with this, affects estimates of actual voter turnout. Are such structural variables still relevant in a time where European politics are becoming increasingly salient among the wider public, pro- and anti-EU sentiments may increase citizens’ inclination to vote and trust in EU institutions may be getting increasingly important? Based on various estimates, we find that structural factors can still be characterized as determinants in EP elections, but that the power of structural factors to explain turnout at the EU level, compared to non-structural factors, has decreased. Nonetheless, EU-wide (average) EP turnout rates, as widely reported, are not likely to be good reflections of actual trends in EP turnout over time.
1. Introduction
In 1979, the first direct (general) elections to the European Parliament (EP) were held.Footnote1 As the core ‘democratic institution’ within the European Union (EU),Footnote2 aiming to provide essential democratic legitimacy to EU decision-making, EP elections were and are of major significance in terms of the representation of citizens’ interests at the EU level. Moreover, they matter in view of the ‘political capital’ of the EP as an institution vis-à-vis the EU’s intergovernmental institutions (Council of the EU, European Council), the European Commission and other EU-level organizations.
The EU has been through a series of institutional and political changes over the last three decades. This has involved a continuous strengthening of the role of the EP in the EU inter-institutional decision-making processes. The perception of the EP as relevant to EU policies is likely to have increased voters’ interests in elections to this institution. Moreover, Brexit may have triggered – somewhat counter-intuitively – more interest in the EU and with this, the EP, not least among younger voters. EP elections, clearly, are now conducted in a setting where European politics are increasingly salient among the wider public, with the Spitzenkandidatensystem and a potentially increasingly politicized European Commission being relevant factors.
In 1979, the average turnout rate in EP elections for all member states was 67.2 percent.Footnote3 In 2014, when general elections to the EP were held for the eighth time, average turnout had declined to 42.6 percent. In the most recent (ninth) EP elections in 2019, however, average turnout went up and reached 50.7 percent. When average voter turnout declined in the framework of the 1999 and 2004 elections, various authors attributed this to decreasing levels of support for the EU among the European public (on this, e.g. see Adshead & Hill, Citation2005, p. 545). Subsequently, the continued absolute decline in 2009 and 2014 was widely seen to simply corroborate this argument. Franklin (Citation2001) and Wessels and Franklin (Citation2009) rebutted some of these claims, demonstrating that structural factors had a large impact on voter turnout.Footnote4
The main message of Franklin’s Citation2001 article was that declining turnout in EP elections should not be assessed based purely on average EU rates. More was at stake: after having accounted for structural factors, such as compulsory voting, first EP elections held in a member state and electoral salience, the author demonstrated that voter turnout had in fact remained quite stable over time. Of course, since these original studies, the EU has changed very much. With this, it is likely that ‘structural’ factors have become less relevant compared to ‘non-structural’ ones.
After several non-structural factors have been explored by various studies and found to matter for EP voter turnout rates, one wonders whether the structural factors used earlier are still relevant. If so, they do need to be accounted for when exploring EP turnout. Accordingly, our paper, building on the earlier work, aims to develop improved and updated assessments, while accounting for the role of such original structural factors in EP elections. We offer an adapted methodological framework, extended dataset and improvements based on criticisms and suggested extensions to Franklin’s earlier study. Moreover, the higher number of observations since the 2004 EU enlargement leads to more insights into turnout, also in terms of differences between ‘older’ and ‘newer’ EU states.
Our paper is structured as follows. In section two, we present the framework and approach of the earlier research on structural factors and EP turnout and discuss more recent theoretical and empirical work on the subject. Section three presents the data and methods employed in this paper, describing the replication and extension of the earlier model, accompanied by methodological adjustments, more data and additional insights on the subject. The replication results are presented in section four, alongside some alternative model specifications and robustness checks. The final section provides an evaluation of our results and offers conclusions in the light of ongoing processes of Europeanization and EP turnout rates.
2. Theoretical argumentation and assumptions
Much academic work, often with an empirical orientation, assesses the reasons why people turn out to cast a vote more generally and, from a more comparative point of view, explain the considerable variation in voter turnout in an international comparison. Several variables have been included into such analyses. Geys (Citation2006), for example, offered a meta-analysis of various socio-economic, political and institutional explanations of voter turnout in national elections; his analysis points to the potential relevance of core elements such as electoral systems, population size and election closeness. Smets and van Ham (Citation2013), in a meta-analysis of individual-level factors affecting turnout, assessed 90 academic articles, which together offer 170 different independent variables explaining turnout rates. Only eight of these variables, however, were included in more than one-fourth of the studies: these are level of education, age, gender, race, income, marital status, party identification and political interest.Footnote5
For EP elections, however, other variables matter too, as both the national and supranational levels of political contestation may affect turnout (e.g. Mattila, Citation2003). Fiorino et al. (Citation2019), for example, taking spatial and regional data into account and offering a multilevel analysis, show that compulsory voting, domestic political cleavages, rates of employment, trust in the EU and voter age distributions are crucial to estimate turnout in EP elections. Bhatti and Hansen (Citation2012), similarly, found that older voters were more likely to vote in European elections than younger ones (also see Franklin & Hobolt, Citation2011). Several domestic-level factors have been found to matter in earlier elections affecting voters’ decisions, very much in accordance with second-order theory (Schmitt & Mannheimer, Citation1991; Van der Eijk et al.,Citation1996; Flickinger & Studlar, Citation2007). Schmitt et al. (Citation2020), applying data from the European Election Studies (EES) voter surveys and focusing on the 2004 and 2014 EP elections, discovered signs of sincere in addition to strategic voter abstentions in EP elections. Nonnemacher (Citation2021) recently emphasized that it is the entire number of national elections between EP elections – parliamentary elections, presidential elections or referenda – that are likely to have depressed EP turnout (this is notably the case for already disengaged voters).
In terms of non-structural factors in EP elections, recent analyses demonstrate how campaigning has influenced citizens’ voting decisions (Gattermann & Marquart, Citation2020; Marquart et al., Citation2020). Moreover, more informed EU citizens are more likely to vote, as demonstrated by Hogh and Larsen (Citation2016) based on a quasi-experiment. Though factors on the national level remain dominant in such elections, individual-level motivations have also included a ‘European aspect’, with voters using EP elections both as a means to express their dissatisfaction with national politics and as a genuine way of expressing their position on European issues (Hix and Marsh, Citation2007; Hobolt et al., Citation2009; Hobolt & Spoon, Citation2012). Euroscepticism has also been suggested to influence voters’ turnout decisions, though the strength of this link appears to be moderated, for example, by the national ‘supply’ of Eurosceptic parties (Hernández & Kriesi, Citation2016; Schmitt & van der Eijk, Citation2007).Footnote6 Finally, compared to Franklin (Citation2001), the ‘new’ EU member states as of 2004 have by now been through numerous election cycles, and voters in those countries are likely to have become more ‘habitual voters’ in EP elections. The 2019 EP elections were certainly remarkable as they registered an average EU turnout rate exceeding 50 percent, with increases compared to 2014 observed in 21 of the 28 member states and an evolving common dynamic reflecting ‘Europeanization’ in EP voting (De Sio et al., Citation2019).
Accordingly, the EP has gradually experienced processes of politicization, e.g. through party or media contestation, although effects were still limited for the 1999–2014 time-span (Varilopoulou & Gattermann, Citation2021). Paradoxically, Eurosceptic parties managed to mobilize voters notably in the first EP elections of the new millennium, causing leading mainstream parties to de-emphasize European topics, but forcing them to address such themes again in the 2019 EP elections (Braun & Grande, Citation2021). However, national factors are still highly relevant in terms of dominating the European political space, somewhat stalling the ‘Europeanisation’ of EP elections (Lehmann, Citation2014). But a gradual politicization of European integration has nonetheless been observed, also empirically (e.g. De Wilde & Zürn, Citation2012; Hutter et al., Citation2016; Kriesi, Citation2016; Risse, Citation2014; Van der Brug & de Vreese, Citation2018 Hutter & Kriesi Citation2016; Hutter & Kriesi, Citation2019).
Looking at figures for EP elections, an absolute decline in turnout rates can be observed up to 2014:Footnote7 from 67.2 percent as an (unweighted) EU average in 1979 to 43.3 percent in 2014.Footnote8 With this, the average decline was 3.4 percentage points per EP electoral round. The average rates, together with those of individual member states, are given in .
Table 1. Turnout in EP Elections, 1979–2019Table Footnote1.
In 2001, however, Franklin stated ‘that the European Union of 1999 is not the same place as the European Economic Community of 1979’, and that this point was ‘neglected by virtually everyone’ (Franklin, Citation2001, p. 310). He argued there were at least three structural factors that had influenced voter turnout between 1979 and 1999: a) the number of states applying compulsory voting; b) whether a member state held an EP election for the first time and c) electoral salience, measured as the time span between the EP election and the next national election. Clearly, in general assessments of EP turnout and respective media reports, such structural factors are not accounted for. Information rather provides absolute turnout rates across the EU. But more structural factors could be important, although Franklin’s original study can of course be expected to be less relevant to an EU that has changed considerably over time.
As far as compulsory voting is concerned, in the framework of the 1979 EP elections, three out of the total of nine member states used this principle: Belgium, ItalyFootnote9 and Luxembourg. Similarly, when Greece joined in 1981, it still applied compulsory voting.Footnote10 Hence, just under half of the member states at the time employed compulsory voting in EP elections. Since 1981, 18 states in total have joined the EU, but only one of them (Cyprus) applied compulsory voting in EP elections. This implies that in 2019, in only 14 percent of the member states citizens were formally obliged to vote in EP elections.Footnote11 Naturally, if fewer states apply compulsory voting, average turnout in EP elections decreases (Franklin, Citation2001, p. 310): compulsory voting enhances turnout by increasing the costs of non-compliance, even if formally, there is no penalty for not casting a vote (Fiorino et al., Citation2019, p. 887).
A second factor affecting EP turnout in a more ‘structural’ way is whether the election to this institution is conducted for the first time in a member state or not. Franklin (Citation2001:, pp. 311–312) noted ‘that in most countries (Belgium, Denmark, and Britain appear to be the main exceptions) the first EP election ever conducted sees a ‘first-time boost’ to turnout, which has been assumed to be due to the excitement surrounding a novel experience’, such trends ‘artificially boosting’ average EU turnout. Whereas in 1979, all participating member states, according to this logic, experienced a ‘first-time boost’, in 1987, it occurred in only two of the 12 member states. In 1994, EP elections were conducted for the first time in three out of 15 member states, in 2004 in ten out of 25, two out of 27 in 2009, one out of 28 in 2014 and none in 1999 and 2019.Footnote12
Exploring the role of such structural factors, but accounting for the newly joined (mainly Eastern European) member states of 2004, Wessels and Franklin (Citation2009) adapted the ‘first election’ variable in their research by including a new measure accounting notably for five ‘low-turnout’ post-communist countries.Footnote13
A third structural factor deemed to have the potential to structurally influence turnout in Franklin’s original research is the timing of EP elections compared to the national election cycle.Footnote14 If EP elections occur shortly after a national election, attention for the former will be lower than if they take place just before the national-level election (Franklin, Citation2001, pp. 315–316). In the latter case, domestic politicians will likely put more emphasis on the EP elections and the event will be surrounded by more media attention. Moreover, EP elections in this case may constitute a ‘barometer’ for the level of popularity of domestic political parties.Footnote15 Therefore, the timing in relation to national elections can be considered to constitute a ‘structural factor’.Footnote16
While Franklin (Citation2001) demonstrated the extent to which these three structural factors were able to explain decline in EP turnout between 1979 and 1999, Wessels and Franklin (Citation2009:, p. 614) stated they were not as relevant when incorporating results of the 2004 EP elections (which encompassed the new EU member states).Footnote17 A possible explanation for low turnout in the post-communist states then was the potential absence of a ‘habit of voting’ (Franklin & Hobolt, Citation2011, p. 75). Accordingly, a factor influencing a person’s choice to vote in an EP election may quite simply be rooted in the same person’s choice to vote in a previous election. Voting, in this sense, can be a ‘habit’, also in the context of EP elections. Accordingly, in EU states in which voting was still a relatively new experience, turnout might simply have suffered from a ‘lack of democratic routine’.Footnote18
What will the consequences be if the original model – and the slightly adapted versions suggested later – is used for the new sample of total EU membership and the EP elections of 2009, 2014 and 2019? Will structural factors – next to a variety of potential non-structural ones – still matter?
For our empirical analysis, we expect that non-structural factors increasingly play an important role for the explanation of EP election turnout: it can be expected to be larger with increasing levels of EU politicization, at the national level (Hutter et al., Citation2016; Hutter & Grande, Citation2014; Hutter & Kriesi Citation2016; Hutter & Kriesi, Citation2019) and at the European level (Braun & Grande, Citation2021). We also expect the rise of Eurosceptic parties (Hobolt, Citation2015; Treib, Citation2014; Treib, Citation2021) to increase EP election turnout rates.Footnote19
Similarly, a stronger deepening of European integration in the course of EU treaty revisions and increasing Europeanization of EP elections (Braun, Citation2021; Hogh & Larsen, Citation2016;) are likely to have positively affected turnout rates. Finally, in line with the Lisbon treaty, an important change was introduced together with the 2014 EP elections: the introduction of European-wide lead candidates. While this did not fundamentally change the elections themselves or raise their visibility (Christiansen, Citation2016; Hobolt, Citation2014), it is likely to have increased EP turnout at least to some degree (Maier et al., Citation2017; Schmitt et al., Citation2015). Our theoretical assumption hence is that non-structural factors, including politicization of the EU and the rise of Eurosceptic parties, are likely to have induced higher turnout in EP elections.
Our conceptual framework, accordingly, encompasses structural as well as non-structural factors to study turnout in EP elections over time. To explore this in more depth, we now provide information on our data collection and methodological approach.
3. Data and methods
Since 1979, EP elections have been conducted at regular five-year intervals. Accounting for the number of member states in all respective EP election years – 1979, 1984, 1989, 1994, 1999, 2004, 2009, 2014 and 2019 – there have been 175 national-level EP elections in total. Accordingly, we account for voter turnout rates for each EU member state in each EP election, generating n = 175 cases. Since the first (direct) EP elections were conducted in 1979, EU membership has gradually expanded. Upon joining the EU, some countries held EP elections in between two (regular) general EP elections. Such ‘delayed elections’ took place, for example, in Greece in 1981, Portugal and Spain in 1987, Sweden in 1995, Austria and Finland in 1996, Bulgaria and Romania in 2007 and finally, Croatia in 2013 (see respective figures in above). Since the effect on voter turnout of such ‘intermediate elections’ can be expected to be similar to first-time election effects in regular EP election rounds, we categorize these cases into the year in which the closest preceding EP general election took place.Footnote20 Accordingly, our data collection encompasses ten national-level EP elections in 1979, 12 in both 1984 and 1989, 15 in 1994 and in 1999, 27 in 2004 and finally, 28 EP elections in the years 2009, 2014 and 2019.
The main dependent variable in our analysis will be voter turnout in each of these 175 national-level EP elections. Turnout rates were assembled for most of the cases based on data provided by the International Institute for Democracy and Electoral Assistance (IDEA).Footnote21 Due to some missing data, however, in some instances, information had to be substituted by data collected from (official) national-level sources.Footnote22 For the 2019 elections, voter turnout data were derived from the EP website, where respective information is now available. For the operationalization of turnout we will use, as earlier analyses did, the actual number of votes cast in an EP election in relation to the number of registered voters, for each EU member state.
Continuing the strand of thought of the earlier analyses, we first use four independent variables capturing the structural factors: ‘compulsory voting’, ‘first election’, ‘electoral salience’ (Franklin, Citation2001) and ‘Eastern enlargement’ (Wessels & Franklin, Citation2009), but operationalize this latter variable in an adapted way.
As demonstrated, compulsory voting was applied in the most recent (2019) EP elections in Belgium, Cyprus, Greece, Luxembourg and Bulgaria, but in several EU member states in earlier rounds (e.g. Italy). We code EU states applying compulsory voting for each national-level EP election as 1 (and 0 otherwise). Italy used compulsory voting until 1993;Footnote23 this leads us to code Italy as 1 on this variable for the EP elections of 1979, 1984 and 1989 and as 0 afterwards.Footnote24
Similarly, the variable ‘first election’ is coded as 1 if an EP election took place for the first time in a member state and 0 thereafter. Hence, for 1979, all 10 member states are coded as 1. Two states obtained score 1 for this variable in 1984, none in 1989, three in 1994, none in 1999, twelve in 2004, one in 2014 and again none in 2019 (see ).
The variable ‘electoral salience’, again reflecting the approach used in the original study, is measured in years and fractions of years (assessed to three digits) with respect to the next domestic-level parliamentary election, for each member state.Footnote25 Based on the Parline data collection,Footnote26 we have assessed the number of days from the date of the EP election to the next national-level election, for each EU member state.Footnote27 However, measuring the actual time to the next national election day contains empirical challenges. Ideally, this would be the expected number of days between EP elections and domestic parliamentary elections. At the time EP elections were held in a specific member state, domestic-level parliamentary elections may have been scheduled, for example, for three years later. But EP elections in such cases are not really a ‘barometer’ for national-level elections; media attention and voter turnout in EP elections are then unlikely to increase based on a (perceived) ‘national pre-election’ effect. The static nature of this mode of analysis cannot account, for example, for ‘snap’ domestic elections. If, hypothetically, the day after the EP elections, new national elections are called – possibly taking place one month after the EP elections – the electoral salience in the dataset should be coded as high, while in practice, it was not.Footnote28
The fourth independent (structural) variable is ‘Eastern enlargement’. In our study, Eastern European EU states that participated for the first time in the 2004, 2009 or 2014 EP elections are coded as 1.Footnote29 For all other EU states, code 0 applies.Footnote30
We now first calculate adapted turnout rates for EP elections over time, i.e. rates that account for the effect of the four ‘structural variables’ discussed above. To stay as close as possible to the earlier analysis, we simply replicate the approach based on our expanded data set, followed by some alternative conceptualizations and updates. Accordingly, we first conduct a multiple ordinary least squares (OLS) regression analysis, using voter turnout in each EP election as the dependent variable, while ‘compulsory voting’, ‘first EP election’, ‘electoral salience’ and ‘Eastern enlargement’ constitute the independent variables (no other potential independent variables are included yet, as we remain within the replication exercise). The first two variables, as well as ‘Eastern enlargement’, are dichotomous, whereas ‘electoral salience’ is assessed on an interval level (years and fractions thereof until the next national-level election).
The analysis is performed based on data for 28 EU member states (at the time of the 2019 EP elections) and for nine different points in time (corresponding with each EP election conducted in five-year intervals). As in the original study, various member state and time period subsamples are used. Accordingly, a pooled cross-section study design is applied (see Franklin, Citation2001, p. 313). Since regular standard errors stemming from pooled OLS, however, are typically underestimated, we use panel-corrected standard errors instead (Beck & Katz, Citation1995). Again following Franklin’s earlier approach, the coefficients resulting from the OLS regression provide the actual weights to calculate adapted (or ‘corrected’) EP turnout rates, taking these four ‘structural factors’ into account. In addition, as a robustness check, we will perform fixed effects model estimates and include some control variables.
4. Main results and robustness checks
Applying this approach to the updated data collection, model A in shows, in line with Franklin’s original article, that three structural factors (‘compulsory voting’, ‘first election’ and ‘electoral salience’) are in fact again able to explain a vast portion of variation in voter turnout in EP elections that were held before the 2004 enlargement. Hence, this result applies for the ‘old’ (pre-2004) EU member states.Footnote31 Model B in validates these results for the group of ‘old’ EU states and for the time span that includes the 2004 elections.Footnote32 Subsequently, model C in demonstrates that an extension of the sample including the EU-27 in the 2004 EP elections leads to a significantly lower predictive power of the model, however, and a loss in terms of statistical significance for the ‘first election’ and ‘electoral salience’ variables.Footnote33 Again, these estimates are conducted based on the potential influence of the ‘structural factors’ exclusively (and with this, do not capture the influence of potential other independent variables, such as the extent of Euroscepticism, trust in EU institutions or socio-economic characteristics of voters, as discussed above). Model D () shows that adding ‘Eastern enlargement’ as a structural factor into the estimates – based on the coding scheme discussed above – restores the predictive power of the model, as well as the level of statistical significance of the explanatory variables. All of these results are substantively still comparable to those generated by Franklin (Citation2001) and Wessels and Franklin (Citation2009), even when the data are updated for another decade and now encompass all EP elections up to 2019.
Table 2. Turnout in EP elections: Main regressions.
To check whether this validity still holds when applying a different model based on panel data, a shows regression outcomes of the same model, but with fixed effects. Such estimates have the advantage that they control for between-country variance in ‘normal’ levels of turnout and thus for all time invariant confounding variables, constituting a more valid test of potential causality. Whereas the OLS regressions presented above only rely on ‘between’ country differences to estimate the coefficients, fixed effects use differences ‘within’ the respective EU states. However, variables that are time invariant cannot be estimated with fixed effects models (e.g. effects of new member states).
Table 3. a. Turnout in EP elections: Main regressions with fixed effects.
As a demonstrates, models 1-3, analyzing observations for 1979–2004, show a weaker correlation between compulsory voting and EP turnout compared to the simple OLS regression results above and lower statistical significance (at a level of 5 or 10 percent). This contrasts with , where compulsory voting was statistically significant at the 1 percent level for all models estimated. However, for both the EU-15 and total EU membership later on, in the fixed-effects analysis, all three original ‘structural factors’ still turn out to be statistically significant, supporting the claim that they still matter in EP elections.
Using an even larger data set and applying the models above, we get some new insights. Models E and F in provide estimated coefficients for all EP elections held so far in a comparison between the EU-15 and the EU-28. Corroborating other research on the topic (e.g. Fiorino et al., Citation2019), the variable ‘compulsory voting’ has a strong, statistically significant, positive effect on EP turnout rates. The effect of the variable ‘first EP election’ is also positive and statistically significant, despite doubts raised by Wessels and Franklin (Citation2009) concerning its applicability to ‘post-communist states’. The effect of electoral salience is negative since increases in distance of EP elections to national-level elections are related with lower turnout. This effect, however, is not statistically significant in any of the extended models (), providing more incentives to double-check the basis on which this variable was operationalized originally. The fourth structural factor, ‘Eastern enlargement’, also has a statistically significant, strong and negative effect in the extended model. To further explore this link, model G in shows the results of an interaction effect between the first EP election held and ‘Eastern enlargement’, accounting for the fact that in the new EU member states as of 2004, much less of a ‘first-time election boost’ was observed empirically (Wessels & Franklin, Citation2009). Again, this interaction term is statistically significant in the extended estimates, confirming the assumption that new (mainly Eastern European) member states experienced lower turnout rates in first EP elections held compared to their Western counterparts. Overall, the explanatory power of the models for the ‘old EU’ member state group (model E) and for all EU members (model G) is large (with an R-squared of 0.66 and 0.65, respectively), yet it is lower than in the models which only considered EP elections up to the 2004 EU enlargement. This suggests that over time – in accordance with our theoretical assumptions – the explanatory power of ‘structural factors’ may have weakened, with non-structural ones having grown in importance.
Before adding some nuance to this finding, following Franklin’s original approach on this, we now calculate adapted (‘corrected’) turnout rates for EP elections. To this end, replicating the techniques used originally, we establish equations based on the OLS regression results of models E and G, i.e. for the EU-15 and EU-28, respectively. The equations, based on the OLS regression coefficients and some additional information as provided below, are now:
(1)
(1)
(2)
(2) Based on the original approach, in equations (1) and (2), ‘compulsory voting’ reflects the percentage of EU member states in each EP election that used compulsory voting, ‘first election’ the percentage of states in which EP elections were held for the first time and ‘electoral salience’ average duration from EP elections to the next national-level election. Following the original approach, the term 1.815, deducted from ‘electoral salience’, reflects average duration (in years) until the next national-level elections were held. Hence, ‘electoral salience’ is compared to the ‘starting moment’ (1979).Footnote34 The constant term at the end of the equations, replicating the original approach, is ‘the increase in turnout we get from having 4 out of 15 countries with compulsory voting at the end of our period, rather than none’ (Franklin, Citation2001, p. 318). In the equation for the 15 ‘old’ EU states, in our analysis, this is three, and five in the case of the EU-28. For the latter, however, two more components are included: ‘Eastern enlargement’ as the percentage of new 2004 enlargement states in an EP election. This then allows us to compute corrected turnout rates, assuming the proportion of EU member states applying compulsory voting remained constant, the average time to the next national election remained as in 1979 (i.e. 1.815), there had been no first-election boost and no EU member state had a past with explicitly less of a ‘habit of voting’.
Franklin’s (Citation2001) corrected (and with this, probably more suitable) calculations for EP election turnout, using this approach, were 53.9 percent for 1989 and 54.8 percent for 1999. Using our extended data set covering the entire 1979–2019 time span and applying the equations presented above, we can derive new graphs.
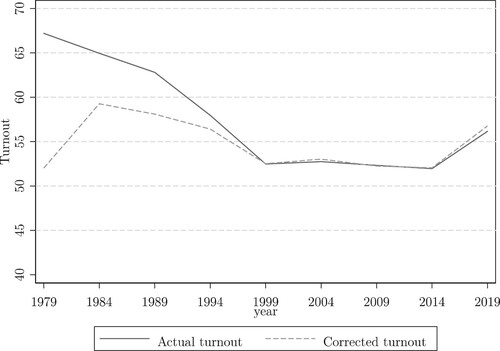
shows outcomes for the EU-15, for all EP elections held between 1979 and 2019. For this group, estimates show increasing (corrected) turnout rates between 1979 and 1984. This contrasts with average turnout usually reported. But since the 1999 EP elections, actual and corrected turnout rates seem to have leveled out, at about 53 percent. The overall decrease in terms of actual turnout, between the 1979 and 2014 elections, was a considerable 15.2 percentage points (widely reported in media and academic research on the topic), whereas the corrected rates show no decrease, but in fact a very small, 0.03 percent, increase. The fact that actual and corrected rates are so close to each other from the EP 1999 elections onwards can largely be explained by the decreased effect of the ‘first EP election’ and ‘compulsory voting’ variables; only ‘electoral salience’ seemed to maintain its effect in practice, albeit it was small. Actual and corrected turnout for the EU-15 do not differ much, at least when assessed for the 1999 and later EP elections.
Figure 1. Actual and corrected turnout for the 15 ‘Old’ (Pre-2004) EU States, EP Elections 1979-2019.
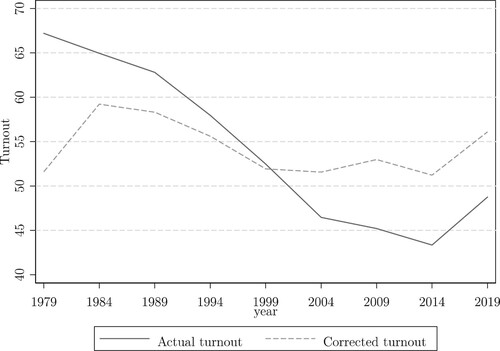
shows actual and corrected turnout in EP elections based on data for the EU-28. Again, clearly, corrected turnout rates show a very different trend compared to average, EU-wide rates: average turnout decreased by 23.9 percentage points between the first EP election of 1979 and 2014, while corrected rates show hardly any change. Accordingly, any work aiming to explain the absolute decline of EP election turnout over time might want to consider such structural factors (alongside other potential individual-level or aggregate factors affecting voter turnout).
Figure 2. Actual and corrected turnout in EP elections for all EU States, 1979-2019.
Of course, our analysis does not necessarily show how much of the relative decline can be ‘explained’ by the models applied (compared to potential other factors), but it may provide an incentive for researchers to at least use some of the corrected rates as a robustness check in their analyses (if not as an alternative dependent variable). In the sequence, we will offer some more insights based on our updated data collection and estimation results.
When the first direct EP elections were held in 1979, two-fifth (40 percent) of the member states applied compulsory voting. By 2014, this share dropped to 18 percent. Multiplying 0.22 – the percentage point change in the share of countries applying compulsory voting – by 27.2 (the compulsory voting coefficient as derived above), we can estimate the extent to which the decrease in the share of states applying compulsory voting affected EP election turnout. According to the estimates based on the replication above, this is about 6 percentage points.
Moreover, in 1979, all EU states enjoyed a ‘first EP election boost’; in 2014, this effect did not apply to any (new) member state. According to the coefficient associated with the ‘first election’ variable, EP turnout is estimated to have decreased by another 9.6 percentage points. In 2014, moreover, almost 40 percent of EU states in EP elections were ‘post-communist’ and with this, typically observed lower turnout due to citizens being less used to voting. Multiplying 0.4 by 17.2 – the coefficient of the ‘Eastern enlargement’ variable derived based on the simple OLS regression above – this variable is expected to cause an approximately 7 percentage point turnout decrease. The impact of ‘electoral salience’, by comparison, is minuscule, as average time across all member states between EP elections and national parliamentary elections in the year 1979 (1.815) was similar to the average distance in 2014 (1.786). Taken together, these three structural factors result in a total of about 21 percentage point changes in EP turnout. Hence, the model, although limited, still seems able to explain a vast chunk of the decline in EP election turnout for the time span 1979–2014. But in 2019 the overall declining trend reversed, with none of the structural factors able to explain this change. Clearly, other variables – including those related to increased politicization of European integration and the rise of Euroscepticism (e.g. De Vries, Citation2018) – mattered, next to (or related with) the strengthened institutional role of the EP, trust in EU institutions, or Brexit.
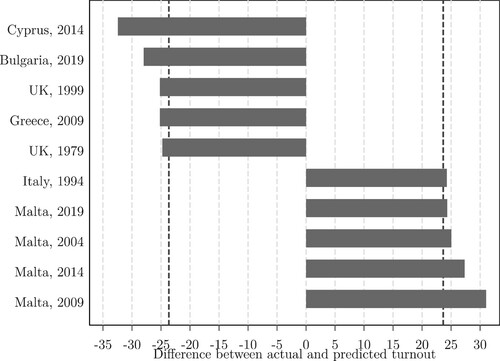
Some insights are also revealing when exploring EP turnout per EU member state (and country-year). Computing residuals based on model G in above, eight outliers can be identified whose residuals exceed two standard deviations (SD = 11.98) from the mean. These cases are displayed in . On the ‘overestimation’ side are Bulgaria (2019), Cyprus (2014), Greece (2009) and the UK (1979 and 1999). For Italy (1994) and Malta (2004, 2009, 2014 and 2019), by comparison, the model underestimates EP turnout rates. The case of Cyprus seems somewhat puzzling, as compulsory voting still applies. An explanation could be that enforcement mechanisms related to compulsory voting are not very strict (Malkopoulou, Citation2009, p. 7).Footnote35 The strong overestimation of turnout for the UK is arguably due to the change of electoral system used for EP elections in 1999 (already reported by Franklin, Citation2001, pp. 319–320): UK voters were likely unfamiliar with proportional election systems. This contrasts, however, with literature seeing proportional electoral systems as more likely to induce voters to cast a vote (e.g. see Blais & Carthy, Citation1990). Overall, an analysis focused on individual EU member states suggests additional explanatory variables, compared to structural ones, should be considered to account for such outliers.
Figure 3. Outliers based on differences between actual and predicted voter turnout.
Finally, we conduct three different robustness checks. First, we verify whether the same structural factors which were able to explain lower EP turnout for the years 1979-1999, 1979-2004, and the entire time span 1979-2014, would also prevail for the subsample 1999–2014 (where turnout dropped by approximately 9 percentage points). Second, we check, given this variable has often been mentioned as a driving force for EP turnout, how Euroscepticism in public opinion may have affected turnout (either positively, by enhancing politicization of EU integration and with this, EP turnout rates or negatively, making voters disengaged from EU politics). Of course, such an approach deviates from Franklin’s original aim, as the models applied then were meant to show how decreasing (absolute) turnout in EP elections did not necessarily reflect enhanced Euroscepticism but could largely be explained by the structural factors. Nonetheless, to link up with some more recent research on driving forces for EP election turnout (e.g. Flickinger & Studlar, Citation2007; Hobolt, Citation2012, p. 103; Fiorino et al., Citation2019), we assess the effect of ‘trust/confidence in the EP’ as an additional variable next to the structural ones, for the EU-28. The ‘trust’ variable is measured as the share of EU citizens stating they tend to ‘trust’ the EP, based on Eurobarometer data for the time span since 1999.Footnote36
The outcomes of this model are shown in b. When inserting this variable into models A and B above, for the EU-15 and EU-28 respectively, only ‘compulsory voting’ and ‘Eastern enlargement’ retain conventional levels of statistical significance, implying they still contribute to explaining variation in EP turnout rates between 1999 and 2014. ‘Electoral salience’ and ‘first election’ boost, by comparison, no longer render statistically significant results for the same time span. Turning to models C and D in b, including the same EU member state and time span subsamples, reveals that adding the ‘trust in EP’ variable increases the predictive power of the models, while the variable itself has statistical significance at the 1 percent level. As this additional exploration demonstrates, structural factors may still be important to explain the (absolute) decline in EP voter turnout notably for the years 1979–1999, yet in the period that followed, a combination of both structural and non-structural factors seems to be better suited. EP elections conducted after Franklin’s, Citation2001 study then seem to represent a ‘trend break’, standing in contrast with the findings of his original study.
Finally, model E, instead of controlling for a binary variable that distinguishes between Eastern and non-Eastern (new) EU member states, takes the form of a dummy capturing only the five Eastern European lowest turnout states (based on Wessels & Franklin, Citation2009). Clearly, such an alternative (and maybe more suitable) coding of Eastern enlargement, even though leading to a higher coefficient, results in largely similar results as those displayed in .
Hence, it may generally be prudent to account for structural factors potentially affecting EP turnout and to account for corrected rates in respective assessments and estimations. Simultaneously, in a more politicized EU and EP elections conducted in an era of Euroscepticism and Brexit, other variables clearly matter. If the original (structural) variables are combined with the individual-level trust in the EP data – and possibly other variables more relevant in later phases – more adequate estimations can be provided, while still putting the ‘decrease in absolute EP turnout’ into a more realistic perspective. The 2019 EP elections were a surprise in terms of turnout – but also a reflection of exactly the effects of the politicization of European integration and the (perceived) weight of the EP in EU inter-institutional procedures. They capture the fact that EP elections are no longer just determined by ‘structural factors’, but by various other trends that appear to strongly increase incentives for citizens to cast their vote in EP elections.
5. Conclusions
The main insights of this paper are as follows. First, structural factors can be still characterized as determinants of turnout in EP elections, but their effect has clearly decreased from the 2014 elections onwards. Second, the power of structural factors to explain turnout at the EU level has become smaller over time, whereas the relevance of non-structural factors has increased. With this, our empirical results confirm that other developments (such as increasing politicization in the EU and more support for Eurosceptic parties) are likely to have increased turnout rates in more recent EP elections.
Our paper started with a re-estimation based on an early analysis, offered by Mark Franklin, that at the time countered some of the criticism related to (strongly) decreasing average EP election turnout. In essence, the model then presented a rebuttal, demonstrating the decrease could be captured and explained by a small number of relevant, structural factors. While the original model had some shortcomings, as did some later adaptations, some aspects explored then should not be ignored in current research on the EP and notably, analyses of turnout in EP elections over time. We collected all necessary data to replicate and update the original analysis, accounting for the full set of EP elections held so far. Given the increased number of EU member states over time, this means our analysis incorporated 175 national-level EP elections in total.
In a next step, we adapted (or ‘corrected’), following the original analysis, EP turnout rates, accounting for the effect of the ‘structural factors’, including the share of EU states that acceded in or after 2004 in total EU membership.Footnote37 Our extended analysis reveals that structural factors still contribute to explaining decline of turnout rates in EP elections since 2004. However, the explanatory power of models capturing the aftermath of the 1999 elections decreases, indicating that the relative influence of the structural factors has decreased over time. Nonetheless, it may be valuable for research focused on ‘non-structural’ effects – notably those covering longer time spans of EP elections – to account for such structural factors deemed to have artificially dampened reported EP election turnout.
Analyzing voter turnout rates in more recent EP elections, we were also able to directly contrast structural factors, by way of example, with a variable mentioned frequently in recent literature: confidence in EU institutions (and in our case, specifically trust in the EP). Results obtained from this combined analysis suggest that trust/confidence in the EP can certainly be another factor explaining variation in EP turnout rates in EU member states in the more recent past. Hence, it may certainly be useful to integrate the effect of structural factors into models accounting for non-structural factors – such as effects of campaigning, Euroscepticism, the Spitzenkandidatensystem or any other individual or aggregate level drivers of turnout used in recent theorizing on EU integration – aiming to explain the development of turnout in EP elections over time.
Although our findings, using an updated data collection and new estimates based on the earlier approaches provide novel insights, we wish to abstain from making causal claims or overinterpreting the correlations observed. Our analysis is not able to account for all potential ‘confounders’ and it is possible and even likely that other – ‘structural’ or ‘non-structural’ – factors influenced voter turnout in EP elections. In fact, such elections are complex, involving mobilization on the national and European levels and are affected by both domestic and transnational, EU-wide trends. In this sense, alternative specifications for some of the variables included into the models above could be used, or others added, affecting overall results.
Nonetheless, based on our replication exercise followed by updates and an extended analysis, it can be stated that non-structural factors are likely to increasingly matter in terms of driving citizens’ decisions to vote in European elections. This corresponds with work claiming that factors such as the extent of politicization of European integration, trust in European institutions, the rise of Eurosceptic parties or increased campaigning efforts have increased turnout in EP elections. Such factors seem to have changed the patterns of electoral democracy in the EU. But as our paper demonstrates, analyses will still benefit from taking earlier research focused on ‘structural’ drivers of EP voter turnout into account, especially when focusing on longer time spans. It also shows that average rates for the EU in terms of EP turnout over time, as widely reported, are limited in terms of their capacity to reflect actual trends in EP election turnout.
Disclosure statement
No potential conflict of interest was reported by the author(s).
Notes
1 We thank the editor of this journal and two anonymous reviewers for helpful comments and suggestions on an earlier version of this article.
2 We will use the term ‘EU’ throughout this manuscript, even if we refer to membership of the (earlier) European Community (EC).
3 Including Greece, where citizens voted two years later in an off-year election, after Greece in 1981 had joined the EU.
4 Franklin (Citation2001); for effects in later EP elections, notably see Franklin (Citation2007) and Franklin and Hobolt (Citation2011).
5 Moreover, the two most frequently used independent variables – age and education – were included in only about three-fourth of the studies. There is no consensus on a ‘core model’ applicable to explain (individual-level) voter turnout.
6 Several studies aim to explain the gradual support for more radical political parties within the EP. Tostes (Citation2011), for example, offers an analysis of linkages between member state size and the election of radical right-wing parties.
7 Accounting for such trends, Føllesdal and Hix (Citation2006) provided reflections on the ways in which electoral contestation in the EU could be enhanced and EP elections made more ‘salient’ to voters across the EU. On this, also see Lehmann (Citation2014) and Karremans (Citation2014).
8 For an analysis of background developments and forecasts for the 2014 EP elections, see Stratulat and Emmanouilidis (Citation2013).
9 Voting in Italy is no longer compulsory, however, since the 1994 EP elections.
10 Linkages between compulsory voting and democracy are discussed in Engelen (Citation2007).
11 This ratio will change again in the 2024 EP elections, due to Brexit.
12 This also encompasses EP elections for new member states held between two regular (general) EP elections, an aspect to be addressed in our methodology section.
13 Somewhat counter-intuitively, the approach did not seem to yield problems related to collinearity.
14 The study of relations between domestic and EP elections, terming the latter ‘second-order national elections’, was initiated by Reif (Citation1984) and Reif and Schmitt (Citation1980). For analyses on how to make EP elections more salient in domestic politics and move them away from ‘second-order elections’ patterns, e.g., see Hix and Marsh (Citation2007) or Hix and Hagemann (Citation2008).
15 Again, this follows the ‘second-order’ logic. Related research has later found a small, but significant, effect of EP elections on turnout in national elections: those entitled to vote for the first time in an EP election were more likely to abstain than others in subsequent national first-order elections (Franklin & Hobolt, Citation2011).
16 Note that the operationalization of this variable has also been criticized, notably because the actual distance in terms of the time span to new elections may not always be known.
17 The ‘first election boost’ variable, for example, no longer seemed to apply the way it did in the earlier analysis. Consequently, the authors introduced a fourth structural factor in their adapted analysis: ‘post-communist country’ (the transitional economies of Eastern Europe, which typically registered lower turnout rates as compared to more mature democracies where voting had been practiced more extensively). Wessels and Franklin (Citation2009) in fact proposed an alternative for this structural factor: ‘low turnout country’.
18 When more states characterized by a historical absence of the ‘habit of voting’ became EU members in 2004, according to this line of thought, this likely negatively affected voter turnout on the EU aggregate level. With the inclusion of this fourth structural factor in Wessels and Franklin’s analysis, the goodness of fit of the model aiming to explain voter turnout for the time span 1979 to 2004, for the EU-25, increased and was comparable to the results obtained for 1979 to 1999.
19 Analyzing EP elections up to 2014, Schmitt and Toygür (Citation2016) found, however, that a certain politicization of EU politics – including the nomination and campaigning of ‘Spitzenkandidaten’ (i.e., lead candidates of EP political groups for the European Commission (EC) presidency) had not yet generated expected results, as EP elections were still characterized by their ‘second-order nature’.
20 Controlling for such ‘delayed elections’ by inserting them as dummy variables does not change our main estimation results; see in the appendix to this paper.
21 See http://www.idea.int/vt/index.cfm.
22 For Germany, for example, data are from http://www.bundeswahlleiter.de/de/europawahlen/fruehere_europawahlen/ew1979.html (for 1979), from http://www.bundeswahlleiter.de/de/europawahlen/fruehere_europawahlen/ew1984.html (for 1984), from http://www.bundeswahlleiter.de/de/europawahlen/fruehere_europawahlen/ew1989.html (for 1989) and finally, for Croatia from http://www.izbori.hr/2013EUParlament/rezult/r_00_0000_000.html?t=1365972717300 (for 2013).
23 See Engelen (Citation2007, p. 42).
24 We also use an alternative coding scheme for compulsory voting by assuming that -- similar to Wessels and Franklin (Citation2009) -- when voting was no longer compulsory, its effect gradually phased out rather than stopped abruptly. Trying to account for gradually decreasing effects, Italy is coded as 0.875, 0.75, 0.650, 0.5, 0.375 and 0.250 for compulsory voting in 1994, 1999, 2004, 2009, 2014 and 2019, respectively. The analysis based on this alternative coding, however, does not provide substantively different results for our estimates (see , appendix). Only two states – Italy and Bulgaria – reformed their system in the time span covered by our analysis. Hence, estimates based on such adaptations need to be used with caution, as the number of relevant cases is very small.
25 This coding, based on the original conception of the variable, has faced criticism, notably as the date of the next national election is often not known at the time the EP election is conducted and hence, anticipation effects may not materialize in the ways Franklin’s Citation2001 model had suggested. Moreover, measuring ‘distance’ either before or after the election will not necessarily capture the same effects on voters’ inclination to vote. Nonetheless, to stay within the replication framework for the time being, we use the same operationalization.
26 See the Inter-Parliamentary Union (IPU) website at http://www.ipu.org/parline-e/parlinesearch.asp.
27 Because Croatia (which joined the EU in 2013) had not conducted domestic parliamentary elections since the last EP elections were held (2009), the day of the next scheduled election was used instead. Croatian national elections were conducted on 11 September 2016. This assessment method slightly differs from Franklin’s original analysis, as he used the average time between two national elections to ‘predict’ the time of the next national election (Franklin, Citation2001, p. 316). A similar divergence in assessment then applies to most EU states with respect to the next national election held after the 2014 EP elections.
28 This is a disadvantage of the way ‘electoral salience’ is operationalized in Franklin (Citation2001). It is almost impossible, however, to accurately account for such future anomalies at the time EP elections are or were held. Accordingly, we will stick with this operationalization for our study, based on updated data, although the approach – while as ‘objective’ as possible – is not without flaws.
29 This applies to the Czech Republic, Estonia, Lithuania, Latvia, Hungary, Poland, Slovenia, Slovakia, Bulgaria, Romania and Croatia.
30 Wessels and Franklin (Citation2009) used a slightly different approach, by selecting five especially ‘low-turnout’ post-communist countries for their analysis. We will use the approach described above, but explore effects based on the alternative approach as a robustness check.
31 These results are directly comparable to model A in Franklin (Citation2001), table 1.
32 The results are very much comparable to those of model A, table 1 in Wessels and Franklin (Citation2009).
33 These results are directly comparable to those generated by model B in Wessels and Franklin (Citation2009), .
34 In a multiple regression framework, using categories for independent variables, this would be the reference group.
35 Declining turnout could also be due, however, to the Cypriot financial crisis 2012–2013 and the conditional bailout that followed.
36 Respective data are available at http://ec.europa.eu/eurostat/tgm/table.do?tab=table&plugin=1&language=en&pcode=sdg_16_60.
37 This variable had been added by Wessels and Franklin (Citation2009). For a discussion of the original model and potential modifications, see the methodology section above.
References
- Adshead, M., & Hill, J. (2005). Elections to the European parliament, June 2004: The 15 established member states. Electoral Studies, 24(3), 537–545. https://doi.org/10.1016/j.electstud.2005.01.008
- Beck, N., & Katz, J. N. (1995). What To Do (and Not to Do) with time-series cross-section data. American Political Science Review, 89(3), 634–647. https://doi.org/10.2307/2082979
- Bhatti, Y., & Hansen, K. M. (2012). The effect of generation and age on turnout to the European parliament – How turnout will continue to decline in the future. Electoral Studies, 31(2), 262–272. https://doi.org/10.1016/j.electstud.2011.11.004
- Blais, A., & Carthy, R. K. (1990). Does proportional representation foster voter turnout? European Journal of Political Research, 18(2), 167–181. https://doi.org/10.1111/j.1475-6765.1990.tb00227.x
- Braun, D. (2021). The Europeanness of the 2019 European parliament elections and the mobilising power of European issues. Politics, Online first: https://doi.org/10.1177/0263395721992930.
- Braun, D., & Grande, E. (2021). Politicizing Europe in elections to the European parliament (1994–2019): The crucial role of mainstream parties. JCMS: Journal of Common Market Studies, 59(5), 1124–1141. https://doi.org/10.1111/jcms.13168
- Christiansen, T. (2016). After the Spitzenkandidaten: Fundamental change in the EU’s political system? West European Politics, 39(5), 992–1010. https://doi.org/10.1080/01402382.2016.1184414
- De Sio, L., Franklin, M. N., & Russo, L. (2019). The European parliament elections of 2019. Luiss University Press.
- De Vries, C. E. (2018). Euroscepticism and the future of European integration. Oxford University Press.
- De Wilde, P., & Zürn, M. (2012). Can the politicization of European integration be reversed? JCMS: Journal of Common Market Studies, 50(s1), 137–153. https://doi.org/10.1111/j.1468-5965.2011.02232.x
- Engelen, B. (2007). Why compulsory voting can enhance democracy. Acta Politica, 42(1), 23–39. https://doi.org/10.1057/palgrave.ap.5500167
- Fiorino, N., Pontarollo, N., & Ricciuti, R. (2019). Supranational, national and local dimensions of voter turnout in European parliament elections. JCMS: Journal of Common Market Studies, 57(4), 877–893. https://doi.org/10.1111/jcms.12851
- Flickinger, R. S., & Studlar, D. T. (2007). One Europe, many electorates?: Models of turnout in European parliament elections after 2004. Comparative Political Studies, 40(4), 383–404. https://doi.org/10.1177/0010414006288970
- Føllesdal, A., & Hix, S. (2006). Why there is a democratic deficit in the EU: A response to majone and moravcsik. JCMS: Journal of Common Market Studies, 44(3), 533–562. https://doi.org/10.1111/j.1468-5965.2006.00650.x
- Franklin, M. N. (2001). How structural factors cause turnout variations at European parliament elections. European Union Politics, 2(3), 309–328. https://doi.org/10.1177/1465116501002003003
- Franklin, M. N. (2007). Effects of space and time on turnout in European parliament elections. In W. van der Brug, & C. van der Eijk (Eds.), European elections and domestic politics: Lessons from the past and scenarios for the future (pp. 13–34). University of Notre Dame Press.
- Franklin, M. N., & Hobolt, S. B. (2011). The legacy of lethargy: How elections to the European parliament depress turnout. Electoral Studies, 30(1), 67–76. https://doi.org/10.1016/j.electstud.2010.09.019
- Gattermann, K., & Marquart, F. (2020). Do Spitzenkandidaten really make a difference? An experiment on the effectiveness of personalized European parliament election campaigns. European Union Politics, 21(4), 612–633. https://doi.org/10.1177/1465116520938148
- Geys, B. (2006). Explaining voter turnout: A review of aggregate-level research. Electoral Studies, 25(4), 637–663. https://doi.org/10.1016/j.electstud.2005.09.002
- Hernández, E., & Kriesi, H. (2016). Turning your back on the EU. The role of Eurosceptic parties in the 2014 European parliament elections. Electoral Studies, 44, 515–524. https://doi.org/10.1016/j.electstud.2016.04.013
- Hix, S., & Hagemann, S. (2008). Could changing the electoral rules fix European parliament elections? Politique Européenne, 28(2), 27–41.
- Hix, S., & Marsh, M. (2007). Punishment or protest? Understanding European parliament elections. The Journal of Politics, 69(2), 495–510. https://doi.org/10.1111/j.1468-2508.2007.00546.x
- Hobolt, S. B. (2012). Citizen satisfaction with democracy in the European Union. JCMS: Journal of Common Market Studies, 50(s1), 88–105. https://doi.org/10.1111/j.1468-5965.2011.02229.x
- Hobolt, S. B. (2014). A vote for the president? The role of Spitzenkandidaten in the 2014 European parliament elections. Journal of European Public Policy, 21(10), 1528–1540. https://doi.org/10.1080/13501763.2014.941148
- Hobolt, S. B. (2015). The 2014 European parliament elections: Divided in unity? JCMS: Journal of Common Market Studies, 53, 6–21. https://doi.org/10.1111/jcms.12264
- Hobolt, S. B., & Spoon, J.-J. (2012). Motivating the European voter: Parties, issues and campaigns in European parliament elections. European Journal of Political Research, 51(6), 701–727. https://doi.org/10.1111/j.1475-6765.2012.02057.x
- Hobolt, S. B., Spoon, J.-J., & Tilley, J. (2009). A vote against Europe? Explaining defection at the 1999 and 2004 European parliament elections. British Journal of Political Science, 39(1), 93–115. https://doi.org/10.1017/S0007123408000422
- Hogh, E., & Larsen, M. V. (2016). Can information increase turnout in European parliament elections? Evidence from a quasi-experiment in denmark. JCMS: Journal of Common Market Studies, 54(6), 1495–1508. https://doi.org/10.1111/jcms.12407
- Hutter, S., & Grande, E. (2014). Politicizing Europe in the national electoral arena: A comparative analysis of five West European countries, 1970-2010. JCMS: Journal of Common Market Studies, 52(5), 1002–1018. https://doi.org/10.1111/jcms.12133
- Hutter, S., Grande, E., & Kriesi, H. (eds.). (2016). Politicising Europe: Integration and mass politics. Cambridge University Press.
- Hutter, S., & Kriesi, H. (2016). Politicising Europe: Integration and mass politics. Cambridge University Press.
- Hutter, S., & Kriesi, H. (2019). Politicizing Europe in times of crisis. Journal of European Public Policy, 26(7), 996–1017. https://doi.org/10.1080/13501763.2019.1619801
- Karremans, J. (2014). Why not solve the democratic deficit within the EU through genuine transnational political conflict? Working Paper, EUI RSCAS, 2014/107, EUDO - European Union Democracy Observatory.
- Kriesi, H. (2016). The politicization of European integration. JCMS: Journal of Common Market Studies, 54(s1), 32–47. https://doi.org/10.1111/jcms.12406
- Lehmann, W. (2014). Revitalizing European representative democracy beyond 2014: Can elections to the European parliament be made more consequential? In L. Bardi, H. Kriesi, & A. H. Trechsel (Eds.), Elections in Europe in times of crisis (pp. 91–107). European University Institute.
- Maier, J., Faas, T., Rittberger, B., Fortin-Rittberger, J., Josifides, K. A., Banducci, S., Bellucci, P., Blomgren, M., Brikse, I., Chwedczuk-Szulc, K., & Lobo, M. C. (2017). This time it’s different? Effects of the Eurovision debate on young citizens and its consequence for EU democracy – evidence from a quasi-experiment in 24 countries. Journal of European Public Policy, https://doi.org/10.1080/13501763.2016.1268643
- Malkopoulou, A. (2009). Lost voters: Participation in EU elections and the case for compulsory voting, CEPS Working Document No. 317/ July 2009.
- Marquart, F., Goldberg, A. C., & de Vreese, C. H. (2020). ‘This time I’m (not) voting’: A comprehensive overview of campaign factors influencing turnout at European Parliament elections. European Union Politics, 21(4), 680–705. https://doi.org/10.1177/1465116520943670
- Mattila, M. (2003). Why bother? Determinants of turnout in the European elections. Electoral Studies, 22(3), 449–468. https://doi.org/10.1016/S0261-3794(01)00054-3
- Nonnemacher, J. (2021). Disengaging elections? Political interest, number of elections, and turnout in elections to the European parliament. European Union Politics, 22(3), 545–565. https://doi.org/10.1177/1465116521998455
- Reif, K. (1984). National electoral cycles and European elections 1979 and 1984. Electoral Studies, 3(3), 244–255. https://doi.org/10.1016/0261-3794(84)90005-2
- Reif, K., & Schmitt, H. (1980). Nine second order national elections – A conceptual framework for the analysis of european election results. European Journal of Political Research, 8(1), 3–44. https://doi.org/10.1111/j.1475-6765.1980.tb00737.x
- Risse, T. (ed.). (2014). European public spheres:Politics Is back. Cambridge University Press.
- Schmitt, H., Hobolt, S., & Popa, S. A. (2015). Does personalization increase turnout? Spitzenkandidaten in the 2014 European parliament elections. European Union Politics, 16(3), 347–368. https://doi.org/10.1177/1465116515584626
- Schmitt, H., & Mannheimer, R. (1991). About voting and non-voting in the European elections of June 1989. European Journal of Political Research, 19(1), 31–54. https://doi.org/10.1111/j.1475-6765.1991.tb01176.x
- Schmitt, H., Sanz, A., Braun, D., & Teperoglou, E. (2020). It all happens at once: Understanding electoral behaviour in second-order elections. Politics and Governance, 8(1), 6–18. https://doi.org/10.17645/pag.v8i1.2513
- Schmitt, H., & Toygür, İ. (2016). European parliament elections of May 2014: Driven by national politics or EU policy making? Politics and Governance, 4(1), 167–181. https://doi.org/10.17645/pag.v4i1.464
- Schmitt, H., & van der Eijk, C. (2007). Non-voting in European parliament elections and support for European integration. In W. van der Brug, & C. van der Eijk (Eds.), European elections & domestic politics: Lessons from the past and scenarios for the future (pp. 145–167). University of Notre Dame Press.
- Smets, K., & van Ham, C. T. (2013). The Embarrassment of riches? A meta-analysis of individual level research on voter turnout. Electoral Studies, 32(2), 344–359. https://doi.org/10.1016/j.electstud.2012.12.006
- Stratulat, C., & Emmanouilidis, J. A. (2013). The European parliament elections 2014: Watershed or, again, washed out? Discussion paper, September. European Policy Centre (EPC).
- Tostes, A. P. (2011). Euroskepticism in European national elections: The rise of voter support for new radical right parties. Brazilian Political Science Review, 5(1), 77–104.
- Treib, O. (2014). The voter says no, but nobody listens: causes and consequences of the Eurosceptic vote in the 2014 European elections. Journal of European Public Policy, 21(10), 1541–1554. https://doi.org/10.1080/13501763.2014.941534
- Treib, O. (2021). Euroscepticism is here to stay: what cleavage theory can teach us about the 2019 European parliament elections. Journal of European Public Policy, 28(2), 174–189. https://doi.org/10.1080/13501763.2020.1737881
- Van der Brug, W., & de Vreese, C. H. (2018). (Un)intended consequences of EU parliamentary elections. Oxford University Press.
- Van der Eijk, C., Franklin, M., & Marsh, M. (1996). What voters teach us about Europe-wide elections: What Europe-wide elections teach us about voters. Electoral Studies, 15(2), 149–166. https://doi.org/10.1016/0261-3794(96)00009-1
- Varilopoulou, S., & Gattermann, K. (2021). Does politicization matter for EU representation? A comparison of four European parliament elections. JCMS: Journal of Common Market Studies, 59(3), 661–678. https://doi.org/10.1111/jcms.13125
- Wessels, B., & Franklin, M. N. (2009). Turning out or turning off: Do mobilization and attitudes account for turnout differences between new and established member states at the 2004 EP elections? Journal of European Integration, 31(5), 609–626. https://doi.org/10.1080/07036330903145880
Appendices
Table A1. Turnout in EP elections: Controlling for delayed EP elections.
Table A2. Turnout in EP elections: Alternative operationalization of ‘Compulsory Voting’.