
 ?Mathematical formulae have been encoded as MathML and are displayed in this HTML version using MathJax in order to improve their display. Uncheck the box to turn MathJax off. This feature requires Javascript. Click on a formula to zoom.
ABSTRACT
Weakly ionized plasmas at or near 1 atm pressure, or atmospheric-pressure plasmas, have received increasing attention due to their scientific significance and potential for use in a variety of applications, particularly for medicine, agriculture, and food. However, there is a large imbalance between scientific research on plasma physics and applications, which is partly due to the considerable differences in the characteristics of these plasmas compared with those of low-pressure plasmas. This discrepancy is particularly related to the difficulty in performing plasma diagnostics for highly collisional plasmas. Information on electrons (such as the electron density and temperature) is essential since electrons play a dominant role in the generation of active species related to the physical and chemical processes inside the plasma. So far, limited diagnostics have been available for electrons such as Thomson scattering and optical emission diagnostics based on equilibrium models. Here, we review the available diagnostic methods along with their merits and limitations for characterizing electrons in weakly ionized collisional plasmas. Particular attention is paid to continuum radiation-based spectroscopy, which facilitates multidimensional imaging of electron density and temperature. The future impact of these plasmas on relevant fields (i.e. laboratory and industrial plasmas and their applications) is also addressed.
Graphical Abstract
© IOP Publishing. Reproduced with permission. All rights reserved. Source: Sanghoo Park, Wonho Choe, Holak Kim and Joo Young Park. Continuum emission-based electron diagnostics for atmospheric pressure plasmas and characteristics of nanosecond-pulsed argon plasma jets. Plasma Sources Science and Technology, 24(3), 034003. 29 April 2015. https://doi.org/10.1088/0963-0252/24/3/034003
1 Introduction
One plasma discharge is one man’s treasure. Most natural plasmas occur in environments that present extremely poor conditions for humans. However, well-confined and well-tailored artificial plasmas allow human beings to reveal previously unexplored natural phenomena and applied to almost all disciplines, from nanoscale material processing to large-scale, high-temperature fusion research for energy demand [Citation1,Citation2]. Therefore, plasma has been considered one of the most important and interesting types of matter in scientific and industrial fields.
Since radiant matter was first identified in a cathode tube by Crookes in 1879 [Citation3], energetic gaseous matter, that is, plasma, has been rapidly explored in fields ranging from natural sciences to applied physics. In the early period of plasma research (maybe from the beginning), most artificial plasmas were created in limited spaces by electrodes or vacuum chambers because the reduced pressure was preferred for the production of stable and homogenous plasmas. Because of the increasing need for plasma, which is generated in an open space, and to avoid drawbacks associated with vacuum, many efforts have been devoted toward atmospheric-pressure plasmas. These advances have led to increasingly interesting and explosive research in relevant fields and allowed for the expansion of plasma-based scientific research and industry. Currently, the study of atmospheric-pressure plasmas, especially those in thermodynamic nonequilibrium, is experiencing a renaissance and opening a new era of research in diverse plasma applications (examples in ).
Figure 1. Remarkable results of atmospheric-pressure plasma research, from plasma diagnostics to applications [Citation17,Citation23,Citation24,Citation66,Citation84].
Adapted by permission of each publisher.
![Figure 1. Remarkable results of atmospheric-pressure plasma research, from plasma diagnostics to applications [Citation17,Citation23,Citation24,Citation66,Citation84].Adapted by permission of each publisher.](/cms/asset/18e30a3c-7b7e-44d5-b683-e10a81e0149a/tapx_a_1526114_f0001_oc.jpg)
From dielectric barrier discharge (DBD), which was originally invented for ozone generation [Citation4,Citation5], to voluminous glow discharge, which has been used for material processing [Citation6–Citation8], gas remediation [Citation9,Citation10], and so forth, various atmospheric-pressure plasmas have continuously been optimized and utilized for a number of industries [Citation11–Citation13]. In the case of nonequilibrium (weakly ionized) plasmas, low gas temperature operations enable heat-sensitive materials to receive sample treatment. Thus, two of the distinguished research areas that use atmospheric-pressure plasmas are biomedicine and the food industry. In the last decade, ‘plasma medicine’ as an interdisciplinary topic has been a large portion of plasma applications, and collaborations between plasma physicists and biologists have led to an advance our knowledge of this topic. Recent remarkable achievements have been observed for cancer therapy (plasma-activated immune response leading to cell death in tumors [Citation14]) and chronic wound healing (plasma-aided proliferation of fibroblasts and angiogenesis [Citation15]) using plasma technology. Another impressive topic is the plasma applications for food and agriculture, namely ‘plasma farming,’ which is defined as a ‘comprehensive plasma application to the entire agricultural stages from farm to table.’ In this field, water activated by plasma directly or indirectly has been of great interest because of its bactericidal activity [Citation16] and usefulness as an alternative nitrite source for processed meat [Citation17,Citation18]. In addition, the wide applicability of plasma technology to the food and agriculture industries has been confirmed by approaches that use plasma for the enhancement of seed germination rates, plant yields, and plant growth [Citation19,Citation20]; remediation of soil and water [Citation21]; and improvement of functional activities in biomaterials [Citation22].
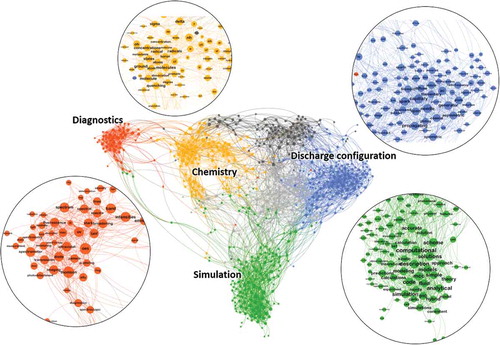
To clarify the key factors in plasma research, peer-reviewed articles published in Plasma Sources Science and Technology (PSST, iopscience.iop.org/journal/0963-0252), which is an eminent journal of low-temperature plasmas, are analyzed using text analytics, and the results are shown in . A dataset of 3060 articles published from 1992 to March 2018 was collected using the ‘Web of Science’ service (apps.webofknowledge.com) provided by Clarivate Analytics. The articles are truncated because results are returned with the title and abstract. As depicted in , the words used in articles are categorized into four major groups: plasma diagnostics, plasma chemistry, discharge configuration, and numerical simulation. This text analytics result will be referred to in the following introduction. The size of the nodes and words in the figure indicates the eigenvector centrality, which is a measure of the influence of each word in the network.
Figure 2. Word network of PSST dataset. Nodes represent each word, and forced lines (called edges), which connect between words, indicate a similarity value (0–1 range) of words. Words that were detected more than 50 times in the whole dataset were selected and used in this graphic network, and only edges having a similarity value of > 0.85 are shown. Node and edge colors indicate a cluster affiliation based on modularity.
As plasma applications have become diversified and more specified, a variety of plasma sources have been proposed and developed (highly considered configurations are included in the ‘discharge configuration’ group in the word network). Depending on the way of plasma operation and working conditions (including whether the surface of the metal electrode is oxidized or not [Citation25,Citation26]), plasmas show very different characteristics. Thus, in parallel with the plasma applications, the fundamental physicochemical properties of plasma have also been investigated using proper diagnostic methods. In addition, due to the rapid increase in certification requirements (e.g. from the Food and Drug Administration in the United States or the European Medicines Agency in Europe) for the use of plasma devices for human or food applications, regularization based on ‘standard’ diagnostic methods becomes imperative. Therefore, advanced plasma diagnostics that promise high reliability and applicability are strongly needed. The main goals of plasma diagnostics (including electron characterization) are as follows:
control and optimization of plasma properties, e.g. plasma profile, plasma density, and spatiotemporal variation in plasma quantities;
plasma physics studies in terms of all plasma species; and
identification of plasma properties for use as a basis for performance improvements or lifespan extensions of plasma reactors and its components.
The application of atmospheric-pressure plasmas mostly relies on the reactive chemical species in the plasma, whose behavior definitely depends on the electron kinetics in the plasma. A close relationship between plasma diagnostics and chemistry is shown in the word network (the ‘diagnostics’ group is mostly linked with words in the ‘chemistry’ group). The physical processes in plasmas as well as the production of reactive particles, such as oxygen- and nitrogen-related species, are strongly governed by direct electron impact reactions that involve excitation and dissociation, and the rates of these reactions present an exponential dependence on the electron temperature (Te). Thus, information on electrons, such as the electron density (ne) and electron energy distribution, is particularly valuable and indispensable to plasma science. In the case of low-temperature plasmas operated at low pressure, electron characterization has been actively performed under various operating conditions because simple and well-established electrical probes (e.g. Langmuir probes) with relevant theoretical models are available at low pressure. As considerable plasma parameters have been experimentally obtained via such simple diagnostics, they have allowed for further insights into plasma physics, including electron kinetics [Citation27–Citation29] and electron heating mechanisms [Citation30,Citation31].
Compared with low-pressure plasmas, limited experimental information is available for free electrons in atmospheric-pressure plasmas, which are difficult to measure, and this lack of data is troublesome. Although numerical or analytical studies [Citation32–Citation34] (‘Monte Carlo collision’ and ‘fluid’ models have commonly been used according to the word network in ) have been reported aggressively, only a few reports have focused on experimentally characterized free-electron information. Many diagnostics that are actively used for low-temperature and low-pressure plasmas may be of limited use for atmospheric-pressure plasmas, such as electrical probes, which must be equipped with a highly collisional sheath theory to be utilized for atmospheric-pressure plasmas. Although the laser Thomson scattering method (one of most used methods as appeared in the word network) and millimeter-wave interferometry are well established and useful, they usually require costly and complicated instruments, and they entail experimental challenges, particularly for weakly ionized atmospheric-pressure plasmas. Thus, simple and inexpensive diagnostics rather than conventional tools that are costly and complex are needed to facilitate electron characterization.
In this regard, optical emission spectroscopy (OES) has become one of the most commonly used diagnostics (‘OES,’ ‘spectroscopy,’ and relevant words have central positions in the ‘diagnostics’ group of the word network in ). The Stark broadening of atomic lines provides a straightforward relation between the spectral broadening of atomic emission and ne [Citation35], and the ratio of line intensities is related to ne based on the collisional-radiative model [Citation36,Citation37]. But, care should be taken with these diagnostics because the former method is only valid at ne > 1013 cm−3, while the latter relies heavily on accurate reaction cross-section data, thus, the lack of data or incorrect reaction constants lead to inaccurate measurement results. As pointed out in Refs. [Citation38–Citation40], continuum radiation-based electron characterization represents one of the easiest methods of determining both ne and Te simultaneously. The continuum radiation from the ionized gas originates from the free electrons that undergo interactions with ions and neutral atoms; thus, valuable information on the statistical state of free electrons can be retrieved from the measured emission spectrum. By properly analyzing the electron-neutral atom bremsstrahlung, ne and Te can be experimentally estimated for atmospheric-pressure plasmas, even those with a low degree of ionization.
Recently, a number of review articles (covering a wide range of topics from basic plasma physics to practical engineering) have been published on atmospheric-pressure plasmas [Citation11,Citation41–Citation43]. This short review selectively focuses on diagnostic techniques for electron characterization, particularly neutral bremsstrahlung-based method, for weakly ionized collisional plasmas at atmospheric pressure. Although we review electron characterization for atmospheric-pressure plasmas because most of them are weakly ionized, the diagnostic techniques provided in this paper are not limited to the following cases. In the next section, the general characteristics of weakly ionized atmospheric-pressure plasmas and technical challenges on electron characterization are discussed. Subsequently, the diagnostic techniques used for free-electrons in atmospheric-pressure plasmas are briefly introduced and then a detailed electron characterization based on bremsstrahlung will be elucidated along with the associated theories. Section 3 describes the practical considerations of continuum radiation-based electron diagnostics and a novel technique for imaging two-dimensional (2-D) and 3-D spatiotemporal distributions of ne and Te, and the results clearly show that nanosecond-resolved 2-D optical diagnostics enable imaging of electron heating structures with an oscillating field in the plasma. Section 4 explains the imperative implications of electron characterization for plasma applications using atmospheric-pressure weakly ionized plasmas. Finally, Section 5 presents the conclusions and outlook.
Text analytics method
In the first stage of modeling, all nouns were extracted from the set of documents using the part-of-speech tagging technique [Citation44], which is a process of classifying the words in a sentence for a meaningful analysis. We estimated the similarities using the cosine similarity measure between different words with their embeddings. Recently, Word2Vec [Citation45] has been proposed to learn word embeddings, which are capable of capturing semantic similarities (i.e. the words that occur in similar contexts are inferred to have similar embeddings). Specifically, we learned the word embeddings on the dataset of PSST using Gensim software [Citation46] with the Continuous Bag of Words (CBOW) model [Citation45], which predicts the targeted word given the context. The modeling results are plotted as an undirected graph in using Gephi software [Citation47], and the weights represent the similarities for each word pair.
2. Introductory overview of electron characterization
Numerous ways of plasma production offer boundless opportunities for controlling the physicochemical processes in plasmas, which means that a number of plasmas with different characteristics can be produced. Thus, because the purpose and utilization of plasmas depend on the plasma characteristics, plasma characterizations are necessary and the results should be easily available in the literature, which is why adjectives (phrases) are usually added to the term plasma to classify the properties of plasmas. As shown in , a variety of control parameters have been employed. Atmospheric-pressure plasmas also present different characteristics depending on the working condition (such as the type of electric power and the amount of energy transferred to the plasma), and they can be roughly classified as summarized in . In addition, the degree of ionization and thermodynamic characteristics are well-known product-oriented criteria in terms of ne and Te. However, the categorization of atmospheric-pressure plasmas by ne and Te is still nontrivial because electron information is largely missing. In this section, we review the types and characteristics of typical atmospheric-pressure plasmas along with previously reported electron information and briefly introduce the associated electron diagnostic methods.
Table 1. Classification of plasmas in terms of operational conditions and electron characteristics.
2.1. Weakly ionized plasmas at atmospheric pressure
Plasmas produced at atmospheric or higher pressure can be divided into two groups: plasmas in thermodynamic equilibrium and plasmas in nonequilibrium. While atmospheric-pressure plasmas in the equilibrium state present equivalent temperatures for electrons, ions, and neutral particles (), nonequilibrium plasmas present low gas temperatures that are far from the electron temperature (
). As introduced, low-temperature applications using nonequilibrium atmospheric-pressure plasmas, particularly biomedicine and plasma farming, have been intensively studied. Plasma is also classified in terms of the degree of ionization [χ = ne/(ne + nn)], the density ratio of electrons or ions and the background neutrals (nn). ‘Fully’ ionized plasmas are those in which only charged particles are present or the electron-ion collision frequency
is much greater than the electron-neutral collision frequency
, whereas ‘partially’ or ‘weakly’ ionized plasmas are those in which χ is lower than 10−6 or
. Except for a few high-temperature plasmas (e.g. fusion plasmas), most plasmas are weakly ionized, including Earth’s ionosphere and stellar chromospheres. Likewise, at atmospheric pressure (1 atm), most engineered plasmas in laboratories are weakly ionized except high-current arc plasmas, where χ ~ 1. The most popular and fascinating types for producing nonequilibrium and weakly ionized plasmas at atmospheric pressure (selected based on the text analytics result given in ) are displayed in . In the following, we provide an introductory overview of the three most popular and widely used types of weakly ionized atmospheric-pressure plasmas.
Figure 3. Most popular and fascinating types of plasmas produced at atmospheric pressure (from the left in order): gliding arc ([Citation48], reproduced by permission of John Wiley and Sons), plasma jet ([Citation49], adapted by permission of John Wiley and Sons), dielectric barrier discharge (photographs represent a fabric-type source that is similar to the source provided in Refs. [Citation50,Citation51]), radio-frequency capacitive discharge, and microwave plasma torch ([Citation50], reproduced by permission of AIP Publishing).
![Figure 3. Most popular and fascinating types of plasmas produced at atmospheric pressure (from the left in order): gliding arc ([Citation48], reproduced by permission of John Wiley and Sons), plasma jet ([Citation49], adapted by permission of John Wiley and Sons), dielectric barrier discharge (photographs represent a fabric-type source that is similar to the source provided in Refs. [Citation50,Citation51]), radio-frequency capacitive discharge, and microwave plasma torch ([Citation50], reproduced by permission of AIP Publishing).](/cms/asset/c88cac56-5bcc-49ea-a5cb-6d1030f9747b/tapx_a_1526114_f0003_oc.jpg)
Plasma jet
Because of the increased research interest in the use of plasma for biomedical applications (as well as for selective processes in open spaces), the demand has grown for devices that can deliver reactive plasma species well beyond the volumes that are limited by the electrodes or dielectric structures. Therefore, plasma apparatuses that have high aspect ratios of plasma shape (ratio of axial length to diameter) and easily release plasma into open spaces with low gas temperatures have been intensively suggested and developed. These devices came to be known as cold ‘plasma jets.’ Various configurations of apparatuses for plasma jets are currently used, and they can be easily found in the literature [Citation11,Citation52–Citation56]. A plasma jet actuator generally consists of at least a pin electrode and a dielectric tube guiding the plasma with working gas, and it is optionally combined with additional dielectrics, simple electric circuits, or a ground electrode to ensure electrical safety or to tailor the electromagnetic field configuration. Thus, the geometry for producing plasma jets at atmospheric pressure is very simple, and expensive and complicated facilities are not generally required. Moreover, the size of the plasma is not limited, and short-lived species and even charged particles can reach the target objects to be treated [Citation57]. Thus, plasma jets have a high applicability and flexibility for various applications, including in vivo single-cell cancer therapy [Citation58] as well as plasma-assisted quantum dot synthesis [Citation59]. Most recently, plasma jets were specifically used as a weakly ionized plasma source in experiments for a case study on electric wind [Citation60], etching biological samples [Citation61], and electron solvation [Citation62], based on the unique features of this type, such as a preference for guiding and releasing plasma species into the ambient air.
Along with the use of plasma jets on biological samples for such purposes as wound healing [Citation63–Citation65] and cancer therapy [Citation66,Citation67], intensive investigations on the physical and chemical properties of the plasma jet have been conducted. Because the chemical species produced in plasma jets play an exclusive role in most applications, chemical processes between working gases (He, Ar, Ne, etc.) and ambient air (N2, O2, etc.) and between gaseous reactive species and liquid have been actively explored. More specifically, many efforts have been devoted to identifying the key species in the jet plasma and revealing the separate or synergistic significance of those species on biological systems. Active species and relevant diagnostic methods have been well discussed in recent review papers [Citation68–Citation70].
The most important physical process in plasma jets is the ionization wave, or the so-called streamer-like plasma propagation or plasma bullet that is initiated in the vicinity of the powered electrode and propagates toward the ground electrode or into the ambient air usually at a few tens of km· s−1 speed [Citation53]. Over the past decade, active research has been underway on plasma bullets under different driving conditions, such as electrode configurations, gas types and their flow rates, and input power levels [Citation55], and extensive experimental and numerical studies to establish the plasma bullet mechanism and its dynamics have revealed the role of seed electron density [Citation71,Citation72], photoionization [Citation72,Citation73], and a self-induced electric field at the bullet head [Citation74,Citation75]. In particular, with the help of fast intensified charge-coupled device (ICCD) cameras, the study of plasma bullet dynamics from creation to collapse at the nanosecond scale have become possible.
For further insights, the electrons in plasma jets has also been characterized using various electron diagnostic techniques, such as laser Thomson scattering [Citation76–Citation78], laser interferometry [Citation79], Stark broadening of hydrogen atomic lines [Citation80–Citation82], and continuum radiation [Citation84]. The line broadening method has been widely used for most electron studies in atmospheric-pressure plasmas, particularly in microwave- and radio-frequency-excited plasmas because of their high ne. Moon et al. [Citation83] investigated a variation in electron density of up to 0.75 × 1015 cm−3 in an Ar + O2 microwave torch (which present different characteristics from kHz- and MHz-driven plasma jets) using Hβ Stark broadening under different conditions, such as microwave power, gas flow rate, and gas composition ratio. Hofmann et al. [Citation80] estimated the electron density in 11.7 MHz argon and helium plasma jets based on the Stark broadening of Hα and Hβ lines, which yielded ne values between 1013 and 1014 cm−3. Rarely, some groups [Citation81,Citation82] have reported ne values on the order of 1014 cm−3 for plasma jets driven at tens of kHz. Laser interferometry, which is one of the promising ne diagnostic tools for pulsed plasmas, provided time-averaged ne on the order of 1014 cm−3 in a 500 Hz-pulsed helium plasma jet [Citation79]. The laser Thomson scattering method has been recently employed to determine ne and Te simultaneously as follows. Gessel et al. [Citation76] found that the time-averaged ne varied in the range of (0.5–4.0) × 1014 cm−3 and the Te ranged from 1.2–2.0 eV for their argon plasma jet device (14.5 MHz, modulated with a 20 kHz pulse with a 20% duty cycle; pin-to-plate type). Hübner et al. [Citation77] reported that the time-resolved ne varied in the range of (0.1–2.0) × 1013 cm−3 and the Te ranged from 0.2–1.6 eV in a 250 ns-pulsed helium plasma jet driven at 20 kHz. A strong initial ne overshoot with a maximum of 7 × 1013 cm−3 and a mean electron energy of 0.1–3.0 eV were observed in an argon plasma jet driven by a 3.5 kV positive dc pulse with a pulse width of 500 ns and a repetition frequency of 5 kHz [Citation78]. Using a similar setup, Park et al. [Citation84] reported that the time-averaged ne was 1 × 109 cm−3 and Te was (1.0–2.5) eV via a comparison of the absolute intensity of continuum emission spectrum with the theoretically calculated neutral bremsstrahlung emissivity.
Dielectric barrier discharge
First invented by Siemens in 1857 (earlier than when plasma was identified in a cathode tube) for the purpose of oxidizing air, the DBD has long been regarded as an ozone generator (also called an ozonizer) [Citation4,Citation5]. Many efforts have focused on understanding the underlying discharge mechanisms and the physicochemical properties of DBD, which has led to a number of new applications. In the 1990s, DBDs were actively developed and commercialized as coherent light sources for CO2 lasers and excimer lamps [Citation5]. Since the early 2000s, active attempts have focused on utilizing DBD for gas reforming or remediation (also with a plasma-catalyst combination) [Citation85], water purification [Citation86], flow actuation [Citation87], and material engineering [Citation88]. In particular, surface DBDs that operate with an in-plane electrode configuration (particularly kHz frequency driven) are attractive, and they have been widely utilized. One good example is a plasma-driven flow actuator. Streamer (or filament) propagation along the dielectric surface produces the non-neutral region where the net electrohydrodynamic (EHD) force caused by the momentum transfer from charged particles to neutral particles is nonzero; as a result, the force acting on the neutral gas induces a neutral gas flow [Citation89–Citation91].
A DBD consists of at least one electrode insulated from the conductive plasmas using dielectric materials (e.g. Al2O3, SiO2, and BN). Thus, plasma devices that consist of at least a single dielectric layer are normally classified as DBD (thereby covering a broad range of atmospheric-pressure plasma types), and numerous geometries have been introduced [Citation92]. In general, a dielectric layer acts as a block layer, and it keeps the plasma uncontaminated by the electrode materials or inhibits the chemical or physical damage of electrodes by reactive plasmas. Moreover, a dielectric barrier plays a critical role in discharge characteristics. In most cases, a dielectric barrier limits the discharge current and prevents the transition from low-current to high-current discharge. In addition, the accumulated charges on the dielectric barrier build up the localized electric field and directly affect plasma kinetics, such as streamer (or filament) dynamics and breakdown (or sustain) voltage in low-frequency (~ kHz) discharges, especially under high-pressure conditions. When DBD is operated at MHz frequencies, a dielectric barrier acts as a ballast impedance that improves the discharge stability and allows the expansion of the operation range [Citation93].
Depending on the driving conditions, such as electric power [Citation94], working gas [Citation95,Citation96], and dielectric materials [Citation97,Citation98], DBD shows a wide range of discharge characteristics and physically different types or modes of discharge. Compared with jet-type and parallel-plate type (described below) DBDs, which are well characterized, surface DBDs in the in-plane electrode configuration have rarely been investigated in terms of ne and Te; thus, earlier relevant works are rare, which is likely because of diagnostic challenges as discussed below.
Radio-frequency capacitive discharge
Among the variety of different configurations for producing plasmas, capacitively coupled plasmas are the most widely used discharge type in the wide pressure range. This is partly due to its simple geometry with regard to the 1-D problem (gas gap electrode dimensions) and the simplicity of enlarging the plasma size. A conventional apparatus for producing a capacitive discharge consists of two parallel disc electrodes with a chamber; one electrode connected to one or more rf power supplies and the other electrode grounded. In general, the radio-frequency (rf) range involves 1–100 MHz frequencies, and most typical discharges are operated at a 13.56 MHz frequency (allocated by international communications authorities for technical purposes). In certain cases and for specific purposes, a modulated, dual, or multiple rf power is introduced to the plasma. As a working gas, helium, argon, or a mixture of these are commonly used, and other gases are often supplied to the plasma to enhance the reactivity of the plasmas.
Low-pressure rf plasma was discovered by Tesla in the 1890s [Citation99], and he predicted that such discharges would be utilized as plasma chemical reactors and the basis of numerous industrial technologies. Due to limited interest and their complex nature, the level of understanding of such discharges was rather limited at the beginning of the 1980s when the first significant industrial funding was provided to support the development of plasma devices for microelectronics manufacturing [Citation100]. Besides, rf capacitive discharges produced at intermediate pressures (10–200 Torr) have been used extensively since the 1980s for high power lasers [Citation99,Citation101]. In 2001, Park et al. [Citation102] first reported the complete set of electrical and optical characteristics in atmospheric-pressure rf capacitive discharges with different working gases, the gap distance between electrodes, and driving frequency. Since then, discharges at subatmospheric-to-atmospheric pressure (500–760 Torr) have been extensively investigated. Moon et al. identified the role of driving frequency [Citation103] and discharge mode transition [Citation104] in rf helium capacitive discharges from electrical characteristics. In the mid-2000s, Kong’s group [Citation105–Citation109] also made many efforts to experimentally and numerically investigate discharge characteristics of rf capacitive discharges at atmospheric pressure.
At high pressure, rf discharges tend to be constricted, and the discharge mode transition from voluminous α-mode to γ-mode readily occur. To inhibit the mode transition and evolve the implementable range of an α-mode, one or both electrodes are often coated with dielectric materials. Because these dielectric layers make the filaments (lower current density than the γ-mode) instead of the γ-mode discharge after the α-sheath breakdown, electrodes and target samples can be protected from physical damage induced by the high current density of the discharge. Because of efficient electron net production and heating, rf capacitive discharges reveal higher time-averaged ne and Te than kHz-driven plasma jets and other low-frequency driven plasmas at atmospheric pressure. Essentially, high ne and Te promise a high reactivity of plasma. Thus, rf capacitive discharges that have the potential to release abundant reactive species into the ambient air, such as jet-shaped plasmas, have been newly designed and used in various applications [Citation42,Citation110,Citation111].
Because of the limited use of electron diagnostics for high-pressure weakly ionized plasmas, numerical studies, particle-in-cell Monte Carlo collision simulations [Citation105] and hybrid-fluid models [Citation106,Citation112,Citation113] have provided profound insights into the electron kinetics and characteristics of rf capacitive discharges at atmospheric pressure. However, experimental investigation is still important. In earlier works from the 2000s [Citation103,Citation114–Citation118], a simple analytic model that considers plasma as a resistor-capacitor (r-c) series circuit was commonly employed for electron density estimation, while the electron temperature was obtained based on the power balance equation. Those results show a typical 1011–1012 cm−3 range of ne and a 1.0–2.0 eV range of Te in atmospheric-pressure capacitive discharges. Using continuum radiation-based electron diagnostics, Park et al. [Citation38] and Park et al. [Citation39] reported experimental electron information for helium and argon rf capacitive discharges at atmospheric pressure, respectively. Further, Park et al. [Citation118,Citation119] demonstrated the spatiotemporal evolution of electron temperature, thus representing the electron heating structure in argon rf capacitive discharges under different operation conditions. Zue et al. [Citation120] provided a new collisional-radiative model for atmospheric-pressure plasmas, and ne was in the 1011–1012 cm−3 range in argon rf capacitive discharges, which is consistent with the results obtained using the electrical r-c circuit model.
In the next section, we provide examples of continuum radiation-based electron diagnostics via OES. For the sake of conciseness, only examples of rf capacitive discharges will be presented, as they present fewer challenges for diagnostics than those in kHz-driven plasma jets, DBD, or other such plasmas because they are less transient, more homogeneous, and thus spatially and temporally stable. As stated above, because rf capacitive discharge in parallel-plate electrodes is a representative plasma and one of the simplest plasma geometries regarded as a 1-D problem, it is a favorable plasma for this review.
Challenges for diagnostics (not only for electron characterization)
The following unique features of atmospheric-pressure plasmas make it difficult to diagnose plasma characteristics:
A large density gradient of active species, including electrons and ions
Easy contamination by air impurities
Abundance of chemically activated species and chemical interplay
Multi-body collisional processes
Penning reactions with metastable atoms and quenching processes
Some neutral species that make plasmas optically thick
High collisionality or high collision frequency and short mean-free-path of approximately μm
Highly transient phenomena
Poor-periodicity in space and/or time
Difficulty in producing voluminous and uniform plasma due to its constrictive nature
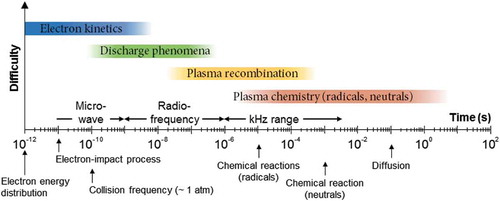
Thus, until now, a number of important plasma quantities have not been determined because the diagnostics are missing. Atmospheric-pressure plasmas are multiphase systems that consist of multiple interacting species, and the most important factors are the high collisionality, transient phenomena, and non-negligible role of space charges. Moreover, the dynamic range of plasma quantities spans many orders of magnitude and temporal scales (see ), which means that more than one diagnostic system is always needed. Most standard diagnostics established at low pressures, particularly for charged particles, fail due to different physical processes under these conditions. For instance, due to the high collisionality, an ion energy distribution that can be simply measured using either an E × B probe, a retarding potential analyzer (RPA), or a laser-induced fluorescence (LIF) spectroscopy has never been reported for such plasmas. Even with the available plasma diagnostics, special care should be taken. In addition, along with the challenges of diagnostics, a pending issue in the plasma research community is that experimental data obtained in weakly ionized collisional plasmas have often been difficult to compare when obtained by different research groups using different diagnostics and plasma sources.
Figure 4. Characteristic time scale of the physical and chemical processes in high-pressure weakly ionized plasmas.
2.2. Electron diagnostics
Plasma diagnostics can be categorized into two groups: invasive and noninvasive diagnostics. Electrical probes with a relevant theory are known as an invasive diagnostic method for low-pressure plasmas. As pointed out above, the use of electrical probes for atmospheric-pressure plasmas is still challenging. Recent investigations have been devoted to utilizing Langmuir probes for atmospheric-pressure plasmas [Citation121–Citation123], and new concepts of electrical probes have been suggested [Citation124]. Nonetheless, due to their intrusive nature, such physical probes can markedly alter the fundamental plasma properties under investigation. Thus, in most weakly ionized plasmas at high pressure, OES has been preferred as the noninvasive diagnostic techniques. Again, this method can be subdivided into two categories: OES that actively probes the interaction with external radiation and OES that passively uses the plasma radiation via internal radiative processes.
Parameters that can be obtained by OES include the electric field strength (from Stark polarization of He atomic lines [Citation125,Citation126] or intensity ratio of and
[Citation127]), identities of excited atoms and molecules, absolute concentration of active species [
,
,
,
, etc. in Ref. [Citation68] and references therein], electron density and temperature (from neutral bremsstrahlung, line broadening, line-to-continuum or line-to-line ratio, etc.), ro-vibrational temperature of molecules (N2, CN, OH, NH, etc.), as well as spectral characteristics of photon flux from plasmas. The electric field is a fundamental parameter in plasma physics as electron kinetics are governed by the electric field and it determines the rates of electron impact reactions, which are the initial stages of the overall physical and chemical reactions inside and outside the plasma. A measure of Stark polarization based on OES is a reliable technique for electric field strength measurement, and it enables us to derive the electric field profiles nonintrusively inside the plasma [Citation125,Citation126]. The rotational temperature of molecules usually represents the neutral gas temperature in atmospheric-pressure plasmas via fast rotation-translation relaxation due to their high collisionality [Citation128,Citation129]. Thus, the gas temperature is inferred from the relative intensities of rotational bands. Likewise, the strong merit of OES is that it allows for the simultaneous diagnosis of multiple plasma quantities, including ne and Te, with a single measurement.
Electron diagnostics, which are most likely feasible in high-pressure weakly ionized plasmas, are summarized in . Electron information can be obtained from the plasma emission via various radiative processes by free electrons in plasmas. In the following, representative active and passive spectroscopic diagnostics, including a continuum radiation-based method, are briefly reviewed.
Table 2. Most feasible electron diagnostics for weakly ionized plasmas, particularly at atmospheric pressure [Citation130]. Adapted by permission of IOP publishing.
2.2.1. Free-electron diagnostics based on active processes
A plasma emission spectrum contains the radiative information of excited species in plasmas. However, measuring the plasma species in the ground state is nontrivial because the relationship between the optical emission intensity from the excited state and ground state densities is not straightforward in nonequilibrium plasmas. Meanwhile, active OES enables one to measure the ground-state species. Most active diagnostics rely on information derived from (i) physical changes of probing radiation induced by a target medium or (ii) radiation emitted by actively excited species. Thus, external radiation sources, such as lasers and microwaves, should be used to derive the information of ground state species. For neutrals or ions, LIF [Citation131–Citation133], two-photon absorption LIF (TALIF) [Citation134], and optical absorption spectroscopy [Citation135] have been widely used, and laser Thomson scattering and interferometry are well established and feasible as diagnostic techniques for free electrons.
In most active diagnostics, a laser is used as an external radiation source because it is most suited for characterizing nonequilibrium as well as equilibrium phenomena in plasmas unless it does not perturb the plasma behavior. For small cross sections of certain nonequilibrium plasmas and the transient behavior, a high spatiotemporal resolution is always required. In addition, because the laser beam diameter and laser pulse width can be easily adjusted, high spatial resolution (up to 10 μm) and temporal resolution (up to sub picoseconds) diagnostics can be achieved.
Laser scattering
In Thomson scattering, the incident light on the plasma is scattered by free charged particles, which are predominantly electrons, and it is one of the most well-established and most straightforward diagnostic methods for monitoring electron information. One advantage of this technique is that it provides a well-developed theory for every condition of a plasma. Incoherent Thomson scattering occurs if the electron density is sufficiently low, which indicates that neighboring electrons have little to no effect on an electron’s oscillation. In the case of incoherent scattering, the scattering parameter is much smaller than unity and the total scattered radiation power directly contains the electron velocity distribution. Therefore, the evaluation of ne and Te is possible without any modeling. The electron density can then be determined very reliably from the total scattered radiation power, and the electron temperature can also be determined from the Doppler broadening of the incident laser wavelength.
The spectral power () of the scattered radiation in the solid angle of detection (
) is given as follows:
where ,
,
, and
are the incident laser power, the particle density, the length of the scattering volume, and the differential cross-section for Thomson scattering, respectively [Citation136]; and
is the wavelength-dependent form factor, which includes the spectral distribution determined by electron motions, the particle drift, the Doppler shift, and other possible contributors. In the case of incoherent Thomson scattering, the line broadening of scattered radiation is shaped by the Gaussian spectral profile if electrons statistically have a Maxwellian distribution. Therefore, the electron temperature can be directly derived from the measured width of the line profile as follows [Citation136]:
where is the electron mass,
is the speed of light,
is the Boltzmann constant,
is the input laser wavelength, and
represents the half width of 1/e maximum in the Gaussian profile.
In plasmas with a low degree of ionization and the presence of gas impurities, such as N2 and O2, the elastic scattering of photons on bound electrons (Rayleigh scattering) and inelastic scattering on molecules (Raman scattering) should be considered seriously in the scattered radiation spectrum [Citation136–Citation138]. Because weakly ionized atmospheric-pressure plasmas present ne/(ne + na) < 10−5 under air impurity-rich conditions, Rayleigh and Raman scattering signals are simultaneously collected with Thomson scattering signal. To subtract the Rayleigh scattering components in a spectrum, a triple grating monochromator is generally used because a signal suppression of a factor of at least 10−5 is required [Citation137], and a deconvolution of overlapping Raman and Thomson scattering can be accomplished by employing the reference Raman spectrum, which depends on the partial pressure of N2 and O2 [Citation138].
Laser interferometry
Interferometry is also commonly employed to evaluate the electron density in plasmas. Interferometry for electron characterization is generally called heterodyne interferometry because the heterodyne technique is used to determine the phase shift of the probing laser. The refractive index of the plasma (N) is determined by the wavelength of the probing electromagnetic wave [Citation139]:
where ,
, and
are the vacuum permittivity, electron charge, and wavelength of probing laser, respectively; and
is the component of ions and neutrals. Because the spatial variation in the refractive index of the plasma (i.e. electron density) results in the phase shift of the probing laser, the electron density can be derived from the phase difference (
) between a reference beam and a probing beam passing through the plasma volume as follows:
where is the beam path length. Because the contribution to the refractive index from electrons is dominant at μm wavelengths in low-pressure plasmas, the infrared laser (e.g. 10.6 μm CO2 laser) is the most suitable for the electron diagnostics and has been frequently applied to the earlier works [Citation140,Citation141]. However, in the high-pressure regime, including atmospheric pressure, special considerations are required. First, in the presence of a variation in neutral gas concentration due to localized gas heating, the interfering contribution of neutral gas to the measured phase shift should be carefully considered [Citation79,Citation140,Citation142]. Choi et al. [Citation79] successfully performed the separation of the phase shift caused by electrons and neutrals by utilizing the difference in those time constants, and they reported that the minimum limit of nel is 1 × 1012 cm−2 and the spatial resolution is 100 μm. Second, an appropriate wavelength range for the probing laser must be selected by carefully considering the electron density and electron collision frequency in the target plasma. Urabe et al. [Citation142] suggested that laser interferometry for electron diagnostics using a wavelength shorter than 10 μm can be applied to any type of atmospheric-pressure plasmas with the linear relationship in Equation 4.
2.2.2. Free-electron diagnostics based on passive optical emission
From X-ray to infrared, the spontaneous plasma emission consists of many line and continuous emissions induced by free electrons, ions, neutral atoms, partially stripped ions, etc. (see examples in Figure 5) The internal (passive) radiative processes of excited species are influenced by free electrons in the plasma; therefore, atomic or molecular radiation contains information on free electrons. In addition to atomic lines and molecular bands, because free-electron-related continuum radiation, that is, electron-ion and electron-neutral free-free bremsstrahlung and electron-ion free-bound recombination, contains ne and Te information, it has also been used for electron characterization. Continuum radiation is emitted from various ionized gases, such as high-temperature fusion plasmas, low-temperature processing plasmas, shock heated gases and stellar atmospheres, and it presents photon energies in the eV to keV range.
Line broadening
The spectral broadening of the specific atomic line emissions contains a convenient quantity for ne measurements. From a technical perspective, this method is much more accessible than either the laser Thomson scattering method or laser interferometry methods because the only requirements are precise measurements of line broadening using a spectrometer with a relevant optical system, which ensures a high spectral resolution. However, a variety of broadening mechanisms, which are usually instrumental (in general) and Doppler broadenings resulting in a Gaussian profile; and Stark, van der Waals, and resonance broadenings appearing Lorentzian profile; thus, the spectral line broadening approach should be carefully considered to make accurate measurements. Detailed broadening mechanisms and expressions are easily found in the literature [Citation143,Citation144]. Stark broadening results from Coulomb interactions between the radiator and free electrons in the plasma (the role of ions in the broadening is negligible because of their relatively low speeds). Fortunately, broadening caused by the Stark effect depends explicitly on the electron number density, whereas other broadenings do not. In nonequilibrium plasmas, special attention should be paid to the line broadening width under different gas temperatures because the gas temperature affects Doppler and van der Waal broadenings.
In general, hydrogen or hydrogen-like ions are the most useful radiators in plasma for diagnostics. The Hβ line especially is widely selected because it is a common radiative species in the visible range. From the Hβ line shape, the Stark broadening width is given as a function of ne, and it shows weak temperature dependence, which was calculated using classical electrodynamics in 1960s [Citation144]. The full width at half maximum of Stark broadening () for the Hβ line at 486 nm is given as follows:
This method has a valid range of electron densities, with ne ≥ 1013 cm−3. In the low-density region, this method is inappropriate because other broadenings caused by van der Waals and Doppler shifts predominate. An additional problem is raised because the separation of the fine structure components of the Balmer lines is larger relative to their Stark broadening. Therefore, line profile corrections are required and should be applied in the fitting procedure. Moreover, a tracer gas (e.g. hydrogen) should be introduced into the plasma, although it can perturb the plasma condition and cause inaccurate measurements.
Line-to-line ratio (collisional-radiative model)
The collisional-radiative model is well established for hydrogen, helium, and argon and can be used to study how the populations of the excited levels are affected by various parameters, such as ne, Te, and ground state atom density. Compared with the corona model, which is considered only for use in relation to electron impact excitation and spontaneous emission, the collisional-radiative (CR) model balances the collisional and radiative processes. Therefore, the rate equation contains all collisional and radiative processes related to each state of the particle, including coupling with other particles. In the quasi-stationary state, the rate balance equation is transformed into a set of coupled linear equations that depend on the ground state density and ion density [Citation145]:
where and
are the collisional-radiative coupling coefficients that describe the ground state and the ionic population processes, respectively; ng and ni are the ground state density and ion density, respectively; and p is the energy level of the atom.
From the CR model, the absolute line intensity can be represented as a function of ne, the Einstein coefficients of a radiative transition, and the rate coefficients, which strongly depend on Te. Thus, ne and Te can be estimated from the emission line-to-line ratio. In the case of weakly ionized atmospheric-pressure plasmas, due to the narrow range of Te and gas temperature, this method can be used to obtain the electron density by assuming a constant Te and using a reasonably estimated ne, compared with other diagnostic results [Citation121]. The key problem is how to select the ‘correct’ levels to obtain the electron parameters using a simple model without making many assumptions that could introduce errors under certain discharge conditions. The line ratio has a significant dependence on the density of the metastable and ground state atoms [Citation36]. Thus, the method relies on the accuracy of the cross-section data (i.e. rate coefficients), and a lack of data or incorrect constants can lead to an inaccurate evaluation. In addition, it is worth noting that three-body collisional processes, which can be ignored in low-pressure plasmas, become important to the rate balance at atmospheric pressure [Citation146], thus under such highly collisional condition, the set of excitation/relaxation processes in the CR model become more complicated.
The remaining caution lies in the applicability of approximations that determines accuracy of the CR model. One important example is the local field approximation (LFA), which assumes that electrons are in equilibrium with the local electric field. Note that even at high pressures, LFA is invalid in some regions, which means that the EEDF and electron-impact reaction rates are not unique functions of the local value of the reduced electric field.
Continuum radiation
As high-speed free particles approach other particles, the incoming particles are deaccelerated by deflection or completely stopped, and during this process, they lose their initial kinetic energy by emitting photons (see Figure 6). This radiation is named bremsstrahlung, which means ‘breaking radiation’ in German, and it represents a crucial phenomenon in the generation of continuous emission from less than 1 eV to a few keV, and the photons are linked to the quantity of radiation sources. Thus, the measurement and interpretation of bremsstrahlung has been used to diagnose free charges in plasma science. In the dipole approximation, bremsstrahlung due to collisions between like particles (e.g. electron-electron or ion-ion) is negligible because the dipole moment is proportional to the center of mass. Thus, in general, the continuum radiation from highly ionized plasmas, such as fusion plasmas, mostly originates from free-free (ff) bremsstrahlung and free-bound (fb) recombination interactions between electrons and ions. In weakly ionized plasmas where the degree of ionization is sufficiently low, however, bremsstrahlung via interactions between free electrons and neutral atoms becomes dominant in the total continuum radiation, and it should be considered for electron characterization. In addition to bremsstrahlung, there are a variety of continuum radiation sources other than free electrons, which interferes in the evaluation of ne and Te as will be introduced in the next section.
Electron-ion bremsstrahlung and recombination
In the classical picture, free electrons are the primary radiators as the electron mass is comparatively light. Thus, the electron can be treated as moving in the Coulomb field of a fixed ion. The problem of collisions between charged particles can be simplified under the small angle-scattering assumption. The radiative energy of dipole radiation is expressed as follows [Citation147]:
where is the Fourier transform of the dipole moment and
is the angular frequency. After some algebra with approximations, the total emission per unit time t per unit volume V per unit angular frequency range for a medium with ions and electrons and for a constant electron speed
can be rewritten as follows:
where is the charge number; and
is the correction factor (also called the Gaunt factor), which accounts for the deviation from the hydrogen-like structure due to the complex system of other gases based on the quantum effect method [Citation148,Citation149]. In most plasmas, the speed of electrons is distributed statistically, therefore, the single-speed expression should be averaged over a thermal distribution of particle speeds. The emissivities of the free-free (
) and free-bound (
) electron-ion are expressed as follows [Citation40]:
where ; and
is the emitted photon energy. Here, the Maxwellian electron energy distribution is used for
and
, and the Gaunt factors are replaced by the corresponding Biberman factors
and
, respectively.
Electron-neutral bremsstrahlung
Compared with fully ionized fusion plasmas or low-pressure plasmas where the degree of ionization is reasonably high, bremsstrahlung caused by the interaction between electrons and neutral atoms (namely, neutral bremsstrahlung) becomes dominant in plasmas in which the degree of ionization is lower than 10−4. Two important radiation mechanisms should be considered in an electron-neutral atom interaction [see Figure 6(b)]: the deceleration of free electrons moving inside plasmas by the induced field of a neutral atom (bremsstrahlung) and the time-dependent dipole moment of neutral atoms induced by incident electrons (called polarization bremsstrahlung in some papers [Citation150]). In addition, since the two aforementioned radiative mechanisms occur in the same collisional event, the interference between two radiative phenomena should be considered. Akcasu and Wald [Citation151] derived expressions for the intensity and radiation power of the total spectrum from a weakly ionized plasma by considering the two different effects and compared the relative intensity of bremsstrahlung, the induced dipole radiation, and their interference. The total radiation power () was obtained by integrating the spectral density with the Maxwellian electron energy distribution over all photon energies.
for bremsstrahlung (
) and induced dipole radiation (
) are expressed as follows:
where ,
,
, and
are the fine structure constant (
, where
is the reduced Planck’s constant
), the elastic scattering cross-section as a function of the angular wavenumber, the atom number density, and a function consisting of the total orbital angular momentum and the polarizability of the atom, respectively. Detailed information about radiation powers can be found in Ref. [Citation151]. According to Akcasu and Wald’s result, the ratio between both radiation powers, that is,
/
, is only 0.7% for hydrogen and less than 8% in most cases, which represents an insignificant induced dipole radiation. In addition, the total radiation power induced by the interference (
) between bremsstrahlung and induced dipole radiation was determined, and it can be finally concluded that the dipole radiation and its interference effect in relation to bremsstrahlung is insignificant as far as the total radiation power is concerned:
Because the dipole radiation and interference decrease as decreases, the emissions caused by the polarization of the neutral atom can be ignored in the low photon energy range [Citation151]. Hammer and Frommhold reported that the contribution of neutral bremsstrahlung in the argon plasma at Te > 1 eV dominates the continuum emission in the UV-visible range [Citation150].
The electron (e) and neutral atom (a), that is, e-a, bremsstrahlung cross-section related directly to the emission coefficient must be determined. The general form of the differential cross-section of e-a bremsstrahlung was derived by Kasýanov [Citation152]. With the collision scheme described above, the differential cross-section of e-a bremsstrahlung is related to the elastic momentum cross-section between the electron and the target neutral atom:
where E is the electron energy. Using the emission coefficient of collision reactions between two particles ‘1’ and ‘2’,
The e-a bremsstrahlung emission coefficient () is simply derived by inserting Equation 14 into 15 with the Maxwellian electron energy distribution function
, which is appropriate in a high-pressure regime due to the high electron collision frequency:
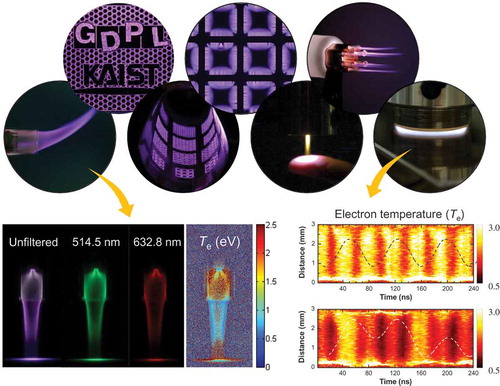
Park et al. [Citation118] were the first to visualize neutral bremsstrahlung in an rf capacitive discharge and plasma jet at atmospheric pressure as detailed in . The photographs in the figure represent argon plasma emission images with and without optical filters: Wavelengths of 514.5 nm and 632.8 nm correspond to continuum radiation (neutral bremsstrahlung). The ‘white’ intense appearance shown in the unfiltered image [)] seemingly implies the substantial continuum radiation in the visible wavelength range.
Figure 5. Optical emission spectroscopy results of rf capacitive discharges at atmospheric pressure [Citation177]. Raw optical emission spectra of (a) helium and (b) argon rf capacitive discharges in the spectral range of 250–850 nm. For these spectra, the plasma emission near the electrode (sheath edge), where the intensity of the atomic lines is the local maximum, was corrected and measured using a SpectraPro-750 monochromator with a slit width of 10 μm. A discontinuity occurs at 400 nm because the spectra in the wavelength range 400–850 nm were measured separately using a 400-nm long-pass filter to eliminate the second-order emission from 200–400 nm.
![Figure 5. Optical emission spectroscopy results of rf capacitive discharges at atmospheric pressure [Citation177]. Raw optical emission spectra of (a) helium and (b) argon rf capacitive discharges in the spectral range of 250–850 nm. For these spectra, the plasma emission near the electrode (sheath edge), where the intensity of the atomic lines is the local maximum, was corrected and measured using a SpectraPro-750 monochromator with a slit width of 10 μm. A discontinuity occurs at 400 nm because the spectra in the wavelength range 400–850 nm were measured separately using a 400-nm long-pass filter to eliminate the second-order emission from 200–400 nm.](/cms/asset/8e3f99f1-2ba6-4011-b0ea-2d89c64e2cde/tapx_a_1526114_f0005_b.gif)
Figure 6. Illustration of (a) electron-ion and (b) electron-neutral bremsstrahlung mechanisms.
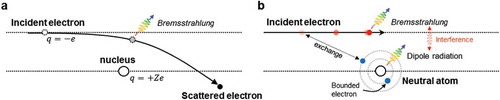
Figure 7. (a) Schematic of the experimental apparatus for an argon 13.56 MHz capacitive discharge and photographs of the unfiltered emission profile and the filtered emission profiles of 700.0 nm (corresponding Ar I), 514.5 nm, and 632.8 nm [Citation118]. Reproduced by permission of IOP Publishing. (b) Plasma apparatus for the argon nanosecond-pulsed plasma jet with the relevant power system, and optically unfiltered and filtered images taken using a DSLR camera with interference filters with center wavelengths of 514.5 nm, 632.8 nm, and 700 nm [Citation84]. Reproduced by permission of IOP Publishing.
![Figure 7. (a) Schematic of the experimental apparatus for an argon 13.56 MHz capacitive discharge and photographs of the unfiltered emission profile and the filtered emission profiles of 700.0 nm (corresponding Ar I), 514.5 nm, and 632.8 nm [Citation118]. Reproduced by permission of IOP Publishing. (b) Plasma apparatus for the argon nanosecond-pulsed plasma jet with the relevant power system, and optically unfiltered and filtered images taken using a DSLR camera with interference filters with center wavelengths of 514.5 nm, 632.8 nm, and 700 nm [Citation84]. Reproduced by permission of IOP Publishing.](/cms/asset/0aaee1db-d7ad-4475-b398-ed071d973fd0/tapx_a_1526114_f0007_oc.jpg)
The electron characteristics reported by earlier works [Citation76–Citation78,Citation80,Citation84,Citation119,Citation153–Citation157] in various atmospheric-pressure plasmas with the aforementioned diagnostic methods are summarized in . For the sake of comparison, the electron data are grouped by dotted boxes with respect to the diagnostics presented in the figure, and valid ranges of each diagnostic technique for nonequilibrium plasmas at atmospheric pressure are depicted by dashed boxes.
Figure 8. Electron characteristics in various types of weakly ionized plasmas at atmospheric pressure [Citation76–Citation78,Citation80,Citation84,Citation119,Citation153–Citation157] and valid range of each diagnostic technique.
![Figure 8. Electron characteristics in various types of weakly ionized plasmas at atmospheric pressure [Citation76–Citation78,Citation80,Citation84,Citation119,Citation153–Citation157] and valid range of each diagnostic technique.](/cms/asset/c80ce247-b1d5-4204-b840-0d8818865821/tapx_a_1526114_f0008_oc.jpg)
3. Continuum radiation-based electron diagnostics
3.1. Practical considerations on diagnostics
Again, the merits of continuum radiation-based electron diagnostics over competing techniques include noninvasiveness, simple setup, and high spatiotemporal resolution. One of the main issues in the interpretation of continuum radiation may come from the multiple radiation sources and continua spanning over a limited range of wavelengths. Thus, to precisely analyze electron parameters, an overall understanding of the continuum radiation is required with an accurate spectroscopic measurement. In addition, extending the spectra to the vacuum UV and near infrared region may facilitate comparisons with theoretical prediction.
As previously discussed, continuum radiation emitted from weakly ionized gases mainly originates from electron-neutral atom interactions (i.e. neutral bremsstrahlung), and the associated emissivity contains electron information [Citation38–Citation40,Citation158]. However, because the contributions from other radiative mechanisms [i.e. electron-ion free-free bremsstrahlung () and free-bound recombination (
)] to the emissivity in the UV and visible range vary with the driving conditions, particularly the gas pressure, the
dominant conditions should be assured. A simple calculation using Equations 9, 10, and 16 with ne = ni and wavelength-dependent Biberman factors indicates that
in the wavelength range of 200–900 nm when ne/(ne + na) < 10−3, which is the case for most weakly ionized plasmas at subatmospheric-to-atmospheric pressure. represents the
dominant ranges as functions of ne and the background gas pressure at different wavelengths. Similar validations of neutral bremsstrahlung-based electron diagnostics have also been conducted by several groups [Citation159,Citation160].
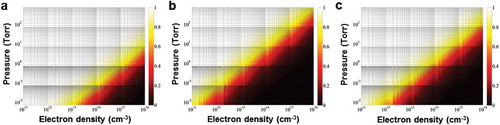
Figure 9. Fraction of the neutral bremsstrahlung emissivity, , with (a) 3.0-eV Te at 300 nm, (b) 1.0-eV Te at 300 nm, and (c) 1.0-eV Te at 900 nm as a function of the gas pressure and electron density. The neutral bremsstrahlung-based electron diagnostic technique is valid under the conditions in the white region (
).
One of the crucial pieces of information in this diagnostic method is the electron energy distribution function (EEDF). The Maxwellian distribution is reasonable and acceptable in discharges at atmospheric pressure [Citation161,Citation162], and it was used to determine the value in the earlier works. For distributions other than Maxwellian, the
value should be carefully calculated with known EEDFs. One familiar distribution is Druyvesteyn representing the depletion in the high energy tail of the EEDF. When elastic collisions are dominant with cross sections that are independent of the electron velocity in plasmas, Druyvesteyn energy distribution is acceptable [Citation163]. It is noteworthy that as the Druyvesteyn distribution (
) is much different from the Maxwellian distribution (
), spectral distributions of
from two different EEDFs are distinguishable, which means that we can estimate EEDFs from the plasma emission spectrum.
Sources other than free electrons
Compared with atoms, molecules have considerable rotational and vibrational energy levels, and multiple line emission spectra are usually observed and attributed to the relevant motions induced by energetic electrons or ions. In addition to continuum radiation originating from free electrons, certain diatomic molecules (including molecular ions) also emit continuum radiation through radiative processes due primarily to their repulsive potential profiles. The emitted photon energies and corresponding spectral range of molecular continuum radiation are determined by the vibrational energy of the upper state and the potential curve of the lower state of the molecules. If the concentration of the radiator is high enough and the spectral range of its transition probability overlaps with the electron-related continuum spectrum, these continuous emissions should be considered to separate the electron information from the measured spectrum. Possible sources other than free electrons are listed in . Extra attention must be paid to continuum radiation from H2 for Ar discharges and He2+ for He discharges [Citation84]. Continuum radiation from sources other than H2 and He2+ can also arise from the photorecombination of electrons with (
) [Citation164] and the chemiluminescence of NO2 (
) [Citation165]. However, Park et al. [Citation84] reported that in atmospheric-pressure discharges, the contribution of these continuum spectra on the emission spectrum can be considered negligible. Nikiforov et al. [Citation159] also reported the minor contribution of the NO2 continuum in the argon rf discharge.
Table 3. Possible sources of continuum radiation in atmospheric-pressure plasmas. References are properly cited in the main text.
Hydrogen molecule (H2)
From low-pressure plasmas to high-pressure plasmas containing hydrogen molecules, in addition to hydrogen atomic lines involving Balmer and Lyman series, radiation emitted spontaneously by the electronic transition of hydrogen molecules between excited states, such as Fulcher bands in the 600–650 nm and dissociative continuum radiation
in the 200–400 nm range, have a long and interesting history. For plasma characterization, small amounts of hydrogen gas can be introduced into plasmas, but, even without a deliberate supply, hydrogen can be produced by the dissociation of water molecules from the ambient air or by supplied gas with a poor quality.
The upper bound electronic state of the hydrogen molecule is populated from the ground state
via direct electron impact excitation
or via Penning excitation
especially in argon plasmas [Citation166,Citation167]. Then, the H2 continuum is produced by a spontaneous transition from H2
to the lower repulsive state H2
(see Ref. [Citation166] and references therein):
Since the wave functions of both the upper and lower states determine the spectral distribution of the transition probability, the accuracy of the theoretical emission spectra is limited by the potential energy curves used. The corresponding emissivity is presented in terms of the population density of H2
and the wavelength-dependent transition probability
as follows:
Note that if the electron impact excitation is significant, the Fulcher-α band should be observed simultaneously at approximately 600 nm due to the relatively small energy difference between H2
and H2
. However, because the H2 continuum has been observed in argon plasmas while the Fulcher-α band has not, Park et al. [Citation84] concluded that the excitation of
to
state is mostly caused by Ar Penning excitation rather than direct electron impact. The significance of the Penning excitation by metastable Ar was already demonstrated in a previous work [Citation167], which showed that a noticeable continuum emission occurred when H2 was added to the argon discharge but not when added to the neon discharge. Moreover, most numerical simulation results show that the metastable Ar density is an order of magnitude larger than the electron density [Citation34,Citation168].
In argon plasmas, H2 and H2
can be major radiators of H2 continuum radiation because the energy levels of metastable Ar atoms
(11.55 eV) and
(11.72 eV) are close to the energy differences of 11.79 eV and 12.10 eV between the ground state and the two lowest vibrational states of H2
[Citation167,Citation169]. For excitation from the ground state to H2
, additional energy should be supplied using other means, such as kinetic energy by energetic species. In addition, along with the population density,
is larger than the other probabilities in the 250–360 nm range.
Helium molecular ion (He2+)
Helium gas is one of the most widely used working gases in atmospheric-pressure plasmas due primarily to its low breakdown voltage in high-pressure regimes and its high ionization potential energy. In helium discharges, metastable He and helium molecular ions () play a crucial role in the discharge phenomena [Citation170]. For instance, metastable He atoms participate in the ionization process significantly through Penning ionization of nitrogen molecules from the ambient air [Citation39,Citation171] and the helium molecular ion is a major ionic species in helium capacitive discharges. The number density of
is much larger than that of singly ionized helium ions [Citation170].
Intense continuum radiation emitted by from a laboratory discharge in helium was first observed by Huffman et al. [Citation172], who suggested that the most likely cause of the continuum in helium discharges is
. Similar to the case of dissociative radiation by hydrogen molecules, certain excited
ions have a repulsive potential curve. Continuum emission in the UV-visible range is produced due to the electronic transition from a bound upper state
to an unbound (repulsive) lower state
. Using more accurately calculated potential curves of
, Hill [Citation173] successfully calculated the spontaneous emission spectra of the
continuum using a coupled Schrödinger equation technique while accounting for an avoided crossing of the
and
states. In helium discharges, the electron impact excitation of He [
] and de-excitation of
[
] produce
, thus the presence of
can be indirectly noticed from the He I line emission at 706.5 nm.
is then formed via a three-body collision among He, He+, and
:
The recombination of helium dimer dications () is another possible mechanism for
formation.
decays radiatively to the lower unbound state
as follows:
Subsequently, the molecular ion rapidly dissociates into neutral helium and a helium ion. According to Ref. [Citation174], in weakly ionized helium discharges with a low Te, ion-atom radiative collisions contribute significantly to continuum radiation:
Mihajlov et al. [Citation174] theoretically calculated the spectral coefficients of the continuum emission due to ion-atom recombination (Reaction 21) and radiative charge exchange (Reaction 22), and they also compared those results with electron-ion and electron-atom bremsstrahlung spectral coefficients. Their results show that the contribution of ion-atom radiative collision depends on Te, which should not be entirely neglected in low-temperature helium plasmas in the spectral range of 400–800 nm.
Electron characterization using electron-neutral bremsstrahlung
Park et al. [Citation38] reported optical diagnostic results in a 13.56 MHz helium capacitive discharge at atmospheric pressure. A clear continuum emission was observed and compared with the calculated . The fits result in a Maxwellian electron temperature of 1.5 eV < Te ~ 1.9 eV < 2.4 eV and an electron density of 1.53 × 1011 cm−3 < ne ~ 2.9 × 1011 cm−3 < 5.8 × 1011 cm−3. The authors stated that such a range in ne and Te was determined because a time-averaged spectrum over an rf period was used. Nikiforov et al. [Citation159] observed continuum radiation in the range of 300–700 nm in an 8-mm wide argon plasma jet, working with 10 W of rf input power at 13.56 MHz. The continuum spectrum was well fitted with the calculated
, yielding ne = (1.9 ± 1.0) × 1014 cm−3 and Te = (1.75 ± 0.25) eV. Bazinette et al. [Citation175] reported that the spectral shape of the measured continuum does not fit the calculated curve of
. The experimental spectrum in the Ar+ NH4 capacitive discharge for a power density of 6.6 W· cm−3 at 9.6 MHz showed the peak emission at approximately 320 nm, which corresponded to a Te of 1 eV, whereas the decrease in growth with increasing wavelength appeared much closer to the profile calculated for 4 eV. The authors stated that the deviation from the model may be explained by the presence of a proportion of non-Maxwellian electrons, super-elastic collisions potentially generating more energetic electrons, and the Ramsauer effect reducing the scattering of less-energetic electrons [Citation175]. However, these electron dynamics were not observed by Thomson scattering diagnostics in the atmospheric-pressure argon plasma jet [Citation78]. Iordanova et al. [Citation157] demonstrated a Te of 1.2 eV and ne of approximately 1015 cm−3 in a 2.45 GHz argon torch with 800 W input power. The authors employed an iterative combination of the absolute line intensity-collisional-radiative model (ALI-CRM) and the absolute continuum intensity (ACI) method; ALI-CRM provides the Te values used as input parameters for the ACI method.
As discussed, continuum radiation in the UV-visible range is not radiated by a single source; rather, various continuum emissions are superimposed in the plasma emission spectrum because of the complex nature. The difference between the measured emission spectra () of argon and helium discharges was reported by Choe’s group [Citation84] as depicted in . In the helium discharge shown in ), the theoretical
(blue solid line) is well consistent with the measured spectrum
, indicating ne = 8.7 × 1010 cm−3 and Te = 2.5 eV. In the case of the helium capacitive discharge, the contribution from
continuum radiation does not seem to be significant, although its contribution becomes considerable in a helium plasma jet [Citation176]. A significant discrepancy between
(blue curve) and
(dots) is revealed below 500 nm in the argon discharge spectrum as displayed in ), and the superposition (
) of the two continuum spectra (
and the H2 dissociative continuum
given in Equation 18), which is indicated by the red curve, fits well with the measured
. The ne and Te obtained from the neutral bremsstrahlung
are ne = 6.3 × 1011 cm−3 and Te = 2.5 eV, respectively.
Figure 10. Measured spectra () of 13.56 MHz capacitive discharges with rf input power of 200 W in (a) helium and (b) argon [Citation84]. Reproduced by permission of IOP Publishing. The total emissivity
(=
+
) is denoted by the red curve, and the emissivities of the e – a bremsstrahlung (
) and the H2 continuum (
) are denoted by the blue and the green curves, respectively.
![Figure 10. Measured spectra (κm) of 13.56 MHz capacitive discharges with rf input power of 200 W in (a) helium and (b) argon [Citation84]. Reproduced by permission of IOP Publishing. The total emissivity κtotal (= κea + κH2) is denoted by the red curve, and the emissivities of the e – a bremsstrahlung (κea) and the H2 continuum (κH2) are denoted by the blue and the green curves, respectively.](/cms/asset/408be023-a308-4c23-bdd4-d743c2a40f99/tapx_a_1526114_f0010_oc.jpg)
3.2. Imaging techniques (2-D)
Two-dimensional plasma images of intrinsic optical radiation represent a common and accessible way of studying the spatial structure of plasmas. Historically, an analysis of the plasma structure only involved an examination of dark and light spots in photographs [Citation143]. The basic concept underlying this approach is that when a radiation source at a given point in space is stronger, the electron density at that point is higher and the field that imparts energy to the electrons is also higher, resulting in an increasing chance of the plasma being radiative. However, because of the variety of radiation sources in plasmas, particularly in atmospheric-pressure plasmas, identifying the major factor in the optical radiation is nontrivial with this approach. That is, spectrally unresolved images cannot be accurately interpreted to characterize the plasma quantities due to the complexity of plasma optical emissions. Thus, a combination of imaging devices and optical filters with a narrow transmittance window for accurate wavelength selection has been offered as a cost-effective recording method for selective spectral images. Since the effective aperture of the filter is usually large compared with the slits, a rapid and accurate spectral imaging for 2-D plasma characterization is guaranteed. Because of the interference filter’s unique benefits, it is widely used in various industries and in plasma studies. In the following, 2-D imaging of Te based on the principle of neutral bremsstrahlung and issues associated with its measurements are described. This technique is extremely simple.
As expressed in Equation 16, Te determines the spectral distribution of and ne contributes to the absolute magnitude of
. ) shows the spectral distributions of
, which is normalized at 580 nm for the sake of comparison, with different Te values. The results show that Te can be determined by fitting the spectral distribution of the measured continuum radiation to that of the theoretical
. Furthermore, Te can be estimated more simply from the dimensionless intensity ratio of two representative wavelengths as given in ).
Figure 11. (a) Normalized neutral bremsstrahlung emissivity with various Te from 1.0 eV to 3.0 eV and (b) electron temperature as a function of the emissivity ratio between two different wavelengths, 514.5 nm and 632.8 nm [Citation118]. (c) Argon plasma emission spectra measured by the calibrated spectrometer and relevant optical system [Citation118]. The absolute intensity of the plasma emission is indicated by black dots, and emissions that passed through interference filters with = 514.5 nm and 632.8 nm are indicated by the blue and red lines, respectively. (d) Intensity variations of a digital camera and a spectrometer at various rf input powers [Citation118]. Reproduced by permission of IOP Publishing.
![Figure 11. (a) Normalized neutral bremsstrahlung emissivity with various Te from 1.0 eV to 3.0 eV and (b) electron temperature as a function of the emissivity ratio between two different wavelengths, 514.5 nm and 632.8 nm [Citation118]. (c) Argon plasma emission spectra measured by the calibrated spectrometer and relevant optical system [Citation118]. The absolute intensity of the plasma emission is indicated by black dots, and emissions that passed through interference filters with λc = 514.5 nm and 632.8 nm are indicated by the blue and red lines, respectively. (d) Intensity variations of a digital camera and a spectrometer at various rf input powers [Citation118]. Reproduced by permission of IOP Publishing.](/cms/asset/2d14436b-30f9-428c-8968-60883de094df/tapx_a_1526114_f0011_oc.jpg)
Park et al. [Citation118] proposed a novel method for imaging ne and Te using a combination of optical interference filters and an imaging device [a commercial digital single-lens reflex (DSLR) camera], and they also provided a practical consideration of DSLR cameras for this technique. The emission spectrum of the argon capacitive discharge with 200 W input power obtained by an absolutely calibrated spectrometer (Ocean Optics MAYA2000 Pro) is shown in ). The molecular spectra of N2() as well as OH(
), NH(
), and NO(
) appear in the UV range. Beyond 690 nm, argon and oxygen atomic lines are present. To avoid errors caused by extra emissions from excited atoms and molecules when determining Te, the emission intensity in the spectral range from 450 nm to 690 nm is suitable for a continuum radiation measurement. It is worth noting that the argon discharge is favored for ne and Te measurements based on neutral bremsstrahlung, and helium plasmas are inappropriate because numerous atomic and molecular emissions are in a wide spectral region, as seen in above.
The blue- and red-colored peaks in ) depict the emission spectra measured using optical interference filters with a center wavelength of 514.5 nm and 632.8 nm, respectively, and a full width at half maximum (FWHM) of transmittance () of < 1.5 nm. The filters’ characteristics, including sufficiently high transmittances (
33%) at the center wavelengths and optical densities > 4 in the other spectral ranges, were appropriate for the determination of Te via a comparison of two filtered plasma emission intensities with the theoretical emissivity of neutral bremsstrahlung. To verify the emission intensity result obtained by a DSLR camera with filters, the authors compared it with the emission intensity measured by the absolutely calibrated spectrometer. The emissivities at 514.5 nm (open symbols) and 632.8 nm (solid symbols) increased linearly in both measurements as the rf input power was raised from 140 W to 260 W. ) demonstrates the consistency between the camera results and spectrometer results and the linear radiometric response of the DSLR camera to the plasma emission. Consequently, although interference filters have an imperfect transmittance, such as a smooth-edged shape and ≥ 1.0 nm FWHM of the transmittance curve, the continuum radiation measurement performed using a commercial DSLR camera and interference filters appears sufficiently accurate to measure the spatial distribution of Te by considering the ratio of the two continuum emissivities.
Another issue to consider when using a digital camera for this imaging technique is the color filter array placed right in front of the sensors. A color filter (called a Bayer filter) consisting of an alternating color arrangement with one red, one blue, and two greens (RGB) is installed in most commercial digital cameras. For this reason, the RGB pixels should be split from the raw images using software and effective pixels should be selectively used to obtain plasma emission.
When an interference filter is used in an optic system, it should be carefully designed due to its unique characteristics. First, most interference filters are manufactured for incident light at a normal angle of incidence, in which the surface of the filter is perpendicular to the light path.
Because the center wavelength will be shifted to a lower wavelength and the shape of the transmittance will be distorted for non-normal incident light, an accurate measurement cannot be expected. To measure the Te of large plasmas, only the perpendicular light should be considered, and this can be accomplished by using a relevant optical system, for example, a two plano-convex lens system. Second, the transmittance of the filters is slightly influenced by the temperature because the filters consist of dielectric layers. All the layer thicknesses increase due to thermal expansion as the temperature increases, resulting in the shift of the transmittance curve toward longer wavelengths. Last, the optical density is of profound importance in continuum radiation measurements because the radiative power of atomic and molecular emission is non-negligible at certain wavelengths. Thus, a sufficient optical density should be used to block undesired photons.
Park et al. [Citation118] considered the measurement error in the foregoing imaging diagnostics. Among the possible instrumental errors, the random noise in the pixel intensity plays a crucial role in determining Te because it is normally amplified through the subtraction of the dark current and the calculation of the dimensionless intensity ratio. With ±0.8% error (i.e. one standard deviation of data) in the intensity ratio of 514.5 nm and 632.8 nm, the determined Te has an uncertainty of −7.2% and +8.7% at Te = 2.0 eV (i.e. the accuracy of the measured Te is in the 1.9–2.2 eV range). Because the uncertainty depends on the selected wavelengths, it can be decreased by reducing the error in the emissivity ratio or by selecting a different wavelength set (for instance, 300 nm and 700 nm as shown in in Ref. [Citation118], which results in better accuracy for the same emissivity ratio error).
ICCD cameras, which have high sensitivity and high gating speed, enable nanosecond- and rf phase-resolved electron characterization in conjunction with optical filters or spectrometers. In this review, we leave practical issues and considerations related to ICCD cameras, which can be easily found in earlier articles [Citation177,Citation178]. Park et al. [Citation177] first proposed and reported a 2-D rf phase-resolved electron characterization using a combination of an ICCD camera and optical filters in argon rf capacitive discharges at atmospheric pressure. The authors clearly demonstrated the rapid structural transition from nonlocal to local electron heating at atmospheric-to-subatmospheric pressures; the electron heating during the sheath collapse weakens as the gas pressure decreases. shows the spatiotemporal evolution of the 514.5-nm neutral bremsstrahlung spectrum and Te at 760 Torr, 400 Torr, 300 Torr, and 200 Torr. The findings revealed that the ohmic heating caused by the field-enhanced region built up by the space charge is depressed with decreasing pressure, which results in a decrease of Te during the sheath collapse. It is worth noting that neutral bremsstrahlung is still dominant in the continuum spectrum among continuum sources in these discharges up to 200 Torr. This phase-resolved technique was also applied to the study of frequency effects on electron heating structures. shows the spatiotemporal evolution of 514.5-nm neutral bremsstrahlung and Te in single-frequency and dual-frequency-driven plasmas at atmospheric pressure [Citation119]. The results reveal that a spatiotemporally symmetric structure in electron heating becomes asymmetric (via a local suppression of electron temperature) as two-frequency power is simultaneously introduced. It means that collisional electron heating derived from a high frequency is spatiotemporally tailored by low-frequency power, and such a phenomenon is rarely observed in low-pressure capacitive plasmas.
Figure 12. Nanosecond-resolved visualization of the electron heating structure [Citation177]. Spatiotemporal evolution of 514.5-nm continuum radiation (left side) and Te (right side) at (a) 760 Torr, (b) 400 Torr, (c) 300 Torr, and (d) 200 Torr. The intensities of the continuum radiation are normalized by the maximum intensity, and the unit of Te is eV. Color bars are located on the right side of each image.
![Figure 12. Nanosecond-resolved visualization of the electron heating structure [Citation177]. Spatiotemporal evolution of 514.5-nm continuum radiation (left side) and Te (right side) at (a) 760 Torr, (b) 400 Torr, (c) 300 Torr, and (d) 200 Torr. The intensities of the continuum radiation are normalized by the maximum intensity, and the unit of Te is eV. Color bars are located on the right side of each image.](/cms/asset/a7b71d65-d8a6-469c-a0b4-7caa9d81de8a/tapx_a_1526114_f0012_oc.jpg)
Figure 13. Nanosecond-resolved visualization of electron heating [Citation119]. Spatiotemporal evolution of neutral bremsstrahlung at 514.5 nm measured in a (a) 4.52-MHz single-frequency discharge, (b) 13.56-MHz single-frequency discharge, and (c) dual-frequency discharge; and spatiotemporal evolution of Te in (d) 4.52-MHz single-frequency discharge, (e) 13.56-MHz single-frequency discharge, and (f) dual-frequency discharge. The dashed lines indicate the measured discharge voltage waveforms. The intensities of the continuum radiation are normalized by the maximum intensity, and the unit of Te is eV.
![Figure 13. Nanosecond-resolved visualization of electron heating [Citation119]. Spatiotemporal evolution of neutral bremsstrahlung at 514.5 nm measured in a (a) 4.52-MHz single-frequency discharge, (b) 13.56-MHz single-frequency discharge, and (c) dual-frequency discharge; and spatiotemporal evolution of Te in (d) 4.52-MHz single-frequency discharge, (e) 13.56-MHz single-frequency discharge, and (f) dual-frequency discharge. The dashed lines indicate the measured discharge voltage waveforms. The intensities of the continuum radiation are normalized by the maximum intensity, and the unit of Te is eV.](/cms/asset/c0a5eff4-0850-4454-a3f8-e5752edd32f3/tapx_a_1526114_f0013_oc.jpg)
3.3. Imaging techniques (3-D or cross-sectional)
Multidimensional electron diagnostics to obtain spatial information in discharges at atmospheric pressure represent a key requirement for fulfilling scientific as well as industrial needs. For example, as monitoring the spatial uniformity of the plasma characteristics becomes an essential part of plasma applications, imaging techniques that provide a horizontal slice of plasma are required. Thus, to obtain the spatial distribution of plasma parameters, various techniques have been developed, such as a 2-D probe array system [Citation179] and the reconstruction technique using the system function for chord-integrated plasma emissions [Citation180]. The recent trend in modern plasma diagnostics emphasizes cross-sectional imaging and 3-D mapping of plasma parameters due to the powerful advantage of examining the inside of the plasma. However, measuring the cross-sectional distribution of plasma quantities is nontrivial using only OES because line-integrated (or volume-integrated) measurements are indispensable. Thus, special attention has been paid to the computational tomographic (CT) reconstruction technique that was developed to mathematically reconstruct the local information from the set of line-integrated (projection) data because tomographic OES has become an attractive solution that yields the most complete picture of the plasma kinetics. In addition to plasma diagnostics [Citation181–Citation183], this technique has been well established, and it is actively used in the fields of medical imaging [Citation184] and astronomy [Citation185,Citation186].
In most cases, the tomography algorithm seeks to reconstruct distributions over the region of interest with a limited number of lines of sights, and it can be formulated into an algebraic nonlinear optimization problem. Thus, a number of mathematical approaches (e.g. Tikhonov regularization, minimum Fisher information, and the maximum entropy method) have been developed for tomographic reconstruction, and comparative studies with those methods have been conducted [Citation187]. Because the reconstruction performance depends on expected solutions (synthetic images) and the detectors’ configuration and arrangement, reconstruction tests are a prerequisite and enable improvements to the reconstruction result. In cases that show plasma characteristics with azimuthal symmetry, the reconstruction of a 2-D plasma image can be simplified by analytic inversion techniques, such as Abel inversion, of which merits are low computational cost and the requirement of only a single integrated 1-D image. This technique has been commonly employed for nonequilibrium plasmas with azimuthal symmetry, such as plasma jets, microwave torches, and other cylindrical plasmas.
In 2002, Makabe and Petrović [Citation100] reported that CT provides a better understanding of plasma kinetics in low-pressure rf plasmas, and they claimed that real-time cross-sectional monitoring and control of plasma processing can be achieved by the CT technique. Cai and Kaminski [Citation188] proposed a new technique that can simultaneously retrieve the distributions of gas temperature, chemical concentrations, and pressure based on broad bandwidth, frequency-agile tomographic absorption spectroscopy. Rathore et al. [Citation189] reported a prototype of an automatic tomographic diagnostic system for real-time monitoring and control of a microwave-induced plasma torch, and they used a detector assembly that consisted of 8 cameras at 45° angular distance, which covered a 360° view, and a filtered backprojection algorithm. In 2017, Babou et al. [Citation190] demonstrated that the 3-D structure of plasma airflow can be reconstructed using a single imaging device. Five images obtained for different projection angles were taken by using a combination of a high-speed CCD camera and four tilted mirrors, and additional images were generated (resampling) via trigonometric interpolation for the Radon transform. This resampling implies the introduction of virtual lines of sight, which ensures an improved coverage of the reconstruction domain. For quite periodic plasmas during interesting time periods, a rotating plasma source or an imaging device is one straightforward solution for performing tomographic reconstruction or confirming the reconstruction results with a sparser data set. As the demands for characterizing meter-sized plasma increased, Jang et al. [Citation191] attempted to apply tomographic optical diagnostics to an 8th generation plasma device (an electrode with a size of 2.6 × 2.2 m2) for the real-time monitoring of the spatial plasma information as detailed in .
Figure 14. (a) Cross-sectional schematic of eighth-generation industrial plasma chamber. The positions of the detector assemblies for tomographic OES are depicted as red rectangles on the chamber wall, and the lines of sights are depicted as blue lines. (b) Synthetic phantom for plasma emission with a hollow-squared structure and (c) its reconstruction test results. (d) Cross-sectional distribution of electron excitation temperature obtained from the intensity ratio of Ar I atomic lines at the wavelengths of 675.3 nm and 852.1 nm in unit eV [Citation191].
Adapted by permission of IOP Publishing.
![Figure 14. (a) Cross-sectional schematic of eighth-generation industrial plasma chamber. The positions of the detector assemblies for tomographic OES are depicted as red rectangles on the chamber wall, and the lines of sights are depicted as blue lines. (b) Synthetic phantom for plasma emission with a hollow-squared structure and (c) its reconstruction test results. (d) Cross-sectional distribution of electron excitation temperature obtained from the intensity ratio of Ar I atomic lines at the wavelengths of 675.3 nm and 852.1 nm in unit eV [Citation191].Adapted by permission of IOP Publishing.](/cms/asset/a8aa3162-6f42-4921-aac3-f0b909d45b7f/tapx_a_1526114_f0014_oc.jpg)
Unfortunately, a 3-D interpretation of plasma physics associated with electrons in nonequilibrium plasmas at atmospheric pressure has not been reported, which we believe is due to diagnostic difficulties and not a lack of interest in those physics. We hope that the technique and practical considerations given in this review will provide guidance and serve as a reference for 3-D electron characterization.
4. Implications for plasma applications
As discussed, one unique feature of weakly ionized plasmas at atmospheric pressure is that the release of plasmas into intended targets is facilitated. Thus, ‘plasma treatment’ is a basis of plasma applications. Regarding this, the set of weakly ionized plasma systems is always an interdisciplinary and multiphase problem, and plasma applications can be roughly classified into two groups: plasma-solid and plasma-liquid couplings (needless to say, they always include the gas phase). In certain cases, all states of matter should be considered (e.g. plasma interactions with human tissues).
Plasma–solid system
One fairly good example of a plasma-solid system is plasma-catalysis. The combination of plasma and solid catalyst promises dramatic improvements in catalytic or energy efficiency compared with that of plasma or catalyst alone in relevant engineering. Active attempts to employ plasma-catalysis technology for a wide range of applications from environmental remediation, such as gas conversion [Citation194,Citation195] and pollutant destruction [Citation196,Citation197], to biological engineering [Citation198,Citation199] have shown impressive results. In this system, the heterogeneous interdependence between plasma and catalyst is quite complex, with plasma inducing physicochemical changes in the catalysts and vice versa, the catalyst modifying the electric field distribution and gaseous chemical composition [as presented in )]. Mainly, catalyst beads or pellets filled inside the plasma reactor act as a dielectric support, and the electric field strength is modified and enhanced at certain points due to the catalysts [Citation200]. While the field enhancement does not directly modify the chemical properties of the plasma-catalysis system, it modifies the electron temperature, which in turn determines the overall plasma characteristics and gaseous chemical composition and hence the relative fluxes of plasma species reaching the catalyst [Citation201]. Because the role of electron impact dissociation is important, high electric field strength and electron temperatures are favored in such systems.
Figure 15. (a) Visualization of the continuous influence of plasma and catalyst on the gas conversion process [Citation192]. (b) Criteria for direct interaction between plasma and catalyst ([Citation193], reproduced by permission of Elsevier).
![Figure 15. (a) Visualization of the continuous influence of plasma and catalyst on the gas conversion process [Citation192]. (b) Criteria for direct interaction between plasma and catalyst ([Citation193], reproduced by permission of Elsevier).](/cms/asset/140ba4e6-dc61-4835-8bd6-722f7f11ca55/tapx_a_1526114_f0015_oc.jpg)
Similar to the macroscopic modification of an electric field, microscopic physical fields should be considered together. Theoretically speaking, solid walls that directly face the plasma are likely to be charged electro-negatively due to the free electrons. Consequently, the space, where shows a rapid voltage drop and imbalance between electron and ion flux (i.e. ‘sheath’), is built up. Currently, defining the plasma-sheath boundary in weakly ionized collisional discharges at high pressure is nontrivial, and achieving consensus on a scientific definition of the sheath edge in the plasma community is still necessary. Regardless, the plasma sheath obviously affects electron heating as well as the plasma species flux onto the solid surface. The flux of oxygen-related species was first investigated in terms of plasma sheath dynamics in 2012 [Citation202]; thus, relevant topics associated with plasma-solid interactions have been rarely studied and remain poorly understood. ) shows a simplified scheme of direct interaction between plasma and catalyst, although based on the detailed sheath study, such a scheme should be advanced.
The significance of electron temperature in such systems has been intuitively discussed in previous studies, and coupling and synergistic effects of plasma-catalysis on this multiphase system presently remain unclear. Thus, for such multiphase systems, those effects need further investigation based on simultaneous characterizations of both plasma and catalyst. That means a number of opportunities for experimental and theoretical studies remain, and they might open a new era of plasma and relevant research, which is why simple and reliable plasma diagnostics, particularly for free electrons, are vitally needed as an alternative to complex and conventional methods.
Plasma–liquid system
As discussed, recent plasma applications have primarily been developed for the biomedicine and agriculture fields. For many of these applications, the targets of plasma treatment are placed in a humid environment (or in direct contact with water). When the plasma directly interacts with the liquid, strong macroscopic physical and chemical processes are induced as detailed in . Similar to the plasma-catalysis system, the heterogeneous interdependence between plasma and liquid makes such systems a nonlinear problem, with dissolved plasma species (including hydrated electrons) affecting liquid properties and vice versa, the vaporized (or collision-induced desorption) water and electrons changing the plasma status. Mass transfer across the gas-liquid boundary is coupled to steep and dynamic changes in the physical fields of space charges, temperature gradients, and shockwaves. In addition, this problem is more complicated than the plasma-solid problem because of the chemical reactions associated with several hundred plasma species and dissolved chemical species. Although the hydrated electron has been extensively studied for radiation chemistry (e.g. electron beams) [Citation203–Citation205], free electrons in plasmas under such conditions are still challenging and poorly understood. Valuable and significant issues associated with free electrons that have not been resolved are listed as follows.
Approximately 10% of the hydrated electrons at the plasma-water interface may be vaporized, suggesting that the role of hydrated electrons in plasma may be significant [Citation69].
Surface charge deposition induces changes in the macroscopic morphology of liquid surface (e.g. due to mass transfers caused by electrohydrodynamic force or a change of dielectric and surface tension).
Effect of vaporized water molecules on electron density and temperature.
Plasma sheath formation that determines the chemical flux to the liquid and the energy of electrons and ions striking the liquid surface.
Filtering of short-lived chemical species, which are intermediates between long-lived species in the bulk liquid and plasma species, at the topmost liquid layer requires detailed investigations of the electron dynamics near the plasma-liquid interface.
Figure 16. Comparison of direct and indirect plasma-liquid interactions; liquid is not part of the electric circuit in indirect interactions [Citation206]. Reproduced by permission of IOP Publishing.
![Figure 16. Comparison of direct and indirect plasma-liquid interactions; liquid is not part of the electric circuit in indirect interactions [Citation206]. Reproduced by permission of IOP Publishing.](/cms/asset/45da7596-a6f6-4785-a6cb-01956d0283f3/tapx_a_1526114_f0016_oc.jpg)
Currently, numerical models covering the plasma to liquid phases have been actively reported [Citation206,Citation207], and the results show better insights into the chemical processes in the liquid compared with the plasma processes because simplified plasma models are usually preferred due to their low computational cost. Of course, since the electron dynamics have not been studied via experimental investigations, even with numerical approaches, electron-related processes (including the issues listed above) remain poorly understood. Thus, the interplays between plasma and liquid and their synergy again need further investigation based on the simultaneous characterization of both factors. A number of species coexist in plasma and liquid, and interference among these species increases the difficulty of evaluating plasma quantities. Thus, care should be taken in the diagnostics applied to such systems.
Regarding the use of electron temperature as an input parameter in most numerical models, the electron characteristics in plasmas should not be left as a black box. Precise characterizations of and information on plasma-solid and plasma-liquid multiphase systems will provide new insights into pending issues in weakly ionized plasmas that extend from basic science to industrial engineering, including methods of enhancing plasma reactivity and optimizing the overall efficiency of plasma processing.
5. Conclusions and outlooks
Observations in recent decades indicate that plasma science and technology has penetrated into our daily lives and become fundamental in relevant science and technology, including nanotechnology, energy, biology, and environmental technologies. Thus, the importance of fundamental plasma studies and active industrial plasma applications is clear. More sophisticated types of plasma sources have been developed to pursue these activities and abundant results on unique plasma characteristics have been reported; however, our understanding of the science underlying the outcomes is still unsatisfactory in many cases. Many plasma-assisted processes are still conducted via empirical and heuristic ways that are not supported by a thorough understanding based on detailed diagnostics of plasma quantities. Combining a scientific understanding with application attempts will definitely provide opportunities for the industrial commercialization of atmospheric-pressure plasmas as a new technology. In this regard, high priority works that should be accomplished include the (i) development of simple and reliable diagnostic tools and (ii) characterization of plasma based on various controllable parameters with a simple geometry.
Electron diagnostic techniques used for characterizing electrons in weakly ionized atmospheric-pressure plasmas (e.g. plasma jets, DBDs, and rf capacitive discharges) have been reviewed along with the electron information reported earlier. In addition to the basic principles and merits of the diagnostics, their limitations and practical considerations have been discussed. Weakly ionized plasmas have unique features that make electron characterization challenging. Therefore, the OES method, which assures a high spatiotemporal resolution, represents a very powerful diagnostics tool for such plasmas. In addition, passive OES can be used to measure a variety of plasma quantities with only a single measurement. One great merit is that the ne and Te values determined by bremsstrahlung in continuum radiation can be cross-checked using Stark broadening and line-to-line ratio methods (under available conditions) and vice versa. In addition, the electric field strength and ro-vibrational temperature of diatomic molecules can also be simultaneously estimated along with electron characterization. Particular attention has been paid to continuum radiation-based electron characterization methods that facilitate multidimensional imaging of electron density and temperature by introduced imaging and tomographic techniques. As low-temperature plasmas, particularly weakly ionized atmospheric-pressure plasmas, are experiencing a renaissance and opening a new era of research on diverse plasma applications, further progress is expected toward the elucidation of electron characteristics on the complex plasma-solid and plasma-liquid systems.
Acknowledgments
The authors are grateful for significant contributions made by past collaborators Dr. Jaeyoung Park and Prof. Jian Jun Shi. The authors also would like to thank Su-Jin Shin at KAIST for the text analytics result.
Disclosure statement
No potential conflict of interest was reported by the authors.
Additional information
Funding
References
- F.F. Chen, Introduction to Plasma Physics and Controlled Fusion, Vol. 2, 2nd ed., Springer, Switzerland, 1984. doi:10.1007/978-3-319-22309-4
- M.A. Lieberman and A.J. Lichtenberg, Principle of Plasma Discharges and Materials Processing, 2nd ed., Wiley, Hoboken, New Jersey, 2005. doi:10.1002/0471724254
- W. Crookes, Nature. 20 (1879) p.43–95. doi:10.1038/020419a0
- W. Siemens, Poggendorfs Ann. Phys. Chem. 102 (1857) p.66–122. doi:10.1002/andp.18571780905
- U. Kogelschatz, B. Eliasson and W. Egli, J. Phys. IV France. 7 (1997) p.C4–47. doi:10.1051/jp4:1997405
- S.Y. Moon, W. Choe and B.K. Kang, Appl. Phys. Lett. 84 (2004) p.188–190. doi:10.1063/1.1639135
- R.B. Gadri, J.R. Roth, T.C. Montie, K. Kelly-Wintenberg, P.P.-Y. Tsai, D.J. Helfritch, P. Feldman, D.M. Sherman, F. Karakaya and Z. Chen UTK Plasma Sterilization Team, Surf. Coat. Technol. 131 (2000) p.528–542. doi:10.1016/S0257-8972(00)00803-3
- G.S. Selwyn, H.W. Herrmann, J. Park and I. Henins, Contrib. Plasma Phys. 6 (2001) p.610–619. doi:10.1002/1521-3986(200111)41:6<610::AID-CTPP610>3.0.CO;2-L
- R. Snoeckx, R. Aerts, X. Tu, A. Bogaerts and J. Phys, Chem C. 117 (2013) p.4957–4970.
- X. Tao, M. Bai, X. Li, H. Long, S. Shang, Y. Yin and X. Dai, Prog. Energy Combust. Sci. 37 (2011) p.113–124. doi:10.1016/j.pecs.2010.05.001
- C. Tendero, C. Tixier and P. Tristant, J. Desmaison and P. Leprince, Spectrochim. Acta B. 61 (2006) p.2–30. doi:10.1016/j.sab.2005.10.003
- D. Mariotti and R.M. Sankaran, J. Phys. D: Appl. Phys. 44 (2011) p.174023. doi:10.1088/0022-3727/44/17/174023
- T.C. Corke, C.L. Enloe and S.P. Wilkinson, Annu. Rev. Fluid Mech. 42 (2010) p.505. doi:10.1146/annurev-fluid-121108-145550
- V. Miller, A. Lin and A. Fridman, Plasma Chem. Plasma Process. 36 (2016) p.259–268. doi:10.1007/s11090-015-9676-z
- N. Jha, J.J. Ryu, R. Wahab, A.A. Al-Khedhairy, E.H. Choi and N.K. Kaushik, Oncotarget. 8 (2017) p.20496–20509. doi:10.18632/oncotarget.14887
- S. Iseki, T. Ohta, A. Aomatsu, M. Ito, H. Kano, Y. Higashijima and M. Hori, Appl. Phys. Lett. 96 (2010) p.153704. doi:10.1063/1.3399265
- S. Jung, H.J. Kim, S. Park, H.I. Yong, J.H. Choe, H.-J. Jeon, W. Choe and C. Jo, Meat Science. 108 (2015) p.132–137. doi:10.1016/j.meatsci.2015.06.009
- S. Jung, J. Lee, Y. Lim, W. Choe, H.I. Yong and C. Jo, Innov. Food Sci. Emerg. Technol. 39 (2017) p.113–118. doi:10.1016/j.ifset.2016.11.010
- E. Bormashenko, R. Grynyov, Y. Bormashenki and E. Drori, Sci. Rep. 2 (2012) p.741. doi:10.1038/srep00386
- L. Ling, J. Jiafeng, L. Jiangang, S. Minchong, H. Xin, S. Hanliang and D. Yuanhua, Sci. Rep. 4 (2014) p.5859. doi:10.1038/srep05859
- N. Lu, J. Lou, C.H. Wang, J. Li and Y. Wu, Water Air Soil. Pollut. 225 (2014) p.1991. doi:10.1007/s11270-014-1991-0
- T.H. Kim, J. Lee, H.–.J. Kim and C. Jo, Food Chem. 65 (2017) p.6929–6935. doi:10.1021/acs.jafc.7b00987
- H. Jung, J. Park, E.S. Yu, G.-S. Han, H.S. Jung, M.J. Ko, S. Park and W. Choe, Nanoscale. 5 (2013) p.7825. doi:10.1039/c3nr01889j
- H.-J. Kim, H.I. Yong, S. Park, W. Choe and C. Jo, Curr. Appl. Phys. 13 (2013) p.1420–1425. doi:10.1016/j.cap.2013.04.021
- R. Messaoudi, A. Younsi, F. Massines, B. Despax and C. Mayoux, IEEE Trans. Dielectric Elect. Insul. 3 (1996) p.537–543. doi:10.1109/94.536733
- C. Wang and X. He, Appl. Surf. Sci. 253 (2006) p.926–929. doi:10.1016/j.apsusc.2006.01.032
- H.-C. Lee and C.-W. Chung, Sci. Rep. 5 (2015) p.15254. doi:10.1038/srep15254
- H.-C. Lee, B.H. Seo, D.-C. Kwon, J.H. Kim, D.J. Seong, S.J. Oh, C.-W. Chung, K.H. You and C. Shin, Appl. Phys. Lett. 110 (2017) p.014106. doi:10.1063/1.4971980
- S.K. Karkari, A.R. Ellingboe and C. Gaman, Appl. Phys. Lett. 93 (2008) p.071501. doi:10.1063/1.2971236
- H.-C. Lee, M.-H. Lee and C.-W. Chung, Phys. Plasmas. 17 (2010) p.013501. doi:10.1063/1.3266418
- Y.-X. Liu, Q.-Z. Zhang, W. Jiang, L.-J. Hou, X.-Z. Jiang, W.-Q. Lu and Y.-N. Wang, Phys. Rev. Lett. 107 (2011) p.055002. doi:10.1103/PhysRevLett.107.055002
- G.E. Georghiou, A.P. Papadakis, R. Morrow and A.C. Metaxas, J. Phys. D: Appl. Phys. 38 (2005) p.r303–r328. doi:10.1088/0022-3727/38/20/R01
- C. O’Neill, J. Waskoenig and T. Gans, Appl. Phys. Lett. 101 (2012) p.154107. doi:10.1063/1.4758463
- N. Balcon, G.J.M. Hagelaar and J.P. Boeuf, IEEE Tran. Plasma Sci. 36 (2008) p.2782–2787. doi:10.1109/TPS.2008.2003135
- H.R. Griem, Spectral Line Broadening by Plasmas, Academic Press, New York and London, 1974.
- X.M. Zhu and Y.K. Pu, Plasma Sources Sci. Technol. 17 (2008) p.024002. doi:10.1088/0963-0252/17/2/024002
- X.M. Zhu, W.C. Chen, J. Li and Y.K. Pu, J. Phys. D: Appl. Phys. 42 (2009) p.025203. doi:10.1088/0022-3727/42/2/025203
- J. Park, I. Henins, H.W. Herrmann and G.S. Selwyn, Phys. Plasmas. 7 (2000) p.3141–3144. doi:10.1063/1.874220
- S. Park, W. Choe, S.Y. Moon and J. Park, Appl. Phys. Lett. 104 (2014) p.084103. doi:10.1063/1.4866804
- K.T.A.L. Burm, Plasma Sources Sci. Technol. 13 (2004) p.387–394. doi:10.1088/0963-0252/13/3/004
- I. Adamovich, et al, J. Phys. D: Appl. Phys. 50 (2017) p.323001. doi:10.1088/1361-6463/aa76f5
- S. Reuter, T. von Woedtke and K.-D. Weltmann, J. Phys. D: Appl. Phys. 51 (2018) p.233001. doi:10.1088/1361-6463/aab3ad
- X. Lu, M. Laroussi and V. Puech, Plasma Sources Sci. Technol. 21 (2012) p.034005. doi:10.1088/0963-0252/21/3/034005
- S. Bird, E. Loper and E. Klein, Natural Language Processing with Python, O’Reilly Media Inc, Sebastopol, CA, 2009.
- T. Mikolov, K. Chen, G. Corrado and J. Dean, Efficient Estimation of Word Representations in Vector Space, Proceedings of the ICLR conference, Scottsdale, Arizona, 2013.
- R. Řehůřek and P. Sojka, Software framework for topic modelling with large corpora, Proceedings of the LREC 2010 Workshop on New Challenges for NLP Frameworks, Valletta, Malta, 2010.
- M. Bastian, S. Heymann and M. Jacomy, Gephi: An open source software for exploring and manipulating networks, International AAAI Conference on Weblogs and Social Media, AAAI Press, San Jose, USA, 2009.
- A. Gutsol, Warm Discharges for Fuel Conversion, Wiley-VCH, Weinheim, 2010. doi:10.1002/9783527628148.hoc085
- H. Jung, B. Gweon, D.B. Kim and W. Choe, Plasma Process. Polym. 8 (2011) p.535–541. doi:10.1002/ppap.201000130
- O. Sakai, M. Kimura, T. Shirafuji and K. Tachibana, Appl. Phys. Lett. 93 (2008) p.231501. doi:10.1063/1.3006348
- O. Sakai, T. Morita, Y. Ueda, N. Sano and K. Tachibana, Thin Solid Films. 519 (2011) p.6999–7004. doi:10.1016/j.tsf.2011.01.225
- K.D. Weltmann, E. Kindel, T. von Woedtke, M. Hähnell, M. Stieber and R. Brandenburg, Pure Appl. Chem. 82 (2010) p.1223–1237. doi:10.1351/PAC-CON-09-10-35
- S. Park, S.Y. Moon and W. Choe, Appl. Phys. Lett. 103 (2013) p.224105. doi:10.1063/1.4833638
- D.B. Kim, H. Jung, B. Gweon, S.Y. Moon, J.K. Rhee and W. Choe, Phys. Plasmas. 18 (2011) p.043503. doi:10.1063/1.3574256
- X. Lu, G.V. Naidis, M. Laroussi and K. Ostrikov, Phys. Rep. 540 (2014) p.123–166. doi:10.1016/j.physrep.2014.02.006
- M. Laroussi, IEEE Trans. Plasma Sci. 43 (2015) p.703–712. doi:10.1109/TPS.2015.2403307
- X. Lu and S. Wu, IEEE Trans. Plasma Sci. 41 (2013) p.2313–2326. doi:10.1109/TPS.2013.2268579
- J.Y. Kim, Y. Wei, J. Li, P. Foy, T. Hawkins, J. Ballato and S.-O. Kim, Small. 7 (2011) p.2291–2295. doi:10.1002/smll.201100456
- S. Askari, M. Macias-Montero, T. Velusamy, P. Maguire, V. Svrcek and D. Mariotti, J. Phys. D: Appl. Phys. 48 (2015) p.314002. doi:10.1088/0022-3727/48/31/314002
- S. Park, U. Cvelbar, W. Choe and S.Y. Moon, Nat. Commun. 9 (2018) p.371. doi:10.1038/s41467-017-02766-9
- J.Y. Kim, E.S. Seo, H. Kim, J.-W. Park, D.-K. Lim and D.W. Moon, Nat. Commun. 8 (2017) p.2113. doi:10.1038/s41467-017-02216-6
- P. Rumbach, D.M. Bartels, R.M. Sankaran and D.B. Go, Nat. Commun. 6 (2015) p.7248. doi:10.1038/ncomms8248
- G. Daeschlein, T. von Woedtke, E. Kindel, R. Brandenburg, K.-D. Weltmann and M. Jünger, Plasma Process. Polym. 7 (2010) p.224–230. doi:10.1002/ppap.200900059
- B. Haertel, T. von Woedtke, K.-D. Weltmann and U. Lindequist, Biomol. Ther. 22 (2014) p.477–490. doi:10.4062/biomolther.2014.105
- B. Gweon, M. Kim, K. Kim, J. Choung, M.N. Lee, U.H. Ko, J.W. Hyun, W. Choe and J.H. Shin, Exp. Dermatol. 25 (2016) p.151–164. doi:10.1111/exd.12869
- B. Gweon, M. Kim, D.B. Kim, D. Kim, H. Kim, H. Jung, J.H. Shin and W. Choe, Appl. Phys. Lett. 99 (2011) p.063701. doi:10.1063/1.3622631
- B. Gweon, H. Kim, K. Kim, M. Kim, E. Shim, S. Kim, W. Choe and J.H. Shin, Appl. Phys. Lett. 104 (2014) p.133701. doi:10.1063/1.4870623
- R. Ono, J. Phys. D: Appl. Phys. 49 (2016) p.083001. doi:10.1088/0022-3727/49/8/083001
- P.J. Bruggeman, et al., Plasma Sources Sci. Technol. 25 (2016) p.053002. doi:10.1088/0963-0252/25/5/053002
- X. Lu, G.V. Naidis, M. Laroussi, S. Reuter, D.B. Graves and K. Ostrikov, Phys. Rep. 630 (2016) p.p1–84. doi:10.1016/j.physrep.2016.03.003
- Y. Xia, D. Liu, W. Wang, Z. Bi, X. Wang, J. Niu, L. Ji, Y. Song and Z. Qi, J. Phys. D: Appl. Phys. 49 (2016) p.165202. doi:10.1088/0022-3727/49/16/165202
- S. Wu, X. Lu, D. Liu, Y. Yang, Y. Pan and K. Ostrikov, Phys. Plasmas. 21 (2014) p.103508. doi:10.1063/1.4897393
- D. Breden, K. Miki and L.L. Raja, Appl. Phys. Lett. 99 (2011) p.111501. doi:10.1063/1.3636433
- G.V. Naidis, J. Phys. D: Appl. Phys. 44 (2011) p.215203. doi:10.1088/0022-3727/44/21/215203
- J.-P. Boeuf, L.L. Yang and L.C. Pitchford, J. Phys. D: Appl. Phys. 46 (2013) p.015201. doi:10.1088/0022-3727/46/1/015201
- B. van Gessel, R. Brandenburg and P. Bruggeman, Appl. Phys. Lett. 103 (2013) p.064103. doi:10.1063/1.4817936
- S. Hübner, J.S. Sousa, V. Puech, G.M.W. Kroesen and N. Sadeghi, J. Phys. D: Appl. Phys. 47 (2014) p.432001. doi:10.1088/0022-3727/47/43/432001
- S. Hübner, S. Hofmann, E.M. van Veldhuizen and P.J. Bruggeman, Plasma Sources Sci. Technol. 22 (2013) p.065011. doi:10.1088/0963-0252/22/6/065011
- J.-Y. Choi, N. Takano, K. Urabe and K. Tachibana, Plasma Sources Sci. Technol.. 18 (2009) p.035013. doi:10.1088/0963-0252/18/3/035013
- S. Hofmann, A.F.H. van Gessel, T. Verreycken and P. Bruggeman, Plasma Sources Sci. Technol. 20 (2011) p.065010. doi:10.1088/0963-0252/20/6/065010
- D. Xiao, C. Cheng, J. Shen, Y. Lan, H. Xie, X. Shu, Y. Meng, J. Li and P.K. Chu, Phys. Plasmas. 21 (2014) p.053510. doi:10.1063/1.4879033
- M. Qian, C. Ren, D. Wang, J. Zhang and G. Wei, J. Appl. Phys. 107 (2010) p.063303. doi:10.1063/1.3330717
- S.Y. Moon and W. Choe, Phys. Plasmas. 13 (2006) p.103503. doi:10.1063/1.2357722
- S. Park, W. Choe, H. Kim and J.Y. Park, Plasma Sources Sci. Technol. 24 (2015) p.034003. doi:10.1088/0963-0252/24/3/034003
- M. Kraus, B. Eliasson, U. Kogelschatz and A. Wokaum, Phys. Chem. Chem. Phys. 3 (2001) p.294–300. doi:10.1039/b007015g
- M.A. Malik, Plasma Chem. Plasma Process. 30 (2010) p.21–31. doi:10.1007/s11090-009-9202-2
- C.L. Enloe, T.E. McLaughlin, R.D.V. Dyken, K.D. Kachner, E.J. Jumper, T.C. Corke, M. Post and O. Haddad, AIAA Journal. 42 (2004) p.595–604. doi:10.2514/1.3884
- F. Massines and G. Gouda, J. Phys. D: Appl. Phys. 31 (1998) p.3411–3420. doi:10.1088/0022-3727/31/24/003
- M. Robinson, AIEE Trans. 80 (1961) p.143–150.
- E. Moreau, N. Benard, J.D. Lan-Sun-Luk and J.P. Chabriat, J. Phys. D: Appl. Phys. 46 (2013) p.475204. doi:10.1088/0022-3727/46/47/475204
- J.P. Boeuf, Y. Lagmich, T. Unfer, T. Callegari and L.C. Pitchford, J. Phys. D: Appl. Phys. 40 (2007) p.652–662. doi:10.1088/0022-3727/40/3/S03
- F. Iza, G.J. Kim, S.M. Lee, J.K. Lee, J.L. Walsh, Y.T. Zhang and M.G. Kong, Plasma Process. Polym. 5 (2008) p.322–344. doi:10.1002/ppap.200700162
- J.J. Shi, D.W. Liu and M.G. Kong, Appl. Phys. Lett. 89 (2006) p.081502. doi:10.1063/1.2338647
- J.M. Williamson, D.D. Trump, P. Bletzinger and B.N. Ganguly, J. Phys. D: Appl. Phys. 39 (2006) p.4400–4406. doi:10.1088/0022-3727/39/20/016
- J. Kriegseis, S. Grundmann and C. Tropea, Phys. Plasmas. 19 (2012) p.073509. doi:10.1063/1.4736995
- X. Zhang, B.J. Lee, H.G. Im and M.S. Cha, IEEE Trans. Plasma Sci. 44 (2016) p.2288–2296. doi:10.1109/TPS.2016.2601246
- S.K. Kundu, E.M. Kennedy, V.V. Gaikwad, T.S. Molley and B.Z. Dlugogorski, Chem. Eng. J. 180 (2012) p.178–189. doi:10.1016/j.cej.2011.11.039
- R. Li, Q. Tang, S. Yin and T. Sato, Appl. Phys. Lett. 90 (2007) p.131502. doi:10.1063/1.2716848
- Y.P. Raizer, M.N. Shneider and N.A. Yatsenko, Radio-Frequency Capacitive Discharges, CRC, Boca Raton, 1995.
- T. Makabe and Z.Lj. Petrović, Appl. Surf. Sci. 192 (2002) p.88–114. doi:10.1016/S0169-4332(02)00022-3
- D. He and D.R. Hall, IEEE J. Quantum Electron. 20 (1984) p.509. doi:10.1109/JQE.1984.1072430
- J. Park, I. Henins, H.W. Hermann, G.S. Selwyn and R.F. Hicks, J. Appl. Phys. 89 (2001) p.20–28. doi:10.1063/1.1323753
- S.Y. Moon, D.B. Kim, B. Gweon and W. Choe, Appl. Phys. Lett. 93 (2008) p.221506. doi:10.1063/1.3043451
- S.Y. Moon, D.B. Kim, J.K. Rhee, B. Gweon and W. Choe, Curr. Appl. Phys. 9 (2009) p.274–277. doi:10.1016/j.cap.2008.02.008
- F. Iza, J.K. Lee and M.G. Kong, Phys. Rev. Lett. 99 (2007) p.075004. doi:10.1103/PhysRevLett.99.075004
- J.J. Shi and M.G. Kong, Phys. Rev. Lett. 96 (2006) p.105009. doi:10.1103/PhysRevLett.96.105009
- D.W. Liu, J.J. Shi and M.G. Kong, Appl. Phys. Lett. 90 (2007) p.041502. doi:10.1063/1.2425045
- D.W. Liu, F. Iza and M.G. Kong, Appl. Phys. Lett. 93 (2008) p.261503. doi:10.1063/1.3058686
- J.L. Walsh, Y.T. Zhang, F. Iza and M.G. Kong, Appl. Phys. Lett. 93 (2008) p.221505. doi:10.1063/1.3043449
- S. Zhang, W. van Gaens, B. van Gessel, S. Hotmann, E. van Veldhuizen, A. Bogaerts and P. Bruggeman, J. Phys. D: Appl. Phys. 46 (2013) p.205202. doi:10.1088/0022-3727/46/20/205202
- J. Laimer and H. Störi, Plasma Process. Polym. 3 (2006) p.573–586. doi:10.1002/ppap.200600046
- G.V. Naidis, Plasma Process. Polym. 14 (2017) p.1600127. doi:10.1002/ppap.201600127
- Z. Chen, Z. Yin, M. Chen, L. Hong, G. Xia, Y. Hu, Y. Huang, M. Liu and A.A. Kudryavtsev, J. Appl. Phys. 116 (2014) p.153303. doi:10.1063/1.4898736
- S.-Z. Li, J.-P. Lim, J.G. Kang and H.S. Uhm, Phys. Plasmas. 13 (2006) p.093503. doi:10.1063/1.2355428
- M. Moravej, X. Yang, G.R. Nowling, J.P. Chang, R.F. Hicks and S.E. Babayan, J. Appl. Phys. 96 (2004) p.7011–7017. doi:10.1063/1.1815047
- S.-Z. Li, J.-P. Lim and H.S. Uhm, Phys. Lett. A. 360 (2006) p.304–308. doi:10.1016/j.physleta.2006.08.036
- J.J. Shi and M.G. Kong, Appl. Phys. Lett. 87 (2005) p.201501. doi:10.1063/1.2128691
- S. Park, W. Choe, S.Y. Moon and S.J. Yoo, Plasma Sources Sci. Technol. 24 (2015) p.032006. doi:10.1088/0963-0252/24/3/032006
- S. Park, W. Choe, S.Y. Moon and J.J. Shi, Sci. Rep. 8 (2018) p.7516. doi:10.1038/s41598-018-25892-w
- X.M. Zhu, Y.K. Pu, N. Balcon and R. Boswell, J. Phys. D: Appl. Phys. 42 (2009) p.142003. doi:10.1088/0022-3727/42/14/142003
- L. Prevosto, H. Kelly and B.R. Mancinelli, J. Appl. Phys. 112 (2012) p.063302. doi:10.1063/1.4752886
- G. Trenchev, S. Kolev and Z. Kiss’ovski, Plasma Sources Sci. Technol. 26 (2017) p.055013. doi:10.1088/1361-6595/aa63c2
- O. Sakai, Y. Kichimoto and K. Tachibana, J. Phys. D: Appl. Phys. 38 (2005) p.431–441. doi:10.1088/0022-3727/38/3/012
- A. Begum, M. Laroussi and M.R. Pervez, Int. J. Eng. Technol. 11 (2011) p.209–215.
- M.M. Kuraica and N. Konjević, Appl. Phys. Lett. 70 (1997) p.1521–1523. doi:10.1063/1.118606
- G.B. Sretenović, I.B. Krstić, V.V. Kovačević, B.M. Obradović and M.M. Kuraica, Appl. Phys. Lett. 99 (2011) p.161502. doi:10.1063/1.3653474
- P. Paris, M. Aints, F. Valk, T. Plank, A. Haljaste, K.V. Kozlov and H.-E. Wagner, J. Phys. D: Appl. Phys. 38 (2005) p.3894–3899. doi:10.1088/0022-3727/38/21/010
- S.Y. Moon and W. Choe, Spectrochim. Acta B. 58 (2003) p.249–257. doi:10.1016/S0584-8547(02)00259-8
- S. Pellerin, J.M. Cormier, F. Richard, K. Musiol and J. Chapelle, J. Phys. D: Appl. Phys. 29 (1996) p.726–739. doi:10.1088/0022-3727/29/3/034
- A.Y. Nikiforov, C. Leys, M.A. Gonzalez and J.L. Walsh, Plasma Sources Sci. Technol. 24 (2015) p.034001. doi:10.1088/0963-0252/24/3/034001
- G. Dilecce, L.M. Martimi, P. Tosi, M. Scotoni and S. De., Benedictis, Plasma Sources Sci. Technol. 24 (2015) p.034007. doi:10.1088/0963-0252/24/3/034007
- T. Verreycken, R.M. van der Horst, A.H.F.M. Baede, E.M. Van Veldhuizen and P.J. Bruggemen, J. Phys. D: Appl. Phys. 45 (2012) p.045205. doi:10.1088/0022-3727/45/4/045205
- A.F.H. van Gessel, B. Hrycak, M. Jasinski, J. Mizeraczyk, J.J.A.M. van der Mullen and P.J. Bruggeman, J. Phys. D: Appl. Phys. 46 (2013) p.095201. doi:10.1088/0022-3727/46/9/095201
- N. Niemi, V. Schulz-von der Gathen and H.F. Döbele, Plasma Sources Sci. Technol. 14 (2005) p.375–386. doi:10.1088/0963-0252/14/2/021
- S. Reuter, J.S. Sousa, G.D. Stancu and J.-P. Hubertus van Helden, Plasma Sources Sci. Technol. 24 (2015) p.054001. doi:10.1088/0963-0252/24/5/054001
- H. Kempkens and J. Uhlenbusch, Plasma Sources Sci. Technol. 9 (2000) p.492–506. doi:10.1088/0963-0252/9/4/305
- S. Hübner, J.S. Sousa, J. van der Mullen and W.G. Graham, Plasma Sources Sci. Technol. 24 (2015) p.054005. doi:10.1088/0963-0252/24/5/054005
- A.F.H. van Gessel, E.A.D. Carbone, P.J. Bruggeman and J.J.A.M. van der Mullen, Plasma Sources Sci. Technol. 21 (2012) p.015003. doi:10.1088/0963-0252/21/1/015003
- G. Dodel and W. Kunz, Appl. Opt. 14 (1975) p.2537–2541.
- F. Leipold, R.H. Stark, A. El-Habachi and K.H. Schoenbach, J. Phys. D: Appl. Phys. 33 (2000) p.2268–2273. doi:10.1088/0022-3727/33/18/310
- P. Kempkes, F. Mackel, H. Stein, J. Tenfelde and H. Soltwisch, Meas. Sci. Technol. 21 (2010) p.125701. doi:10.1088/0957-0233/21/12/125701
- K. Urabe, H. Muneoka, S. Stauss and K. Terashima, Plasma Sources Sci. Technol. 23 (2014) p.064007. doi:10.1088/0963-0252/23/6/064007
- H.J. Kunze, Introduction to Plasma Spectroscopy, Springer, Heidelberg, 2009.
- C.O. Laux, T.G. Spence, C.H. Kruger and R.N. Zare, Plasma Sources Sci. Technol. 12 (2003) p.125–138. doi:10.1088/0963-0252/12/2/301
- U. Fantz, Plasma Sources Sci. Technol. 15 (2006) p.SS137–S147. doi:10.1088/0963-0252/15/4/S01
- X.-M. Zhu and Y.-K. Pu, J. Phys. D: Appl. Phys. 43 (2010) p.015204. doi:10.1088/0022-3727/43/1/015204
- G.B. Rybicki and A.P. Lightman, Radiative Processes in Astrophysics, Wiley-VCH, Weinheim, 2004. doi:10.1002/9783527618170
- A.T.M. Wilbers, G.M.W. Kroesen, C.J. Timmermans and D.C. Schram, J. Quantum Spectrosc. Radiat. Transfer. 45 (1991) p.1–10. doi:10.1016/0022-4073(91)90076-3
- L.M. Biberman and G.E. Norman, Opt. Spectrosc. 8 (1960) p.230.
- D. Hammer and L. Frommhold, Phys. Rev. A. 64 (2001) p.024705. doi:10.1103/PhysRevA.64.024705
- A.Z. Akcasu and L.H. Wald, Phys. Fluids. 10 (1967) p.1327–1335. doi:10.1063/1.1762279
- V. Kasýanov and A. Starostin, Sov. Phys. JETP. 21 (1965) p.193–198.
- J. van der Mullen, G. Boidin and M. van de Sandea, Spectrochimca Acta B. 59 (2004) p.929–940. doi:10.1016/j.sab.2004.04.004
- F. Jia, N. Sumi, K. Ishikawa, H. Kano, H. Inui, J. Kularatne, K. Takeda, H. Kondo, M. Sekine, A. Kono and M. Hori, Appl. Phys. Express. 4 (2011) p.026101. doi:10.1143/APEX.4.026101
- A. Kono and K. Iwamoto, Jpn. J. Appl. Phys. 43 (2004) p.L1010–L1013. doi:10.1143/JJAP.43.L1010
- J. Torres, J.M. Palomares, A. Sola, J.J.A.M. van der Mullen and A. Gamero, J. Phys. D: Appl. Phys. 40 (2007) p.5929–5936. doi:10.1088/0022-3727/40/19/023
- E. Iordanova, J.M. Palomares, A. Gamero, A. Sola and J.J.A.M. van der Mullen, J. Phys. D: Appl. Phys. 42 (2009) p.155208. doi:10.1088/0022-3727/42/15/155208
- R.L. Taylor and G. Caledonia, Quantum Spectrosc. Radiat. Transter. 9 (1969) p.657–679. doi:10.1016/0022-4073(69)90013-2
- A.Y. Nikiforov, E.-R. Ionita, G. Dinescu and C. Leys, Plasma Phys. Control. Fusion. 58 (2016) p.014013. doi:10.1088/0741-3335/58/1/014013
- W. Bussière, D. Vacher, S. Menecier and P. André, Plasma Sources Sci. Technol. 20 (2011) p.045004. doi:10.1088/0963-0252/20/4/045004
- Z.L. Zhang, J.W.M. Lim, Q.Y. Nie, X.N. Zhang and B.H. Jiang, AIP Advances. 7 (2017) p.105313. doi:10.1063/1.5000044
- E. Desjardins, et al., Plasma Sources Sci. Technol. 27 (2018) p.015015.
- J.T. Gudmundsson, Plasma Sources Sci. Technol. 10 (2001) p.76–81.
- A.B. Treshchalov and A.A. Lissovski, Quantum Electron. 40 (2010) p.234–240.
- D.E. Paulsen, W.F. Sheridan and R.E. Huffman, J. Chem. Phys. 53 (1970) p.647–658.
- U. Fantz, B. Schalk and K. Behringer, New J. Phys. 2 (2000) p.7.1–7.15.
- V.-D. Hodoroaba, E.B.M. Steers, V. Hoffmann and K. Wetzig, J. Anal. At. Spectrom. 16 (2001) p.43–49.
- T. Farouk, B. Farouk, A. Gutsol and A. Fridman, Plasma Sources Sci. Technol. 17 (2008) p.035015.
- B.P. Lavrov, A.S. Melnikov, M. Käning and J. Röpcke, Phys. Rev. E 59 (1999) p.3526–3543.
- X. Yuan and L.L. Raja, IEEE Trans. Plasma Sci. 31 (2003) p.495–503.
- J.M. Pouvesle, A. Bouchoule and J. Stevefelt, J. Chem. Phys. 77 (1982) p.817–825.
- R.E. Huffman, Y. Tanaka and J.C. Larrabee, J. Opt. Soc. Am. 52 (1962) p.851–857.
- P.C. Hill, Phys. Rev. A 43 (1991) p.2546–2549.
- A.A. Mihajlov, A.M. Ermolaev and M.S. Dimitrievic, J. Quant. Spectrosc. Radiat. Transfer. 50 (1993) p.227–232.
- R. Bazinette, J. Paillol and F. Massines, Plasma Sources Sci. Technol. 24 (2015) p.055021.
- S. Park, Ph.D. thesis, KAIST, 2016.
- S. Park, W. Choe and H. Kim, Sci. Rep. 8 (2018) p.10217. doi:10.1038/s41598-018-27945-6
- M. Gherardi, N. Puač, D. Marić, A. Stancampiano, G. Malović, V. Colombo and Z.Lj. Petrović, Plasma Sources Sci. Technol. 24 (2015) p.064004.
- Y.-C. Kim, S.-H. Jang, S.-J. Oh, H.-C. Lee and C.-W. Chung, Rev. Sci. Instrum. 84 (2013) p.053505.
- H. Park, W. Choe and S.J. Yoo, Spectrochim. Acta B. 65 (2010) p.1029–1032.
- R.S. Granetz and P. Smeulders, Nucl. Fusion. 28 (1988) p.457–476.
- I. Song, J. Jang, T. Jeon, D. Pacella, G. Claps, F. Murtas, S.H. Lee and W. Choe, Curr. Appl. Phys. 16 (2016) p.1284–1292.
- S.H. Lee, J. Kim, J.H. Lee and W. Choe, Curr. Appl. Phys. 10 (2010) p.893–899.
- T.M. Ruzug, Computed Tomography: From Photon Statistics to Modern Cone-Beam CT, Springer-Verlag Berlin Heidelberg, 2008. doi:10.1007/978-3-540-39408-2
- J.T. VanderPlas, A.J. Connolly, B. Jain, and M. Jarvis, J. Astrophys. 727 (2011) p.118.
- J. Zhao, A.G. Kosovichev and T. Sekii, Astrophys. J. 708 (2010) p.304.
- T. Craciunescu, G. Bonheure, V. Kiptily, A. Murari, I. Tiseanu and V. Zoita, JET-EFDA Contributors, Nucl. Instruments Methods Phys. Res. A 605 (2009) p.374–383.
- W. Cai and C.F. Kaminski, Appl. Phys. Lett. 104 (2014) p.034101.
- K. Rathore, P. Munshi and S. Bhattacharjee, Rev. Sci. Intrum. 87 (2016) p.033501.
- Y. Babou, F. Cannat, D. Lequang and C. Rond, IOP Conf. Series: J. Phys.: Conf. Series. 815 (2017) p.012032.
- J. Jang, S. Park, J.Y. Park and W. Choe, Plasma Sources Sci. Technol. In press 2018. doi:10.1088/1361-6595/aac671
- R. Snoeckx and A. Bogaerts, Chem. Soc. Rev. 46 (2017) p.5805–5863.
- H.-H. Kim, Y. Teramoto, N. Negishi and A. Ogata, Catalysis Today. 256 (2015) p.13–22.
- L. Wang, Y. Yi, H. Guo and X. Lu, ACS Catal. 8 (2018) p.90–100.
- R. Snoechx, S. Heijkers, K.V. Wesenbeeck, S. Lenaerts and A. Bogaerts, Energy Environ. Sci. 9 (2016) p.999–1011.
- A.M. Harling, D.J. Glover, J.C. Whitehead and K. Zhang, Appl. Catal. B: Environ. 90 (2009) p.157–161.
- S.K.P. Veerapandian, C. Leys, N.D. Geyter and R. Morent, Catalysts. 7 (2017) p.113.
- R. Zhou, R. Zhou, X. Zhang, J. Li, X. Wang, Q. Chen, S. Yang, Z. Chen, K. Bazaka and K. Ostrikov, Sci. Rep. 6 (2016) p.39552.
- H. Jung, D.B. Kim, B. Gweon, S.Y. Moon and W. Choe, Appl. Catal. B: Environ. 93 (2010) p.212–216.
- S.B. Leonov, I.V. Adamovich and V.R. Soloviev, Plasma Sources Sci. Technol. 25 (2016) p.063001.
- E.C. Neyts, K. Ostrikov, M.K. Sunkara and A. Bogaerts, Chem. Rev. 115 (2015) p.13408–13446.
- D.X. Liu, A.J. Yang, X.H. Wang, M.Z. Rong, F. Iza and M.G. Kong, J. Phys. D: Appl. Phys. 45 (2012) p.305205.
- B.C. Garrett, et al., Chem. Rev. 105 (2005) p.355–390.
- J.K. Thomas, S. Gordon and E.J. Hart, J. Am. Chem. Soc. 68 (1964) p.1524–1527.
- M. Armbruster, H. Haberland and H.-G. Schindler, Phys. Rev. Lett. 47 (1981) p.323–326.
- Z.C. Liu, D.X. Liu, C. Chen, D. Li, A.J. Yang, M.Z. Rong, H.L. Chen and M.G. Kong, J. Phys. D: Appl. Phys. 48 (2015) p.495201.
- Y. Sakiyama, D.B. Graves, H.-W. Chang, T. Shimizu and G.E. Morfill, J. Phys. D: Appl. Phys. 45 (2012) p.425201.
- B. Zhang, Q. Wang, G. Zhang and S. Liao, J. Appl. Phys. 115 (2014) p.043302. doi:10.1063/1.4863119