
 ?Mathematical formulae have been encoded as MathML and are displayed in this HTML version using MathJax in order to improve their display. Uncheck the box to turn MathJax off. This feature requires Javascript. Click on a formula to zoom.
ABSTRACT
In the post year 2000 era the technologies that facilitate human communication have rapidly multiplied. While the adoption of these technologies has hugely impacted the behaviour and sociality of people, specifically in urban but also in rural environments, their ‘digital footprints’ on different data bases have become an active area of research. The existence and accessibility of such large population-level datasets, has allowed scientists to study and model innate human tendencies and social patterns in an unprecedented way that complements traditional research approaches like questionnaire studies. In this review, we focus on data analytics and modelling research – along the lines of Social Physics – as it has been carried out using the mobile phone datasets to get insight into the various aspects of human sociality, burstiness in communication, mobility patterns, and daily rhythms.
Graphical Abstract
1. Introduction
Technologies that harness digital information have grown over the past two decades in a number of unprecedented ways. It is said that in the current state-of-the-art, everyday an order of bytes of data gets created [Citation1], and this rate of data creation is forecast to increase by 2025 up to
bytes per annum, the transfer of which with today’s broadband technology would take 450 million years [Citation2]. The main bulk of this ‘big data’ is formed by records or ‘digital footprints’ from various modes of modern-day communication such as mobile phone calls, social media postings, and online commercial activities. The availability of such data has opened up an unprecedentedly wide range of opportunities for computational analytics and modelling research on social systems in terms of their complex structure and dynamics [Citation3]. In this data-driven approach one focusses on studying the complexities of social systems or networks at different structural and dynamical scales to understand ‘how does microscopic translate to macroscopic’. In order to get insight into the structure, function and behaviour of social systems, we employ the methodologies of data analysis for making observations or discoveries, modelling for describing dynamical processes or plausible mechanisms governing the system and simulation for predicting the behaviour of the system. In this empirical research framework, which along the lines of Social Physics, the broad perspective is about understanding the dynamics of human social behaviour in different contexts through phenomenological models. In constructing such models of complex social systems we are somewhat handicapped because unlike in physics we are not yet familiar with the ‘underlying laws’. Then the purpose of the model becomes important. From physics we already know that any model does not come even close to capturing all the details of the system. Therefore, we have become accustomed to the idea that ‘the model should be as simple as possible but not simpler’, yet we want the model to describe some of the salient features or behaviour of the real system, reasonably well. Thus in our model building we aim for tractability and clarity, by considering that ‘models are like maps’ so that they are useful when they contain the details of interest and ignore others [Citation4]. Therefore, we believe that the utility of simple models in describing the complexities of, for example, poorly understood ICT-based social systems, is very high. Simple models may, indeed, give deep insights into the social system in the same way that the simple Ising model provides useful understanding and quantitatively correct predictions on critical phenomena of real magnetic systems.
Over the past few years Social Physics has evolved into a multidisciplinary area of research interests focusing on human sociality embedded in social network and societal structures, with the help of data from various sources and its analytics. It is capable of revealing the structure and behavioural patterns of social systems at different scales from individual to societal level as well as capturing the long term evolution of the society [Citation5]. The concept of Social Physics is not new; it was first introduced by philosopher August Comte during the era of Industrial Revolution in the early 19th century with the view that the behaviour and functions of human societies could be explained in terms of underlying laws like in physics [Citation7]. In the first half of the 20th century there were pioneering contributions in this yet emerging area by scientists like G. K. Zipf and J. Q. Stewart [Citation8]. Since then the area has mainly evolved through the efforts of statistical physicists, especially through modelling [Citation9–Citation11]. Now a full fledged data-driven paradigm, the Social Physics research borrows concepts and methodologies from social experiments, network science, game theory, theory of phase transitions and critical phenomena, automated data-collection systems, etc. Overall, the Social Physics aims to answer scientific questions that would be instrumental in tackling challenges in the areas like, socio-political conflicts, organized crimes, human health, human migration and the development and productivity at multiple scales from organizations to cities [Citation12,Citation13].
Here we will review the work carried out in the spirit of Social Physics relying on data from mobile phone call detail records (CDRs), that includes, time stamps of voice calls and text messages (SMS messages). For the purpose of academic research such datasets could be released by mobile phone service providers with anonymity of the subscribers ensured [Citation14]. In another type of research with volunteers, the subjects have been allotted pre-programmed mobile phones to allow the collection of the data from the subjects into centralized servers for the time period of the study for the purpose of subsequent data analytics [Citation15,Citation16]. One is referred to Section II for further clarification on the nature of the data. Before such datasets and methods of data collection became available, research of human social behaviour relied mostly on questionnaire-based surveys and field observations typically on small number of individuals [Citation17]. In these survey-based studies the scope of social interactions is usually wide but based on individual recollection, raising the issues of subjectivity and how to measure the strength of social interaction, and with what scale. In contrast, the kind of data from mobile CDRs provides relatively narrow scope to social interaction while being based on measurements, for example in terms of the duration of a phone call between a pair of people. The real benefit of studies based on the mobile phone CDRs is that these have allowed making in vivo or in situ observations on large societal level populations over a wide range of spatial and temporal scales. Nevertheless, the mobile phone CDR based studies should be considered complementary to the questionnaire based survey studies. In this review, we provide an overview of the work that includes the characterization and modelling of social dynamics at the level of individuals as well as the aggregate levels observed at different scales.
A number of studies based on big data have already been conducted from different perspectives including physics, communication engineering, transportation engineering, epidemiology, and sociology, to name a few. In addition to data from mobile phone calls, extensive research has been carried out, on datasets from social media that include Facebook [Citation18–Citation20], Twitter [Citation21–Citation23], and Wikipedia [Citation24]. In this wide sense the current review is not an exhaustive one, and it is aligned to the approach of Social Physics as applied on mobile phone data. In particular, we lay emphasis on the contributions from physicists focussing on framing of laws from observed statistical regularities, agent based modelling and properties of social networks derived from CDRs. Also, the approaches that we could include in this review are general enough in terms of applicability to studying and analysing different types of social media datasets. We will here review a set of selected topics, namely human sociality (Section II), human burstiness in time series of human communication (Section III), human mobility patters (Section IV), and the human daily and seasonal rhythms (Section V). Readers wanting to learn more about related works as well as various other related topics may explore existing reviews, for example [Citation25–Citation27].
II. Human sociality
The study of human sociality from telecommunication data has over time developed into a unique field of research that provides insight into the micro-, meso- and macroscopic structure and dynamics of social networks of large-scale societal level populations. The paradigm is held in contrast to the method of surveys [Citation28] for collecting data on human interactions [Citation15,Citation29]. While, at the macroscopic level, the studies have primarily investigated the structural aspects of the social networks derived from the calling information aggregated over time windows [Citation30–Citation32], at the microscopic level the focus has been on ‘egocentric networks’ to study the dynamics of closest relationships between egos (the individuals in focus) and their alters (the contacts of an individual) [Citation33–Citation36]. At the intermediate or mesoscopic level, social groups or communities and network motifs have been the objects of study [Citation37–Citation41].
A mobile phone CDR dataset comprises of call logs of egos or individuals with each log containing information of the timings of incoming and outgoing calls and of text messages i.e. SMSs. For calls, usually the information on the duration of the call is also included. The CDRs used for the purpose of research are anonymized, and the egos are distinguished by attributed surrogate keys. For a given ego and for a given communication event (a call or SMS) the corresponding alter key also appears in the log. The data acquired from mobile phone service providers may contain ancillary information on self-reported age, gender and residential postcode of the users. Using CDRs the social network is constructed by aggregating information within a time window (see ). For the studies in which volunteers are recruited, the investigators usually avail multiple modes of data collection. Apart from call logs, additional data could be collected from pre-installed software as well as from various sensor signals [Citation15,Citation16,Citation42,Citation43]. For example, the Bluetooth data from a volunteer collected at a certain instant could also indicate the presence of other Bluetooth devices, and hence other volunteers in the proximity [Citation44]. The studies of the latter kind usually also collect information from the participants in the form of questionnaires [Citation36]. Data obtained from multiple sources provide additional advantages of validating the results and dealing with the problems of missing data.
Figure 1. A part of a network constructed from mobile phone call data. Blue circles correspond to male and red circles to female subscribers. The numbers inside a circle (and also its size) indicates the age of the subscriber. Grey circles correspond to subscribers whose gender and age information is not available in the dataset. The numbers on a link (as well as its width) indicates the total number of calls between the connected pair of individuals over a period of seven months. This figure is adopted from [Citation35] and it is licensed under a Creative Commons Attribution-NonCommercial-ShareAlike 3.0 Unported License https://creativecommons.org/licenses/by-nc-sa/3.0/.
![Figure 1. A part of a network constructed from mobile phone call data. Blue circles correspond to male and red circles to female subscribers. The numbers inside a circle (and also its size) indicates the age of the subscriber. Grey circles correspond to subscribers whose gender and age information is not available in the dataset. The numbers on a link (as well as its width) indicates the total number of calls between the connected pair of individuals over a period of seven months. This figure is adopted from [Citation35] and it is licensed under a Creative Commons Attribution-NonCommercial-ShareAlike 3.0 Unported License https://creativecommons.org/licenses/by-nc-sa/3.0/.](/cms/asset/18ebb39c-8b30-47bc-879e-050ef342911d/tapx_a_1527723_f0001_oc.jpg)
A. Macroscale and mesoscale patterns
The first of its kind ‘Reality Mining’ experiment was conducted at the MIT with 100 volunteers who were either studying or working at the institute and were allotted Nokia 6600 mobile phones [Citation15]. Using data on Bluetooth based proximity, the investigators could predict the type of relationship, namely, friend or office acquaintance with a high enough accuracy. A contrasting study investigated the large scale structures of human social networks using CDRs of millions of subscribers with billions of calls from a mobile phone service provider that had about of the market share in a European country [Citation32]. In the network, two individuals were connected by a link if there had been a minimum of one reciprocated pair of phone calls between them over a period of 18 weeks. This was called a ‘mutual network’ that would act as a proxy of a social network, and the construction method was expected to eliminate a large number of one-way calls where the caller did not personally know the callee [Citation31]. Also, the weights of the links were attributed using the total calling duration between the ego-alter pairs. The final network that was analysed had about 4.6 million nodes and 7 million links. A major finding of the study [Citation32] was the confirmation of the strength of weak ties hypothesis [Citation45], according to which the weights of the links and the network topology were found to be correlated such that the intra-community links are stronger compared to the inter-community links. Also, by examining the percolation transition [Citation46] of the giant component containing
of the nodes, the study showed the importance of weak ties in maintaining the overall connectivity of the network. A similar investigation was carried out using CDRs of mobile phone subscribers in Belgium [Citation30]. The mutualized network had 2.5 million nodes and 5.4 million links. Besides characterizing the topology of the network, the study also showed the influence of language on the structure of the network (Belgium has native French and Flemish as well as bilingual speakers).
The Belgian dataset was also used to investigate the community structure with a modularity optimization method, and the results showed that most communities are monolingual [Citation47]. Similarly, a study [Citation41] applied different community detection algorithms [Citation48] to the dataset used in [Citation32] to illustrate the Granovetterian ‘weak ties hypothesis’ from correlations between the link weights and community structure. The same dataset was also used to study the evolution of community structure in time [Citation39]. Using networks derived from mobile phone calls and from co-authorship information in the Cornell University cond-mat eprint archive, the study showed the differences between the dynamics of small and large groups.
The Granovetterian hypothesis was also illustrated in the context temporal networks by carrying out census on temporal motifs in mobile phone data [Citation38] (see also [Citation37]). A more recent study of meso-scale patterns using the Copenhagen Network Study (CNS) dataset proposed a general framework for analysis of evolving social networks [Citation40]. The dataset involving around 1000 freshman University students, contained information on calls, SMSs, proximity via Bluetooth, geo-location, and social media contacts in addition to general demographic information. The method involved identifying stable cores in dynamic networks, representing meetings between individuals having different social contexts like work and recreation. It was also suggested that the concept of cores is better suited to the description of social groups in time varying networks as compared to the other community detection algorithms.
As one of the first examples of an approach towards modelling meso- and macroscopic structures of a human mobile communication type social network, we describe the following model (see [Citation49]). This model describes the processes for individuals getting acquainted with each other leading in turn to the formation of locally and globally complex weighted social network structures. In the model, one considers a network with a fixed number of nodes (or individuals) where the time evolution of the structure proceeds with the following three rules. (i) The cyclic closure or local attachment rule: In a time interval
each node or individual having at least one neighbour starts a weighted local search for new friends, see ). The node
chooses one of its neighbouring node
with probability
, where
represents the weight of the link connecting
with
and
is the strength of node
. If the chosen node
has other neighbours
(apart from
), it chooses one of them with probability
implying that the search favours strong links. If there is no connection between
and
, it will be established with probability
such that
. If the link exists, then its weight will be increased by a certain amount
. In addition, both
and
are increased by
. This kind of cyclic linking simulates the mechanism where ‘friend of a friend will also be friend’. The focal closure or global attachment rule is as follows: If a node has no links, it will create a link of weight
with probability
to a random node, as depicted in ). This mechanism is to establish a new link outside the immediate neighbourhood of the chosen node. (iii) The node deletion rule: With probability
an existing node with all its links are removed from the system, and new node is introduced to maintain fixed system size. The parameter
is responsible for the time-dependent development of the weights of the network. When
, one obtains unweighted networks without apparent community structure. With the increase in
, emerging triangles become the nuclei for community formation. Networks simulated for different values of
are shown in (
,
,
, and
). For larger
values one sees the formation of a community structure very similar to that observed in the studies of the mobile phone dataset [Citation31,Citation32].
Figure 2. Schematic diagram of the model by [Citation49]. (a): In a time interval , a weighted local search starts from i and proceeds to j and then to k, which is a also a neighbour of i. (b): the local search from
ends to
, which is not a neighbour of
. In this case link
is set with probability
. (c): node
creates a link randomly to a random node
with probability
. In the cases of (a) and (b) the involved links weights are increased by
. This figure is adopted from [Citation49] and it is licensed under a APS Reuse and Permissions License.
![Figure 2. Schematic diagram of the model by [Citation49]. (a): In a time interval Δt, a weighted local search starts from i and proceeds to j and then to k, which is a also a neighbour of i. (b): the local search from i ends to k′, which is not a neighbour of i. In this case link wik′ is set with probability pΔΔt. (c): node i creates a link randomly to a random node l with probability prΔt. In the cases of (a) and (b) the involved links weights are increased by δ. This figure is adopted from [Citation49] and it is licensed under a APS Reuse and Permissions License.](/cms/asset/e71c3113-81f4-4407-9fa4-2f20f8e45043/tapx_a_1527723_f0002_oc.jpg)
Figure 3. Simulated networks in the model by [Citation49], with (a) , (b)
, (c)
, and (d)
. Link colours change from green (weak links) to yellow and red (strong links). With increase in the value of
, community structure starts appearing. This figure is adopted from [Citation49] and it is licensed under a APS Reuse and Permissions License.
![Figure 3. Simulated networks in the model by [Citation49], with (a) δ=0, (b) δ=0.1, (c) δ=0.5, and (d) δ=1. Link colours change from green (weak links) to yellow and red (strong links). With increase in the value of δ, community structure starts appearing. This figure is adopted from [Citation49] and it is licensed under a APS Reuse and Permissions License.](/cms/asset/914e26f5-afb6-4fc1-bf89-9f242dfed011/tapx_a_1527723_f0003_oc.jpg)
B. Egocentric networks
While the investigations at the macroscopic and mesoscopic scales shed light on the aspects of social-like societal structure and the dynamics of group formation, the egocentric networks focus on the structure and dynamics of social ties within the immediate social neighbourhood of an individual. Different research questions can be addressed depending on the nature of data at hand. For a dataset with some () student volunteers being observed over a period of several months, the study of it can demonstrate how for a given ego the alters may change their ranks over time [Citation36]. On the other hand if the dataset comprises of millions of subscribers whose age and gender information is available, their social behaviour can be analysed as a function of these variables, even if the dataset only spans over a month [Citation50].
In the analysis of egocentric networks it is usually assumed that the communication intensity is a marker of ‘emotional closeness’ between an ego and his or her alters [Citation51]. In a study the set of alters were ranked by the total number of calls, and the gender and age of the top ranked alters were investigated as functions of ego’s age [Citation35]. It was observed that, while the primary focus of males of all ages is likely to be on the opposite gender (or spouse), for older females there is a shift from the spouse to younger females, who can be assumed to be the daughters on the basis of the age difference. This observation was found to be in line with the grandmothering hypothesis [Citation52]. A statistical method has also been proposed for ranking the set of alters based on the different relevant quantities such as number of calls, duration of calling, and number of SMSs [Citation53].
A question that has been addressed in a number of studies is how an ego distributes its total time of communication among its alters. A study on a large dataset [Citation34] calculated a measure for disparity and found it to be negatively dependent on the number of alters, suggesting differences in communication strategies between the users who have large numbers of contacts and those who have few. In general, all the users were found to distribute their limited time very unevenly across their contacts. Interestingly, the average communication time per alter, though being positively dependent on the number of alters, appeared to decrease when the number of alters increased beyond 40. It was suggested that this effect was a partial reflection of the social brain hypothesis [Citation54], according to which there is a cognitive limit in the number of social contacts that an individual can maintain, usually termed as the Dunbar number (). Another study with the same dataset characterized the social strategy for communication in a space spanned by the communication capacity and communication activity of individuals [Citation55]. Two kinds of extreme strategies were identified, namely, social keeping in the case of which the individuals keep a very stable focus on selected contacts, and, social exploring when the individuals activate and deactivate social ties at a high rate. In a different study [Citation36], it was shown that even in the presence of a turnover occurring in the egocentric network, the pattern in which an ego allocates its communication across the alters is stable. Also, that this pattern is usually the characteristic of an individual and could be considered as a ‘social signature’ of that person. A recent investigation [Citation56] has explored the connections between the social signatures obtained from mobile phone calling and the individual personality traits of the participants obtained using Big five model surveys [Citation57]. It was observed that extroverts have slightly lower temporal persistence of their social signatures, as compared to introverts.
Several other studies have also investigated the aspect social focus as functions of ego’s age and gender. A study found that, overall, younger individuals have more contacts, and among them, males more than females [Citation33]. In addition, the study observed a steady decrease in the number of contacts with different rates for males and females, such that there is a reversal in the number of contacts around the age of late 30s. This pattern was attributed to the difference in reproductive investments made by the two genders. The study also analysed the gender-based inequality or disparity in social investment patterns by measuring the Gini coefficient and found the women and older people to have slightly larger values. Related studies have characterized different types of social ties (friendship, spousal, kinship) based on age and gender information of the alter in conjunction with the ego [Citation58,Citation59]. The studies demonstrated how communication patterns are consistent with the idea that, in general, individuals have the tendency to rearrange their social lives as they grow older.
Maintenance of social relationships, in particular, friendships is another important topic in the context of egocentric networks. The effect of such maintenance behaviour on communication has been shown by examining the dependence of call durations on inter-call gaps (inter-event times) for pairs of individuals who regularly call each other [Citation60]. The study found a logarithmic increase in call duration (, measured in seconds) with an increase in the inter-call gap (
, measured in number of days):
. It was suggested that the increase in the duration of the succeeding call after a long gap (time gap with the previous call) could serve as an act of relationship repair. In a sense this finding can also be considered as reflecting the maintenance of the strength of Granovetterian links. The study also examined the effect with the set of alters categorized into different subsets, as shown in . Another study showed the persistence of ties in terms of a prediction model based on the intensity, intimacy, structural and temporal features of social interaction between pairs of individuals [Citation61]. These features included variables, like the total number of calls, age difference, topological overlap [Citation32], reciprocity [Citation62], and coefficient of variation in inter-call gap. The analysis showed that temporal features are effective and efficient predictors, and that bursty communication is correlated with decay of ties (see Section III). In a slightly different context, the problem of social tie prediction for egocentric networks has been investigated [Citation63]. The study proposed a machine learning scheme using a mixture of supervised and unsupervised methods that, for a given ego, would predict the presence or absence of a link between a pair of its alters.
Figure 4. Quantifying the dependence of the duration of the succeeding call (, measured in seconds) on the inter-call gap (
, measured in number of days) for pairs of regularly communicating individuals. The coefficients resulting from the regression:
, are shown.
is the coefficient when both the duration and the gap are scaled by their respective averages. A broad distinction into four groups (as indicated on the top of the columns) is done based on whether for a given pair the distance between their locations is less or greater than 30 km (i.e. geographically ‘close’ or ‘distant’, respectively) which being the spatial extension of large cities; and whether average gap,
is less or greater than 12 days (i.e. communication is ‘frequent’ or ‘infrequent’) which being the most probable inter-call gap. A finer classification is made based on the gender of the individuals as indicated along the horizontal axis (FF: female-female, MM: male-male, FM: mixed). Pairs are chosen irrespective of their age. The dashed line is a guide to the eye. This figure is adopted from [Citation60] and it is licensed under a Creative Commons Attribution 4.0 International License (http://creativecommons.org/licenses/by/4.0/).
![Figure 4. Quantifying the dependence of the duration of the succeeding call (T, measured in seconds) on the inter-call gap (τ, measured in number of days) for pairs of regularly communicating individuals. The coefficients resulting from the regression: T=βlogτ+α, are shown. β′ is the coefficient when both the duration and the gap are scaled by their respective averages. A broad distinction into four groups (as indicated on the top of the columns) is done based on whether for a given pair the distance between their locations is less or greater than 30 km (i.e. geographically ‘close’ or ‘distant’, respectively) which being the spatial extension of large cities; and whether average gap, ⟨τ⟩ is less or greater than 12 days (i.e. communication is ‘frequent’ or ‘infrequent’) which being the most probable inter-call gap. A finer classification is made based on the gender of the individuals as indicated along the horizontal axis (FF: female-female, MM: male-male, FM: mixed). Pairs are chosen irrespective of their age. The dashed line is a guide to the eye. This figure is adopted from [Citation60] and it is licensed under a Creative Commons Attribution 4.0 International License (http://creativecommons.org/licenses/by/4.0/).](/cms/asset/1ac2a6b3-7af7-43fe-94c7-f2effae3cb93/tapx_a_1527723_f0004_oc.jpg)
III. Burstiness in the time series of human communication
Having looked at patterns observed at the level of information aggregated from calls, we now focus on the topic of ‘burstiness’ that becomes relevant when the times series of the calling activity of the service subscribers are investigated. The dynamics of a system is typically termed as bursty when there are short periods of heightened activity followed by longer periods of inactivity [Citation64–Citation66]. This type of dynamics has been observed in various kinds of natural and man-made systems where the dynamics can be characterized in terms of a time series. Some examples of them are earthquakes [Citation67], neuronal firing [Citation68], biological evolution [Citation69], email patterns [Citation70], and mobile phone calls [Citation71]. Systems displaying bursty dynamics are typically differentiated from systems displaying Poisson processes [Citation72]. The inter-event times () are calculated as,
, where
and
are the timings of consecutive events. In a Poisson process the rate at which events occur is a constant that is independent of time, and the resulting probability distribution of inter-event times (
) is an exponential. Burstiness in time series is found to result due to the departure of the distribution of inter-event time from being an exponential, as well due to the presence of correlations between inter-event times (see )). The time series found in nature and society where burstiness is observed is usually found to be a power-law with an exponential cut-off:
, where
, and
is a time scale originating from the finiteness of the time series [Citation73]. Other commonly used measures to characterize the heterogeneity and correlations in the inter-event times include the burstiness parameter and the memory coefficient [Citation65].
Figure 5. Spatio-temporal patterns studied from data collected from subjects in Finland in the Otasizzle project for a period spanning 16 months [Citation42,Citation76]. There were around 180 subjects, who were either students or staff members of the Aalto University, Finland, and were using Nokia Symbian smartphones with pre-installed software. (a) Probability distribution of inter-event times () for web domain visits by all users. The peaks in the original distribution occur due to automatic events by the browser. (b) Positional stamps of mobile phone communication of the subjects at cell towers located around Finland. The stamps got recorded every half an hour, or whenever a phone got connected to a new cell tower. Each cell tower could be located with a unique pair of latitude and longitude degrees. The higher the frequency of usage, the warmer the colour. The spatial trajectory of an individual user could be determined by following the sequence of the towers used. (c) Locations and service usage patterns of a sample user during typical Friday and Saturday. The first and second rows represent cells and contexts assigned to cells like home, office, other meaningful place, and elsewhere. Service usage events are denoted by vertical lines in the rows of web, app, email, call and SMS (from the third row to the bottom). This figure is a combination of figures from [76] and is under a Creative Commons Attribution License (http://creativecommons.org/licenses/by/2.0).
![Figure 5. Spatio-temporal patterns studied from data collected from subjects in Finland in the Otasizzle project for a period spanning 16 months [Citation42,Citation76]. There were around 180 subjects, who were either students or staff members of the Aalto University, Finland, and were using Nokia Symbian smartphones with pre-installed software. (a) Probability distribution of inter-event times (P(τ)) for web domain visits by all users. The peaks in the original distribution occur due to automatic events by the browser. (b) Positional stamps of mobile phone communication of the subjects at cell towers located around Finland. The stamps got recorded every half an hour, or whenever a phone got connected to a new cell tower. Each cell tower could be located with a unique pair of latitude and longitude degrees. The higher the frequency of usage, the warmer the colour. The spatial trajectory of an individual user could be determined by following the sequence of the towers used. (c) Locations and service usage patterns of a sample user during typical Friday and Saturday. The first and second rows represent cells and contexts assigned to cells like home, office, other meaningful place, and elsewhere. Service usage events are denoted by vertical lines in the rows of web, app, email, call and SMS (from the third row to the bottom). This figure is a combination of figures from [76] and is under a Creative Commons Attribution License (http://creativecommons.org/licenses/by/2.0).](/cms/asset/bab879a0-834c-45e5-8ed3-96e3a15212ca/tapx_a_1527723_f0005_oc.jpg)
For mobile phone-based interactions, the time series are constructed from CDRs of individual users by marking the timings of the events, namely, calls and SMSs. The information on the finite duration of calls is rather discarded, and only the starting time is considered. Also, for calls as well as SMSs the outgoing and incoming events may be separately analysed [Citation74]. A number of empirical results support the power-law form for , where the exponent
is generally found to depend on whether it is from calls or from SMSs. For example, investigation on data from a European operator showed that
for calls and
for SMSs [Citation73]. Another study on a different European dataset found
to be
and
for calls and SMSs, respectively [Citation74]. In contrast, a study on a Chinese dataset found that although the aggregate
follows a power-law, a majority of individual users show Weibull distributions for inter-event times [Citation75]. For individuals with power-law the values of
varied from
to
. It was observed that anomalous and extreme calling patterns were associated with power-laws, which could link the users to robot-based calls, telecom frauds or telephone sales.
In general, heavy-tailed has been observed in several different studies with calls and SMSs [Citation77–Citation79]. Interestingly, bimodal distribution of inter-event times has also been observed in SMS datasets [Citation80] such that the distributions are power-law for
, and exponential for
. The study also reproduced the observations using a model of interacting queues for individuals, and showed that the time scale
could be related to a parameter called ‘processing time’ in the model.
Motivated by the observations from mobile call and SMS data, and communication data in general, there have been several attempts to reproduce the features related to burstiness using agent based models. Karsai et al. [Citation66] proposed a broad categorization of the models: (a) models of individual activity [Citation81–Citation84], (b) models of link activity [Citation80,Citation85], and (c) network models of bursty agents [Citation86–Citation88]. Apart from the above type of models, there have been investigations of dynamical processes using dynamical substrates or temporal networks such as a mobile phone call network that has burstiness inherent to its structure [Citation89]. Processes that have been studied include epidemic spreading [Citation90,Citation91], random walks [Citation92] and threshold-driven contagion models [Citation93,Citation94].
Here we briefly describe a model [Citation87] that is similar to the model of community formation by Kumpula et al. [Citation49] with the cyclic and focal closure mechanisms for network formation (see Section II), and incorporates the concept of queues. In this model, agents are each allotted a list containing tasks of two types,
and
. The priorities of each task is randomly chosen from a uniform distribution. At each time step
, every node selects the task with the highest priority. If it is an
-task, the actual node
selects a target node for interaction either (i) from the whole population with probability
, or (ii) from its next nearest neighbours with probability
, or (iii) from its neighbours with probability
weighted by their link weight
. The next nearest neighbour
of the node
is defined as a node that satisfies
with an intermediate node
, implying that
and
interacted at time
, and
and
interacted at time
. In the first two cases, (i) and (ii), links with unit weights are created between the interacting nodes. In case of (iii) the process is reinforcement in terms of an increment of existing weights. After an interaction the priority of
-task of node
is updated. In addition, at each time step each node can forget all of its existing connections with a probability
, that is having a memory loss, to become isolated. By measuring the inter-event times between two consecutive
-tasks of a given node the system exhibits a broad inter-event time distribution with an exponential cut-off. In addition, the emerging network structure shows several realistic features similar to the model by Kumpula et al.
IV. Human mobility patterns
The idea of random motion of material particles while interacting with complex environments has long interested physicists [Citation95,Citation96]. With access to imaging technologies and other data logging methods a whole research area has emerged for studying the movement patters of organisms from microbial scales to the scales of primates and other mammalian species [Citation97,Citation98]. A question underlying such the paths of individual entities that can decide for themselves. A popular candidate has been the Lévy flight process in which the distribution of move lengths follows an inverse power-law [Citation99]. Addressing similar questions in the case of humans have been possible with the advent of mobile phones that have facilitated to infer the trajectories of users. For billing purposes the service providers usually record the cell tower that is involved in routing a call. Therefore, when a user initiates or receives a call the location of the associated tower is known in terms of latitude and longitude (see where the data from the Otasizzle project is visualized). In certain studies, data from GPS and WiFi routers have allowed the recording of trajectories with finer resolution, for example the researchers in the CNS [Citation100] achieved a median spatial resolution of 20 meters by sampling every 15 minutes. Large-scale studies based of such spatio-temporal data have provided insights into the mobility patterns of humans. The investigations have addressed diverse topics ranging from the statistical properties of trajectories to predictive models and to characterization of urban landscapes.
The Lévy flights hypothesis for human trajectories was first tested using two different datasets, the larger of which comprised of 100,000 individuals [Citation101]. It was observed that with each user a characteristic ‘radius of gyration’ could be associated, which served as a bound on individual trajectories. Travel patterns of a users could be described by Lévy flights for walk lengths below a radius of gyration, and extremely large displacements that would be predicted by a Lévy flights hypothesis were rather absent. In general, human trajectories appeared to be highly regular and could be characterized by few highly frequented locations like home and workplace. Also, as a result of a heavy tailed distribution of radius of gyration within the population, the aggregated distribution of the move length of all users would still be a power-law. These ideas were followed up in a later work [Citation102] that provided a microscopic model laying stress on the aspects of exploration of space and propensity to return to already visited locations. A different study describing the spatio-temporal trajectories of 90,000 users in a countrywide dataset in terms of a weighted and directed network concluded that the daily trajectory of most of the users were dominated by 5–20 frequently visited locations or ‘habitats’ [Citation103]. The general idea of spatio-temporal motifs in the daily patterns of commuting individuals has also been investigated and modelled [Citation79,Citation104]. A study showed that the number of locations an individual visits regularly is conserved over time [Citation105]. The conserved number could be an outcome of the limited capacity of human cognition similar to the Dunbar number [Citation54]. An exploratory analysis of a dataset from Portugal showed how the locations of home and office can indeed be ascertained [Citation106]. The study further used these locations to estimate the number of commuting trips () between two counties
and
, and modelled this quantity by using a gravity law.
The gravity law having a form similar to Newton’s law of attraction states that, , where,
is a measure of social interaction between
and
, with
and
being the populations of
and
, respectively, and
is the distance between the geographical centres of the counties [Citation107–Citation110]. The parameters
,
and
are usually estimated from the data. Studies considering
as the aggregated intensity of mobile phone communication have yielded different values of the parameters depending on the geographical origin of the dataset [Citation30,Citation111,Citation112]. As a development over the gravity model, a ‘radiation model’ has been proposed for the mobility and migration between places in the framework of emission and absorption of particles from sources and targets [Citation113]. To evaluate the flux between an origin county (source) and a destination county (target), the model considers all counties lying at intermediate distances from the origin as potential targets. Apart from modelling commuting fluxes, the framework could be applied to model volume of phone calls. A more recent model has taken into account the systematic decrease of communication flux induced by regional borders within countries [Citation114]. The model being based on the concept of a hierarchical distance (replacing continuum geographical distance), was applied to study the spatial organization of population within countries using calling data from multiple countries. Interestingly, spatial organization of population within cities could also be studied using mobile phone data [Citation115]. The data from CDRs when aggregated can provide the number of unique individuals using a given cell tower for each hour of the day. By studying a time dependent quantity which is the separation between the tower positions weighted by the density of users, cities could be classified as monocentric or polycentric.
Predictability and benchmarking of mobility patterns of individuals has been another important track. In this respect, the concept of Shannon entropy has been a powerful tool. The Reality Mining study [Citation15] suggested that people whose patterns yield low entropies should be easier to predict, and vice versa. In a seminal work, Song et al. [Citation116] utilized three expressions based on entropy to test the extent to which human mobility could be predicted. For example, an individual visiting locations could be characterized by a temporal-uncorrelated entropy,
, where
is the probability that a location
is visited by the individual (see [Citation117] for applicability in other contexts). Additionally, they used a random, and a correlated entropy that took into account the order in which the locations were visited. Using these entropy expressions the Song et al. employed Fano’s inequality [Citation118] to estimate the upper bound of predictability that algorithms can achieve. The findings revealed that irrespective of the background of the individuals investigated, there was a high degree of regularity in the trajectories, with the average of the maximum predictability having a value around 93%. Using this framework with the data from mobile phone users who were displaced following an earthquake in Haiti, a study showed that predictability as constructed from historical records of the individuals was quite high [Citation119]. The knowledge about the possible future locations of people displaced by natural disasters could indeed be useful in planning and dispensing of relief.
Correlations between social ties and mobility have been explored as well. Data from three cities in two industrialized countries were used to construct location vectors of individuals by counting visits to different locations in a city (number of entries in the vector) [Citation120]. The cosine similarities obtained from vectors of pairs of communicating individuals showed that the mobility pattern of an individual is similar to the latter’s social contacts. Moreover, the stronger the social tie as evidenced from communication, the more was the similarity in mobility. In another study [Citation121], concepts of scaling and universality were applied to obtain a scaling relationship between mobility and communication. The study was able to connect the exponents of the two empirically observed power-laws characterizing the distributions of aggregated move lengths and geodesic distances (as well as density-dependent distances) between the communicating pairs. To establish the relation, a mediating scaling relationship was shown to exist between fluxes of mobility (number of trips) and fluxes of communication (number of calls) between two locations.
More recently, the CNS dataset [Citation122] has been used to show that mobility as well as other types of behaviour of individuals can be predicted with high precision based on patterns obtained at the population level. The conclusions are based on a logistic regression model using information on calls, SMS, proximity via Bluetooth and mobility from GPS. Also, it has been shown that the problem of predicting a visit to an already visited location is altogether different from predicting exploration of newer locations [Citation100]. In addition, the latter study discussed the effect of spatial and temporal resolutions on the predictive power. A recent study has also addressed the related issue of sampling [Citation123]. A one-dimensional model of alternating moves and rests, with sampling at regular intervals, was used to show analytically that the fraction of correctly sampled moves can be 51% at maximum. The model was also applied to empirical datasets to show that the fraction decreases even further.
V. Daily and seasonal rhythms
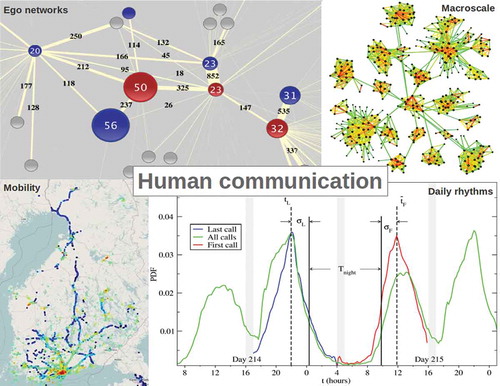
In Section III we focused on the temporal heterogeneity in people’s social patters. Here we discuss the periodic nature of the temporal signals obtained from the CDRs of individuals [Citation124]. Remarkably, by precisely examining the daily, weekly and seasonal patterns, it is possible to gather insights into the different factors influencing human behaviour and health [Citation125]. This is demonstrated very clearly in the where the daily pattern for outgoing calls in a city is shown, from which a characteristic time duration can be calculated that provides an upper bound for the sleeping time of the population [Citation126].
Figure 6. Probability distribution functions (PDF) of finding an outgoing call at a time of the day in a city, for a pair of consecutive days in a given year. (Green) Distribution when all calls are included. (Red) Distribution when only the last call (L) at night is included (between 5:00 pm and 4:00 am next day). (Blue) Distribution when only the first call (F) of the day is included (between 5:00 am and 4:00 pm). The respective mean times,
and
, and the standard deviations
and
are calculated. A period of low calling activity is defined as the region bounded by
and
, and its width
is calculated as the time interval between
and
. Interestingly, the onset and length of
change along the seasons, in middle of February (day 46)
is around
hours, whilst in the early August (day 214) it is
hours. This figure is adopted from [Citation126] and it is licensed under a Creative Commons Attribution 4.0 International License (http://creativecommons.org/ licenses/by/4.0/).
![Figure 6. Probability distribution functions (PDF) of finding an outgoing call at a time t of the day in a city, for a pair of consecutive days in a given year. (Green) Distribution when all calls are included. (Red) Distribution when only the last call (L) at night is included (between 5:00 pm and 4:00 am next day). (Blue) Distribution when only the first call (F) of the day is included (between 5:00 am and 4:00 pm). The respective mean times, tˉL and tˉF, and the standard deviations σL and σF are calculated. A period of low calling activity is defined as the region bounded by tˉL and tˉF, and its width Tnight is calculated as the time interval between tˉL+σL and tˉF−σF. Interestingly, the onset and length of Tnight change along the seasons, in middle of February (day 46) Tnight is around 10.5 hours, whilst in the early August (day 214) it is 9.5 hours. This figure is adopted from [Citation126] and it is licensed under a Creative Commons Attribution 4.0 International License (http://creativecommons.org/ licenses/by/4.0/).](/cms/asset/190d181e-8945-421a-96b0-5cd4eca86e5a/tapx_a_1527723_f0006_oc.jpg)
Traditionally, the field of chronobiology had been involved in the science of circadian rhythms – a roughly 24-hour cycle that is found in the biological processes of living organisms [Citation127,Citation128]. Notably, the Nobel Prize in Physiology or Medicine of 2017 was awarded for the discovery of molecular mechanisms behind these rhythms [Citation129]. For humans, a circadian cycle encompass oscillations in different physiological processes, like blood pressure and body temperature, along with the alternating phases of sleep and wakefulness. It is known that the ‘clocks’ that are internal to body, and are responsible for maintaining the rhythm are synchronized or entrained to various external factors of which the day-night cycle is likely the most well-understood one. Other factors like social interactions and environmental conditions are also known to be important [Citation130,Citation131]. The major goals for understanding the circadian rhythm and sleep or overall daily resting behaviour include characterizing populations with respect to physiological factors like gender and age, and at the same time constructing benchmarks for monitoring the health of individuals. The study on human subjects is usually conducted through questionnaires and wearable sensors [Citation132,Citation133]. In this regard, the daily records of usage of mobile and smart phones appears to provide a complimentary, unobtrusive and viable alternative [Citation125,Citation134].
In the studies on sleep-wake cycles individuals are usually classified as morning-type and evening-type, based on the tendency to wake up early and the tendency to sleep late, respectively [Citation135]. It is also known that due to busy work schedules evening-type individuals sleep less on weekdays [Citation136]. As a compensatory effect the duration of sleep for these individuals gets stretched on weekends. A study using the smartphone screen on-off sensor data from 9 volunteers collected over a period of 97 days, demonstrated this effect by quantifying ‘sleep-debt’ [Citation137]. The screen on-off was considered as an indicator of activity of the users. There have been other investigations of sleep, circadian rhythm, and mental health in general, based on smartphone data not restricted to screen on-off times but also including data from other sensors like accelerometer, microphone and GPS [Citation138–Citation142].
Using an 18-month longitudinal dataset, the investigation of circadian patterns in the percentage of calls as a function of the time of the day showed the persistence of the individual patterns [Citation143]. The screen on-off data from 400 participants in the CNS has been used to propose a Bayesian model for estimating individual sleep durations [Citation144]. The data from CDRs of 900,000 users based in 36 different cities located within the latitudes of 36N and 44
N have been used to study the influence of seasonality and geography on the sleep and the daily resting patterns in general [Citation145]. The inactivity observed in daily mobile phone usage was considered as the indication of human resting. The study showed that the daylight controls human sleeping periods during the night time and the seasonal variation of sleep is dependent on the latitude. Also, the afternoon resting of humans was found to be influenced by temperature, and a compensatory effect was found to exist between the nightly resting and the resting in the afternoon (see ). In a related study on the same population, the possible age and gender dependencies of sleeping were investigated [Citation126]. A ‘data collapse’ of distributions of the calling activity of cities located at different longitudes revealed that the activity of people in urban environments of a country in one time zone follows closely the east-west progression of the sun throughout the year.
Figure 7. Periods of low calling activity or resting periods as measured from intra-day distributions of calls (): (afternoon) and
(night) for 12 different cities for 3 different days of the week (Tuesdays, Saturdays and Sundays in the left, central, and right column, respectively) in a given year. Four cities are located in one of the three different latitudinal bands centred at:
N (top);
N (middle) and
N (bottom). For cities lying around
N, the colour line associated with their times series are blue, magenta, turquoise and maroon; for cities at
N, the colours are red, orange, brown and yellow; and for cities around
N the colours are green, dark green, indigo and grey. Inside each one of the nine plots, the annual behaviour of
(lower lines) and
(upper lines) are shown, for the four different cities located at each band. On every plot,
and
show an opposite seasonal variations, with dynamics that appear to counterbalance each other, particularly on Sundays. This figure is adopted from [Citation145] and it is licensed under a Creative Commons Attribution 4.0 International License (http://creativecommons.org/ licenses/by/4.0/).
![Figure 7. Periods of low calling activity or resting periods as measured from intra-day distributions of calls (Figure 6): Tbreak (afternoon) and Tnight (night) for 12 different cities for 3 different days of the week (Tuesdays, Saturdays and Sundays in the left, central, and right column, respectively) in a given year. Four cities are located in one of the three different latitudinal bands centred at: 37∘N (top); 40∘N (middle) and 42.5∘N (bottom). For cities lying around 37∘N, the colour line associated with their times series are blue, magenta, turquoise and maroon; for cities at 40∘N, the colours are red, orange, brown and yellow; and for cities around 42.5∘N the colours are green, dark green, indigo and grey. Inside each one of the nine plots, the annual behaviour of Tbreak (lower lines) and Tnight (upper lines) are shown, for the four different cities located at each band. On every plot, Tbreak and Tnight show an opposite seasonal variations, with dynamics that appear to counterbalance each other, particularly on Sundays. This figure is adopted from [Citation145] and it is licensed under a Creative Commons Attribution 4.0 International License (http://creativecommons.org/ licenses/by/4.0/).](/cms/asset/05964684-c738-442c-9fa2-bb3aebd6b3ea/tapx_a_1527723_f0007_oc.jpg)
We would like to briefly comment on a related area of work that utilizes smartphone applications in sensing of the mental health of individuals. The StudentLife study [Citation43] obtained continuous sensing data from the smartphones of 48 student participants for a period of 10 weeks at the Dartmouth College, UT Austin. Behavioural features like mobility, sleep and type of social conversations (without explicitly analysing the contents) were extracted from the sensor data. In parallel questionnaire studies were also conducted. Finally, correlations were measured between the sensor data, psychological condition, and academic performance (i.e. grades) of the students. A similar study has tried to predict the reported levels of stress perceived by the participants in terms of their call related features, Bluetooth data, weather conditions and personality traits [Citation146]. There have been studies on related issues focussing on day-to-day mood [Citation147], depression [Citation148], specific mental disorders [Citation149], academic performance [Citation150], and positioning in the social network [Citation151]. This is a rapidly developing field [Citation152] in its inception phase with the current focus on infrastructure development [Citation153,Citation154].
VI. Conclusions and future directions
What we have tried to achieve in this review is the exposition of the approach and methodology of Social Physics to study mobile phone based communication datasets. With this we hope to have demonstrated that Social Physics can give us quite an unprecedented insight into the structure, function and behaviour of social systems and networks of people at different structural and dynamical scales, and this with the help of the data-driven methodologies of data analysis for making observations or discoveries, modelling for describing dynamical processes or plausible mechanisms governing the human sociality and their social networks, and simulation for predicting the behaviour of the social system.
So far our research quest has concentrated on gaining understanding of human sociality with direct observations and analysis of data from social systems. In order to learn more and get deeper insight into the observed regularities as indication of some kind of governing principles or laws, there is need to reach out and consider whether other complex systems show behavioural similarities, patterns, and universalities rather than differences, variation and specifics. According to Ball [Citation155] the former viewpoint is akin to physics while the latter is akin to biology. In the studies of complex systems both viewpoints are of course needed as these complement each other and could give us a more solid basis to develop better computational models to be used in simulating or predicting the behaviour of social systems more realistically.
The advent and adoption of newer channels of communication [Citation156], is bound to change the distribution of the usage of different communication modalities, especially among younger generations. Whereas most of the CDR datasets discussed here include data from under 1 million to 20 million mobile phones, the data getting collected currently across Internet of Things originate from tens of billions of smart devices [Citation157]. This, however, widens our scope of human sociality research. Moreover, the approach of leveraging digital information for analysis and modelling of human sociality, embedded in social networks of different scales, is expected to get further developed and refined, for example, by the inclusion of tools like machine learning [Citation158] which has found a place in the area of condensed matter physics [Citation159]. Besides serving as sources of rich datasets, mobile phone networks and other social media platforms have as well motivated the development of more generalized frameworks for the analysis of large-scale socio-technical systems [Citation18,Citation89,Citation160].
Human sociality in the contemporary world is no more separable from the existing structures of Internet-driven social technologies. Understanding the structure and dynamics of information exchange in these systems has become pivotal to understanding the functioning of the society, from the perspective of scientists as well as policy makers. There has been serious concern about the rise of adversarial and manipulative behaviour as witnessed for example, in the spread of fake news and the use of so called social bots [Citation161,Citation162]. In this respect an interesting avenue of research has opened in the form of human experiments of social phenomena focusing on artificial and online networks, which is in contrast to the idea of passive data collection [Citation163–Citation166]. The development of hybrid experiments with humans teaming up with bots or algorithms to participate in cooperating tasks, appears to be particularly promising [Citation167,Citation168]. Teams performing efficiently in collaborative tasks are known to have shared mental models. Therefore, the need for modelling pro-social bots has indeed widened the scope of modelling humans.
Acknowledgements
KB and KK acknowledge the support from EU HORIZON 2020 FET Open RIA project (IBSEN) No. 662725. KK acknowledges support from the Rutherford Foundation Visiting Fellowship at The Alan Turing Institute, UK, and from the European Community’s H2020 Program under the scheme INFRAIA-1-2014-2015: Research Infrastructures”, Grant agreement No. 654024 SoBigData: Social Mining and Big Data Ecosystem” (http://www.sobigdata.eu).
Disclosure statement
No potential conflict of interest was reported by the authors.
Additional information
Funding
References
- Available at https://www.ibm.com/analytics/hadoop/big-data-analytics.
- The Economist, May 6th 2017 Issue: The world’s Most Valuable Resource – Data and New Rules of Competition.
- M. Buchanan, The Social Atom: Why the Rich Get Richer, Cheaters Get Caught, and Your Neighbor Usually Looks like You, Bloomsbury Publishing USA, New York City, 2008.
- L. Carroll. Sylvie and Bruno Concluded, Macmillan, London.
- A. Pentland, Social Physics: How Social Networks Can Make Us Smarter, Penguin, New York, 2015.
- I. Psylla, P. Sapiezynski, E. Mones and S. Lehmann, PloS one, 12 (2017) p. 96. doi:10.1371/journal.pone.0189873
- P. Ball, Critical Mass: How One Thing Leads to Another, Heinemann, London, UK, 2004.
- T.J. Barnes and M.W. Wilson, Big Data & Society, 1 (2014) p.2053951714535365. doi:10.1177/2053951714535365
- S. Galam, Sociophysics: A Physicist’s Modeling of Psycho-Political Phenomena, Springer Science & Business Media, Berlin, 2012.
- P. Sen and B.K. Chakrabarti, Sociophysics: An Introduction, Oxford University Press, Oxford, 2013.
- D. Stauffer, Physica A Stat. Mech. Appl., 336 (2004) p.1–124. doi:10.1016/j.physa.2004.01.004
- R. Conte, N. Gilbert, G. Bonelli, C. Cioffi-Revilla, G. Deffuant, J. Kertesz, V. Loreto, S. Moat, J.-P. Nadal, A. Sanchez. et al., Eur. Phys. J. Spec. Top., 214 (2012) p.325–346. doi:10.1140/epjst/e2012-01697-8
- M. San Miguel, J.H. Johnson, J. Kertesz, K. Kaski, A. Daz-Guilera, R.S. MacKay, V. Loreto, P. Érdi and D. Helbing, Eur. Phys. J. Spec. Top., 214 (2012) p.245–271. doi:10.1140/epjst/e2012-01694-y
- V. Blondel, N. de Cordes, A. Decuyper, P. Deville, J. Raguenez and Z. Smoreda, Mobile Phone Data for Development: Analysis of Mobile Phone Datasets for the Development of Ivory Coast. In Selected Contributions to the D4D Challenge Sponsored by Orange, MIT, Cambridge, MA, May 1–3, 2013. Available at https://perso.uclouvain.be/vincent.blondel/netmob/2013/D4D-book.pdf. Accessed October 5, 2018.
- N. Eagle and A.S. Pentland, Personal and Ubiquitous Computing, 10 (2006) p.255–268. doi:10.1007/s00779-005-0046-3
- A. Stopczynski, V. Sekara, P. Sapiezynski, A. Cuttone, M.M. Madsen, J.E. Larsen and S. Lehmann, PloS one, 9 (2014) p.e95978. doi:10.1371/journal.pone.0095978
- W.W. Zachary, J. Anthropol. Res., 33 (1977) p.452–473. doi:10.1086/jar.33.4.3629752
- L. Coviello, Y. Sohn, A.D. Kramer, C. Marlow, M. Franceschetti, N.A. Christakis and J.H. Fowler, PloS one, 9 (2014) p.e90315. doi:10.1371/journal.pone.0090315
- M. Del Vicario, G. Vivaldo, A. Bessi, F. Zollo, A. Scala, G. Caldarelli and W. Quattrociocchi, Sci. Rep., 6 (2016) p.37825. doi:10.1038/srep37825
- P.J. Mucha, T. Richardson, K. Macon, M.A. Porter and J.-P. Onnela, Science, 328 (2010) p.876–878. doi:10.1126/science.1183980
- R. Alvarez, D. Garcia, Y. Moreno and F. Schweitzer, EPJ Data Science, 4 (2015) p.6. doi:10.1140/epjds/s13688-015-0042-4
- M. Beguerisse-Daz, G. Garduno-Hernández, B. Vangelov, S.N. Yaliraki and M. Barahona, J. Royal Soc. Interface, 11 (2014) p.20140940. doi:10.1098/rsif.2014.0940
- S.A. Golder and M.W. Macy, Science, 333 (2011) p.1878–1881. doi:10.1126/science.1205623
- T. Yasseri, R. Sumi, A. Rung, A. Kornai and J. Kertész, PloS one, 7 (2012) p.e38869. doi:10.1371/journal.pone.0038869
- V.D. Blondel, A. Decuyper and G. Krings, EPJ Data Science, 4 (2015) p.1–55. doi:10.1140/epjds/s13688-015-0046-0
- D. Naboulsi, M. Fiore, S. Ribot and R. Stanica, IEEE Commun. Surv. Tutor., 18 (2016) p.124–161. doi:10.1109/COMST.2015.2491361
- J. Saramäki and E. Moro, Eur. Phys. J. B, 88 (2015) p.1–10. doi:10.1140/epjb/e2015-60106-6
- S. Wasserman and K. Faust, Social Network Analysis: Methods and Applications, Vol. 8, Cambridge University Press, Cambridge, UK, 1994.
- N. Eagle, A.S. Pentland and D. Lazer, Proc. Natl. Acad. Sci. USA, 106 (2009) p.15274–15278. doi:10.1073/pnas.0900282106
- R. Lambiotte, V.D. Blondel, C. de Kerchove, E. Huens, C. Prieur, Z. Smoreda and P. Van Dooren, Physica A Stat. Mech. Appl., 387 (2008) p.5317–5325. doi:10.1016/j.physa.2008.05.014
- J.-P. Onnela, J. Saramäki, J. Hyvönen, G. Szabó, M.A. De Menezes, K. Kaski, A.-L. Barabási and J. Kertész, New J. Phys., 9 (2007) p.179. doi:10.1088/1367-2630/9/6/179
- J.-P. Onnela, J. Saramäki, J. Hyvönen, G. Szabó, D. Lazer, K. Kaski, J. Kertész and A.-L. Barabási, Proc. Natl. Acad. Sci., 104 (2007) p.7332–7336. doi:10.1073/pnas.0610245104
- K. Bhattacharya, A. Ghosh, D. Monsivais, R.I. Dunbar and K. Kaski, R. Soc. Open Sci., 3 (2016) p.160097. doi:10.1098/rsos.160097
- G. Miritello, E. Moro, R. Lara, R. Martnez-López, J. Belchamber, S.G. Roberts and R.I. Dunbar, Soc. Networks, 35 (2013) p.89–95. doi:10.1016/j.socnet.2013.01.003
- V. Palchykov, K. Kaski, J. Kertész, A.-L. Barabási and R.I. Dunbar, Sci. Rep., 2 (2012). doi:10.1038/srep00386
- J. Saramäki, E.A. Leicht, E. López, S.G. Roberts, F. Reed-Tsochas and R.I. Dunbar, Proc. Natl. Acad. Sci., 111 (2014) p.942–947. doi:10.1073/pnas.1308540110
- L. Kovanen, M. Karsai, K. Kaski, J. Kertész and J. Saramäki, J. Stat. Mechanics: Theory Exp., 2011 (2011) p.P11005. doi:10.1088/1742-5468/2011/11/P11005
- L. Kovanen, K. Kaski, J. Kertész and J. Saramäki, Proc. Natl. Acad. Sci., 110 (Nov 2013) p.18070–18075. doi:10.1073/pnas.1307941110
- G. Palla, A.-L. Barabási and T. Vicsek, Nature, 446 (2007) p.664. doi:10.1038/nature05670
- V. Sekara, A. Stopczynski and S. Lehmann, Proc. Natl. Acad. Sci. U S A, 113 (2016) p.9977–9982. doi:10.1073/pnas.1602803113
- G. Tibély, L. Kovanen, M. Karsai, K. Kaski, J. Kertész and J. Saramäki, Phys. Rev. E, 83 (2011) p.056125. doi:10.1103/PhysRevE.83.056125
- J. Karikoski and M. Nelimarkka, Measuring social relations: Case otasizzle. In Proceedings of the 2010 IEEE Second International Conference on Social Computing (SocialCom), Minneapolis, Minnesota, USA, August 20–22, 2010, p.257–263..
- R. Wang, F. Chen, Z. Chen, T. Li, G. Harari, S. Tignor, X. Zhou, D. Ben-Zeev and A.T. Campbell. Studentlife: Assessing mental health, academic performance and behavioral trends of college students using smartphones. In Proceedings of the 2014 ACM International Joint Conference on Pervasive and Ubiquitous Computing, ACM, Seattle, WA, USA, September 13–17, 2014, p.3–14.
- T.W. Boonstra, M.E. Larsen, S. Townsend and H. Christensen, PloS one, 12 (2017) p.e0189877. doi:10.1371/journal.pone.0189877
- M.S. Granovetter, Am. J. Sociol., 78 (1973) p.1360–1380. doi:10.1086/225469
- D. Stauffer and A. Aharony, Introduction to Percolation Theory, 2nd Ed., Taylor & Francis, London, 1991.
- V.D. Blondel, J.-L. Guillaume, R. Lambiotte and E. Lefebvre, J. Stat. Mech., 2008 (2008) p.P10008. doi:10.1088/1742-5468/2008/10/P10008
- A. Lancichinetti and S. Fortunato, Phys. Rev. E, 80 (Nov 2009) p.056117. doi:10.1103/PhysRevE.80.056117
- J.M. Kumpula, J.-P. Onnela, J. Saramäki, K. Kaski and J. Kertész, Phys. Rev. Lett., 99 (2007) p.228701. doi:10.1103/PhysRevLett.99.228701
- Y. Dong, Y. Yang, J. Tang, Y. Yang and N.V. Chawla. Inferring user demographics and social strategies in mobile social networks. In Proceedings of the 20th ACM SIGKDD international conference on Knowledge discovery and data mining, ACM, New York City, August 24–27, 2014. p.15–24.
- S.G. Roberts, R.I. Dunbar, T.V. Pollet and T. Kuppens, Soc. Networks, 31 (2009) p.138–146. doi:10.1016/j.socnet.2008.12.002
- K. Hawkes, Nature, 428 (2004) p.128. doi:10.1038/nature02437
- V. Palchykov, J. Kertész, R. Dunbar and K. Kaski, J. Stat. Phys., 151 (2013) p.735–744. doi:10.1007/s10955-013-0705-0
- R.I. Dunbar, Behav. Brain Sci., 16 (1993) p.681–694. doi:10.1017/S0140525X00032325
- G. Miritello, R. Lara, M. Cebrian and E. Moro, Sci. Rep., 3 (2013). doi:10.1038/srep01950
- S. Centellegher, E. López, J. Saramäki and B. Lepri, PloS one, 12 (2017) p.e0173110. doi:10.1371/journal.pone.0173110
- Available at https://en.wikipedia.org/wiki/Big_Five_personality_traits.
- T. David-Barrett, J. Kertesz, A. Rotkirch, A. Ghosh, K. Bhattacharya, D. Monsivais and K. Kaski, PloS one, 11 (2016) p.e0165687. doi:10.1371/journal.pone.0165687
- T. David-Barrett, A. Rotkirch, A. Ghosh, K. Bhattacharya, D. Monsivais, I. Behncke, J. Kertesz and K. Kaski. Peer relations with mobile phone data: Best friends and family formation. arXiv preprint arXiv:1708.07759, 2017.
- K. Bhattacharya, A. Ghosh, D. Monsivais, R. Dunbar and K. Kaski, EPJ Data Science, 6 (2017) p.1. doi:10.1140/epjds/s13688-016-0097-x
- H. Navarro, G. Miritello, A. Canales and E. Moro, EPJ Data Science, 6 (2017) p.31. doi:10.1140/epjds/s13688-017-0127-3
- N.V. Chawla, D. Hachen, O. Lizardo, Z. Toroczkai, A. Strathman and C. Wang. Weighted reciprocity in human communication networks. Technical report, 2011.
- L. Tabourier, A.-S. Libert and R. Lambiotte, EPJ Data Science, 5 (2016) p.1. doi:10.1140/epjds/s13688-015-0062-0
- A.-L. Barabási, Bursts: The Hidden Patterns behind Everything We Do, from Your E-Mail to Bloody Crusades, Dutton Penguin, New York, 2010.
- K.-I. Goh and A.-L. Barabási, EPL (Europhysics Letters), 81 (2008) p.48002. doi:10.1209/0295-5075/81/48002
- M. Karsai, H.-H. Jo and K. Kaski, Bursty Human Dynamics, Springer, Berlin, 2018.
- P. Bak, K. Christensen, L. Danon and T. Scanlon, Phys. Rev. Lett., 88 (2002) p.178501. doi:10.1103/PhysRevLett.88.104301
- A.A. Grace and B.S. Bunney, J. Neuroscience, 4 (1984) p.2877–2890. doi:10.1523/JNEUROSCI.04-11-02877.1984
- J.C. Uyeda, T.F. Hansen, S.J. Arnold and J. Pienaar, Proc. Natl. Acad. Sci., 108 (2011) p.15908–15913. doi:10.1073/pnas.1014503108
- J.-P. Eckmann, E. Moses and D. Sergi, Proc. Natl. Acad. Sci. U.S.A., 101 (Oct 2004) p.14333–14337. doi:10.1073/pnas.0405728101
- M. Karsai, K. Kaski and J. Kertész, PLoS One, 7 (July 2012) p.e40612+. doi:10.1371/journal.pone.0040612
- G. Grimmett and D. Stirzaker, Probability and Random Processes, Oxford University Press, Oxford, UK, 2001.
- M. Karsai, K. Kaski, A.-L. Barabási and J. Kertész, Sci. Rep., 2 (2012) p.397. doi:10.1038/srep00386
- T. Aoki, T. Takaguchi, R. Kobayashi and R. Lambiotte, Phys. Rev. E, 94 (2016) p.042313. doi:10.1103/PhysRevE.94.042313
- Z.-Q. Jiang, W.-J. Xie, M.-X. Li, B. Podobnik, W.-X. Zhou and H.E. Stanley, Proc. Natl. Acad. Sci., 110 (2013) p.1600–1605. doi:10.1073/pnas.1220433110
- H.-H. Jo, M. Karsai, J. Karikoski and K. Kaski, EPJ Data Sci., 1 (2012) p.10. doi:10.1140/epjds10
- J. Candia, M.C. González, P. Wang, T. Schoenharl, G. Madey and A.-L. Barabási, J Phys A Math Theoret., 41 (2008) p.224015. doi:10.1088/1751-8113/41/22/224015
- G. Miritello, E. Moro and R. Lara, Phys. Rev. E, 83 (2011) p.045102. doi:10.1103/PhysRevE.83.045102
- C.M. Schneider, V. Belik, T. Couronné, Z. Smoreda and M.C. González, J. Royal Soc. Interface, 10 (2013) p.20130246. doi:10.1098/rsif.2013.0246
- Y. Wu, C. Zhou, J. Xiao, J. Kurths and H.J. Schellnhuber, Proc. Natl. Acad. Sci. USA, 107 (2010) p.18803–18808. doi:10.1073/pnas.1013140107
- A.-L. Barabási, Nature, 435 (May 2005) p.207–211. doi:10.1038/nature03459
- H.-H. Jo, J.I. Perotti, K. Kaski and J. Kertész, Phys. Rev. E, 92 (2015) p.022814. doi:10.1103/PhysRevE.92.022814
- A. Vazquez, Physica A Stat. Mech. Appl., 373 (Jan 2007) p.747–752. doi:10.1016/j.physa.2006.04.060
- A. Vázquez, J.G. Oliveira, Z. Dezsö, K.-I. Goh, I. Kondor and A.-L. Barabási, Phys. Rev. E, 73 (Mar 2006) p.036127+. doi:10.1103/PhysRevE.73.036127
- J.G. Oliveira and A. Vazquez, Physica A Stat. Mech. Appl., 388 (Jan 2009) p.187–192. doi:10.1016/j.physa.2008.08.022
- M. Goetz, J. Leskovec, M. McGlohon and C. Faloutsos. Modeling Blog Dynamics. ICWSM 2009, 2009.
- H.-H. Jo, R.K. Pan and K. Kaski, PloS one, 6 (2011) p.e22687. doi:10.1371/journal.pone.0022687
- J. Stehlé, A. Barrat and G. Bianconi, Phy. Rev. E, 81 (2010) p.035101. doi:10.1103/PhysRevE.81.035101
- P. Holme and J. Saramäki, Phys. Rep., 519 (2012) p.97–125. doi:10.1016/j.physrep.2012.03.001
- M. Karsai, M. Kivelä, R.K. Pan, K. Kaski, J. Kertész, A.-L. Barabási and J. Saramäki, Phys. Rev. E, 83 (2011) p.025102. doi:10.1103/PhysRevE.83.025102
- M. Kivelä, R.K. Pan, K. Kaski, J. Kertész, J. Saramäki and M. Karsai, J. Stat. Mechanics: Theory Exp., 2012 (2012) p.P03005. doi:10.1088/1742-5468/2012/03/P03005
- L. Speidel, R. Lambiotte, K. Aihara and N. Masuda, Phys. Rev. E, 91 (2015) p.012806. doi:10.1103/PhysRevE.91.012806
- V.-P. Backlund, J. Saramäki and R.K. Pan, Phys. Rev. E, 89 (2014) p.062815. doi:10.1103/PhysRevE.89.062815
- T. Takaguchi, N. Masuda and P. Holme, PloS one, 8 (2013) p.e68629. doi:10.1371/journal.pone.0068629
- J.-P. Bouchaud and A. Georges, Phys. Rep., 195 (1990) p.127–293. doi:10.1016/0370-1573(90)90099-N
- S. Havlin and D. Ben-Avraham, Adv. Physics, 51 (2002) p.187–292. doi:10.1080/00018730110116353
- G. Ramos-Fernández, J.L. Mateos, O. Miramontes, G. Cocho, H. Larralde and B. Ayala-Orozco, Behav. Ecol. Sociobiol. (Print), 55 (2004) p.223–230. doi:10.1007/s00265-003-0700-6
- G.M. Viswanathan, M.G. Da Luz, E.P. Raposo and H.E. Stanley, The Physics of Foraging: An Introduction to Random Searches and Biological Encounters, Cambridge University Press, Cambridge, UK, 2011.
- G.M. Viswanathan, S.V. Buldyrev, S. Havlin, M. Da Luz, E. Raposo and H.E. Stanley, Nature, 401 (1999) p.911. doi:10.1038/44831
- A. Cuttone, S. Lehmann and M.C. González, EPJ Data Science, 7 (2018) p.2. doi:10.1140/epjds/s13688-017-0129-1
- M.C. Gonzalez, C.A. Hidalgo and A.-L. Barabasi, Nature, 453 (2008) p.779. doi:10.1038/nature06958
- C. Song, T. Koren, P. Wang and A.-L. Barabási, Nature Physics, 6 (2010) p.818. doi:10.1038/nphys1760
- J.P. Bagrow and Y.-R. Lin, PloS one, 7 (2012) p.e37676. doi:10.1371/journal.pone.0037676
- S. Jiang, Y. Yang, S. Gupta, D. Veneziano, S. Athavale and M.C. González, Proc. Natl. Acad. Sci., 113 (2016) p.E5370–E5378. doi:10.1073/pnas.1524261113
- L. Alessandretti, P. Sapiezynski, S. Lehmann and A. Baronchelli. Evidence for a conserved quantity in human mobility. arXiv preprint arXiv:1609.03526, 2016.
- B.C. Csáji, A. Browet, V.A. Traag, J.-C. Delvenne, E. Huens, P. Van Dooren, Z. Smoreda and V.D. Blondel, Physica A Stat. Mech. Appl., 392 (2013) p.1459–1473. doi:10.1016/j.physa.2012.11.040
- J.E. Anderson, Annu. Rev. Econ., 3 (2011) p.133–160. doi:10.1146/annurev-economics-111809-125114
- D. Balcan, V. Colizza, B. Gonçalves, H. Hu, J.J. Ramasco and A. Vespignani, Proc. Natl. Acad. Sci., 106 (2009) p.21484–21489. doi:10.1073/pnas.0906910106
- H.C. Carey, Principles of Social Science, Vol. 3, JB Lippincott & Company, Philadelphia, Pennsylvania, 1867.
- G.A. Carrothers, J. Am. Inst. Plann., 22 (1956) p.94–102. doi:10.1080/01944365608979229
- G. Krings, F. Calabrese, C. Ratti and V.D. Blondel, J. Stat. Mechanics: Theory Exp., 2009 (2009) p.L07003. doi:10.1088/1742-5468/2009/07/L07003
- J.-P. Onnela, S. Arbesman, M.C. González, A.-L. Barabási and N.A. Christakis, PLoS one, 6 (2011) p.e16939. doi:10.1371/journal.pone.0016939
- F. Simini, M.C. González, A. Maritan and A.-L. Barabási, Nature, 484 (2012) p.96. doi:10.1038/nature10856
- S. Grauwin, M. Szell, S. Sobolevsky, P. Hövel, F. Simini, M. Vanhoof, Z. Smoreda, A.-L. Barabási and C. Ratti, Sci. Rep., 7 (2017) p.46677. doi:10.1038/srep46677
- T. Louail, M. Lenormand, O.G.C. Ros, M. Picornell, R. Herranz, E. Frias-Martinez, J.J. Ramasco and M. Barthelemy, Sci. Rep., 4 (2014) p.5276. doi:10.1038/srep05276
- C. Song, Z. Qu, N. Blumm and A.-L. Barabási, Science, 327 (2010) p.1018–1021. doi:10.1126/science.1177170
- Interestingly, in the expression for Shannon entropy could denote the number of alters of an ego such that is the fraction of calls between the ego and an alter. This kind of expression has been used, for example by [76]. In a study to investigate gender differences, [6] used entropy expressions in both the contexts of mobility as well as sociality.
- Available at https://en.wikipedia.org/wiki/Fano%27s_inequality.
- X. Lu, L. Bengtsson and P. Holme, Proc. Natl. Acad. Sci., 109 (2012) p.11576–11581. doi:10.1073/pnas.1203882109
- J.L. Toole, C. Herrera-Yaqüe, C.M. Schneider and M.C. González, J. Royal Soc. Interface, 12 (2015) p.20141128. doi:10.1098/rsif.2014.1128
- P. Deville, C. Song, N. Eagle, V.D. Blondel, A.-L. Barabási and D. Wang, Proc. Natl. Acad. Sci., 113 (2016) p.7047–7052. doi:10.1073/pnas.1525443113
- A. Mollgaard, S. Lehmann and J. Mathiesen, PloS one, 12 (2017) p.e0188973. doi:10.1371/journal.pone.0188973
- R. Gallotti, R. Louf, J.-M. Luck and M. Barthelemy, J. Royal Soc. Interface, 15 (2018) p.20170776. doi:10.1098/rsif.2017.0776
- H.-H. Jo, M. Karsai, J. Kertész and K. Kaski, New J. Phys., 14 (2012) p.013055. doi:10.1088/1367-2630/14/1/013055
- V.P. Cornet and R.J. Holden, J. Biomed. Inform., 77 (2018) p.120–132. doi:10.1016/j.jbi.2017.12.008
- D. Monsivais, A. Ghosh, K. Bhattacharya, R.I. Dunbar and K. Kaski, PLoS Comput. Biol., 13 (2017) p.e1005824. doi:10.1371/journal.pcbi.1005824
- J. Aschoff, Science, 148 (1965) p.1427–1432. doi:10.1126/science.148.3676.1427
- M.H. Vitaterna, J.S. Takahashi and F.W. Turek, Alcohol Res. Health., 25 (2001) p.85–93.
- Available at https://www.nobelprize.org/nobel_prizes/medicine//medicine/laureates/2017/.
- L.D. Grandin, L.B. Alloy and L.Y. Abramson, Clin. Psychol. Rev., 26 (2006) p.679–694. doi:10.1016/j.cpr.2006.07.001
- G. Yetish, H. Kaplan, M. Gurven, B. Wood, H. Pontzer, P.R. Manger, C. Wilson, R. McGregor and J.M. Siegel, Curr. Biol., 25 (2015) p.2862–2868. doi:10.1016/j.cub.2015.05.025
- S. Ancoli-Israel, R. Cole, C. Alessi, M. Chambers, W. Moorcroft and C.P. Pollak, Sleep, 26 (2003) p.342–392. doi:10.1093/sleep/26.3.342
- T. Roenneberg, L.K. Keller, D. Fischer, J.L. Matera, C. Vetter and E.C. Winnebeck, Human Activity and Rest in Situ, In A. Sehgal ed. Methods in Enzymology, Vol. 552, Elsevier, London, 2015, p.257–283
- E.K. Choe, S. Consolvo, N.F. Watson and J.A. Kientz. Opportunities for computing technologies to support healthy sleep behaviors. In Proceedings of the SIGCHI Conference on Human Factors in Computing Systems, ACM, Vancouver, BC, Canada, May 07–12, 2011, p.3053–3062.
- T. Roenneberg, A. Wirz-Justice and M. Merrow, J. Biol. Rhythms, 18 (2003) p.80–90. doi:10.1177/0748730402239679
- T. Roenneberg, T. Kuehnle, M. Juda, T. Kantermann, K. Allebrandt, M. Gordijn and M. Merrow, Sleep Med. Rev., 11 (2007) p.429–438. doi:10.1016/j.smrv.2007.07.005
- S. Abdullah, M. Matthews, E.L. Murnane, G. Gay and T. Choudhury. Towards circadian computing: Early to bed and early to rise makes some of us unhealthy and sleep deprived. In Proceedings of the 2014 ACM International Joint Conference on Pervasive and Ubiquitous Computing, ACM, Seattle, WA, USA, September 13–17, 2014, p.673–684.
- S. Abdullah, M. Matthews, E. Frank, G. Doherty, G. Gay and T. Choudhury, J. Am. Med. Inform. Assoc., 23 (2016) p.538–543. doi:10.1093/jamia/ocv200
- Y. Bai, B. Xu, Y. Ma, G. Sun and Y. Zhao. Will you have a good sleep tonight?: Sleep quality prediction with mobile phone. In Proceedings of the 7th International Conference on Body Area Networks, ICST (Institute for Computer Sciences, Social-Informatics and Telecommunications Engineering), Oslo, Norway, September, 24–26, 2012, p.124–130.
- D. Ben-Zeev, E.A. Scherer, R. Wang, H. Xie and A.T. Campbell, Psychiatr. Rehabil. J., 38 (2015) p.218. doi:10.1037/prj0000130
- Z. Chen, M. Lin, F. Chen, N.D. Lane, G. Cardone, R. Wang, T. Li, Y. Chen, T. Choudhury and A.T. Campbell. Unobtrusive sleep monitoring using smartphones. In Pervasive Computing Technologies for Healthcare (PervasiveHealth), 2013 7th International Conference on, IEEE, Venice, Italy, May 5–8, 2013, p.145–152.
- S. Saeb, E.G. Lattie, S.M. Schueller, K.P. Kording and D.C. Mohr, PeerJ, 4 (2016) p.e2537. doi:10.7717/peerj.2537
- T. Aledavood, E. López, S.G. Roberts, F. Reed-Tsochas, E. Moro, R.I. Dunbar and J. Saramäki, PloS one, 10 (2015) p.e0138098. doi:10.1371/journal.pone.0138098
- A. Cuttone, P. Bækgaard, V. Sekara, H. Jonsson, J.E. Larsen and S. Lehmann, PloS one, 12 (2017) p.e0169901. doi:10.1371/journal.pone.0169901
- D. Monsivais, K. Bhattacharya, A. Ghosh, R.I. Dunbar and K. Kaski, Sci. Rep., 7 (2017) p.10717. doi:10.1038/s41598-017-11125-z
- A. Bogomolov, B. Lepri, M. Ferron, F. Pianesi and A.S. Pentland. Daily stress recognition from mobile phone data, weather conditions and individual traits. In Proceedings of the 22nd ACM international conference on Multimedia, ACM, 2014. p.477–486.
- J. Asselbergs, J. Ruwaard, M. Ejdys, N. Schrader, M. Sijbrandij and H. Riper, J. Med. Internet Res., 18 (2016). doi:10.2196/jmir.5505
- S. Saeb, M. Zhang, C.J. Karr, S.M. Schueller, M.E. Corden, K.P. Kording and D.C. Mohr, J. Med. Internet Res., 17 (2015). doi:10.2196/jmir.4273
- J. Torous, M.V. Kiang, J. Lorme and J.-P. Onnela, JMIR Mental Health. 3 (2016). doi:10.2196/mental.5165
- V. Kassarnig, E. Mones, A. Bjerre-Nielsen, P. Sapiezynski, D.D. Lassen and S. Lehmann. Academic performance and behavioral patterns. arXiv preprint arXiv:1706.09245, 2017.
- T. Aledavood, S. Lehmann and J. Saramäki. Social network differences of chronotypes identified from mobile phone data. arXiv preprint arXiv:1709.06690, 2017.
- Available at https://en.wikipedia.org/wiki/MHealth.
- T. Aledavood, A.M.T. Hoyos, T. Alakörkkö, K. Kaski, J. Saramäki, E. Isometsä and R.K. Darst, JMIR Res. Protoc., 6 (2017). doi:10.2196/resprot.6919
- A. Huguet, S. Rao, P.J. McGrath, L. Wozney, M. Wheaton, J. Conrod and S. Rozario, PLoS One, 11 (2016) p.e0154248. doi:10.1371/journal.pone.0154248
- P. Ball, Nature, 545 (2017) p.154. doi:10.1038/545154a
- M.J. Salganik, Bit by Bit: Social Research in the Digital Age, Princeton, NJ: Princeton University Press, 2017.
- B. Marr, Data Strategy: How to Profit from a World of Big Data, Analytics and the Internet of Things, 1st Edition, Kogan Page Ltd, New York, 2017.
- I. Barnett, N. Malik, M.L. Kuijjer, P.J. Mucha and J.-P. Onnela. Feature-based classification of networks. arXiv preprint arXiv:1610.05868, 2016.
- J. Carrasquilla and R.G. Melko, Nature Physics, 13 (2017) p.431. doi:10.1038/nphys4035
- M. Kivelä, A. Arenas, M. Barthelemy, J.P. Gleeson, Y. Moreno and M.A. Porter, J. Comp. Net., 2 (2014) p.203–271. doi:10.1093/comnet/cnu016
- D.M. Lazer, M.A. Baum, Y. Benkler, A.J. Berinsky, K.M. Greenhill, F. Menczer, M.J. Metzger, B. Nyhan, G. Pennycook, D. Rothschild. et al., Science. 359 (2018) p.1094–1096. doi:10.1126/science.aao2998
- S. Vosoughi, D. Roy and S. Aral, Science, 359 (2018) p.1146–1151. doi:10.1126/science.aap9559
- J. Becker, D. Brackbill and D. Centola, Proc. Natl. Acad. Sci. U S A, 114 (2017) p.E5070–E5076.
- K. Bhattacharya, T. Takko, D. Monsivais and K. Kaski. Role of risk and information in a group formation experiment on a small-world network. arXiv preprint arXiv:1803.01085, 2018.
- R.M. Bond, C.J. Fariss, J.J. Jones, A.D. Kramer, C. Marlow, J.E. Settle and J.H. Fowler, Nature, 489 (2012) p.295. doi:10.1038/nature11468
- D. Centola and A. Baronchelli, Proc. Natl. Acad. Sci., 112 (2015) p.1989–1994. doi:10.1073/pnas.1418838112
- J.W. Crandall, M. Oudah, F. Ishowo-Oloko, S. Abdallah, J.-F. Bonnefon, M. Cebrian, A. Shariff, M.A. Goodrich, I. Rahwan. et al., Nat Commun. 9 (2018) p.233. doi:10.1038/s41467-017-02597-8
- H. Shirado and N.A. Christakis, Nature, 545 (2017) p.370. doi:10.1038/nature22332