
 ?Mathematical formulae have been encoded as MathML and are displayed in this HTML version using MathJax in order to improve their display. Uncheck the box to turn MathJax off. This feature requires Javascript. Click on a formula to zoom.
ABSTRACT
For more than two decades, encapsulation in superfluid helium nanodroplets has served as a reliable technique for probing the structure and dynamics of molecules and clusters at a low temperature of ≈0.37 K. Due to weak interactions between molecules and the host liquid helium, good spectral resolution can usually be achieved, making helium droplets an ideal matrix for spectroscopy in a wide spectral range from infrared to ultraviolet. Furthermore, rotational structure in the spectra of small molecules provides a unique probe for interactions with the superfluid on an atomic scale. This review presents a summary of results and a discussion of recent experimental developments in helium droplet spectroscopy with the emphasis laid on infrared studies. Initially, studies focused on single molecules and have been expanded to larger species, such as metal-molecular clusters, biomolecules, free radicals, ions, and proteins.
Graphical Abstract
1. Introduction
Matrix isolation of molecular species is a reliable technique for a chemical physicist, as isolation of molecules and transient species in solid cryogenic matrices has been used for spectroscopic studies since 1954 [Citation1–Citation3]. More recently, the technique of isolation in free helium (He) nano-droplets has been introduced [Citation4–Citation7]. In comparison to traditional matrix isolation, which usually involves absorption spectroscopy of deposited species, experiments with nanodroplets involve molecular beams and laser action spectroscopy. Helium stays liquid down to zero Kelvin at saturated vapor pressure, unlike other matrices. At temperatures lower than 2.17 K (the so-called lambda point), helium undergoes a second-order phase transition to a superfluid state [Citation8–Citation11]. Superfluids can be characterized by a macroscopic wave function, and they have zero viscosity. While dopants are barely mobile in solid matrices, they can move unhindered in bulk superfluid He until they combine. Besides alkali atoms, which stay on the surface [Citation12–Citation14], most other elements and molecules are solvated by liquid helium and reside in the interior of the droplets [Citation15–Citation20]. Liquid helium is optically transparent from microwave deep into the vacuum ultraviolet (~60 nm). Among different matrices, He has the weakest possible interaction strength with the embedded species, facilitating observation of a well-resolved vibrational, and often rotational, spectra desirable to discern detailed structural information.
Over the years, the helium droplet community has published several reviews on vibrational and electronic spectroscopy, photoionization, and ultrafast dynamics [Citation15–Citation31]. Earlier spectroscopic studies revealed that embedded molecules, such as SF6 [Citation32] and OCS [Citation33,Citation34] undergo free rotation inside the droplets. Infrared spectra of several small gaseous molecules have since been reported [Citation17–Citation19,Citation25]. These spectroscopic studies concentrated on characterization of the unusual quantum liquid helium matrix and its interaction with molecular probes via rotational structure in infrared (IR) spectra. More recent development includes spectroscopic applications of the droplets for interrogation of radicals, ions and molecular clusters, which are topics in this review. Due to rapid evaporative cooling in vacuum, the droplets present an isothermal environment with low T ≈0.37 K. Vibrational and rotational degrees of freedom are rapidly thermalized to the droplets’ temperature. The low rotational energy of the dopants and the quantum liquid environment of the droplet enables effective orientation of intercalates in external electric field, which facilitates determination of their structure and electric properties. Moreover, in distinction to solid matrices, particles added in sequence to the droplet move freely inside until they recombine within a short time, thus making droplets versatile nanoscopic ‘test tubes’ to study physical and chemical processes at low temperature. Additionally, the ultra-cold environment of the droplet stabilizes highly reactive species in shallow van der Waals pre-reactive potential minima, which is challenging with other contemporary experimental techniques. Furthermore, study of molecular ions in helium droplets presents a new and promising direction of research.
Besides spectroscopy, recent advances in He droplet experiments include surface deposition of the embedded clusters [Citation35–Citation40] and X-ray diffraction experiments with single neat and doped droplets [Citation41–Citation45]. These experiments led to the observation of quantum vortices, vortex-assisted aggregation of dopants and large shape deformations of the rotating droplets which, however, remain beyond the scope of this review.
2. Helium droplet beam experiment
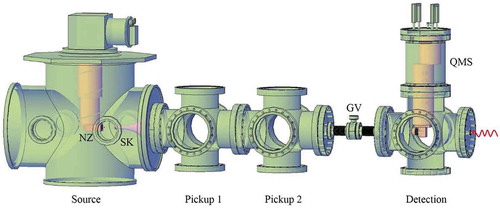
Current experiments with helium droplets involve molecular beam techniques [Citation18,Citation19,Citation27]. An overview of the basic He droplet vacuum apparatus in our lab at USC is presented in . A detailed description of the setup can be found in a recent review [Citation27]. In brief, the droplets are formed by expansion of pressurized (P0 = 10–40 bar) ultra-pure helium in vacuum through a 5 μm diameter nozzle maintained at cryogenic temperature, T0. At higher T0 (T0 >10 K for P0 = 20 bar), droplets form by coalescing gaseous helium, whereas at lower T0, formation occurs through breakup of liquid helium [Citation27,Citation46,Citation47]. Droplets with average size, NHe, from a few hundred to ~1012 atoms could be produced at T0 ranging from 20 K to 4 K [Citation27]. Average sizes have been measured either by deflection of continuous beam [Citation48,Citation49], through attenuation by inert collisional gas [Citation47] or, more recently, by x-ray diffraction [Citation27,Citation41,Citation42]. The apparatus consists of several ultra-high vacuum (UHV) chambers. The UHV background is necessary to avoid droplets’ contamination with residual gas molecules. After exiting the nozzle, the beam is collimated by a 0.5 mm skimmer. The droplets enter the pickup region where they are doped with molecules of interest. The doped droplets travel further to the detection chamber, which is equipped with an off-axis quadrupole mass spectrometer (QMS), along with an optical window for laser input. Some experiments based on pulsed excitation and detection, such as laser-induced fluorescence (LIF), time of flight mass spectrometry (TOFMS) and spectroscopy of ions, may benefit from pulsed He droplets beams, which are characterized by up to a factor of ~100 larger peak flux as compared with the continuous beams [Citation50,Citation51]. Pulsed beams are typically produced from electromagnetic valves and have higher operational T0 [Citation45,Citation50–Citation53]. The droplets exhibit log normal size and exponential size distributions in higher and lower nozzle temperature regimes, respectively [Citation48,Citation49,Citation54]. The entire length of the setup is typically on the order of one meter. Depending on T0 and P0, the droplet beam velocities fall in the range of 150–400 m/s [Citation46–Citation48].
Figure 1. Schematic of a basic vacuum apparatus for spectroscopy in He droplets. The helium droplets are produced from a continuous nozzle (NZ) in the source chamber on the left which is pumped by 3000 L/s turbomolecular pump. The droplets pass through a skimmer (SK) before they enter the pickup chambers. The droplets terminate in the detection chamber which hosts an off-axis quadrupole mass spectrometer (QMS) with an electron ionization source. A gate valve (GV) separates the UHV detection chamber from the rest of the apparatus. The detection chamber has an on-axis optical window for laser input.
Helium droplets readily pickup particles upon collisions. The number of captured particles is determined by the droplets’ cross-sectional area, dopant number density and pick up length. As an example, a droplet of ~5105 atoms having a geometrical cross section of
, dopant pressure of ~10−6 mbar would suffice for an average pickup of a single molecule per droplet over a path length of 4 cm. Heated pickup cells are typically used to sublimate metal atoms [Citation22] and medium sized molecules such as phthalocyanines, aminoacids, and polyacenes [Citation18]. Small radicals, such as hydroxyls, are produced from pyrolysis of precursor molecules, such as hydroperoxides [Citation19]. Larger biological molecules cannot be vaporized by heating due to decomposition. Thus, larger molecules are brought into gas phase as ions via electrospray [Citation55].
A single pickup leads to evaporation of helium atoms from the droplet due to thermalization of the captured molecules. Roughly 1600 helium atoms are evaporated from a droplet for 1 eV of evolved energy [Citation56]. This value sets a limit on the size of the droplet that could be used for a particular experiment. Large droplets may be used for pickup of larger molecules or multiple species which recombine to form clusters [Citation18,Citation19,Citation21,Citation22]. Assuming a droplets’ cross section doesn’t change with multiple capture events, the probability of picking up of particles follows a Poisson distribution,
where, is the average number of pickup collisions, which is proportional to the pickup pressure. The value of
can be approximated as
, where
is the number density of dopants,
is the pickup cross section
, and
is the length of the pickup region.
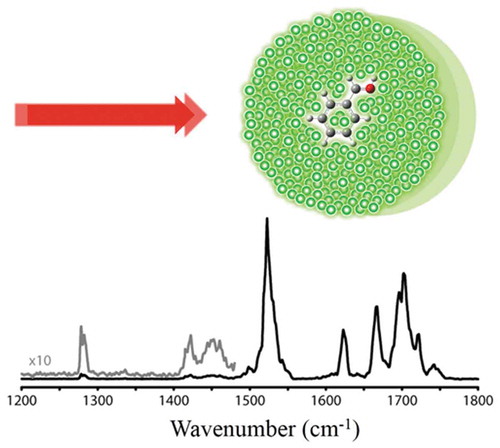
In the infrared regime, the detection of the spectral absorption signal is often based on the attenuation of the helium droplet beam [Citation18,Citation32,Citation57]. In a typical experiment, the laser beam counter-propagates coaxially to the droplet beam, which ensures optimal overlap of the two beams. Upon absorption, the embedded species dissipate vibrational excitation energy to the surrounding helium liquid. This energy transfer leads to a decrease in the average droplet size in the beam due to evaporation, and a concomitant decrease of the droplets’ ionization cross section upon electron impact. A QMS monitors the reduction in the average droplet size through the intensity of the molecular splitters ions or He2+ ions ejected from the droplets. This technique is referred to as ‘depletion’ spectroscopy and is schematized in . For example, a 3000 cm−1 IR photon, corresponding to an energy of ~4300 K, would lead to the evaporation of ~600 helium atoms, assuming the heat of evaporation of one He atom to be ~7 K [Citation56]. For a droplet with 6000 atoms, this corresponds to ~10% depletion. However, the maximum experimental depletion dip is lower (<3%) due to the Poisson distribution effect from Equation (1). Hence, spectroscopy of single molecules in rather large droplets (>105 atoms) is avoided because of insignificant signal output. However, spectroscopy of large clusters requires the use of large droplets [Citation27].
Figure 2. Schematic of infrared depletion spectroscopy. Upon absorption of a photon (ν =3000 cm−1) by the dopant in a droplet with ~6000 He atoms, and following vibrational relaxation, a few hundred helium atoms evaporate resulting in a reduced average size of the droplets (NHe ≈5400) in the beam. This ~10% decrease in NHe is seen as a dip in the mass spectrometer signal measuring He2+ ions.
3. Spectroscopy in helium nanodroplets
3.1. Single molecules and small clusters
Early spectroscopic works in He droplets containing NHe = 103–104 atoms focused on several small single molecules and molecular cluster targets such as SF6 [Citation5,Citation6,Citation32,Citation57], OCS [Citation33,Citation34,Citation58,Citation59], HCCCN [Citation60], CH3OH [Citation61], HCN [Citation62], HF [Citation63,Citation64], HCl [Citation65,Citation66], H2O [Citation67,Citation68], C2H6 [Citation69], CO2 [Citation70,Citation71], NH3 [Citation72–Citation74], CH4 [Citation75–Citation77], and NO [Citation78,Citation79]. It was discovered that, contrary to the spectra in ordinary matrices, vibrational bands of dopants in superfluid droplets often demonstrate well-resolved rotational structure [Citation32–Citation34,Citation57].
shows the spectrum of the v3 band of SF6 with assignment of the rotational lines: R-branch (J + 1←J), P-branch (J − 1←J) and unresolved Q-branch (J←J) in the middle [Citation32]. The spectra show only minor changes with droplet size at NHe >5000 [Citation81], suggesting similar spectra would also be observed in the bulk superfluid helium at the same temperature. The observation of well-resolved rotational structure was assigned to the superfluid environment of the droplets, which facilitates slow relaxation and dephasing of the dopants’ rotation. Superfluids are often characterized by the existence of a Landau critical velocity, below which a moving body is unable to produce elementary excitations in the superfluid and thus moves unhindered. Similar criteria can be applied for rotational motion, rationalizing long lifetimes (for some molecules τ >50 ns) [Citation82–Citation84]. In addition, small helium droplets (NHe <106) are largely devoid of phonon thermal excitations due to finite size effects [Citation27,Citation85]. Moreover, superfluid He provides a homogeneous solvation environment for dopants due to large zero point energy delocalization of the He atoms [Citation20,Citation28,Citation86,Citation87]. The intensity distribution among the rotational-vibrational lines enables an accurate determination of the temperature in He droplets of 0.37 K [Citation32–Citation34]. Inefficient relaxation and a homogeneous environment lead to narrow spectral width of the ro-vibrational lines on the order of 0.01–0.1 cm−1 in small molecules [Citation18,Citation19,Citation25]. The residual linewidth is usually related to vibrational relaxation time broadening, the interaction of molecular rotation with translational motion of the molecules and the confining potential within the droplets [Citation88,Citation89]. The lines are typically broader (few wavenumbers) in the spectra of larger, less symmetric molecules, which usually lack rotational resolution [Citation18,Citation25]. The broadening likely relates to a faster vibrational relaxation in larger molecules.
Figure 3. The spectrum of the v3 rotational – vibrational band of SF6 in a droplet with ~4000 helium atoms. The thin line represents a simulation of the spectra using a simplified free molecule rotational-vibrational Hamiltonian that includes the effects of centrifugal distortion and Coriolis coupling. The underlying stick spectrum shows the positions and intensities of the lines. The fit in terms of a more accurate spherical top Hamiltonian is presented in Ref. [Citation80]. This figure is used with permission from Ref. [Citation32].
![Figure 3. The spectrum of the v3 rotational – vibrational band of SF6 in a droplet with ~4000 helium atoms. The thin line represents a simulation of the spectra using a simplified free molecule rotational-vibrational Hamiltonian that includes the effects of centrifugal distortion and Coriolis coupling. The underlying stick spectrum shows the positions and intensities of the lines. The fit in terms of a more accurate spherical top Hamiltonian is presented in Ref. [Citation80]. This figure is used with permission from Ref. [Citation32].](/cms/asset/97f850a5-ce15-4406-a6a2-6e32cbfc22b7/tapx_a_1553569_f0003_b.gif)
The rotational structure in the spectra presents a unique microscopic probe for superfluidity in helium. The rotational energy levels of various small molecules can be described by the same Hamiltonian as free molecules, with renormalized spectroscopic constants [Citation18,Citation19,Citation25,Citation82,Citation90]. For linear rotors, the two most important terms read:
where, J is the rotational quantum number, B is the rotational constant and D is the centrifugal distortion constant. B = ℏ2/(2∙I), where ℏ is the Planck’s constant divided by 2π and I is the moment of inertia. It was discovered that effective moments of inertia in heavy molecules (such as OCS and SF6) increase by about a factor of two to five, compared to their gas phase values [Citation18,Citation19,Citation32,Citation34]. In addition, the D constants were orders of magnitude larger than in free molecules. Phenomenologically, the renormalization of I can be accounted by assuming that a few He atoms rigidly rotate with the molecule [Citation32,Citation34]. More realistically, the renormalization indicates the coupling of the molecular rotation with helium excitations in the vicinity [Citation75,Citation82,Citation90]. In comparison, the moments of inertia of light rotors, such as CH4, were found to be within a few percent of those in free molecules, indicating less efficient coupling with the bath [Citation18,Citation75,Citation77]. However, even the light rotors continue to show larger D constants than free molecules, indicating that the coupling with liquid helium environment is not negligible [Citation82].
To evaluate the relation between superfluidity and the observation of the sharp rotational spectrum, experiments were performed in non-superfluid 3He fermionic droplets and mixed 3He/4He droplets. ) shows the spectrum of OCS in neat 3He droplets [Citation33]. The spectrum has a broad envelope that was ascribed to unresolved rotational structure [Citation91]. The estimated moment of inertia of OCS in 3He was found to be even larger than in 4He droplets, indicating stronger coupling with 3He environment. Panels B-F show spectra obtained upon addition of the indicated average number of 4He atoms. In mixed droplets, 4He atoms replace 3He atoms in the molecular vicinity due to smaller zero point energy of the 4He [Citation20]. Thus, a shell of 4He atoms forms around the embedded molecules immersed in 3He droplet. –) show that the spectrum changes its shape dramatically upon increasing the number of added 4He atoms. After introducing about 60 4He atoms (panel E), well-resolved rotational lines clearly emerge and persist even at larger number of added 4He atoms (panel F). The identification of the rotational structure in clusters containing ~60 4He atoms was assigned to the onset of superfluidity in 4He droplets. The observed emergence of the rotational structure is mostly related to the formation of about two layers of 4He around OCS that shield the molecule from outer 3He.
Figure 4. A series of OCS infrared spectra of the ν3 vibrational mode in a pure 3He droplet and mixed 3He/4He droplets. Zero frequency corresponds to 2061.71 cm−1. The average number of 3He atoms is ~1.2 × 10⁴ while the average number of 4He atoms varies: 0 (a), 7 (b), 25 (c), 35 (d), 60 (e), and 100 (f). Adapted from Ref. [Citation33].
![Figure 4. A series of OCS infrared spectra of the ν3 vibrational mode in a pure 3He droplet and mixed 3He/4He droplets. Zero frequency corresponds to 2061.71 cm−1. The average number of 3He atoms is ~1.2 × 10⁴ while the average number of 4He atoms varies: 0 (a), 7 (b), 25 (c), 35 (d), 60 (e), and 100 (f). Adapted from Ref. [Citation33].](/cms/asset/b613be10-f44f-4dd5-91a7-11794196185f/tapx_a_1553569_f0004_b.gif)
Later, infrared absorption experiments in free 4He clusters revealed that the rotational structure is observed in even smaller clusters containing one molecule (OCS, CO, CO2, N2O, HCCCNN) and up to ~100 attached 4He atoms [Citation92–Citation98]. The clusters are formed via co-expansion of the molecules and He gas at low T ≈50–100 K. ) shows the dependence of the ground state rotational constant (B) in OCS-HeN clusters vs NHe (red circle) [Citation92]. Also shown is the rotational constant value of OCS in 3He clusters (with 60 4He atoms) as obtained from trace E of , marked as black cross which lies below the 4He droplet value (blue line). The experimental rotational constants in 4He and 3He droplets are shown by blue and black horizontal lines, respectively. The calculated rotational constants are shown by black triangles [Citation99–Citation101], green squares [Citation102], and blue squares [Citation103]. It is seen that with increasing NHe, the experimental B values first decrease, indicating that each added He atom increases the moment of inertia of the cluster, consistent with rigid body rotation. Then, upon reaching minimum at NHe = 9, the value of B increases (I decreases) with NHe, reaching the 4He nanodroplet value at NHe ~20, which corresponds to formation of the first He solvation shell around OCS. This reentrant behavior is assigned to gradual formation of a superfluid shell for NHe >8, which is characterized by nontrivial quantum mechanical exchange of He atoms. Note that the density of the first solvation shell is strongly influenced by the interaction with the OCS molecule. At NHe >20, the value of B gets larger than the nanodroplet value and exhibits oscillations from NHe ~20 to NHe ~72, and the period of oscillations increases with NHe. In the range of NHe = 20–72, the value of B remains 10–20% larger than in 4He droplets and slowly approaches the 4He nanodroplet value. However, a full convergence requires NHe >72, unavailable in the experiments. Most likely, the oscillations in B reflect the development of the clusters’ excitation spectrum upon increase of the size. The range of 20 < NHe <60 corresponds to growth of the second solvation shell around the OCS molecule and oscillations may be related to the change of the spectrum of the riplon modes with NHe. However, details of the transition of molecular rotation from small cluster limit to the nano-droplet (bulk) limit remain elusive.
Figure 5. Rotational constant B and shift of the ν1 band origin of OCS versus the number of added 4He atoms, NHe. Panel (a) shows the variation of the value of B with NHe, modified from Ref. [Citation92]. The plot incorporates experimental (red circles) [Citation92] and calculated values (black triangles [Citation99–Citation101], blue squares [Citation103], green squares [Citation102]). The black cross corresponds to measurements in mixed droplets containing 60 4He atoms in 3He clusters from (e) [Citation33]. The blue and black lines correspond to measurements in neat 4He and 3He droplets, respectively [Citation33,Citation91]. Note that in 3He, B = 1050 MHz is out of range. For comparison, in free OCS, B = 6087 MHz; also off scale. Panel (b) shows the shift of the vibrational band origin in OCS-HeN clusters vs NHe from Ref. [Citation104]. Black squares are experimental results from Ref. [Citation92]. The red circles are calculated using Morse/long-range (VMLR) potential [Citation104], the blue triangles are obtained from fourth order Moller-Plesset (VMP4) [Citation100], and the green diamonds are from GP potential calculations [Citation105]. Note: 1 cm−1 = 30 GHz. The blue and black lines correspond to measurements in neat 4He and 3He droplets, respectively [Citation33,Citation91].
![Figure 5. Rotational constant B and shift of the ν1 band origin of OCS versus the number of added 4He atoms, NHe. Panel (a) shows the variation of the value of B with NHe, modified from Ref. [Citation92]. The plot incorporates experimental (red circles) [Citation92] and calculated values (black triangles [Citation99–Citation101], blue squares [Citation103], green squares [Citation102]). The black cross corresponds to measurements in mixed droplets containing 60 4He atoms in 3He clusters from Figure 4(e) [Citation33]. The blue and black lines correspond to measurements in neat 4He and 3He droplets, respectively [Citation33,Citation91]. Note that in 3He, B = 1050 MHz is out of range. For comparison, in free OCS, B = 6087 MHz; also off scale. Panel (b) shows the shift of the vibrational band origin in OCS-HeN clusters vs NHe from Ref. [Citation104]. Black squares are experimental results from Ref. [Citation92]. The red circles are calculated using Morse/long-range (VMLR) potential [Citation104], the blue triangles are obtained from fourth order Moller-Plesset (VMP4) [Citation100], and the green diamonds are from GP potential calculations [Citation105]. Note: 1 cm−1 = 30 GHz. The blue and black lines correspond to measurements in neat 4He and 3He droplets, respectively [Citation33,Citation91].](/cms/asset/ccea1a98-5419-4632-9664-fd832baea7d2/tapx_a_1553569_f0005_oc.jpg)
) shows the measured and calculated shifts of the vibrational band origin of OCS vs NHe in the OCS-HeN clusters [Citation92,Citation99,Citation104,Citation105]. It is seen that adding 1–5 He atoms to OCS causes a progressive blue shift. This shift corresponds to filling of He atoms in a ‘donut ring’ around the OCS waist, which has the strongest OCS-He interaction. Addition of He atoms beyond NHe = 5 causes a progressive red shift, which indicates filling of the OCS surface away from the ‘donut ring’ [Citation24,Citation34,Citation87,Citation99,Citation100,Citation104,Citation106]. The slope of the dependence remains approximately constant up to NHe ~20 after which it abruptly gets smaller. This transition indicates the completion of the first solvation shell with ~20 He atoms and the emergence of a second He solvation shell around OCS which encompasses about 40 He atoms. In the largest experimental cluster with NHe = 72, the shift remains about 0.1 cm−1 less than in the droplets.
Several theoretical-computational approaches were applied to account for the renormalization of the effective moment of inertia, I. Calculations of the state/wave function of liquid helium (LHe) in the molecular vicinity are complicated by the fact that LHe is a strongly correlated system and that there is a need to explicitly implement the Bose permutation symmetry of 4He atoms. One approach involves path integral Monte Carlo (PIMC) calculations of the local superfluid and non-superfluid He components, based on the probability of participation of He atoms in long and short exchange loops [Citation101,Citation106–Citation108]. The non-superfluid density is then assumed to adiabatically follow the molecular rotation. Alternatively, the effective rotational constant of a doped helium cluster can be obtained from the analysis of imaginary time dipole-dipole correlation functions, which could be obtained from ground state quantum Monte Carlo (QMC) [Citation99,Citation102] or finite temperature PIMC [Citation106,Citation109] calculations. Calculations can reproduce the non-monotonic dependence of B vs NHe upon the filling of the first shell, however, the agreement is not quantitative, as can be seen from ). In addition, current techniques are challenged at larger NHe beyond the first solvation shell in that they do not reproduce the oscillation in B; they also do not seem to converge to nanodroplet values at large NHe. Because the above numerical techniques do not deliver wave functions, it is challenging to interpret the computational results in terms of interaction of molecular rotation and He excitations, as in case of the related problem of polarons [Citation110].
Calculations, such as density functional (DFT) [Citation20], diffusion Monte Carlo (DMC) [Citation111–Citation113] and PIMC [Citation87,Citation107,Citation114,Citation115] can be applied to obtain the density of He around the dopants. From the calculated density, the molecular vibrational shifts due to solvation can be obtained, often in good agreement with the experiments (). As discussed in Ref. [Citation104], the accuracy of the calculations critically depends on the quality of the binary molecule-He interaction potential.
Most recent progress in this field includes the development of analytic models to understand interactions between molecules and the surrounding environment [Citation82,Citation90]. While ab initio quantum mechanical calculations are required to quantitatively reproduce the experimental results, models give a transparent physical picture of the renormalization of the molecular moment of inertia. The rotation of a molecule in a superfluid is described in terms of a new quasi-particle – ‘angulon,’ an analogy to the notation of polarons [Citation110] used to describe electrons in dielectrics. Essentially, the angulon represents a rotating molecule coupled to excitations in the environment. Angulon theory explains the rotational constant renormalization observed for molecules in helium droplets, based on just the strength of the molecule-He anisotropic interaction. The broadening of spectroscopic lines for symmetric top molecules in He droplets has been explored by monitoring angulon instabilities [Citation116]. Angulon theory has also been employed to study non-adiabatic molecular rotation in He droplets through solute-solvent interaction dynamics in the presence of laser fields [Citation117]. Recently, the theory has been extended to account for ab initio potential energy surfaces [Citation118], which can mate angulons with ab initio calculations.
3.2. Large clusters and metal-molecular complexes
Binary and larger clusters are active research areas in chemical physics. By comparing the measured spectra to the results of quantum chemical calculations, accurate multidimensional binary potentials can be obtained. Studying larger clusters containing thousands of particles may shed light on the details of convergence to bulk properties and structure information. Superfluid helium droplets provide an ideal environment for assembly of cold single and multi-component clusters upon capture of molecules. The helium droplet technique has enabled the study of unstable metal-molecular clusters or reactive radical-molecular complexes, which will be highlighted in this section and the following section, respectively. He droplets were also integral to the search for superfluidity in small doped para-hydrogen clusters [Citation119,Citation120].
Large varieties of small clusters have been studied in He droplets [Citation15,Citation19,Citation25], including SF6 [Citation6,Citation57], (CH4)n [Citation76], HCN-(Mg)n [Citation121], (Ar)n-HF [Citation122], HCN-(Ag)n [Citation123], and Al-(CO)n [Citation124]. The structure of the binary clusters obtained in He droplets often corresponds to the global energy minimum. In clusters containing three or more molecules, isomers are often observed. In clusters larger than two to six particles, depending on the molecules, bands due to unique cluster sizes and/or structures often remain unresolved. Clusters featuring hydrogen bonding, such as (H2O)n [Citation67,Citation68,Citation72,Citation125], (NH3)n [Citation126], (HF)n [Citation127], (HCl)n [Citation128], (CH3OH)n [Citation61,Citation129], and (HCl)n-(H2O)n [Citation130–Citation132] are characterized by the formation of cyclic structures containing up to 6 molecular units, such as those obtained in water clusters [Citation67], see Panel (a) in . In He droplets, pre-formed cycles (e.g. cyclic trimers) are capable of growing to cyclic tetramers and larger clusters by addition of other units. This effect is likely related to some quantum mechanical tunneling, enabling an incoming molecule to surpass a potential barrier associated with the insertion. Clusters of HCN [Citation62] (shown in panel (b) of ) and HCCCN [Citation60] form chains of up to 10 molecular units in He droplets. Assembly of the long chains is facilitated by long range dipole-dipole interaction and stabilizing effect of the cold He environment.
Figure 6. Small water (a) and HCN (b) clusters obtained in He droplets in Refs. [Citation67] and [Citation62], respectively. Panel (c) shows the spectra of (NNH3)n clusters of different sizes in He droplets: NHe = 3.5 × 10³ (traces a and b). NHe = 1.2 × 10⁴ (trace c); NHe = 2.1 × 10⁴ (traces d and e); NHe = 2.5 × 10⁶ (traces f and g); and NHe = 1.4 × 10⁷ (trace h). The average number of ammonia molecules captured by the droplets is shown in each panel. Vertical solid lines at 3210, 3280, and 3374 cm−1 indicate the positions of the spectral maxima in the ammonia crystal, while the vertical dashed lines indicate the origins of the 2ν4(l = 0), 2ν4(l = 2), ν1, and ν3 bands of single ammonia molecules in He droplets at 3216.1, 3238.7, 3335.8, and 3443.1 cm−1, respectively. Adapted from Ref. [Citation74] with permission.
![Figure 6. Small water (a) and HCN (b) clusters obtained in He droplets in Refs. [Citation67] and [Citation62], respectively. Panel (c) shows the spectra of (NNH3)n clusters of different sizes in He droplets: NHe = 3.5 × 10³ (traces a and b). NHe = 1.2 × 10⁴ (trace c); NHe = 2.1 × 10⁴ (traces d and e); NHe = 2.5 × 10⁶ (traces f and g); and NHe = 1.4 × 10⁷ (trace h). The average number of ammonia molecules captured by the droplets is shown in each panel. Vertical solid lines at 3210, 3280, and 3374 cm−1 indicate the positions of the spectral maxima in the ammonia crystal, while the vertical dashed lines indicate the origins of the 2ν4(l = 0), 2ν4(l = 2), ν1, and ν3 bands of single ammonia molecules in He droplets at 3216.1, 3238.7, 3335.8, and 3443.1 cm−1, respectively. Adapted from Ref. [Citation74] with permission.](/cms/asset/e9581424-d88c-4126-b8cb-fe071835edfc/tapx_a_1553569_f0006_oc.jpg)
The average size of the obtained clusters is limited by the droplet’s size. On the other hand, droplets larger than about 107 atoms may contain quantum vortices that serve as recombination centers and may catalyze the formation of multiple elongated clusters [Citation43]. Even if devoid of vortices, the assembly of clusters in large droplets of NHe >106–107 may include multi-center aggregation with formation of cluster-cluster aggregates [Citation40]. It follows that the droplets should be smaller than ~107 atoms to serve as hosts for formation of single clusters that grow by addition of particles one by one. The maximum number of particles in the obtained single clusters depends on the formation enthalpy and is in the range of several hundred to several thousand particles for metallic and molecular clusters, respectively.
) shows a series of depletion infrared spectra of ammonia clusters having different average numbers of molecules in the spectral range of 3100–3500 cm−1 [Citation74]. Trace (a) corresponds to the smallest average number of captured molecules per droplet of <NNH3 ≥0.2 and shows sharp ro-vibrational transitions in single NH3 molecules, such as the fundamental symmetric (ν1) and asymmetric stretching (ν3) modes and two weak bands for the overtone of the asymmetric bending (2ν4) modes. Trace (b), at <NNH3 ≥1, shows bands corresponding to dimers and trimers along with the increasing intensity of the bending modes and decreasing intensity of the symmetric stretching mode in the clusters. The sudden rise in the intensity of the 2ν4 mode was assigned to borrowed intensity from the ν1 and ν3 stretching modes. Traces (b) – (e) suggest a strong interaction between all four vibrational modes within the small clusters. As <NNH3> is further increased in traces (f)–(h), the intensity of the ν1 and 2ν4 bands decreases while the ν3 vibrational band feature intensifies and shifts to approximately the frequency (3374 cm−1) that is also observed in crystalline ammonia. The appearance of the spectra similar to those in bulk solid ammonia indicates that the clusters in LHe have a compact structure, characteristic to close packing. The hydrogen bonding coordination within the cluster should be like that of ammonia crystals. In Ref. [Citation74], it was conjectured that, as the molecules approach the surface of the cluster in the droplet, they have enough time to assume a preferable orientation due to the interaction with molecules on the surface of the cluster somewhat similar to the effect of the dipole guiding observed in HCN chains [Citation62].
Helium droplets enable production of complex metal-molecular clusters, whose formation can be challenging due to a large mismatch in the enthalpy of aggregation [Citation133–Citation135]. shows the spectra of silver (Ag) – ethane (Et) clusters in the range of ethane C-H stretch vibrations, such as parallel ν5(||) and perpendicular ν7(┴) bands [Citation133,Citation134] and a weak ν8+11(||) combination band. Spectra in ) were obtained upon pickup first of Ag atoms, then Et molecules [Citation134], whereas the order is reversed in ) [Citation133]. Splitting of the ν7 band is shown in ), which is consistent with the formation of the compact silver cluster core getting coated by ethane molecules. The low-frequency peak (I) is stronger with smaller number of added ethane molecules and is assigned to ethane molecules at the interface of silver clusters. The higher-frequency peak (V) gets stronger in clusters with larger number of ethane molecules and is assigned to molecules further away and not in immediate contact with Ag cluster. This Ag core – Et shell arrangement is depicted on the right side of ). A larger shift in the interface peak I indicates a stronger interaction of ethane with silver atoms than with other ethane molecules present further outside. As more ethane molecules are added (going from red to blue curve), the intensity of V peak rises. This rising intensity suggests that, upon filling of the first shell around the Ag cluster, the added ethane molecules reside in a second (and more distant) solvation shell. The number of ethane molecules in each shell can be obtained via I and V peak intensities [Citation134]. The spectra in ) obtained with the reversed pickup order also shows a splitting of the ν7 band into I and V peaks. For small number (N ~1600) of Et molecules added, a compact Et core is formed despite being energetically unfavorable due to a large difference in the enthalpy of aggregation for Ag and Et [Citation133]. The ethane core is likely stabilized due to the fast dissipation of the heat of formation Ag and Et clusters in droplets. However, with larger number of added ethane molecules (N ~2700), the intensity of the V band remains constant upon addition of Ag atoms as shown in ). This stagnant intensity is indicative of a branched ethane structure instead of a compact core. As the number of Ag atoms is increased, the Ag atoms saturate the interface of the ramified Et structure leading to a rise in the intensity of the I band. Moreover, the Ag shell around the Et core does not show any metallic behavior in the IR spectra of Et, thereby confirming that Ag atoms do not coagulate into a single compact cluster. Other composite clusters of metal atoms and small hydrocarbon molecules have been studied in helium droplets [Citation121,Citation135–Citation137].
Figure 7. Infrared spectra of Ag – Et clusters in helium droplets consisting of ~105–106 atoms. The ν5(||), ν8+11(||), and ν7(┴) bands of Et are labelled. In (a), droplets were doped first with Ag followed by Et (Ag core-Et shell cluster as shown in the upper right pictogram). The depletion spectra are recorded upon capture of different number of ethane molecules in the downstream pickup cell. In (b), droplets were first doped with Et followed by Ag leading to the formation of Et core-Ag shell clusters as shown in the lower right pictogram. In both a) and b), the ν7 peak is split in two: I (interfacial) and V (volume). The frequency of three transitions in clusters (dotted line) is blue shifted compared to free molecule (dashed line) due to Ag–Et interactions. Adapted from Ref. [Citation133,Citation134].
![Figure 7. Infrared spectra of Ag – Et clusters in helium droplets consisting of ~105–106 atoms. The ν5(||), ν8+11(||), and ν7(┴) bands of Et are labelled. In (a), droplets were doped first with Ag followed by Et (Ag core-Et shell cluster as shown in the upper right pictogram). The depletion spectra are recorded upon capture of different number of ethane molecules in the downstream pickup cell. In (b), droplets were first doped with Et followed by Ag leading to the formation of Et core-Ag shell clusters as shown in the lower right pictogram. In both a) and b), the ν7 peak is split in two: I (interfacial) and V (volume). The frequency of three transitions in clusters (dotted line) is blue shifted compared to free molecule (dashed line) due to Ag–Et interactions. Adapted from Ref. [Citation133,Citation134].](/cms/asset/4489d50d-f888-4fbb-987c-db636016ab64/tapx_a_1553569_f0007_oc.jpg)
3.3. Radicals and pre-reactive complexes
Reaction dynamics that involve free radicals are integral to a wide range of chemical applications, including atmospheric and combustion sciences [Citation138,Citation139]. The entrance and exit channel complexes corresponding to the reactants and products of a chemical reaction, respectively, are a result of weak van der Waals interactions. For example, the reaction between atomic chlorine and simple alkanes depends on the shape and location of the exit channel valley on the potential energy surface whose product state distribution can be controlled [Citation140]. Mapping of the potential energy landscape in the entrance and exit channels of some prototypical reactions through studying corresponding entrance and exit channel complexes may help in understanding the underlying dynamics of reactions. At low temperatures, vibrational excitation may be exploited to overcome the barrier that prevents the entrance channel complex from reacting. Previously, matrix isolation and free jet expansion methods have been employed to stabilize and study highly reactive species [Citation140–Citation145]. Helium nanodroplets retain the freedom of motion of dopants while maintaining a cold environment, making them ideal for trapping and stabilizing reactive species.
Radicals are produced by low-pressure pyrolysis, yielding a high degree of dissociation of the precursors, which is pivotal for depletion spectroscopy [Citation19,Citation146]. The droplets are doped by an effusive beam emanating from a hot quartz capillary tube. Halogenated organic molecules have been widely applied in groups of R. Miller and G. Douberly for doping He droplets with radicals. Many radicals, such as propargyl (C3H3*) [Citation146], methyl (CH3*) [Citation147], ethyl (C2H5*) [Citation148], allyl (C3H5*) [Citation149–Citation151], propyl (C3H7*) [Citation152], cyclopentadienyl (C5H5*) [Citation153], tropyl (C7H7*) [Citation154], hydroxyl radicals [Citation155] and I, Br, Cl and F atoms [Citation156], have been produced via pyrolysis of the corresponding precursors.
Cyclopentadiene (cp), C5H6, and its radical form (C5H5*) are important intermediates in soot formation [Citation153,Citation157]. Recently, cp radicals have been studied in He droplets upon pyrolysis of nickelocene [Citation153]. The obtained C-H stretch spectra are shown in ). The red trace recorded as a depletion at m/z = 39 shows three distinct peaks at 3056.3, 3086.9, and 3117.3 cm−1 which were assigned to the cp radical monomers. The blue trace shows the spectrum obtained at higher pickup pressures, featuring two additional bands at 3103 cm−1 and 3109 cm−1. Those peaks are also discernable in the upper trace but are of weak intensity. The black trace was recorded with a room temperature source and shows a peak at 3113 cm−1 identified as nickelocene. It is seen that, even though there is only one IR-active vibrational mode for this radical (the CH stretching mode), the transition at v = 3086.9 cm−1 is split due to Jahn-Teller distortions into two peaks at 3056.3 and 3117.3 cm−1. Furthermore, calculations [Citation153] show that pseudo-rotation of the cp radical is barrier-less, so a symmetric structure is observed when the cp radical is in helium droplets. These distortions and insights about the pseudo-rotation barrier help map out the potential energy surface of this radical that is important for understanding soot formation mechanisms and other chemical applications.
Figure 8. Shown in (a) are the infrared spectra in the range of 3020–3120 cm−1 of a single cyclopentadienyl radical (red trace), a dimer of cyclopentadienyl radicals (blue trace), and the precursor of cyclopentadiene (nickelocene, black trace). The radical spectra were recorded at an oven temperature of 900°C using mass channel m/z = 39, whereas the precursor spectrum was recorded at room temperature and m/z ≥ 8. Adapted from Ref. [Citation153]. Shown in (b) is the depletion spectrum of OH-CH4 complex measured at m/z = 19. Adapted from Ref. [Citation158].
![Figure 8. Shown in (a) are the infrared spectra in the range of 3020–3120 cm−1 of a single cyclopentadienyl radical (red trace), a dimer of cyclopentadienyl radicals (blue trace), and the precursor of cyclopentadiene (nickelocene, black trace). The radical spectra were recorded at an oven temperature of 900°C using mass channel m/z = 39, whereas the precursor spectrum was recorded at room temperature and m/z ≥ 8. Adapted from Ref. [Citation153]. Shown in (b) is the depletion spectrum of OH-CH4 complex measured at m/z = 19. Adapted from Ref. [Citation158].](/cms/asset/6e6e844d-0399-4cad-8346-67f789af2ef6/tapx_a_1553569_f0008_oc.jpg)
Helium droplets facilitate the stabilization of complexes of species which would otherwise react at higher temperatures. As an example, the OH∙∙∙CH4 entrance channel complex (binding energy ≈210 cm−1) has recently been investigated in helium droplets [Citation158]. ) shows the depletion spectra of the complex in the OH stretch region which were recorded at low and high laser powers, as depicted by black and red curves, respectively. It is seen that the Q branch transitions are represented by three peaks (3562.024 cm−1, 3562.084 cm−1, 3562.177 cm−1) which correspond to methane in three nuclear spin configurations A, F and E with internal angular momenta jCH4 = 0,1,2, respectively, and statistical weights of 5:9:2 [Citation159]. This splitting is also visible in the R branch region of the spectra. Deuterated complexes were also studied to shed light on the speed of vibrational energy relaxation within the complex through observed linewidths. Pre-reactive complexes [Citation156,Citation160] and other hydroxyl-based species have additionally been studied recently [Citation161–Citation163].
3.4. Molecular alignment in electric field
Alignment of molecules in an electric field along their permanent dipole moment vector (µ) in the laboratory frame can be advantageous for IR spectroscopy. However, the degree of practically achievable alignment is often limited by the highest electric field before electrical breakdown, rotation temperature of the molecules, and ability for molecules to relax into their lowest states. Thermalization of molecules inside cold droplets addresses the later problems [Citation19]. Given E = 50 kV/cm, µ = ~2D at T = 0.4 K, one can achieve ≈ 0.8 using the classical Langevin-Debye equation, where
is the angle between the molecular dipole and the direction of the field in the laboratory frame [Citation164,Citation165]. Infrared depletion experiments of aligned molecules in helium droplets can help determine the vibrational transition moment angles (VTMA) with respect to the permanent dipole moment. Experimental VTMA, in conjunction with quantum chemical calculations, can concede conformer assignment and determination of the structure of clusters and pre-reactive complexes. In comparison, alignment of free molecules in strong pulsed laser field has recently been introduced [Citation166–Citation168]. Meanwhile, laser-induced alignment has been extended to dimers and trimers of linear triatomic molecules enabling imaging of the structure of molecular complexes [Citation169,Citation170].
In a VTMA experiment, helium droplets containing dipolar molecules pass through a plane capacitor, such as those shown in gold in [Citation171]. Because the laser-droplet interaction region is limited in the capacitors, the laser beam crosses the droplet beam approximately perpendicular upon multiple reflections on a set of plane mirrors (shown as gray slabs in ). shows the CN-stretch spectra of linear cyanoacetylene molecules (HCCCN, µ = 3.724 D, BHe = 1573.6 MHz) [Citation172] in 4He droplets recorded with increasing electric field strength. Without an applied field, the spectrum (low trace) shows well resolved P (ΔJ = −1) and R (ΔJ = +1) lines of the ro-vibrational spectrum devoid of any Q (ΔJ = 0) branch lines. With increasing field strength, the spectra show Stark shifts, splitting of the P- and R- lines, and the appearance of a prominent Q branch. At the highest field (upper trace), a sizable part of the spectral intensity is concentrated within the Q-branch. As shown in the pictogram on the right in , the randomly oriented molecules align along the applied field as the potential difference increased from 0 to 10 kV. In the high field regime, the electric dipole energy is much greater than the energy of the thermally populated rotational states, so free rotation is replaced by libration of molecules around the electric field, which is described by motion in a parabolic potential [Citation164,Citation173,Citation174]. The Stark spectra get more complex for open shell molecules, such as radicals [Citation60,Citation162,Citation163,Citation175,Citation176]. One such example is that of hydroxyl radical (OH) which shows Ʌ-doubling of the Q(3/2) rotational branch [Citation155]. By varying the electric field (0–50 kV/cm) and laser polarizations, the value of this Ʌ-doubling can be obtained. The measurements in electric fields yielded magnitude of permanent molecular dipole moment of the studied species [Citation177,Citation178]. The obtained values were found to be somewhat smaller (<1%) than in the gas phase, which was ascribed to the induced polarization of the helium solvent [Citation178,Citation179]. A correction of the dipole moment for the effect of He was discussed in Ref. [Citation19].
Figure 9. A 3D rendering of the VTMA experiment. The Grey slabs are the mirrors which reflect the laser (orange lines). Potential is applied to the plates (golden) placed perpendicular to the mirrors. After entering the cell, the randomly oriented dipoles align parallel to the field along z-direction.
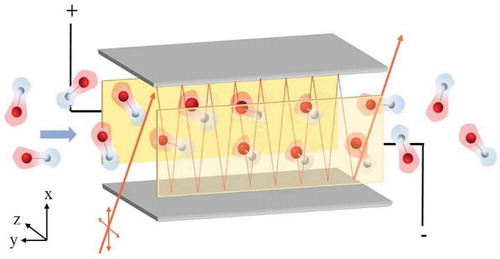
Figure 10. Stark spectroscopy in helium droplets. Shown is the spectrum of HCCCN in 4He droplets at different electric field potential (0–10 kV) [Citation60]. Alignment of molecular dipoles is shown in pictogram on the right. The spectra has been obtained and modified with permission from Ref. [Citation60].
![Figure 10. Stark spectroscopy in helium droplets. Shown is the spectrum of HCCCN in 4He droplets at different electric field potential (0–10 kV) [Citation60]. Alignment of molecular dipoles is shown in pictogram on the right. The spectra has been obtained and modified with permission from Ref. [Citation60].](/cms/asset/d2c1215e-a737-44dc-a64e-e80e2e2ab2b0/tapx_a_1553569_f0010_oc.jpg)
In large molecules with coexisting structural isomers, assigning the experimentally observed spectra may be challenging. Moreover, for larger molecules in He, the rotational structure of the bands is usually unresolved. Assigning bands in the spectra of low-symmetry polyatomic molecules or molecular clusters is additionally complicated by the large number of vibrational modes. Therefore, additional information, such as the orientation of the transition dipole moment (µT) for a particular band with respect to the molecular permanent dipole moment (µ) – VTMAs (α), can be useful for the assignment of the vibrational modes and molecular conformers. shows an application of VTMA for the assignment of the most stable conformer of the adenine molecule [Citation180,Citation181]. VTMAs are obtained by applying a linearly polarized laser field at different angles with respect to the electric field. This idea is illustrated in with three different modes of the adenine molecule: NH2 symmetric, NH2 asymmetric, and NH stretch. The transition dipole for the NH2 asymmetric stretch (golden dashed lines, µAS), is at an angle <54.7° with respect to electric field (µD) and shows an intensity rise when ELaser ‖ EDC, i.e. parallel polarization. The black dotted curve is the reference spectra with no field. While the symmetric NH2 and NH stretch transition dipoles (red dashed lines), have µSS and µNH at an angle >54.7° with respect to µD and show intensity rise for ELaser ┴ EDC, i.e. perpendicular polarizations. The values of the VTMAs are determined by comparison of the electric field dependence of the band intensities for parallel and perpendicular polarizations [Citation180]. An accurate orientation distribution of permanent dipole moments is needed for quantitative analysis. The distribution depends on molecules’ temperature, electric field, magnitude of dipole moment and rotational constant [Citation19,Citation164,Citation180,Citation181]. Because the rotational structure may not be resolved in the spectra of larger molecules, the determination of VTMA is based on the ab initio rotational constants, which are decreased by a factor of 3 to account for the effect of He environment [Citation180–Citation182]. VTMA measurements have become a useful technique and have been applied to different systems such as imidazole [Citation183], tryptamine [Citation184], guanine [Citation185], and uracil [Citation186] for conformer identification. Electric field study in helium droplets have also been employed for structure determination of molecular complexes, such as (HF)n [Citation127], (H2O)m-(HCl)n [Citation130], H2O clusters [Citation187], and others [Citation183,Citation184,Citation188]. VTMA was also instrumental in determination of the structure and spectral assignment of pre-reactive complexes [Citation162,Citation163,Citation175,Citation176,Citation178].
Figure 11. VTMA study of adenine [Citation180]. On top, a DC field aligns the permanent molecular dipole (Green solid line, μD) to the laboratory frame. A parallel laser field (ELaser ‖ EDC) rises the mode intensity for (Golden peak, μAS), while a perpendicular laser field (ELaser ┴ EDC) rises the mode intensity for
(Red peak, μNH, μSS). The dotted black trace represents the zero field peak. Bottom figure shows the intensity variation of (a) NH2 (Sym), (b) NH, (c) NH2 (Asym) stretches when laser polarization is parallel (top) and perpendicular (bottom) to the electric field. The middle spectrum was measured at zero field. Boxes (a) and (b) show enhanced intensity for perpendicular polarization while (c) shows raised intensity for parallel polarization.
![Figure 11. VTMA study of adenine [Citation180]. On top, a DC field aligns the permanent molecular dipole (Green solid line, μD) to the laboratory frame. A parallel laser field (ELaser ‖ EDC) rises the mode intensity for α<54.7∘ (Golden peak, μAS), while a perpendicular laser field (ELaser ┴ EDC) rises the mode intensity for α>54.7∘ (Red peak, μNH, μSS). The dotted black trace represents the zero field peak. Bottom figure shows the intensity variation of (a) NH2 (Sym), (b) NH, (c) NH2 (Asym) stretches when laser polarization is parallel (top) and perpendicular (bottom) to the electric field. The middle spectrum was measured at zero field. Boxes (a) and (b) show enhanced intensity for perpendicular polarization while (c) shows raised intensity for parallel polarization.](/cms/asset/4bbda4fd-1c11-4cf2-b306-276bd1dad12b/tapx_a_1553569_f0011_oc.jpg)
3.5. Molecular ions
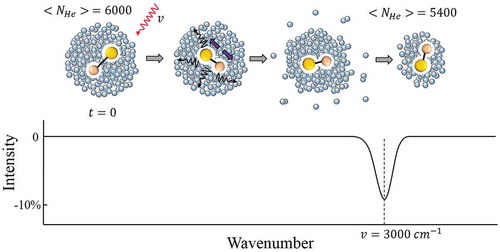
Molecular ions are important intermediates present in diverse environments ranging from biological cells to the interstellar medium. However, ions remain much less studied spectroscopically compared to neutral species, partially due to experimental complexity involving action spectroscopy and difficulty in cooling ions to low temperatures. Ion traps filled with cryogenic buffer gas have recently been exploited for spectroscopic study of ions at T = 10–20 K [Citation189–Citation193]. Helium droplets provide a viable alternative for cooling ions of all sizes to even lower temperatures of ~0.4 K. The ions can be produced by photoionization of the neutral dopants, or captured from an electrospray source. Employing standard depletion spectroscopy is not feasible because of the low fraction of droplets doped with ions in the beam. Instead, ejection of ions from the droplets upon IR excitation is used for spectroscopy.
Spectroscopy of ions in helium droplets became possible after discovering that doped ions leave the droplet following pulsed vibrational or electronic excitation [Citation55,Citation194]. It was conjectured that the ejection is a non-thermal process, triggered by fast release of the excitation energy into the droplet [Citation194–Citation197]. While the mechanism of the ejection process is not entirely understood, the technique itself is pivotal for ion spectroscopy. Recent experiments revealed that the intensity of the ejection signal rises faster than linear with the laser pulse energy [Citation198]. This effect indicates a nonlinear character of the ejection, and may potentially complicate the interpretation of the results. As a result, the obtained intensities are not necessarily proportional to the infrared intensities of the bands typically obtained from quantum chemical calculations. illustrates ion ejection spectroscopy and shows the spectra of aniline ions in helium droplets [Citation194]. In the spectra, the intensity is proportional to the number of bare ions ejected upon IR irradiation. In Ref. [Citation194], the droplets containing ~5000 helium atoms were first doped by aniline molecules. Aniline ions were created through resonant two-photon ionization at 293.26 nm corresponding to S0←S1 band origin of aniline molecules. Two hundred ns after ionization, the embedded ions were exposed to pulsed IR radiation, triggering the ejection of ions. The measured spectra in the NH stretch (top) and NH overtone (bottom) regions are shown on the left in . In the fundamental range, a strong absorption at 3395.1 cm−1 corresponds to the NH vibration, and a weak absorption at 3270.5 cm−1 to NH2 scissoring mode. The bands have rather narrow widths of the order of ~1–2 cm−1, which is comparable to those for neutral molecules in He droplets [Citation194]. The bandwidths differ for different vibration modes presumably due to their different relaxation rates in liquid helium. Observation of the overtone bands is a testament to the high sensitivity of ejection spectroscopy. Furthermore, ejection spectroscopy is baseline free, unlike the standard depletion technique. Therefore, weak signals of just few ions per laser pulse may be reliably detected.
Figure 12. Spectra of aniline ions in helium droplets (Left) [Citation194]. The top left panel shows spectrum in the frequency range of NH stretching and NH2 scissoring modes, along with a magnified spectra of the two bands. The bottom panel shows the spectrum in the frequency range of the overtones. The pictogram on the right illustrates the ion ejection spectroscopy. Embedded aniline ions are produced via laser resonance multiphoton ionization. The resulting ions absorb several quanta of IR leading to the ejection of bare ions.
![Figure 12. Spectra of aniline ions in helium droplets (Left) [Citation194]. The top left panel shows spectrum in the frequency range of NH stretching and NH2 scissoring modes, along with a magnified spectra of the two bands. The bottom panel shows the spectrum in the frequency range of the overtones. The pictogram on the right illustrates the ion ejection spectroscopy. Embedded aniline ions are produced via laser resonance multiphoton ionization. The resulting ions absorb several quanta of IR leading to the ejection of bare ions.](/cms/asset/6224e5af-b785-42a3-afd3-4c33ef82215b/tapx_a_1553569_f0012_oc.jpg)
While resonance multiphoton ionization is only feasible with specific molecules, electrospray ionization (ESI) provides a universal technique for bringing large ions, such as proteins, into the gas phase [Citation195,Citation196,Citation198–Citation200]. However, the low density of ions in electrospray has warranted a considerable modification of the pickup technique which involves ion traps. Briefly, in the experiment, the ions obtained from ESI are mass-to-charge selected by a QMS. The selected ions are stored in a linear hexapole ion trap (200Vpp, 1.1 MHz RF) placed coaxially with the pulsed He droplet beam [Citation199]. The end electrodes of the trap are kept ~1–3 volts above the trap potential, just enough to ensure trapping of ions and allowing high kinetic energy droplets to pass. The excess energy of the stored ions is removed through collisions with helium buffer gas (introduced via pulses). He droplets pick up the ions from the trap and are then exposed to an IR beam from a free electron laser (FEL), which causes the ejection of the ions [Citation198]. shows the IR spectra for protonated pentapeptide leu-enkephaline [Leu-Enk+H]+ in helium droplets [Citation198]. The spectra were recorded by detecting the signal of the ejected ions, m/z = 556. Major peaks corresponding to the carbonyl stretches of each of the five amino acids were observed along with an unidentified feature at ~1744 cm−1. A broad intense peak at 1523 cm−1 was assigned to the N-H bend of the amino acids. The modes due to individual functional group, in proteins could not be resolved. However, conformer evolution can be monitored through changes made in the protein’s charge state [Citation201]. The linewidths of the bands resemble those obtained from gas phase spectra, indicating that liquid helium does not induce any substantial broadening [Citation195,Citation198]. However, the spectra of [Leu-Enk+H]+ in He do not appear narrower than at presumably higher temperature in the gas phase [Citation198], indicating that the observed linewidth may be intrinsic. Compared to the FEL linewidth, which is ~0.5% of the frequency, the intrinsic width can be estimated of the order of a few wavenumbers. The band centers of [Leu-Enk+H]+ in He show a small red shift (~11 cm−1) with respect to the gas phase values. This shift is larger than previously observed for neutrals in He [Citation18,Citation19,Citation21,Citation59] and is likely caused by the stronger interaction of charged particles with the He environment. This shift appears to be smaller in larger ions, as compared to smaller ions, presumably because of a larger separation of the charge center from the helium atoms in the former [Citation198]. With the advent of FEL IR facilities, which offer wide spectral tunability and large photon flux, spectroscopic studies of charged species have become more facile [Citation195,Citation198,Citation201–Citation204]. Aside from cations, anions have recently been investigated in He droplets [Citation205,Citation206]. The transition lines of anions are narrow and appear close to the corresponding gas phase frequencies. Moreover, well-resolved spectra of large carbohydrates have also been achieved in He droplets [Citation204]. With considerable improvement in light sources and molecular cooling techniques, spectroscopic interpretation of more complex ions and metastable species is on the horizon.
Figure 13. IR spectrum of Leu-Enk in He droplets showing C-O and N-H stretches and N-H bend from containing aminoacids [Citation198].
![Figure 13. IR spectrum of Leu-Enk in He droplets showing C-O and N-H stretches and N-H bend from containing aminoacids [Citation198].](/cms/asset/67c4aede-f520-4770-9950-68a68b5f3b1b/tapx_a_1553569_f0013_oc.jpg)
4. Conclusions
Since its inception in the early 1990s, infrared spectroscopy in He droplets has become a versatile technique for studying molecular systems. This technique enables efficient cooling of trapped species to the droplets’ temperature of ~0.4 K, wherein all molecular vibrational modes freeze out. The initial experiments were devoted to the study of single molecules and small complexes. These studies produced highly-resolved ro-vibrational spectra enabling interrogation of the interaction of molecular rotors with their superfluid environment. More recently, the application of spectroscopy in He droplets has been extended to more complex systems including large clusters, radicals and their complexes and molecular ions. By varying the amount and order of pickup, materials with vivid structures and patterns can be realized in droplets. For example, large ammonia clusters having crystalline structure have been observed along with two distinct core shell arrangements of silver and ethane clusters. Alignment of the dipolar molecules and molecular complexes is now a useful tool for assigning the vibrational bands and the isomeric structure of molecules and complexes. Metastable species, such as radicals and pre-reactive complexes, can be generated and studied inside droplets which is challenging in gas phase experiments. Obtaining spectra for the embedded charged species has been possible recently through new discoveries. The contents presented in this review highlights only a fraction of developments in this field, which promises exciting future research.
Acknowledgments
This research was supported through National Science Foundation Grant CHE-1664990. We are grateful to Gert Von Helden, Mikhail Lemeskho, Marcel Drabbels, and Alexandra Feinberg for commenting on the manuscript.
Disclosure statement
No potential conflict of interest was reported by the authors.
Additional information
Funding
References
- E. Whittle, D.A. Dows and G.C. Pimentel, J. Chem. Phys. 22 (1954) p.p.1943. doi:10.1063/1.1739957.
- B.S. Ault, Frontiers and Advances in Molecular Spectroscopy, J. Laane, Elsevier, Amsterdam, 2018, p.149.
- A.J. Barnes, J. Mol. Struct. 1163 (2018) p.77. doi:10.1016/j.molstruc.2018.01.045.
- A. Scheidemann, J.P. Toennies and J.A. Northby, Phys. Rev. Lett. 64 (1990) p.1899. doi:10.1103/PhysRevLett.64.1899.
- S. Goyal, D.L. Schutt and G. Scoles, Phys. Rev. Lett. 69 (1992) p.933. doi:10.1103/PhysRevLett.69.3647.
- R. Frochtenicht, J.P. Toennies and A. Vilesov, Chem. Phys. Lett. 229 (1994) p.1.
- M.E. Jacox, Chem Soc. Rev. 31 (2002) p.108. doi:10.1039/b102907j.
- J. Wilks, The Properties of Liquid and Solid Helium, Oxford University Press, Oxford, 1967.
- I.M. Khalatnikov, An Introduction to the Theory of Superfluidity, Addison-Wesley Publishing Company Inc., New York City, 1989.
- D.R. Tilley and J. Tilley, Superfluidity and Superconductivity, Institute of Physics Pubslishing, Bristol, 1990.
- L. Pitaevskii and S. Stringari, Bose-Einstein Condensation and Superfluidity, Oxford University Press, Oxford, 2016.
- F. Stienkemeier, J. Higgins, W.E. Ernst and G. Scoles, Phys. Rev. Lett. 74 (1995) p.3592. doi:10.1103/PhysRevLett.74.3715.
- F. Ancilotto, E. Cheng, M.W. Cole and F. Toigo, Z. Phys. B. 98 (1995) p.323. doi:10.1007/BF01338398.
- F. Dalfovo, Z. Phys. D. 29 (1994) p.61. doi:10.1007/BF01437166.
- C. Callegari, K.K. Lehmann, R. Schmied and G. Scoles, J. Chem. Phys. 115 (2001) p.10090. doi:10.1063/1.1418746.
- F. Stienkemeier and A.F. Vilesov, J. Chem. Phys. 115 (2001) p.10119. doi:10.1063/1.1415433.
- J.P. Toennies and A.F. Vilesov, Annu. Rev. Phys. Chem. 49 (1998) p.1. doi:10.1146/annurev.physchem.49.1.1.
- J.P. Toennies and A.F. Vilesov, Angew. Chem. Int. Ed. 43 (2004) p.2622. doi:10.1002/anie.200300611.
- M.Y. Choi, G.E. Douberly, T.M. Falconer, W.K. Lewis, C.M. Lindsay, J.M. Merritt, P.L. Stiles and R.E. Miller, Int. Rev. Phys. Chem. 25 (2006) p.15. doi:10.1080/01442350600625092.
- M. Barranco, R. Guardiola, S. Hernandez, R. Mayol, J. Navarro and M. Pi, J. Low. Temp. Phys. 142 (2006) p.1. doi:10.1007/s10909-005-9267-0.
- F. Stienkemeier and K.K. Lehmann, J. Phys. 39 (2006) p.p.R127.
- J. Tiggesbaumker and F. Stienkemeier, Chem. Chem. Phys. 9 (2007) p.4748. doi:10.1039/b703575f.
- A. Slenczka and J.P. Toennies, Low Temperatures and Cold Molecules, I.W.M. Smith, Imperial College Press, London, 2008, p.345.
- K. Szalewicz, Int. Rev. Phys. Chem. 27 (2008) p.273.
- C. Callegari and W.E. Ernst, Handbook of High-Resolution Spectroscopy, M. Quack and F. Merkt, John Wiley & Sons, Ltd., 2011, p.1551.
- M.P. Ziemkiewicz, D.M. Neumark and O. Gessner, Int. Rev. Phys. Chem. 34 (2015) p.239. doi:10.1080/0144235X.2015.1051353.
- R.M.P. Tanyag, C.F. Jones, C. Bernando, S.M.O. O’Connell, D. Verma and A.F. Vilesov, Cold Chemistry: Molecular Scattering and Reactivity Near Absolute Zero, O. Dulieu and A. Osterwalder, Royal Society of Chemistry, Cambridge, 2017, p. 401.
- F. Ancilotto, M. Barranco, F. Coppens, J. Eloranta, N. Halberstadt, A. Hernando, D. Mateo and M. Pi, Int. Rev. Phys. Chem. 36 (2017) p.621. doi:10.1080/0144235X.2017.1351672.
- S.F. Yang and A.M. Ellis, Chem. Soc. Rev. 42 (2013) p.472. doi:10.1039/C2CS35277J.
- J. Kupper and J.M. Merritt, Nat. Rev. Phys. Chem. 26 (2007) p.249. doi:10.1080/01442350601087664.
- A. Mauracher, O. Echt, A.M. Ellis, S. Yang, D.K. Bohme, J. Postler, A. Kaiser, S. Denifl and P. Scheier, Phys. Rep. 751 (2018) p.1. doi:10.1016/j.physrep.2018.05.001.
- M. Hartmann, R.E. Miller, J.P. Toennies and A. Vilesov, Phys. Rev. Lett. 75 (1995) p.1566. doi:10.1103/PhysRevLett.75.1711.
- S. Grebenev, J.P. Toennies and A.F. Vilesov, Science. 279 (1998) p.p.2083. doi:10.1126/science.279.5359.2083.
- S. Grebenev, M. Hartmann, M. Havenith, B. Sartakov, J.P. Toennies and A.F. Vilesov, J. Chem. Phys. 112 (2000) p.4485. doi:10.1063/1.481011.
- E. Loginov, L.F. Gomez and A.F. Vilesov, J. Phys. Chem. A. 115 (2011) p.7199. doi:10.1021/jp200198n.
- E. Latimer, D. Spence, C. Feng, A. Boatwright, A.M. Ellis and S.F. Yang, Nano Lett. 14 (2014) p.2902. doi:10.1021/nl501233g.
- A. Volk, P. Thaler, M. Koch, E. Fisslthaler, W. Grogger and W.E. Ernst, J. Chem. Phys. 138 (2013) p.214312. doi:10.1063/1.4807843.
- V. Mozhayskiy, M.N. Slipchenko, V.K. Adamchuk and A.F. Vilesov, J. Chem. Phys. 127 (2007) p.094701. doi:10.1063/1.2759927.
- A. Boatwright, C. Feng, D. Spence, E. Latimer, C. Binns, A.M. Ellis and S.F. Yang, Faraday Discuss. 162 (2013) p.p.113. doi:10.1039/c2fd20136d.
- E. Loginov, L.F. Gomez, N. Chiang, A. Halder, N. Guggemos, V.V. Kresin and A.F. Vilesov, Phys. Rev. Lett. 106 (2011) p.233401. doi:10.1103/PhysRevLett.106.233401.
- L.F. Gomez, K.R. Ferguson, J.P. Cryan, C. Bacellar, R.M.P. Tanyag, C. Jones, S. Schorb, D. Anielski, A. Belkacem, C. Bernando, R. Boll, J. Bozek, S. Carron, G. Chen, T. Delmas, L. Englert, S.W. Epp, B. Erk, L. Foucar, R. Hartmann, A. Hexemer, M. Huth, J. Kwok, S.R. Leone, J.H.S. Ma, F.R.N.C. Maia, E. Malmerberg, S. Marchesini, D.M. Neumark, B. Poon, J. Prell, D. Rolles, B. Rudek, A. Rudenko, M. Seifrid, K.R. Siefermann, F.P. Sturm, M. Swiggers, J. Ullrich, F. Weise, P. Zwart, C. Bostedt, O. Gessner and A.F. Vilesov, Science. 345 (2014) p.906. doi:10.1126/science.1252395.
- C. Bernando, R.M.P. Tanyag, C. Jones, C. Bacellar, M. Bucher, K.R. Ferguson, D. Rupp, M.P. Ziemkiewicz, L.F. Gomez, A.S. Chatterley, T. Gorkhover, M. Muller, J. Bozek, S. Carron, J. Kwok, S.L. Butler, T. Moller, C. Bostedt, O. Gessner and A.F. Vilesov, Phys. Rev. B. 95 (2017) p.064510. doi:10.1103/PhysRevB.95.064510.
- C.F. Jones, C. Bernando, R.M.P. Tanyag, C. Bacellar, K.R. Ferguson, L.F. Gomez, D. Anielski, A. Belkacem, R. Boll, J. Bozek, S. Carron, J. Cryan, L. Englert, S.W. Epp, B. Erk, L. Foucar, R. Hartmann, D.M. Neumark, D. Rolles, A. Rudenko, K.R. Siefermann, F. Weise, B. Rudek, F.P. Sturm, J. Ullrich, C. Bostedt, O. Gessner and A.F. Vilesov, Phys. Rev. B. 93 (2016) p.180510(R). doi:10.1103/PhysRevB.93.180510.
- R.M.P. Tanyag, C. Bernando, C.F. Jones, C. Bacellar, K.R. Ferguson, D. Anielski, R. Boll, S. Carron, J.P. Cryan, L. Englert, S.W. Epp, B. Erk, L. Foucar, L.F. Gomez, R. Hartmann, D.M. Neumark, D. Rolles, B. Rudek, A. Rudenko, K.R. Siefermann, J. Ullrich, F. Weise, C. Bostedt, O. Gessner and A.F. Vilesov, Struct. Dynam. 2 (2015) p.051102. doi:10.1063/1.4933297.
- D. Rupp, N. Monserud, B. Langbehn, M. Sauppe, J. Zimmermann, Y. Ovcharenko, T. Moller, F. Frassetto, L. Poletto, A. Trabattoni, F. Calegari, M. Nisoli, K. Sander, C. Peltz, M.J. Vrakking, T. Fennel and A. Rouzee, Nat. Commun. 8 (2017) p.493. doi:10.1038/s41467-017-00287-z.
- H. Buchenau, E.L. Knuth, J. Northby, J.P. Toennies and C. Winkler, J. Chem. Phys. 92 (1990) p.6875.doi:10.1063/1.458275.
- L.F. Gomez, E. Loginov, R. Sliter and A.F. Vilesov, J. Chem. Phys. 135 (2011) p.154201. doi:10.1063/1.3650235.
- M. Lewerenz, B. Schilling and J.P. Toennies, Chem. Phys. Lett. 206 (1993) p.381. doi:10.1016/0009-2614(93)85569-A.
- U. Henne and J.P. Toennies, J. Chem. Phys. 108 (1998) p.9327. doi:10.1063/1.476385.
- M.N. Slipchenko, S. Kuma, T. Momose and A.F. Vilesov, Rev. Sci. Instrum. 73 (2002) p.3600. doi:10.1063/1.1505661.
- D. Pentlehner, R. Riechers, B. Dick, A. Slenczka, U. Even, N. Lavie, R. Brown and K. Luria, Rev. Sci. Instrum. 80 (2009) p.043302. doi:10.1063/1.3117196.
- D. Verma and A.F. Vilesov, Chem. Phys. Lett. 694 (2018) p.129. doi:10.1016/j.cplett.2018.01.035.
- S. Kuma and T. Azuma, Cryogenics (Guildf). 88 (2017) p.78. doi:10.1016/j.cryogenics.2017.10.016.
- R. Sliter, L.F. Gomez, J. Kwok and A. Vilesov, Chem. Phys. Lett. 600 (2014) p.29. doi:10.1016/j.cplett.2014.03.053.
- N.B. Brauer, S. Smolarek, X.H. Zhang, W.J. Buma and M. Drabbels, J. Phys. Chem. Lett. 2 (2011) p.1563. doi:10.1021/jz200632s.
- R.J. Donnelly and C.F. Barenghi, J. Phys. Chem. Ref. Data 27 (1998) p.1217. doi:10.1063/1.556028.
- M. Hartmann, R.E. Miller, J.P. Toennies and A.F. Vilesov, Science. 272 (1996) p.1631. doi:10.1126/science.272.5268.1631.
- S. Grebenev, M. Havenith, F. Madeja, J.P. Toennies and A.F. Vilesov, J. Chem. Phys. 113 (2000) p.9060. doi:10.1063/1.1286243.
- S. Grebenev, B.G. Sartakov, J.P. Toennies and A.F. Vilesov, J. Chem. Phys. 118 (2003) p.8656. doi:10.1063/1.1566945.
- K. Nauta, D.T. Moore and R.E. Miller, Faraday Discuss. 113 (1999) p.p.261. doi:10.1039/a903027a.
- M. Behrens, R. Frochtenicht, M. Hartmann, J.G. Siebers, U. Buck and F.C. Hagemeister, J. Chem. Phys 111 (1999) p.2436. doi:10.1063/1.479521.
- K. Nauta and R.E. Miller, Science. 283 (1999) p.1895. doi:10.1126/science.283.5409.1895.
- K. Nauta and R.E. Miller, J. Chem. Phys. 113 (2000) p.9466. doi:10.1063/1.1319965.
- G.E. Douberly, K. Nauta and R.E. Miller, Chem. Phys. Lett. 377 (2003) p.384. doi:10.1016/S0009-2614(03)01045-5.
- D. Skvortsov, R. Sliter, M.Y. Choi and A.F. Vilesov, J. Chem. Phys. 128 (2008) p.094308. doi:10.1063/1.2834925.
- J. Zischang, D. Skyortsov, M.Y. Choi, R.A. Mata, M.A. Suhm and A.F. Vilesov, J. Phys. Chem. A. 119 (2015) p.2636. doi:10.1021/acs.jpca.5b06446.
- K. Nauta and R.E. Miller, Science. 287 (2000) p.p.293.
- K. Kuyanov-Prozument, M.Y. Choi and A.F. Vilesov, J. Chem. Phys. 132 (2010) p.014304. doi:10.1063/1.3276459.
- L.F. Gomez, R. Sliter, D. Skvortsov, H. Hoshina, G.E. Douberly and A.F. Vilesov, J. Phys. Chem. A. 117 (2013) p.13648. doi:10.1021/jp311003d.
- H. Hoshina, J. Lucrezi, M.N. Slipchenko, K.E. Kuyanov and A.F. Vilesov, Phys. Rev. Lett. 94 (2005) p.195301. doi:10.1103/PhysRevLett.94.107601.
- R. Lehnig and W. Jager, Chem. Phys. Lett. 424 (2006) p.146. doi:10.1016/j.cplett.2006.04.006.
- M.N. Slipchenko, K.E. Kuyanov, B.G. Sartakov and A.F. Vilesov, J. Chem. Phys. 124 (2006) p.241101. doi:10.1063/1.2216712.
- M.N. Slipchenko and A.F. Vilesov, Chem. Phys. Lett. 412 (2005) p.176. doi:10.1016/j.cplett.2005.06.100.
- M.N. Slipchenko, B.G. Sartakov and A.F. Vilesov, J. Chem. Phys. 128 (2008) p.134509. doi:10.1063/1.2884927.
- H. Hoshina, D. Skvortsov, B.G. Sartakov and A.F. Vilesov, J. Chem. Phys. 132 (2010) p.074302. doi:10.1063/1.3313925.
- H. Hoshina, D. Skvortsov, M.N. Slipchenko, B.G. Sartakov and A.F. Vilesov, J. Chem. Phys. 143 (2015) p.084305. doi:10.1063/1.4928694.
- K. Nauta and R.E. Miller, Chem. Phys. Lett. 350 (2001) p.225. doi:10.1016/S0009-2614(01)01294-5.
- H. Hoshina, M. Slipchenko, K. Prozument, D. Verma, M.W. Schmidt, J. Ivanic and A.F. Vilesov, J. Phys. Chem. A. 120 (2016) p.527. doi:10.1021/acs.jpca.5b10228.
- K. von Haeften, A. Metzelthin, S. Rudolph, V. Staemmler and M. Havenith, Phys. Rev. Lett. 95 (2005) p.215301. doi:10.1103/PhysRevLett.95.215301.
- B. Bobin, C.J. Borde, J. Borde and C. Breant, J. Mol. Spectrosc. 121 (1987) p.91.
- M. Hartmann, N. Portner, B. Sartakov, J.P. Toennies and A.F. Vilesov, J. Chem. Phys. 110 (1999) p.5109. doi:10.1063/1.479111.
- M. Lemeshko and R. Schmidt, Cold Chemistry: Molecular Scattering and Reactivity Near Absolute Zero, O. Dulieu and A. Osterwalder, Royal Society of Chemistry, Cambridge, 2017, p. 444.
- K. Kuyanov-Prozument, D. Skvortsov, M.N. Slipchenko, B.G. Sartakov and A. Vilesov, Physics and Chemistry at Low Temperatures, L. Khriachtchev, Pan Stanford, 2011, p.203.
- V.S. Babichenko and Y. Kagan, Phys. Rev. Lett. 83 (1999) p.3458. doi:10.1103/PhysRevLett.83.3458.
- D.M. Brink and S. Stringari, Z. Phys. D. 15 (1990) p.257. doi:10.1007/BF01437187.
- M. Pi, R. Mayol and M. Barranco, Phys. Rev. Lett. 82 (1999) p.3093. doi:10.1103/PhysRevLett.82.3093.
- Y. Kwon, P. Huang, M.V. Patel, D. Blume and K.B. Whaley, J. Chem. Phys. 113 (2000) p.6469. doi:10.1063/1.1310608.
- I. Reinhard, C. Callegari, A. Conjusteau, K.K. Lehmann and G. Scoles, Phys. Rev. Lett. 82 (1999) p.5036. doi:10.1103/PhysRevLett.82.5036.
- K.K. Lehmann, Mol. Phys. 97 (1999) p.645. doi:10.1080/002689799163497.
- M. Lemeshko, Phys. Rev. Lett. 118 (2017) p.095301. doi:10.1103/PhysRevLett.118.095301.
- B.G. Sartakov, J.P. Toennies and A.F. Vilesov, J. Chem. Phys. 136 (2012) p.134316. doi:10.1063/1.3697475.
- A.R.W. McKellar, Y.J. Xu and W. Jager, Phys. Rev. Lett. 97 (2006) p.183401. doi:10.1103/PhysRevLett.97.183401.
- A.R.W. McKellar, Chem. Phys. 128 (2008) p.044308.
- A.R.W. McKellar, J. Chem. Phys. 127 (2007) p.044315. doi:10.1063/1.2756537.
- W. Topic, W. Jager, N. Blinov, P.N. Roy, M. Botti and S. Moroni, J. Chem. Phys. 125 (2006) p.144310. doi:10.1063/1.2357604.
- L.A. Surin, A.V. Potapov, B.S. Dumesh, S. Schlemmer, Y. Xu, P.L. Raston and W. Jager, Phys. Rev. Lett. 101 (2008) p.233401. doi:10.1103/PhysRevLett.101.233401.
- A.R.W. McKellar, Y.J. Xu and W. Jager, J. Phys. Chem. A. 111 (2007) p.7329.
- D. Mateo, F. Gonzalez and J. Eloranta, J. Phys. Chem. A. 119 (2015) p.2262. doi:10.1021/acs.jpca.5b06446.
- F. Paesani, A. Viel, F.A. Gianturco and K.B. Whaley, Phys. Rev. Lett. 90 (2003) p.073401. doi:10.1103/PhysRevLett.90.094302.
- F. Paesani and K.B. Whaley, J. Chem. Phys 121 (2004) p.4180. doi:10.1063/1.1768931.
- R.E. Zillich, F. Paesani, Y. Kwon and K.B. Whaley, J. Chem. Phys. 123 (2005) p.114301. doi:10.1063/1.1998847.
- S. Moroni, A. Sarsa, S. Fantoni, K.E. Schmidt and S. Baroni, Phys. Rev. Lett 90 (2003) p.143401. doi:10.1103/PhysRevLett.90.094302.
- S. Paolini, S. Fantoni, S. Moroni and S. Baroni, J. Chem. Phys. 123 (2005) p.114306. doi:10.1063/1.2032969.
- H. Li and Y.T. Ma, J. Chem. Phys. 137 (2012) p.234310. doi:10.1063/1.4772186.
- F. Paesani, F.A. Gianturco and K.B. Whaley, J. Chem. Phys. 115 (2001) p.10225. doi:10.1063/1.1412873.
- N. Blinov, X.G. Song and P.N. Roy, J. Chem. Phys. 120 (2004) p.5916. doi:10.1063/1.1650301.
- Y.K. Kwon, D.M. Ceperley and K.B. Whaley, J. Chem. Phys. 104 (1996) p.2341. doi:10.1063/1.470929.
- P. Sindzingre, M.L. Klein and D.M. Ceperley, Phys. Rev. Lett. 63 (1989) p.1601. doi:10.1103/PhysRevLett.63.1837.
- R.E. Zillich, Y. Kwon and K.B. Whaley, Phys. Rev. Lett. 93 (2004) p.250401. doi:10.1103/PhysRevLett.93.250401.
- D. Emin, Polarons, Cambridge University Press, UK, 2013.
- K.K. Lehmann and C. Callegari, J. Chem. Phys. 117 (2002) p.1595. doi:10.1063/1.1486443.
- R.E. Zillich and K.B. Whaley, Phys. Rev. B. 69 (2004) p.104517. doi:10.1103/PhysRevB.69.104517.
- R.N. Barnett and K.B. Whaley, J. Chem. Phys. 99 (1993) p.9730. doi:10.1063/1.465455.
- Y.K. Kwon and K.B. Whaley, Phys. Rev. Lett 83 (1999) p.4108. doi:10.1103/PhysRevLett.83.4108.
- R. Rodriguez-Cantano, T. Gonzalez-Lezana and P. Villarreal, Int. Rev. Phys. Chem. 35 (2016) p.37. doi:10.1080/0144235X.2015.1132595.
- I.N. Cherepanov and M. Lemeshko, Phys. Rev. Mater 1 (2017) p.035602. doi:10.1103/PhysRevMaterials.1.035602.
- B. Shepperson, A.A. Sondergaard, L. Christiansen, J. Kaczmarczyk, R.E. Zillich, M. Lemeshko and H. Stapelfeldt, Phys. Rev. Lett. 118 (2017) p.203203. doi:10.1103/PhysRevLett.118.203203.
- B. Midya, M. Tomza, R. Schmidt and M. Lemeshko, Phys. Rev. A. 94 (2016) p.041601(R. doi:10.1103/PhysRevA.94.041601.
- S. Grebenev, B. Sartakov, J.P. Toennies and A.F. Vilesov, Science. 289 (2000) p.1532. doi:10.1126/science.289.5484.1532.
- S. Grebenev, B.G. Sartakov, J.P. Toennies and A.F. Vilesov, Europhys. Lett. 83 (2008) p.66008. doi:10.1209/0295-5075/83/66008.
- P.L. Stiles, D.T. Moore and R.E. Miller, J. Chem. Phys. 121 (2004) p.3130.
- K. Nauta and R.E. Miller, J. Chem. Phys. 115 (2001) p.10138. doi:10.1063/1.1392378.
- P.L. Stiles and R.E. Miller, J. Phys. Chem. A. 111 (2007) p.7382.
- T. Liang, S.D. Flynn, A.M. Morrison and G.E. Douberly, J. Phys. Chem. A. 115 (2011) p.7437. doi:10.1021/jp203367t.
- R. Schwan, M. Kaufmann, D. Leicht, G. Schwaab and M. Havenith, Phys. Chem. Chem. Phys. 18 (2016) p.24063. doi:10.1039/c6cp01154c.
- M.N. Slipchenko, B.G. Sartakov, A.F. Vilesov and S.S. Xantheas, J. Phys. Chem. A. 111 (2007) p.7460.
- G.E. Douberly and R.E. Miller, J. Phys. Chem. B. 107 (2003) p.4500.
- D. Skvortsov, M.Y. Choi and A.F. Vilesov, J. Phys. Chem. A. 111 (2007) p.12711.
- M.I. Sulaiman, S.F. Yang and A.M. Ellis, J. Phys. Chem. A. 121 (2017) p.771. doi:10.1021/acs.jpca.6b11170.
- S.D. Flynn, D. Skvortsov, A.M. Morrison, T. Liang, M.Y. Choi, G.E. Douberly and A.F. Vilesov, J. Phys. Chem. Lett. 1 (2010) p.2233. doi:10.1021/jz100637m.
- A.M. Morrison, S.D. Flynn, T. Liang and G.E. Douberly, J. Phys. Chem. A. 114 (2010) p.8090. doi:10.1021/jp104545j.
- M. Letzner, S. Gruen, D. Habig, K. Hanke, T. Endres, P. Nieto, G. Schwaab, L. Walewski, M. Wollenhaupt, H. Forbert, D. Marx and M. Havenith, J. Chem. Phys. 139 (2013) p.154304.
- E. Loginov, L.F. Gomez, B.G. Sartakov and A.F. Vilesov, J. Phys. Chem. A. 121 (2017) p.5978. doi:10.1021/acs.jpca.7b05136.
- E. Loginov, L.F. Gomez and A.F. Vilesov, J. Phys. Chem. A. 117 (2013) p.p.11774. doi:10.1021/jp311003d.
- E. Loginov, L.F. Gomez, B.G. Sartakov and A.F. Vilesov, J. Phys. Chem. A. 120 (2016) p.6738. doi:10.1021/acs.jpca.6b05762.
- F. Dong and R.E. Miller, J. Phys. Chem. A. 108 (2004) p.2181. doi:10.1021/jp031194i.
- T.E. Salter and A.M. Ellis, J. Chem. Phys. 127 (2007) p.144314. doi:10.1063/1.2776334.
- J. Warnatz, U. Maas and W. Dibble, Combustion: Physical and Chemical Fundamentals, Modeling and Simulation, Experiments, Pollutant Formation, Springer, Berlin, 1996.
- R.P. Wayne, Chemistry of Atmospheres: An Introduction to the Chemistry of the Atmospheres of Earth, the Planets, and Their Satellites, Oxford University Press, Oxford, 1991.
- C. Murray and A.J. Orr-Ewing, Int. Rev. Phys. Chem. 23 (2004) p.435. doi:10.1080/01442350412331329166.
- M.C. Heaven, Annu. Rev. Phys. Chem. 43 (1992) p.283. doi:10.1146/annurev.pc.43.100192.001435.
- K. Liu, A. Kolessov, J.W. Partin, I. Bezel and C. Wittig, Chem. Phys. Lett. 299 (1999) p.374. doi:10.1016/S0009-2614(98)01293-7.
- R.D. Hunt and L. Andrews, J. Chem. Phys. 88 (1988) p.3599. doi:10.1063/1.453909.
- M.I. Lester, B.V. Pond, D.T. Anderson, L.B. Harding and A.F. Wagner, J. Chem. Phys. 113 (2000) p.9889. doi:10.1063/1.1330235.
- M.I. Lester, B.V. Pond, M.D. Marshall, D.T. Anderson, L.B. Harding and A.F. Wagner, Faraday Discuss. 118 (2001) p.p.373. doi:10.1039/b009421h.
- J. Kupper, J.M. Merritt and R.E. Miller, J. Chem. Phys. 117 (2002) p.647. doi:10.1063/1.1484104.
- A.M. Morrison, P.L. Raston and G.E. Douberly, J. Phys. Chem. A. 117 (2013) p.11640. doi:10.1021/jp311003d.
- P.L. Raston, J. Agarwal, J.M. Turney, H.F. Schaefer and G.E. Douberly, J. Chem. Phys. 138 (2013) p.194303. doi:10.1063/1.4804435.
- A.R. Brown, P.R. Franke and G.E. Douberly, J. Phys. Chem. A. 121 (2017) p.7576. doi:10.1021/acs.jpca.7b07852.
- C.M. Leavitt, C.P. Moradi, B.W. Acrey and G.E. Douberly, J. Chem. Phys. 139 (2013) p.234301. doi:10.1063/1.4844175.
- D. Leicht, M. Kaufmann, N. Pal, G. Schwaab and M. Havenith, J. Chem. Phys. 146 (2017) p.114306.
- P.R. Franke, D.P. Tabor, C.P. Moradi, G.E. Douberly, J. Agarwal, H.F. Schaefer and E.L. Sibert, J. Chem. Phys. 145 (2016) p.224304. doi:10.1063/1.4954660.
- D. Leicht, M. Kaufmann, G. Schwaab and M. Havenith, J. Chem. Phys. 145 (2016) p.074304. doi:10.1063/1.4954660.
- M. Kaufmann, D. Leicht, M. Havenith, B.M. Broderick and G.E. Douberly, J. Phys. Chem. A. 120 (2016) p.6768. doi:10.1021/acs.jpca.6b06522.
- P.L. Raston, T. Liang and G.E. Douberly, J. Phys. Chem. A. 117 (2013) p.8103. doi:10.1021/jp311003d.
- J.M. Merritt, J. Kupper and R.E. Miller, Phys. Chem. Chem. Phys. 9 (2007) p.401. doi:10.1039/B611340K.
- J.H. Kiefer, R.S. Tranter, H. Wang and A.F. Wagner, Int. J. Chem. Kinet. 33 (2001) p.834. doi:10.1002/kin.10006.
- P.L. Raston, E.I. Obi and G.E. Douberly, J. Phys. Chem. A. 121 (2017) p.7597. doi:10.1021/acs.jpca.7b07906.
- J.T. Hougen, International Review of Science, Physical Chemistry, Butterworth, London, 1976.
- J.M. Merritt, G.E. Douberly, P.L. Stiles and R.E. Miller, J. Phys. Chem. A. 111 (2007) p.12304.
- P.L. Raston, T. Liang and G.E. Douberly, J. Chem. Phys. 137 (2012) p.184302. doi:10.1063/1.4764298.
- J.T. Brice, T. Liang, P.L. Raston, A.B. McCoy and G.E. Douberly, J. Chem. Phys. 145 (2016) p.124310. doi:10.1063/1.4954660.
- F.J. Hernandez, J.T. Brice, C.M. Leavitt, T. Liang, P.L. Raston, G.A. Pino and G.E. Douberly, J. Chem. Phys. 143 (2015) p.164304. doi:10.1063/1.4933432.
- W. Kong and J. Bulthuis, J. Phys. Chem. A. 104 (2000) p.1055. doi:10.1021/jp993549x.
- J. Bulthuis, J.A. Becker, R. Moro and V.V. Kresin, J. Chem. Phys. 129 (2008) p.024101. doi:10.1063/1.3026364.
- A.S. Chatterley, B. Shepperson and H. Stapelfeldt, Phys. Rev. Lett. 119 (2017) p.073202. doi:10.1103/PhysRevLett.119.073202.
- D. Pentlehner, J.H. Nielsen, A. Slenczka, K. Molmer and H. Stapelfeldt, Phys. Rev. Lett. 110 (2013) p.093002. doi:10.1103/PhysRevLett.110.093002.
- B. Shepperson, A.S. Chatterley, A.A. Sondergaard, L. Christiansen, M. Lemeshko and H. Stapelfeldt, J. Chem. Phys. 147 (2017) p.013946. doi:10.1063/1.4983703.
- J.D. Pickering, B. Shepperson, B.A.K. Hubschmann, F. Thorning and H. Stapelfeldt, Phys. Rev. Lett. 120 (2018) p.113202. doi:10.1103/PhysRevLett.120.113202.
- J.D. Pickering, B. Shepperson, L. Christiansen and H. Stapelfeldt, J. Chem. Phys. 149 (2018) p.154306. doi:10.1063/1.5049555.
- K. Nauta and R.E. Miller, J. Chem. Phys. 111 (1999) p.3426. doi:10.1063/1.479627.
- C. Callegari, I. Reinhard, K.K. Lehmann, G. Scoles, K. Nauta and R.E. Miller, J. Chem. Phys. 113 (2000) p.4636. doi:10.1063/1.1288604.
- B. Friedrich, D.R. Herschbach, J.M. Rost, H.G. Rubahn, M. Renger and M. Verbeek, J. Chem. Soc. Faraday Trans. 89 (1993) p.1539. doi:10.1039/ft9938901539.
- J.M. Rost, J.C. Griffin, B. Friedrich and D.R. Herschbach, Phys. Rev. Lett. 68 (1992) p.1299. doi:10.1103/PhysRevLett.68.1287.
- B.M. Broderick, L. McCaslin, C.P. Moradi, J.F. Stanton and G.E. Douberly, J. Chem. Phys. 142 (2015) p.144309.
- B.M. Broderick, C.P. Moradi and G.E. Douberly, Chem. Phys. Lett. 639 (2015) p.99. doi:10.1016/j.cplett.2015.09.001.
- K. Nauta and R.E. Miller, Phys. Rev. Lett. 82 (1999) p.4480. doi:10.1103/PhysRevLett.82.4480.
- T. Liang, D.B. Magers, P.L. Raston, W.D. Allen and G.E. Douberly, J. Phys. Chem. Lett. 4 (2013) p.3584.
- P.L. Stiles, K. Nauta and R.E. Miller, Phys. Rev. Lett. 90 (2003) p.135301. doi:10.1103/PhysRevLett.90.135301.
- M.Y. Choi, F. Dong, S.W. Han and R.E. Miller, J. Phys. Chem. A. 112 (2008) p.7185. doi:10.1021/jp8012688.
- F. Dong and R.E. Miller, Science. 298 (2002) p.p.1227. doi:10.1126/science.1076947.
- M.Y. Choi, F. Dong and R.E. Miller, Philos. Trans. R. Soc. A. 363 (2005) p.393.
- M.Y. Choi and R.E. Miller, J. Phys. Chem. A. 110 (2006) p.9344. doi:10.1021/jp0620825.
- W. Kong, L.S. Pei and J. Zhang, Int. Rev. Phys. Chem. 28 (2009) p.33. doi:10.1080/01442350802573678.
- M.Y. Choi and R.E. Miller, J. Am. Chem. Soc. 128 (2006) p.7320. doi:10.1021/ja060741l.
- M.Y. Choi and R.E. Miller, J. Phys. Chem. A. 111 (2007) p.2475.
- G.E. Douberly, R.E. Miller and S.S. Xantheas, J. Am. Chem. Soc. 139 (2017) p.4152. doi:10.1021/jacs.7b00510.
- M.Y. Choi and R.E. Miller, Phys. Chem. Chem. Phys. 7 (2005) p.3565. doi:10.1039/b507100c.
- O. Asvany, S. Brunken, L. Kluge and S. Schlemmer, Appl. Phys. B. 114 (2014) p.203. doi:10.1007/s00340-013-5684-y.
- O.V. Boyarkin and V. Kopysov, Rev. Sci. Instrum. 85 (2014) p.033105. doi:10.1063/1.4868178.
- A.B. Wolk, C.M. Leavitt, E. Garand and M.A. Johnson, Acc. Chem. Res. 47 (2014) p.202. doi:10.1021/ar400125a.
- T.R. Rizzo, J.A. Stearns and O.V. Boyarkin, Int. Rev. Phys. Chem. 28 (2009) p.481. doi:10.1080/01442350903069931.
- D. Gerlich, Low Temperatures and Cold Molecules, I.W.M. Smith, Imperial College Press, London, 2008, p.295.
- S. Smolarek, N.B. Brauer, W.J. Buma and M. Drabbels, J. Am. Chem. Soc. 132 (2010) p.14086. doi:10.1021/ja1034655.
- X.H. Zhang, N.B. Brauer, G. Berden, A.M. Rijs and M. Drabbels, J. Chem. Phys. 136 (2012) p.044305. doi:10.1063/1.3678011.
- F. Filsinger, D.S. Ahn, G. Meijer and G. von Helden, Phys. Chem. Chem. Phys. 14 (2012) p.13370. doi:10.1039/c2cp42071f.
- E. Loginov and M. Drabbels, J. Chem. Phys. 136 (2012) p.154302. doi:10.1063/1.3701565.
- A.I.G. Florez, D.S. Ahn, S. Gewinner, W. Schollkopf and G. von Helden, Phys. Chem. Chem. Phys. 17 (2015) p.21902. doi:10.1039/C5CP02172C.
- F. Bierau, P. Kupser, G. Meijer and G. von Helden, Phys. Rev. Lett. 105 (2010) p.133402. doi:10.1103/PhysRevLett.105.133402.
- M. Alghamdi, J. Zhang, A. Oswalt, J.J. Porter, R.A. Mehl and W. Kong, J. Phys. Chem. A. 121 (2017) p.6671. doi:10.1021/acs.jpca.7b05718.
- A.I.G. Florez, E. Mucha, D.S. Ahn, S. Gewinner, W. Schollkopf, K. Pagel and G. von Helden, Angew. Chem. Int. Ed. 55 (2016) p.3295. doi:10.1002/anie.201510983.
- O. Asvany, P. Kumar, B. Redlich, I. Hegemann, S. Schlemmer and D. Marx, Science. 309 (2005) p.1219. doi:10.1126/science.1116168.
- D. Mani, T. Fischer, R. Schwan, A. Dey, B. Redlich, A.F.G. Van der Meer, G. Schwaab and M. Havenith, RSC Adv. 7 (2017) p.p.54318. doi:10.1039/C7RA08102B.
- E. Mucha, A.I.G. Florez, M. Marianski, D.A. Thomas, W. Hoffmann, W.B. Struwe, H.S. Hahm, S. Gewinner, W. Schollkopf, P.H. Seeberger, G. von Helden and K. Pagel, Angew. Chem. Int. Ed. 56 (2017) p.11248. doi:10.1002/anie.201702896.
- D.A. Thomas, M. Marianski, E. Mucha, G. Meijer, M.A. Johnson and G. Von Helden, Angew. Chem. Int. Ed. 57 (2018) p.1. doi:10.1002/anie.201805436.
- D.A. Thomas, E. Mucha, S. Gewinner, W. Schollkopf, G. Meijer and G. von Helden, J. Phys. Chem. Lett. 9 (2018) p.2305. doi:10.1021/acs.jpclett.8b00664.