
ABSTRACT
Bifurcation phenomena observed in turbulence and transport, in topology of magnetic field and MHD, and the interplay between turbulence and MHD bifurcation in magnetically confined toroidal plasmas are reviewed. Two types of bifurcation phenomena in turbulent transport are discussed. One is significant change in the magnitude of the diffusion term and the other is a sign flip of non-diffusive term of transport. The bifurcation of diffusion term magnitude causes the transition to a so-called improved mode such as ion-electron root transition, L-mode to H-mode transition, and ITB formation. In contrast, the bifurcation of non-diffusion term sign causes the intrinsic flow reversal, convection reversal of bulk ion, and impurity ions. Two types of bifurcation phenomena in MHD are discussed. One is the bifurcation of static magnetic topology and the other is the bifurcation of MHD instability. The bifurcation of static magnetic topology is observed in between three magnetic topology (nested magnetic flux surface, magnetic island and stochastic magnetic field) in toroidal plasma. The bifurcation of MHD instability is observed as a parity change of MHD oscillation. The bifurcation of the magnetic island states caused by the interplay between turbulence and MHD is also discussed.
Graphical abstract
KEYWORDS:
1. Introduction
Magnetically confined toroidal plasma is a dissipation system with constant energy input at the plasma center. The plasma pressure and temperature are peaked at the plasma center and the temperature gradient, which is consistent with the radial heat flux, is sustained in the steady state. Therefore, the temperature gradient and radial profile of temperature should be also steady-state for the given steady-state energy input. However, there are bifurcation phenomena where the plasma potential, density, and temperature profile change rapidly even for the steady-state energy input. This bifurcation is the result of multiple solutions of flux-gradient relation. The reason for the multiple solutions of flux-gradient relation (transport) is the complexity of the non-linear system. The flux-gradient relation is highly non-linear and the thermal diffusivity (the ratio of normalized heat flux to the temperature gradient) is not constant but strongly depends on the gradient itself. These characteristics are quite unique compared with other materials where the thermal diffusivity is constant or has weak dependence. The structure formation of magnetically confined plasma (radial profile of temperature, density, the radial electric field, magnetic field) is determined by the transport (flux-gradient relation between the radial flux and gradient). Intensive research has been performed to understand the physics mechanism determining the transport process and structure formation [Citation1].
There are many bifurcation phenomena in laboratory plasma (low-temperature, high-temperature, and laser-produced plasma) and in space and astrophysical plasma [Citation2]. In this review paper, the bifurcation phenomena in the high-temperature plasma which is generated by the magnetic field with torus geometry and called magnetically confined toroidal plasma is focused upon. In magnetically confined toroidal plasma, various bifurcation phenomena have been observed. These various bifurcation phenomena are due to the highly non-linear characteristics of magnetized plasma. Because of the complexity of the magnetized plasma, there are various non-linear interactions between plasma parameter (density, temperature, flow velocity) and electromagnetic field (the radial electric field and topology of the magnetic field). A feedback loop among plasma parameters and electromagnetic fields is a key trigger mechanism for the bifurcation and transition between the two states.
Figure 1. Diagram of various bifurcation phenomena discussed in this paper.
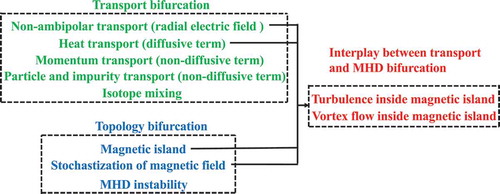
Bifurcation phenomena described in sections 2–4 of this paper is summarized in . The bifurcation phenomena of non-ambipolar transport (radial electric field), heat (diffusive term), momentum, particle, and impurity (non-diffusive term) transport is described in section 2. The bifurcation phenomena of magnetic topology observed in magnetic island, stochastization of magnetic field, and MHD instability is described in section 3. The bifurcation of turbulence spreading and vortex flow inside the magnetic island is described in section 4 as examples of interplay between transport (radial electric field and heat transport) and MHD (stochastization in magnetic island).
The first bifurcation phenomena discussed in the beginning of the research on high-temperature plasma for nuclear fusion using the magnetically confined toroidal device was a bifurcation of plasma potential. The bifurcation of the gradient of plasma potential (radial electric field) was predicted in helical plasma, where both radial flux of ion and electron are sensitive to the radial electric field because the diffusion of helically trapped ion and electron are sensitive to the radial electric field [Citation3–Citation5]. This bifurcation is restricted to the plasma in helical system and no bifurcation of the radial electric field has been predicted in tokamak, where there is no helically trapped ion and electron. Therefore, the bifurcation of the radial electric field has been a key for reducing collisions transport due to the helically trapped ion and electron (so-called neoclassical transport) in helical system.
In turbulent transport, the radial flux of particle momentum and energy (heat) can be expressed using the so-called transport matrix in which element is dependent on plasma inhomogeneities as
Here, ,
,
is particle, momentum, and energy (heat), respectively, and
is electron/ion/impurity density (
),
is toroidal flow velocity, and
is electron/ion temperature (
), respectively. Diagonal terms correspond to diffusive terms, while the off-diagonal terms correspond to non-diffusive terms. The diffusive term is expressed with diffusion coefficient (
), viscosity coefficient (
), and thermal diffusivity coefficient (
) as
,
, and
. Please note that these coefficients themselves depend on the gradient due to the non-linear characteristics of transport. There are two types of non-diffusive terms. One is the non-diffusive term which depends on each parameter of the flux. These terms are called pinch terms and can be expressed as
,
, and
, where
is a pinch velocity in particle, momentum, and heat transport, respectively. The other is the non-diffusive term which is independent of each parameter and its gradient. Residual stress in the momentum transport is a typical example of this term [Citation6].
Figure 2. Flux-gradient relation of particle, momentum, and heat transport in magnetically confined toroidal plasma.
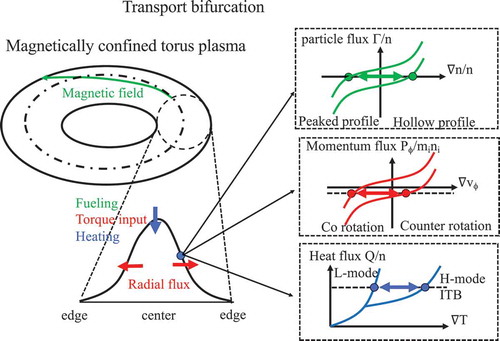
indicates the flux-gradient relation of particle, momentum, and heat transport in magnetically confined toroidal plasma. The relation between the radial flux of particle, momentum flux, and heat flux to the density gradient, velocity gradient, and the temperature gradient is determined by the structure of the magnetic field for confining plasma, which is called transport curve. Because the radial flux is constant in the steady-state operation in the discharge, the bifurcation of transport appears as a jump of density, velocity, and temperature gradient for the given radial flux. The bifurcation of transport is expressed as the transition between two transport curves that are governed by the hidden variables. The y-intercept of the transport curve corresponds to the non-diffusive term of transport. Although the non-diffusive term of heat transport is small, the non-diffusive term of momentum and particle transport is large enough to provide the significant gradient even for zero radial flux. In the heat transport, the bifurcation is observed as the jump of gradient, while the bifurcation in the particle and momentum transport appears as a sign flip of the gradient as well as the jump of the gradient.
In 1982, the transition from low confinement to high confinement (L-H transition) was observed in ASDEX tokamak [Citation7] and theoretical model for this bifurcation phenomena by a radial electric field transition was proposed [Citation8]. Before the finding of the L-H transition, the transport was mainly determined by the structure of the magnetic field and the optimization of the magnetic field was the main issue in nuclear fusion research. However, after the finding of the L-H transition, various high confinement states, which are called improved modes, has been observed and the search for the improved mode becomes the main research topic. The bifurcation of diffusive term of transport is identified by the change of coefficients (,
,
) and significant reduction of thermal diffusivity (
) with an order of magnitude is observed in the improved mode. Although there are many improved modes that have been found, the understanding of the mechanism has not been completed. Even in the improved mode which is not triggered by
transition, the radial electric field shear (so-called
shear) and zonal flow (mezo-scale
shear) play important roles in the feedback process between transport and radial electric field. The observations of improved mode have demonstrated that the thermal diffusivity strongly depends on radial profile of radial electric field and its shear and curvature as
,
,
,). Most of the improved modes have been achieved by the transition from low confinement state (L-mode) to high confinement state (improved mode) through this feedback process. Therefore, deep understanding of the mechanism for the transition and the bifurcation is necessary in order to explore new improved modes in future. The improved mode triggered by the bifurcation of the radial electric field (
) is described in section 2.1, while the improved mode which is not triggered by the
transition is described in section 2.2.
In the momentum transport and particle including impurity transport, the non-diffusive term (the radial flux not driven by its gradient) is comparable to the diffusive term (the radial flux driven by its gradient). For example, the radial momentum flux driven by intrinsic torque and radial particle flux driven by convection is the well-known non-diffusive term of transport. These non-diffusive terms can be inward or outward depending on the turbulence type, such as a trapped electron mode (TEM) [Citation9,Citation10] or the ion temperature gradient (ITG) mode [Citation11,Citation12]. In general, the transport in the magnetically confined plasma is governed by multi turbulence and the different turbulence levels often compete with each other. This is because when one turbulence becomes large enough to determine the gradient of the temperature, which is below the threshold for the sharp increase of other turbulence level. The other turbulence is kept at a low level because that gradient is below the threshold for the other turbulence. For example, when the TEM becomes dominant, the ITG mode will be suppressed because the temperature gradient is below the threshold of the ITG mode. Therefore, a switch between two turbulences can occur without changing the total turbulence level and the temperature gradient. The bifurcation between different modes has only a small impact on the diffusive term but can have a strong impact on the sign and magnitude of non-diffusive term of transport, which will be discussed in section 2.3.
Figure 3. Diagram of topology bifurcation in magnetically confined toroidal plasma.
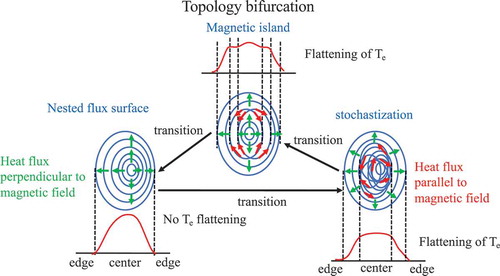
In magnetically confined plasma, magnetic field lines are bounded by a closed (nested) magnetic flux surface. There are three magnetic topologies as seen in . One is nested magnetic flux surface and the others are magnetic flux surface with magnetic island and stochastic magnetic field. Although the flattening of the electron temperature () profile is observed in both the magnetic island and the stochastic magnetic field region, the mechanism for temperature flattening is different. The temperature flattening inside the magnetic island is due to the lack of heat flux perpendicular to the magnetic field, because most of the heat flux flows through X-point of the magnetic island. In contrast, the temperature flattening in the stochastic magnetic field region is due to the heat flux parallel to the magnetic field which has a large stochastic radial displacement due to the magnetic field perpendicular to the magnetic flux surface.
A helical perturbation of plasma current at the rational surface driven by tearing mode produces a closed magnetic flux surface bounded by a separatrix, isolating it from the rest of the space with nested magnetic flux surface, which is called magnetic island [Citation13–Citation15]. When the magnetic field lines become chaotic (stochastic), the nested magnetic flux surface is broken down due to the magnetic field perpendicular to the magnetic flux surface, which is called stochastization of the magnetic field. The other magnetic topology bifurcation is the transition between the nested magnetic flux and stochastization of the magnetic field due to the overlapping of small magnetic islands (usually the magnetic island with higher harmonic components). The transition from stochastic magnetic field to nested magnetic flux surface was found in the reverse field pinch (RFP) plasmas [Citation16], while the transition in reverse process (from nested magnetic flux surface to stochastic magnetic field) was found in helical plasma [Citation17,Citation18]. The bifurcation between these three magnetic topologies (nested magnetic flux surface, magnetic island, stochastic magnetic field) has been observed in tokamak, helical, and reverse field pinch (RFP) plasma. The bifurcation of magnetic topology found in a magnetically confined plasma is described in section 3.
The coupling between the transport bifurcation and the MHD bifurcation found as a bifurcation of the magnetic island state [Citation19] is also discussed in section 4. The interplay between MHD instability and turbulent transport is recognized to be an important topic in toroidal plasmas [Citation20,Citation21]. In this review article, the various bifurcation phenomena observed in the toroidal magnetically confined plasma are reviewed and the physics mechanism for the bifurcation phenomena is discussed.
2. Transport bifurcation
2.1. Radial electric field ( ) bifurcation
There are two field values in a magnetically confined plasma. One is the radial electric field () and the other is the magnetic field
. The magnetic field is determined by the combination of external coil and internal current in the plasma and has only slow change due to the relatively long current diffusion time in the high temperature plasma. The radial electric field in the plasma has been considered to be a key parameter for the bifurcation and the transition phenomena in magnetically confined plasmas. This is because the radial electric field can be created by a slight unbalance of the positive charge of ions and the negative charge of electrons and can change rapidly compared with the change in other plasma parameters such as plasma density and ion/electron temperature. Two types of radial electric field bifurcation have been observed in magnetically confined plasmas. One is the radial electric field bifurcation in the sign (positive or negative) in the helical plasma, where the ion and electron radial particle flux strongly depend on the radial electric field. Plasma with the positive electric field is called electron root because the positive
is the result of the larger electron loss than ions at zero
. In contrast, the plasma with the negative electric field is called ion root, because the negative
is the result of a larger ion loss than electrons at zero
. The other is the radial electric field bifurcation in magnitude (small or large negative value) at the plasma edge in the plasma with low confinement mode (L-mode) and high confinement mode (H-mode) in toroidal plasma. This bifurcation is attributed to the radial electric field bifurcation at the plasma boundary and the interplay between radial electric field shear and turbulence.
2.1.1. bifurcation in neoclassical transport (electron root and ion root)
Figure 4. (a) Neoclassical electron and ion radial flux as a function of radial electric field at high (top), medium (middle) and low (bottom) collisionality, and neoclassical bifurcation curve in medium (middle) collisionality as a function of (b) electron density and (c) electron temperature (from in [Citation22] and )(c) in [Citation23]).
![Figure 4. (a) Neoclassical electron and ion radial flux as a function of radial electric field at high (top), medium (middle) and low (bottom) collisionality, and neoclassical bifurcation curve in medium (middle) collisionality as a function of (b) electron density and (c) electron temperature (from Figure 2 in [Citation22] and Figure 36(b)(c) in [Citation23]).](/cms/asset/1b96cc26-e43a-4396-9aa1-6bdcb40da34c/tapx_a_1801354_f0004_oc.jpg)
In helical plasma, ion and electron radial flux depend on the radial electric field, as seen in [Citation22]. Because the
dependence of ion flux is different from
dependence of electron flux, there are two solutions for the radial electric field. Ion radial flux increases sharply near zero radial electric field
. Ion flux should be equal to the electron flux at
to keep the quasi-neutral condition in steady-state. Then the radial electric field for
is a radial electric field realized in the plasma, which is assigned to ‘root’. There is only one root in the negative
in the high collisionality plasma (top). As the collisionality decreases, three roots appear both in negative and positive
in the medium collisionality plasma (middle). The root in the middle
is unstable. This is because when the
is below the
, ion flux
becomes larger than electron flux
and
decreases, while the radial electric field increases when
due to
. The two roots in the negative
and positive
are stable. In the low collisionality only one root is in the positive
. Therefore, the helical plasma has bifurcation between ion root and electron root in the range of medium collisionality. As the plasma collisionality increases (lower density or higher temperature), the radial electric field has only one solution (small
). Electron root with positive
is predicted at lower electron density or at higher electron temperature (lower collisionality), while the ion root with negative
is predicted at higher electron density or at lower electron temperature (higher collisionality) as seen in the neoclassical (NC) bifurcation curve plotted in ,c) [Citation23]. There are two solutions of
(both electron and ion roots) that exist in the specified range of electron density and temperature as seen in ,c). When the plasma density and the temperature are in this range, the radial electric field jumps from
to
at lower electron density (or higher electron temperature), while it jumps from
to
at higher electron density (or lower electron temperature).
Figure 5. Time evolution of potential at (a) =0.43, 0.53 and 0.59, (b) radial profiles of potential before and after the crash, and (c) density dependence of radial electric field at
=0.5. (from )(b)(c)(d) in [Citation24] and ) in [Citation23]).
![Figure 5. Time evolution of potential at (a) =0.43, 0.53 and 0.59, (b) radial profiles of potential before and after the crash, and (c) density dependence of radial electric field at =0.5. (from Figure 2(a)(b)(c)(d) in [Citation24] and Figure 29(b) in [Citation23]).](/cms/asset/5950823b-0023-4410-97e5-220af77d8f28/tapx_a_1801354_f0005_b.gif)
The repeated forward and backward transition between ion root and electron root was observed in the plasma with electron cyclotron heating (ECH) in CHS [Citation23,Citation24]. ) shows the time evolution of the potential at three different locations of =0.43, 0.53, 0.59. As the electron density decreases, the potential at
=0.43 gradually increases. Then repeated drop of potential is observed at
=0.43, which is called electric pulsation. Associated with the drop of potential at
=0.43, the positive spikes are observed at
=0.59. As seen in ), potential profile,
, shows crash with the pivot point at
=0.53. The plotted data were sequentially taken shot by shot with an identical operational condition. Around the center, the derivative of the potential (the electric field) does not change considerably before and after the crashes. A large change of the electric field, as a result, occurs around the pivot during a crash. The radial electric field (
) at
=0.5 is large positive (electron root) before the crash, while
becomes slightly negative (ion root) after the crash. The time scale of the transition is a few dozen microseconds, which is much shorter than the time scale of the transport diffusion process of a few milliseconds. This fast transition is the most important characteristic of the bifurcation of the radial electric field. The most probable candidate for the mechanism of pulsation is the bifurcation property of
between the ion root and the electron root in the helical toroidal plasma described above. ) shows the density dependence of the radial electric field at
=0.5 [Citation23]. This electric pulsation between weak positive and large positive is observed in the low-density regime of 1–2
10
m
. However at higher density, while the electric pulsation disappears and the radial electric field becomes negative at high density above
10
m
. The value of the density for the bifurcation is consistent with the electron density in the parameter regime in CHS, where a neoclassical calculation predicts the
bifurcation as seen in ). It should be noted that the
bifurcation observed in experiment is between weak positive
and large positive
, while the
bifurcation predicted by neoclassical calculation is between weak negative
and large positive
.
Figure 6. (a) Density dependence of edge radial electric field and (b) radial profiles of radial electric field in the ion root and the electron root in the plasma with = 3.75 m (from ) and ) in [Citation25]).
![Figure 6. (a) Density dependence of edge radial electric field and (b) radial profiles of radial electric field in the ion root and the electron root in the plasma with = 3.75 m (from Figure 1(a) and Figure 2(d) in [Citation25]).](/cms/asset/4f330a15-05d5-42b6-89a6-fb3961c24afe/tapx_a_1801354_f0006_oc.jpg)
The bifurcation between ion root and electron root is also observed near the plasma edge [Citation25]. ) shows the electron density dependence of the edge radial electric field at in the NBI heated plasma in LHD. The radial electric field profiles were measured with charge exchange spectroscopy [Citation26–Citation28] (see review [Citation29]). This density dependence of the radial electric field is very similar to that observed in the plasma core region at
in CHS. The critical electron density for the transition from ion root (negative
) to electron root (positive
) is 0.7
10
m
, which is consistent with the neoclassical (NC) prediction. The magnitude of the radial electric field both in electron root and in ion root predicted by NC calculation are also consistent with that measured. ) shows the radial profiles of the radial electric field in the electron root and the ion root. The bifurcation of the radial electric field is observed in the outer half of the plasma (
) and electric field shear appears in the electron root plasma. Although the magnitude of
at the LCFS in the electron root is 10 kV/m, which is comparable to that observed in the H-mode plasma, the magnitude of
shear is only 80 kV/m
, which is one order of magnitude smaller than that observed near the LCFS in the H-mode plasmas in tokamak. In helical plasma, the transport can be reduced by both the
itself and the
shear, because the
can contribute the reduction of NC transport and
shear can contribute the reduction of turbulent transport.
This characteristic is in contrast to the bifurcation in tokamak, where only shear contributes to the reduction of transport because the NC transport is negligible. Therefore, even the magnitude of
shear is too small to suppress the turbulence, and the transport can be reduced by the large positive electric field in the electron root. The ion thermal diffusivity is found experimentally to be significantly reduced by the transition from small negative
(ion root) to large positive
(electron root) in the configuration with
= 3.75 m, where the thermal diffusivity predicted by NC calculation in the ion root is comparable to the thermal diffusivity evaluated in experiment near the plasma edge (
). However, no significant reduction of transport is observed at the transition from ion root to electron root even in the inward shifted configuration with
= 3.6 m, where the neoclassical transport is reduced by decreasing helical ripple and the turbulent transport is dominant.
The region of the bifurcation between ion root and electron root depends on the heating method. ECH provides the localized (usually at the plasma center) electron heating, and electron temperature is much higher than ion temperature and electron temperature is peaked at the center. The plasma collisionality becomes low enough and temperature ratio becomes high enough to cause the transition from ion root to electron root. In contrast, NBI heating provides both electron and ion heating with broad heating profile. In order to achieve enough deposition of the beam, the electron density is typically more than 5
10
m
. Therefore, the
is nearly unity and the collisionality is not low enough to cause the transition from ion root to electron root in the plasma core. However, the helical ripple loss, which plays an important role for the bifurcation between ion root and electron root, becomes large near plasma edge and bifurcation can occur in even higher collisionality. Therefore, the transition from ion root to the electron root in the core region occurs in the plasma with ECH, while it occurs near the plasma periphery in the NBI heated plasma.
Figure 7. Radial profiles of (a) radial electric field and neoclassical/turbulent transport coefficients, (b) time evolution of heating power and electron temperature at three different radii ( = 0.5, 2, 3 cm), and (c) electron temperature gradient calculated from the time trace for
= 0.5 and 3 cm. The distance in the time steps of the inset is 20 ms (from , , and in [Citation30]).
![Figure 7. Radial profiles of (a) radial electric field and neoclassical/turbulent transport coefficients, (b) time evolution of heating power and electron temperature at three different radii ( = 0.5, 2, 3 cm), and (c) electron temperature gradient calculated from the time trace for = 0.5 and 3 cm. The distance in the time steps of the inset is 20 ms (from Figure 1, Figure 4, and Figure 5 in [Citation30]).](/cms/asset/de41250d-e655-4f91-92d8-694b0533c9a3/tapx_a_1801354_f0007_b.gif)
Although the magnitude of shear in helical plasma is relatively small in the ion root plasma or the electron root plasma, the strong
shear can appear at the interface between the ion root region and the electron root region [Citation30]. The strong
shear was reported in Wendelstein 7-AS plasma with ECH as plotted in ). The core region is the plasma in the electron root and the
reaches 4kV/m, while the outer region of the plasma is in the ion root and
is close to zero. The magnitude of the
shear in the interface between ion and electron root at
= 6–7 cm is 3–4 MV/m
, which is comparable to the
shear in tokamak H-mode plasma and the shearing rates are large compared with simple estimates for the turbulence growth rates. Therefore, this
shear is considered to trigger the formation of a transport barrier indicated by large electron temperature gradient.
The hysteresis in the relation between heating power and electron temperature was observed in the discharge with a power ramp down/up experiment as seen in ). The ECH power ramped down from 0.7 MW to 0.3 MW then ramped up to 0.7 MW. The sharp drop and jump of core electron temperature at = 0.5, 2, 3 cm in the electron root region (
6 cm) indicate the termination and formation of electron transport barrier The. hysteresis characteristics are observed in the threshold power. The ECH power at the formation of electron transport barrier of
= 0.8 se is higher than the ECH power at the termination of electron transport barrier of
= 0.6 sec. These hysteresis characteristics are consistent with the hysteresis of bifurcation of
predicted by neoclassical theory plotted in ,c). ) shows the dithering cycles observed near the threshold condition. The time scale of the transition in the dithering cycles is a few hundred microseconds (
s), which is much shorter than the transport time scale. There is similarity between the dithering cycles of temperature gradient observed in Wendelstein 7-AS and electric pulsation of potential observed in CHS. The time scale of the bifurcation is much shorter than the time scale of transport diffusion time. These experiments suggest a strong linkage between the radial electric field and the temperature gradient and that there are clear bifurcation states. One is the electron root state in the core with large positive
, strong
shear and large temperature gradient at the interface and the other is the ion root state in the core with small
, weak
shear and small temperature gradient.
It should be noted that the bifurcation of the radial electric field due to the neoclassical transport can trigger the bifurcation of transport (the formation of a transport barrier) governed by the turbulent transport in helical plasmas. In the electron root plasma in the core, the neoclassical transport is reduced by the large positive and turbulent transport is reduced by the strong
shear at the interface between core electron root and edge ion root. It is also interesting that the large positive
also reduces the turbulent transport. This is because the large positive
reduce the damping rate of zonal flow and enhances the amplitude of zonal flow. Then the turbulent transport is reduced by the large positive
in the region with no
shear through the enhancement of zonal flow (see review [Citation31,Citation32]).
Figure 8. Radial profiles of (a) electron temperature, (b) radial electric field, (c) electron thermal diffusivity, and (d) electron heat diffusivity normalized by the electron density as a function of electron temperature gradients at various radii ( = 0.15, 0.4, and 0.8) for the L-mode and ITB plasmas (from )(d)(e) and ) in [Citation34]).
![Figure 8. Radial profiles of (a) electron temperature, (b) radial electric field, (c) electron thermal diffusivity, and (d) electron heat diffusivity normalized by the electron density as a function of electron temperature gradients at various radii ( = 0.15, 0.4, and 0.8) for the L-mode and ITB plasmas (from Figure 2(b)(d)(e) and Figure 3(b) in [Citation34]).](/cms/asset/54e1bb79-bc5e-443d-b0b9-71902ed9dd81/tapx_a_1801354_f0008_oc.jpg)
The formation of electron internal transport barrier (ITB) is also observed in the plasma heated by NBI and ECH in helical plasmas [Citation33–Citation40]. shows the radial profiles of electron temperature, radial electric field, and electron thermal diffusivity in the plasma heated by NBI with 1.3 MW and ECH with 0.58 MW (below the threshold) and 0.78 MW (above the threshold) in LHD. As seen in ), the central electron temperature increases significantly with a large temperature gradient inside the ITB region ( 0.35) when the ECH power exceeds the threshold. This significant increase of central temperature by a slight increase of heating power of 0.2 MW, which is only 10% of the total heating power of 2 MW, is clear evidence of the formation of ITB. The radial electric field measured with charge exchange spectroscopy shows the bifurcation of
from ion root (small
) to electron root (large positive
) in the core region (
0.4) associated with the formation of ITB. In this plasma, the radial electric field is positive in the outer region (
0.6) and there is no interface between ion root and electron root in the plasma. However, the positive
in the core region is highly localized in the plasma with 0.78 MW ECH and the
shear also appears in the core region. Both the positive
and the
shear contribute to the reduction of transport.
As seen in the radial profiles of normalized thermal diffusivity in experiment and neoclassical prediction, the transport in this plasma is governed by the turbulent transport except near the plasma edge ( 0.8). Although, the thermal diffusivity in the experiment significantly decreases inside ITB region, the thermal diffusivity predicted by NC transport even slightly increases due to the significant increase of electron temperature in the plasma above the threshold power. Therefore, the formation of ITB is mainly due to the reduction of turbulent transport rather than the reduction of NC transport. ) shows the flux-gradient relation between the heat flux normalized by density and electron temperature gradient. The ratio of the heat flux to the temperature gradient gives a power balance thermal diffusivity, while the slope gives a so-called incremental thermal diffusivity. Associated with the transition from the L-mode to ITB plasma, electron temperature gradient increases by a factor of 3–4, which corresponds to the reduction of power balance thermal diffusivity by a factor of 3–4. It should be noted that the reduction of incremental thermal diffusive is much more significant and it is by a factor of
(from 20 m
/s to 1 m
/s). It is essential that the bifurcation is characterized by not only the jump of temperature gradient but also the slope of the flux-gradient relation.
2.1.2. bifurcation in turbulent transport (L-mode and H-mode)
The transition from low confinement state to high confinement state was first observed in ASDEX tokamak in 1982 [Citation7,Citation41] and in other tokamaks [Citation42–Citation49]. As seen in –c), the transition is characterized by spontaneous increase of electron density and plasma-stored energy indicated by the poloidal beta value and the drop of particle influx indicated by the line emission. In this discharge, the neutral beam (NB) is injected for t = 1.1 to 1.3 sec. The plasma stored energy and particle influx increases after the onset of NB. At t = 1.19 sec, the sudden decrease of
line emission is observed. This
drop indicates the reduction of particle influx due to the reduction of particle loss, because the recycling ratio (the ratio of particle flux to the particle loss) is always close to unity in the magnetized plasma. Therefore, sharp
drop is considered to be a good indication for the sudden reduction of particle loss of the plasma from the confined region to the scrape-off-layer (SOL) and
line emission is used to determine the timing of the transition from low confinement (enhanced particle loss) to high confinement (reduced particle loss). The former is called L-mode state and the latter is called H-mode state. After the transition from L-mode to H-mode (L-H transition), electron density starts to increase and the plasma stored energy continues to increase to the level twice that before the L-H transition.
Figure 9. Time evolution of (a) line averaged density, (b) atom flux reflected from the divertor plate, (c) beta poloidal, (d) edge ion temperature, (e) edge radial electric field, and (f) intensity of line emission (from )(c)(e) in [Citation7] and )(e)(f) in [Citation50]).
![Figure 9. Time evolution of (a) line averaged density, (b) atom flux reflected from the divertor plate, (c) beta poloidal, (d) edge ion temperature, (e) edge radial electric field, and (f) intensity of line emission (from Figure 1(a)(c)(e) in [Citation7] and Figure 2(a)(e)(f) in [Citation50]).](/cms/asset/89464063-8625-4247-b845-0a6cb067ac1f/tapx_a_1801354_f0009_b.gif)
It was a crucial issue to find the mechanism triggering for the L-H transition. Radial electric field was proposed as a candidate for the key parameter in the L-H transition in theory [Citation8] after the first experimental finding of H-mode. In experiment, the edge radial electric field was measured with charge exchange spectroscopy in DIII-D [Citation50] and JFT-2 M [Citation51,Citation52]. –f) shows the time evolution of edge ion temperature, edge radial electric field, and intensity of line emission. The
line emission clearly shows the repeated L-H transition (sharp drop) and back transition of H-L transition (rapid increase). Associated with the L-H and H-L transitions, edge ion temperature and the edge radial electric field also show the rapid response. Here the radial electric field,
, is
term of the radial force balance equation of
. Although the
term is comparable to the
term for bulk ion, it is small enough to be neglected for carbon impurity (
=6) used in this measurement. The radial electric field is
−5 kV/m in the L-mode phase and
−15 kV/m in the H-mode phase. Here the negative value of the radial electric field represents the radial electric field point toward the plasma center from the plasma edge. The change of the radial electric field is much faster than the change in ion temperature, which indicates that the negative radial electric field is crucial for the bifurcation phenomena between L-mode and H-mode phase.
Figure 10. Radial profile of (a) electron density, (b) electron temperature, (c) ion temperature, and (d) radial electric field in L-mode and H-mode phase. Here is a distance from LCFS and is negative inside LCFS and positive outside LCFS (from )(a)(b) and ) in [Citation51]).
![Figure 10. Radial profile of (a) electron density, (b) electron temperature, (c) ion temperature, and (d) radial electric field in L-mode and H-mode phase. Here is a distance from LCFS and is negative inside LCFS and positive outside LCFS (from Figure 2(c)(a)(b) and Figure 3(b) in [Citation51]).](/cms/asset/3b59cd8f-89fb-4797-be1d-e0cbbd648b9f/tapx_a_1801354_f0010_oc.jpg)
Since the radial electric field shear, which is equivalent to the mean flow, was found to play an important role for the suppression of the turbulence in theory [Citation53,Citation54], the measurements of radial structure of edge radial electric field were urgent issues for clarifying the mechanism for L-H transition. The details of radial structure of ion temperature, electron temperature, electron density, and radial electric field were measured in JFT-2 M as seen in . In the H-mode phase, the sharp gradient of electron density and electron/ion temperature appears just inside the last closed flux surface (LCFS) at r/a
1. It should be noted that the location of the sharp gradient is different between density and temperature. The temperature pedestal (sharp gradient of temperature) is located deeper in the inner region than the density pedestal (sharp gradient of electron density). In contrast, both electron and ion temperature gradients are almost unchanged across the LCFS in the L-mode state.
Radial structure of the radial electric field was derived from the term and
term of carbon impurity. The radial electric field
shows the well structure in the H-mode state, where
has a negative peak and the second derivative of
becomes maximum at the LCFS. There is no well structure in the radial electric field in the L-mode state. The radial
is negative inside LCFS and becomes positive outside LCFS. The
values at the LCFS observed in JFT-2 M (−4 kV/m in L-mode and −14 kV/m in H-mode) are almost identical to that observed in DIII-D. The
shear is negative (
) in the inner shear layer inside LCFS (
) and positive in the outer shear layer outside LCFS (
). The temperature pedestal locates at the region where the negative
shear is large, while the density pedestal locates at the region where the second derivative of
becomes maximum, where the
shear is zero. The negative
shear reaches 0.8 MV/m
at
=−0.7 cm inside LCFS, which is considered to be large enough to suppress the turbulence in the plasma. This observation shows the different role of radial electric field shear (
: 1st derivative of
) and radial electric field curvature,
: 2nd derivative of
). The radial structure of the radial electric field measured in JFT-2 M suggests that the
shear contributes to the reduction of heat transport, while
contributes to the reduction of particle transport. Recently the role of
curvature on the suppression of turbulence was proposed theoretically [Citation55]. The product of radial electric field and the 2nd derivative of the radial electric field -
as well as
was predicted to suppress the turbulence and reduce the transport. The impact of -
and
on the transport reduction was experimentally tested in JFT-2 M H-mode plasma [Citation56].
The radial electric field bifurcation is caused by the difference of of ion radial flux and electron radial flux of neoclassical transport in the helical plasma where the impact of
on helically trapped ion and electron is different. In the toroidally symmetry system (in tokamak), the radial electric field bifurcation is caused by ion radial flux and electron radial flux of turbulent transport. The bifurcation of the radial electric field sometimes causes the bifurcation of transport because the radial electric field shear, or so-called
flow shear, significantly reduces the turbulence amplitude and thermal diffusivity.
2.2. Transport bifurcation in diffusive term (transport barrier)
Transport bifurcation was first observed in particle and heat transport in L-H transition, and then in momentum and impurity transport. For simplicity, each transport is treated as an independent flux and gradient relation, and the radial fluxes of particle, momentum, and heat transport can be expressed as
is radial particle flux and
is electron (e), ion (i) and impurity (I) density, respectively,
is gradient in radial direction.
and
is diffusion coefficient and convection velocity for electron, ion, and impurity. In the plasma with one species without impurity,
and
due to the quasi-neutrality.
is radial momentum flux of toroidal rotation velocity,
, and
is ion mass.
is calculated by integrating the external torque and time derivative of toroidal momentum. Please note that
is the momentum flux only for the external torque and does not include the intrinsic torque described below. The first term is diffusive term and
is the diffusive perpendicular viscosity coefficient, which is sometimes expressed as momentum diffusivity,
based on the analogy of thermal diffusivity. The second term is proportional to
and is called momentum pinch. The third term does not depend on
and
and is called the residual term. The momentum flux due to intrinsic torque is included in the residual term. The residual term depends on the type of turbulence in the plasma and usually increases as the ion temperature gradient is increased. Therefore, this term can be simplified and expressed as
by introducing the non-diffusive perpendicular viscosity coefficient of
[Citation57]. Here
and
are thermal velocity and ion temperature, respectively. Even when there is no external torque (
= 0), plasma rotates toroidally by intrinsic torque, which is known as residual stress. The toroidal rotation driven by this residual stress is called spontaneous rotation.
is radial heat flux of electron (e) and ion (i) derived by integrating the heating power and time derivative of kinetic energy and
is electron and ion thermal diffusivity which gives the ratio of heat flux divided by density to the temperature gradient. Since the
is constant in the steady-state phase in the discharge, the increase of temperature gradient,
, at the bifurcation from low confinement to high confinement reflect to the decrease of thermal diffusivity,
, which is called reduction of transport.
In this section, bifurcation of heat, momentum, and impurity transport are discussed. The bifurcation of heat transport is characterized by the transport with small and large . When
value is large, it is called low confinement (enhanced transport) state and turbulence amplitude is large. When
value is small, it is called high confinement (reduced transport) state with low turbulence amplitude. In contrast, the bifurcation of momentum and impurity transport is characterized by the sign flip of
and
. Depending on the sign of
, toroidal flow driven by intrinsic torque as the non-diffusive term is in the direction parallel (co-) or anti-parallel (counter-) to the plasma current. The non-diffusive term with negative
is called inward pinch (or accumulation in the impurity transport), while that with positive
is called outward convection. In this section, experimental observation of bifurcation of
,
, and
are described.
Figure 11. Diagram of the feedback loop for transport bifurcation.
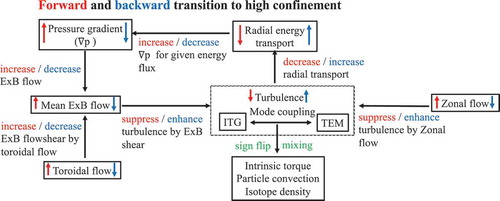
shows a diagram of the feedback loop for transport bifurcation. Pressure gradient is determined by the radial energy transport (flux gradient relation) process in the magnetized confined plasma, where the energy flux is given by the constant heating power to sustain the high temperature plasma. Because mean flow is driven by the pressure gradient, when the pressure gradient increases the
flow and its shear increase. When the
flow shear exceeds the critical value, turbulence in the plasma is suppressed. Suppression of turbulence contributes to the reduction of diffusive transport (an increase of pressure gradient for the given energy flux), which is called transport barrier. On the other hand, the turbulence mode (e.g. ITG and TEM) determines the sign of the non-diffusive term of transport, co/counter intrinsic torque in momentum transport, inward/outward particle convection, and mixing, which will be discussed in section 2.3 and 2.4. The increase of pressure gradient contributes further increase of mean
flow and its shear in the feedback loop for the transition from low to high confinement. In the back transition from high to low-confinement, the decreases of pressure gradient causes decrease of mean
flow and its shear. The decrease of
flow shear enhances the turbulence level and radial energy transport. Then the increase of turbulence level causes the decrease of pressure gradient and further decrease of mean
flow. It should be also noted that the time scale between the element is different. For example, the time scale for the suppression of turbulence by
shear is much shorter than the time scale for the increase of the pressure gradient by reduction of transport. Therefore, the bifurcation phenomena sometimes have multiple time scales. For example, fast drop of potential at the L-H transition and the gradual decrease of potential were reported in the potential measurements with heavy ion beam probe (HIBP) in JFT-2 M [Citation58].
Figure 12. (a) Geometry and observation points of dual heavy ion beam probes in CHS. (b) Time evolution of electric field (potential difference) on the same magnetic flux surface in different toroidal positions, which shows evidence of zonal flow. (c) Relation between normalized fluctuation amplitude and zonal flow amplitude (from ) and ) in [Citation60] and in [Citation61]).
![Figure 12. (a) Geometry and observation points of dual heavy ion beam probes in CHS. (b) Time evolution of electric field (potential difference) on the same magnetic flux surface in different toroidal positions, which shows evidence of zonal flow. (c) Relation between normalized fluctuation amplitude and zonal flow amplitude (from Figure 1(a) and Figure 2(a) in [Citation60] and Figure 2 in [Citation61]).](/cms/asset/55bde255-15b8-4af8-a794-779d3586be21/tapx_a_1801354_f0012_oc.jpg)
Each element in the feedback loop can be a trigger of the bifurcation. For example, the transition of mean flow is crucial in the transport bifurcation between low-confinement and high-confinement (LH transition) [Citation7], while Zonal flow is considered to be more important in the formation of internal transport barrier (ITB) [Citation59]. Zonal flow was experimentally identified in CHS using two heavy ion beam probes (HIBP) in CHS [Citation60] as illustrated in . As seen in the time evolution of change in potential at the poloidal cross-section 90 degrees apart in toroidal direction, these potential fluctuations have a long-range correlation with toroidal symmetry
= 0, radial length of
1.5 cm, and lifetime of
1.5 ms. The zonal flow was found to be enhanced when the potential profile and the electron temperature profile become peaked associated with the formation of electron internal transport barrier (e-ITB) as plotted in ). The relation between the fluctuation amplitude normalized by temperature gradient (
) and zonal flow amplitude (
) for L-mode plasma and e-ITB plasma is plotted in ) [Citation61,Citation62]. L-mode plasma has a higher fluctuation amplitude and a lower zonal flow amplitude but the e-ITB plasma has lower fluctuation amplitude and higher zonal flow. This is because the
shear of zonal flows (azimuthally symmetric band like shear flows) contributes to the reduction of fluctuation amplitude. Anti-correlation between fluctuation amplitude and zonal flow amplitude supports the predator-prey model between the zonal flow and drift wave turbulence [Citation54,Citation63,Citation64]. Potential fluctuation measured with two HIBP is a crucial experimental result which gives clear evidence for the fluctuation suppression by zonal flow enhanced in the ITB plasma.
Figure 13. Time evolution of (a) velocity, (b) relative density fluctuation level, and divertor D
intensity, and hysteresis relation between envelop of density fluctuation (rms) and normalized radial electric field at 5 mm inside separatrix ( in [Citation65] and in [Citation66]).
![Figure 13. Time evolution of (a) velocity, (b) relative density fluctuation level, and divertor D intensity, and hysteresis relation between envelop of density fluctuation (rms) and normalized radial electric field at 5 mm inside separatrix (Figure 1 in [Citation65] and Figure 3 in [Citation66]).](/cms/asset/da0a6979-8732-4830-94ff-efd650542c7a/tapx_a_1801354_f0013_oc.jpg)
In tokamak, the limit cycle oscillation (LCO) is often observed in the intermediate phase between L-mode phase and H-mode phase [Citation65–Citation67]. The LCO is characterized by the oscillation of velocity and density fluctuation amplitude associated with H
/D
spikes with the frequency of a few kHz. The role of zonal flow in the L-H transition proposed [Citation63] has been experimentally confirmed in DIII-D experiment [Citation65]. As seen in –c), both
velocity and density fluctuation level are oscillating near the LCFS (or separatrix) in the LCO phase, which is indicated by the D
spikes. The location of LCFS is indicated by the horizontal dashed line. In the L-mode, the density fluctuation level is high and
velocity is close to zero inside the LCFS (within 10 mm). After the transition to H-mode, the density fluctuation level is significantly reduced and
velocity becomes negative (in the electron diamagnetic direction). In the initial phase of LCO, the zonal flow generation and the resulting intense oscillating shear in the outer shear layer which is located near the LCFS are crucial (refer to ) for the inner and the outer shear layer of
profile with well structure). Increasing zonal flow shear in the outer and the inner shear layer then allows the edge pressure gradient to enhance. The shear associated with the diamagnetic component of the
velocity eventually lengthens the predator-prey oscillation cycle until equilibrium shear is sufficient to maintain continuous turbulence suppression consistent with H-mode confinement. Flow shear is contributed by the diamagnetic drift due to pressure gradient eventually lengthens the predator-prey oscillation cycle until mean
flow shear is sufficient to maintain continuous turbulence suppression consistent with H-mode confinement.
Two types of hysteresis relation between velocity and density fluctuation amplitude is observed in the LCO in HL-2A [Citation66] as seen in ). One type is the hysteresis relation which shows that turbulence intensity grows first, followed by the increment of localized flow (CW loop), which is called type-Y hysteresis. And the other type is the hysteresis relation which shows that the radial electric field grows first, causing the reduction of fluctuations (CCW loop), which is called type-J hysteresis. Turbulence-induced zonal flow and pressure gradient-induced drift play essential roles in the two types of limit cycles, respectively. Type-Y hysteresis (type-Y LCO) appears first immediately after the transition from L-mode to LCO, while the type-J hysteresis (type-J LCO) appears in the later phase of LCO. The switch between these two hysteresis relations observed during the LCO phase indicates that there are processes competing with each other. One is zonal flow generation by turbulence which is dominant in the earlier phase and the other is turbulence suppression by
velocity shear which becomes dominant in the later phase. If the transition from type-Y LCO to type-J LCO does not occur as seen in ), the back-transition from LCO to L-mode will occur. Therefore, the appearance of type-J LCO (turbulence suppression by
velocity shear) is necessary to finalize the transition from L-mode to H-mode.
2.2.1. ITB formation in ion heat transport
Figure 14. Time evolution of (a) radial profiles of ion temperature, (b) effective heat diffusivity at and radial profiles of (c) ion temperature and (d) toroidal rotation velocity in the ITB phase (from )(b) in [Citation68] and in [Citation88]).
![Figure 14. Time evolution of (a) radial profiles of ion temperature, (b) effective heat diffusivity at and radial profiles of (c) ion temperature and (d) toroidal rotation velocity in the ITB phase (from Figure 3(a)(b) in [Citation68] and Figure 1 in [Citation88]).](/cms/asset/98f37c8e-e33e-490e-b2ec-b2cc8b5cd77a/tapx_a_1801354_f0014_b.gif)
Bifurcation phenomena in the ion heat transport were found before the finding of electron ITB in many tokamak plasmas [Citation68–Citation78] and in helical plasmas [Citation79–Citation85] (see review [Citation59]). The formation of internal transport barrier in the ion heat transport (ion ITB) is somewhat slower than the electron ITB because this bifurcation is not triggered by the rapid change in the radial electric field. The and
shear gradually increase after the transition from L-mode to ITB plasma as the ion pressure gradient increases due to the reduction of transport. This is in contrast to the L-H transition and the formation of electron ITB where the bifurcation of
triggers the formation of a transport barrier. shows the ion ITB observed in JT-60 U for the first time in 1994 [Citation68]. The ion temperature in the core region starts to increase gradually in constant heating power (phase (I)) as seen in ). The central ion temperature reaches to the high value of 30 keV after the formation of ion ITB. The effective thermal diffusivity, which is defined as the ratio of the total (ion and electron) heat flux
to the total product of the temperature gradient and density,
, gradually decreases from 8 m
/s (at
= 5.55 sec) to 1 m
/s (at
= 5.7 sec). The time scale of the bifurcation (drop of the effective thermal diffusivity) is an order of one hundred milliseconds (
150 ms), which is comparable to the transport diffusion time scale.
One of the reasons for the long time scale of the bifurcation of ion ITB compared with electron ITB is the role of toroidal flow in the feedback process for the bifurcation. In general, toroidal flow in a toroidal plasma is dominated by the plasma flow parallel to the magnetic field, while the poloidal flow is dominated by the flow which is perpendicular to the magnetic field (see review [Citation86]). The time scale of parallel flow change is determined by the momentum transport time scale (perpendicular viscosity or momentum diffusivity), while the time scale of
flow change is determined by the
transition time scale and parallel viscosity [Citation87], which is much larger than the perpendicular viscosity. Therefore, the time scale for the bifurcation could be longer when the toroidal plasma flow plays a key role in the feedback process. ,d) shows the radial profile of ion temperature and toroidal flow velocity in the ITB phase [Citation88]. The toroidal flow shows the well structure at the ITB region where the large ion temperature gradient appears. This is the toroidal flow not driven by external torque but the toroidal flow driven by intrinsic torque recognized as residual stress (see review [Citation6,Citation89]). Although the toroidal flow is dominated by parallel flow, it also has an impact on the radial electric field shear due to the poloidal magnetic field (finite pitch angle of the magnetic field). Therefore, the strong toroidal flow at the ITB region contributes the formation of
shear and can play an important role in the feedback process from low confinement to high confinement regime in the time scale of momentum transport.
2.2.2. Curvature transition in ion ITB
In the feedback loop for the bifurcation in transport, radial electric field is driven by the ion pressure gradient (mainly first derivative of ion temperature). Therefore, the
shear (first derivative of
) should be strongly related to the second derivative of ion temperature,
(curvature). If the second derivative of ion temperature is important in the formation of ITB, there should be two states. One state is positive second derivative
state and the other state is negative second derivative
state because zero second derivative does not provide
shear. The radial profile of ion temperature becomes a concave shape when the positive second derivative is dominant, while it becomes a convex shape for the dominant negative second derivative.
Figure 15. Radial profiles of (a) ion temperature (b) second derivative of ion temperature in the plasma with ITB, and (c) ion thermal diffusivity and coherence of turbulence with the space separation of 2.1 cm at the ITB foot for concave ITB phase ( = 6.04 s time slice A) and convex ITB phase (
= 6.024 s time slice B). (from ), ), and in [Citation90]).
![Figure 15. Radial profiles of (a) ion temperature (b) second derivative of ion temperature in the plasma with ITB, and (c) ion thermal diffusivity and coherence of turbulence with the space separation of 2.1 cm at the ITB foot for concave ITB phase ( = 6.04 s time slice A) and convex ITB phase ( = 6.024 s time slice B). (from Figure 1(a), Figure 2(b), and Figure 4 in [Citation90]).](/cms/asset/97826ab6-a57f-43ed-99fe-b2e93ba16311/tapx_a_1801354_f0015_oc.jpg)
The bifurcation between negative and positive curvature can occur in the ITB plasma. shows the experimental observation of bifurcation within ITB. One is the ITB with weak concave shape and the other is ITB with strong convex shape in JT-60 U [Citation90,Citation91]. As seen in ), the ion temperature only in the ITB region () changes in the steady-state phase of heating. Here, the details of the radial profile of ion temperature were measured with charge exchange spectroscopy with position modulation. The first derivative (gradient) of ion temperature and second derivative (curvature) of ion temperature were derived from the amplitude of the fundamental component and second harmonic component of the modulation frequency [Citation92]. Direct measurements of the second derivative (curvature) of ion temperature were performed for the first time using the charge exchange spectroscopy with position modulation. The evaluation of the second derivative from the fitting curve of the profile strongly depends on the function of the fitting curve and does not provide accurate values of the second derivative of ion temperature.
The ion temperature at the shoulder () and at the foot (
) of ITB is unchanged. The first derivative of the ion temperature
has a negative peak at the center of the ITB region of
. The second derivative of ion temperature,
is negative near the shoulder of ITB and positive near the foot of ITB as seen in ). The radial profile of the second derivative of ion temperature,
shows the differences in this bifurcation phenomena. The region with positive curvature is comparable to the region with negative curvature in the weak concave ITB. In contrast, the region with negative curvature is much wider than the region of positive curvature in the strong convex ITB. This curvature bifurcation between concave ITB and convex ITB demonstrates that the second derivative of the ion temperature plays an important role in the feedback loop for the bifurcation.
) shows the radial profile of ion thermal diffusivity and coherence of turbulence with the space separation of 2.1 cm at the ITB foot for concave ITB phase ( = 6.04s time slice A) and convex ITB phase. The e-folding length of ion thermal diffusivity
is a good measure for the turbulence penetration into the ITB region from the foot point of ITB. The e-folding length of
is 34
(5.5 cm) in the concave ITB and 15
(2.3 cm) in the convex ITB. Larger coherence of turbulence in time slice A (concave ITB phase) is consistent with the longer penetration of turbulence. This difference in the penetration of turbulence from the L-mode region to the ITB region at the foot point causes the difference in the discontinuity of the gradient in space. The discontinuity of the gradient in space that appears near the foot point in the convex ITB should be attributed to the shallow turbulence penetration, while no discontinuity of the gradient in space in the concave ITB should be attributed to the deep turbulence penetration. The turbulence penetration length at the boundary between L-mode region and ITB region is the key parameter to determine the shape of ITB. The bifurcation of turbulence penetration was also observed in the boundary of the magnetic island, which will be discussed below in section V.
Figure 16. Radial profiles of temperature in the plasma with concave and convex ITB and transport landscape model for concave ITB and convex ITB.
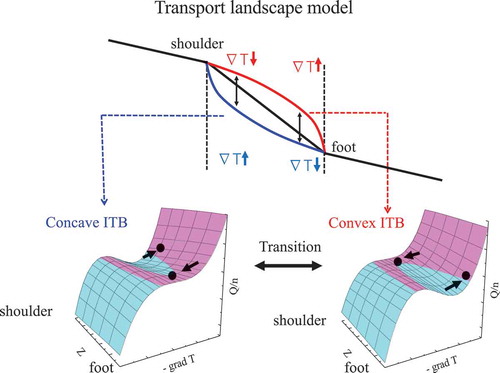
shows the transport landscape model [Citation93] for concave ITB and convex ITB. Concave ITB is characterized by the larger temperature gradient near the shoulder and by the smaller temperature gradient near the foot point. In contrast, convex ITB is characterized by the smaller temperature gradient near the shoulder and larger temperature gradient near the foot point. In the transport landscape mode, multiple solutions of the temperature gradient for the given heat flux exist near the shoulder in concave ITB, while multiple solutions of the temperature gradient for the given heat flux moves near the foot in convex ITB. In the transport landscape mode, the concave – convex ITB transition can be interpreted as the deformation of transport surface due to the exchange of turbulence penetration between shoulder and foot.
2.2.3. Transport branch and slow transition
Figure 17. (a) Heat flux normalized by electron density as a function of electron temperature and its gradient (b) heat flux normalized by electron density as a function of electron temperature gradient at =0.65 after the pellet injection. (from and ) in [Citation94]).
![Figure 17. (a) Heat flux normalized by electron density as a function of electron temperature and its gradient (b) heat flux normalized by electron density as a function of electron temperature gradient at =0.65 after the pellet injection. (from Figure 2 and Figure 4(a) in [Citation94]).](/cms/asset/3cd413a1-848f-4473-918b-0ae6f2b0a3d5/tapx_a_1801354_f0017_oc.jpg)
A clear evidence of bifurcation is the existence of multiple solutions. In the relation between the radial electric field and the plasma parameter, such as electron temperature and density, there are multiple solutions of the radial electric field for the given plasma parameter as seen in ,c). Therefore, clear experimental evidence of bifurcation in transport is the existence of multiple solutions of radial heat flux in the flux-gradient relation (see ) as an example of flux-gradient relation of electron heat transport). As seen in , the multiple solution, which is called transport branch, was observed in the LHD plasma during the recovery phase after the pellet injection [Citation94]. Both temperature and temperature gradient change in time by the injection of pellet in this experiment. The ice pellet was injected to the plasma with different target density and the relation between the heat flux normalized by density to temperature gradient, , was investigated during the recovery phase after the pellet injection, where the density gradually decreases and normalized heat flux,
, increases. There are three phases (indicated as phase II, III, IV) in the recovery phase after the pellet as
increases in time.
The temperature gradient, , increases significantly for the small increase in phase II, but
decreases even
increases in time in phase III. In phase IV,
starts to increase again but the increase of
is smaller than phase II for the same amount of increase of
. For the given
, there are multiple values of
existing in the flux-gradient relation. It should be noted that the experimental data with higher
and with lower
are on the two different curves. One curve is called weak
branch (high confinement branch) and the other curve is called strong
branch (low confinement branch). The temperature and temperature gradient dependence of normalized heat flux
was investigated with the model expressed with
. The temperature dependence
is 0.4 for the weak
branch and 1.4 for the strong
branch, respectively, while the temperature gradient dependence
is
1 for both branches.
It is noted that all the experimental data points after the pellet injection with different target density are connected and located along curves (data points in phase II are on a weak dependence curve and data points in phase IV are on a strong
dependence curve). The data points in the transition phase (phase III) are scattered between the weak and the strong
dependence curves. When the plasma is one of the branches, both the Te and the Te gradient are uniquely determined by the given normalized heat flux, while they are not uniquely determined during the transition phase. This experiment clearly demonstrated the existence of bifurcation in transport. These two transport branches merge with each other at a lower temperature gradient at the critical
gradient. When the temperature gradient is below the critical
gradient, only weak
branch (high confinement branch) exists. The appearance of high
branch (low confinement branch) above the critical
gradient is consistent with the critical gradient transport model, where the heat flux increases sharply above the critical gradient [Citation95].
Figure 18. Time evolution of (a) ion temperature and (b) radial electric field in the discharge with slow transition from L-mode to H-mode and (c) ion temperature gradient inside the separatrix as a function of shear. Radial profiles of electron density,
measured by Li-beam probe (LiBP), ion density,
, and ion temperature,
, for carbon impurity ions measured by CXRS are also plotted. (from )(c) and ) in [Citation97]).
![Figure 18. Time evolution of (a) ion temperature and (b) radial electric field in the discharge with slow transition from L-mode to H-mode and (c) ion temperature gradient inside the separatrix as a function of shear. Radial profiles of electron density, measured by Li-beam probe (LiBP), ion density, , and ion temperature, , for carbon impurity ions measured by CXRS are also plotted. (from Figure 1(a)(c) and Figure 4(b) in [Citation97]).](/cms/asset/2444c534-80fc-42bf-8302-d8dc42da15ed/tapx_a_1801354_f0018_oc.jpg)
The slow transition from the low confinement state to the high confinement state was also observed even in the L-H transition in tokamak [Citation96–Citation98]. ,b) shows the time evolution of ion temperature and radial electric field in the discharge with a slow transition from L-mode phase to H-mode phase in JT-60 U plasma. The plasma exhibits a slow L-H transition within a time scale of 50 ms as the ion temperature and its gradient buildup associated with the formation of well structure of the radial electric field at around the maximum ion temperature gradient location. After the L-H transition at = 4.73 sec, both ion temperature and negative radial electric field near the plasma edge (
= 0.89–0.98) gradually increase. There is no clear jump of the radial electric field at the L-H transition, which is in contrast to the experimental results described in the subsection of the L-H transition. A clear jump of the radial electric field is observed at
= 5.05 sec and 5.14 sec, although there is no jump of ion temperature. This jump of the radial electric field is called the transition between H-mode (H-H transition). A clear relation between ion temperature gradient and
shearing rate,
, defined by
before the H-H transition transition plotted in ) demonstrates the strong coupling between mean
flow and pressure gradient in the feedback loop plotted in . The
shearing rate shows the forward H-H transition at
= 5.05 sec and 5.14 sec and backward H-H transitions at
= 5.09 sec but there is no transition in the ion temperature gradient observed. This observation indicates that the L-H transition is not always triggered by the bifurcation of the radial electric field. The L-H transition can be a slow transition without the bifurcation of the radial electric field. Once the
becomes large enough (
1 MHz), further increase of mean
flow shear does not contribute to the reduction of transport. As seen in ), radial profiles of electron density,
measured by Li-beam probe (LiBP), ion density,
, and ion temperature,
, for carbon impurity ions measured by CXRS are unchanged at the backward transition of
from 5.07 sec to 5.12 sec.
Because the mean flow shear is a key element in the feedback process, large mean
flow shear is observed in the high confinement plasma and small mean
flow shear is observed in the low confinement plasma. In many cases, the
shearing rates,
is consistent with the turbulence growth rates in the high confinement plasma [Citation99]. However, mean
flow shear is not always the cause of bifurcation or transition of transport. The mean
flow shear is the cause of the transition when the fast change of
is observed. When the change of
is slow, the large
flow shear is the result of the large ion pressure gradient produced in the feedback process for transport bifurcation. The time scale of the bifurcation is a key to understanding the role of
flow shear in the bifurcation mechanism.
Transport bifurcation of diffusive term, which is characterized by the sudden drop in electron thermal diffusivity () and ion thermal diffusivity (
), is caused by the suppression of turbulence amplitude due to the
flow shear and/or zonal flow. There are two states in turbulence amplitude and
flow shear strength and zonal flow amplitude. One is the state of low turbulence amplitude with strong
flow shear and/or high zonal flow amplitude. The other is the state of high turbulence amplitude with weak
flow shear and/or low zonal flow amplitude.
2.3. Transport bifurcation in non-diffusive term
2.3.1. Momentum transport (Toroidal flow reversal)
After the first finding of the non-diffusive term of momentum transport in toroidal rotation (momentum pinch in 1994 [Citation100] and residual stress in 1995 [Citation57]), spontaneous or intrinsic toroidal rotation driven by intrinsic torque has been observed in various toroidal devices. It was found that intrinsic toroidal rotation increases roughly proportional to ion temperature gradient [Citation57], ion pressure gradient [Citation101,Citation102], or plasma-stored energy [Citation103]. It was a great mystery why the direction of intrinsic toroidal rotation is different (co or counter-direction) depending on the experimental condition. Turbulent equipartition (TEP) [Citation104] and the symmetry breaking of turbulence between co-traveling turbulence and counter-traveling turbulence have been proposed as a theoretical model to explain the momentum pinch and residual stress. Depending on the wave population of co-traveling and counter-traveling turbulence, the intrinsic rotation can be co-rotation or counter-rotation.
There are various mechanisms causing symmetry breaking of turbulence [Citation105]. One is spectrum shift of due to radial electric field shear [Citation106]. The second is the spectral dispersion of
due to the radial gradient of turbulence intensity [Citation107], the third is parallel acceleration of guiding center due to polarization charge [Citation108], and the fourth is toroidal projection of the perpendicular Reynolds stress [Citation109], which is equivalent to the
force due to the radial current produced by the radial flux of polarization charge. Parallel acceleration is a new candidate among the mechanisms causing the spontaneous rotation and is one of the non-diffusive terms that are independent of mean rotation and mean rotation gradient [Citation108]. This parallel acceleration acts as a local source or sink of parallel rotation. The physics of parallel acceleration is intrinsically different from the Reynolds stress. A quasilinear estimate for ion temperature gradient turbulence shows that the acceleration of parallel rotation by turbulence is explicitly linked to the ion temperature gradient scale length (
) and temperature ratio (
).
Since the direction of the spectrum shift and the sign of the residual stress by the symmetry breaking of turbulence depends on the sign of the radial electric field shear, the direction of the intrinsic rotation depends on the radial electric field and turbulence mode. Therefore, the bifurcation of radial electric field affects the non-diffusive term as well as the diffusive term described in section 2.2.
Figure 19. Time evolution of (a) plasma current, (b) central electron density, (c) central electron and ion temperature, (d) central angular velocity, (e) total angular momentum and radial profiles of angular velocity in the (f) core and (g) edge region of the plasma (from and in [Citation112]).
![Figure 19. Time evolution of (a) plasma current, (b) central electron density, (c) central electron and ion temperature, (d) central angular velocity, (e) total angular momentum and radial profiles of angular velocity in the (f) core and (g) edge region of the plasma (from Figure 2 and Figure 5 in [Citation112]).](/cms/asset/444ffd05-c4e2-436e-a628-b798bf421d2e/tapx_a_1801354_f0019_oc.jpg)
The flow reversal of the toroidal rotation was observed in CHS [Citation110,Citation111] by applying the ECH to the NBI plasma associated with the significant increase of electron temperature by an order of magnitude. ECH itself does not provide any external torque in the plasma. This observation suggests that the large electron temperature produced by ECH drives the intrinsic toroidal rotation which overcomes the toroidal rotation externally driven by NBI. Later the flow reversal was also found to have a bifurcation and transition phenomena, where the flow reversal can occur by a slight change of plasma parameter in various tokamaks [Citation112–Citation116]. shows the flow reversal of intrinsic rotation observed during the slow density ramp in TCV ohmic discharge (with no external torque) [Citation112]. The abrupt flip of central carbon rotation and total carbon angular momentum change their sign from negative (counter-rotation) to positive (co-rotation) during the slow increase of central electron density from 3 10
m
to 7
10
m
. ,g) shows the radial profiles of angular velocity during the flip of rotation (two time slices before, two time slices after the rotation flip, and one time slice at zero rotation) in the core and edge region of the plasma. The time evolution of radial profiles in the core of the plasma ()) shows that the flip of rotation starts from the center of the plasma and then the toroidal angular velocity flips to co-direction in the entire plasma. The time evolution of radial profiles in the edge of the plasma () is quite interesting. Before the flip of the toroidal angular velocity (
1.15 sec) the sign flip of toroidal angular velocity gradient was observed. The core toroidal angular velocity is accelerated to co-direction, while the edge toroidal angular velocity is accelerated to counter-direction. This is clear evidence for the residual stress-driven rotation, where the toroidal angular momentum is conserved. After zero rotation, the edge toroidal angular velocity approaches to zero due to the angular momentum loss at the plasma edge with keeping the gradient of toroidal angular velocity constant. This rapid change in the toroidal angular velocity gradient is attributed to the rapid change of wave population between co-traveling and counter-traveling turbulence, which can take place for the slight change in collisionality without violating the angular momentum conservation.
Figure 20. Time evolution of (a) central toroidal rotation velocity, (b) averaged electron density, (c) density fluctuation intensity with between 4.2 and 5.6 cm
and frequency above 180 kHz, (d) poloidal propagation velocity of turbulence and dispersion plots of turbulence at (e) conditional spectrum of the difference between dispersion plot from 0.859 sec (co-rotation phase) and 0.608 sec (counter-rotation phase) (from and in [Citation117]).
![Figure 20. Time evolution of (a) central toroidal rotation velocity, (b) averaged electron density, (c) density fluctuation intensity with between 4.2 and 5.6 cm and frequency above 180 kHz, (d) poloidal propagation velocity of turbulence and dispersion plots of turbulence at (e) conditional spectrum of the difference between dispersion plot from 0.859 sec (co-rotation phase) and 0.608 sec (counter-rotation phase) (from Figure 1 and Figure 4 in [Citation117]).](/cms/asset/cf9b5fa1-26df-49ce-b9e7-37de63281533/tapx_a_1801354_f0020_oc.jpg)
The relation between the flow reversal and change in turbulence characteristics was studied in Alcator C-Mod [Citation117]. -d) shows the time evolution of central toroidal rotation velocity, averaged electron density, density fluctuation intensity with between 4.2 and 5.6 cm
and frequency above 180 kHz, and poloidal propagation velocity of turbulence. The density fluctuation intensity plotted in the time evolution corresponds to the turbulent intensity of the distinct structure of the lobes (wing) plotted in ). Two transitions of intrinsic toroidal rotation are observed. One is the transition from counter-rotation to co-rotation starting at
= 0.666 sec during the density decreasing phase. The other is the transition from co-rotation to counter-rotation starting at
= 1.146 sec during the density increasing phase. The density fluctuation intensity shows a sharp decrease when the rotation flips from co-rotation to counter-rotation starts. The time evolution of the poloidal propagation velocity of the lobes in ) is well correlated with the co-rotation speed.
Flow reversals from the co-rotation to the counter-rotation are correlated with a sharp decrease in density fluctuations at the lobes structure (2 cm
11 cm
and
70 kHz). For low density operation with co-rotation, this corresponds to the conditions where TEMs are expected to be excited and the wave number observed,
is in the range of trapped electron mode (TEM) turbulence. The critical density for the flow reversal is well correlated to the critical density for the confinement saturation, where the transition from linear ohmic confinement (LOC) regime to saturated ohmic confinement (SOC) region [Citation118]. In the LOC regime, the energy confinement time increases linearly as the electron density is increased. However, the energy confinement time tends to be saturated above the critical density, which is called the SOC regime. In the branch of LOC, the intrinsic toroidal flow is in the co-direction, while the intrinsic toroidal flow becomes counter-direction in the SOC regime.
Figure 21. Time evolution of electron density, electron temperature near the edge (=0.86) and core (
=0.36), ion temperature near the edge (
=0.67) and core (
=0.11) in the discharge in (a) LOC and (b) SOC regime, and (c) radial profiles of intrinsic toroidal flow velocity (from , , and in [Citation118]).
![Figure 21. Time evolution of electron density, electron temperature near the edge (=0.86) and core (=0.36), ion temperature near the edge (=0.67) and core (=0.11) in the discharge in (a) LOC and (b) SOC regime, and (c) radial profiles of intrinsic toroidal flow velocity (from Figure 1, Figure 4, and Figure 7 in [Citation118]).](/cms/asset/8ea2cb66-33df-4bab-8e6e-d16de767b14a/tapx_a_1801354_f0021_oc.jpg)
It is also interesting that the flow reversals by intrinsic torque are related to the non-local phenomena in plasma [Citation119–Citation121] (see review [Citation122]). This is because the non-local phenomena in plasma is attributed to the turbulence with long-distance radial correlation [Citation123], which is also predicted to have a bifurcation. In helical plasma, non-local phenomena have been observed in the low density regime below 1 m
in LHD [Citation124,Citation125]. Flow reversals from the co-rotation to counter-rotation is also observed when the electron density exceeds 1
m
in the discharge with no external torque input [Citation126]. The experiment in C-mod shows that the critical density for the appearance of non-local phenomena is the same as the critical density for flow reversal [Citation118,Citation127]. shows the time evolution of electron density, electron temperature near the edge (
=0.86) and core (
=0.36), ion temperature near the edge (
=0.67) and core (
=0.11) in the discharge in LOC and SOC regime, and radial profiles of intrinsic toroidal flow velocity. The critical density separating the LOC from SOC regime is indicated by the horizontal dashed line. In the LOC plasma, the non-local phenomena, which are characterized by the transient rise of electron and ion temperature associated with the abrupt drop of electron and ion temperature near the plasma edge, are clearly observed. However, this non-local phenomena does not take place in the SOC plasma. Because there is no external torque in Alcator C-Mod, toroidal flow observed is driven by intrinsic torque. The intrinsic toroidal flow velocity is in the co-direction in the LOC plasma. In the SOC plasma, intrinsic toroidal flow velocity in the core is in the counter-direction but the toroidal flow velocity near the edge remains in the co-direction. It is interesting that the reversal of intrinsic flow velocity and intrinsic torque is observed in the real space as well as in the parameter space. These observations in tokamak and helical plasma demonstrate that both non-local phenomena and flow reversal are strongly related to the change in turbulence state, that is, which turbulence is dominant in the plasma.
Nonlinear global gyrokinetic simulation has confirmed that the direction of rotation can flip between TEM and ITG dominated regimes and between LOC (lower density) than in SOC (higher density) [Citation128–Citation131]. However, the critical value of density for the transition of rotation flip depends on time evolution of electron density whether density is ramping or ramping down. This hysteresis characteristic of rotation flip has been observed in Alcator C-Mod and ASDEX Upgrade (AUG) plasma [Citation132–Citation135], which has not been reproduced by the simulation above. The recent gyro-kinetic simulation predicts the change in dominant turbulence and hysteresis characteristic at the transition from LOC to SOC [Citation136]. In this simulation, four families of turbulence are determined depending on the wave number rather than the driven parameters such as ,
, and
gradients. The four families consist of 1) lower-
and 2) higher-
mode that propagates in ion-diamagnetic direction, 3) TEM-like which propagates in the hybrid direction (ion and electron diamagnetic direction), 4) high-
mode which propagates in the electron diamagnetic direction. Family 1) and 2) correspond to ITG mode and family 4) corresponds to ETG mode. In the particle transport, lower-
ITG turbulence is more effective at driving electron density flux down-gradient, higher-
ITG turbulence drives close to zero net electron density flux, and TEM-like turbulence drives inward pinch. ETG turbulence exhausts only electron heat flux. TEM-like turbulence is more dominant in LOC (lower density) than in SOC (higher density). This simulation predicts the transition from LOC branch to SOC branch associated with a change in the mix of mode saturation levels of four families. The simulation demonstrates that a clear hysteresis relation observed in the experiment between the intrinsic toroidal flow and the electron density is attributed to the hysteresis characteristic of turbulence at the transition between LOC branch and SOC branch. Therefore, the direction of the intrinsic rotation is considered to be a good measure for the turbulent state and provides the information that turbulence is dominant in the plasma. The reversal of the toroidal flow from co-rotation to counter-rotation is also predicted theoretically after the change of turbulence from TEM to ion temperature gradient (ITG) mode [Citation105].
Figure 22. (a) Relation between ion heat flux normalized by density and ion temperature gradient at the normalized radius of 0.57 (inside ITB) and (b) radial profile of intrinsic torque (from ) and ) in [Citation137]).
![Figure 22. (a) Relation between ion heat flux normalized by density and ion temperature gradient at the normalized radius of 0.57 (inside ITB) and (b) radial profile of intrinsic torque (from Figure 2(b) and Figure 6(b) in [Citation137]).](/cms/asset/a23b626a-611b-4232-9ae7-3098155b6eb5/tapx_a_1801354_f0022_oc.jpg)
A strong candidate for the mechanism of flow reversal is a flip of the sign of intrinsic torque. Intrinsic torque was experimentally evaluated for L-mode plasma and ITB plasma in LHD [Citation137]. This experiment demonstrates the simultaneous change in the diffusive term of heat transport and non-diffusive term in momentum transport. ) shows the flux-gradient relation of ion heat transport in the discharge where the transition from L-mode phase to ITB phase occurs at = 2.102 sec. When the normalized ion heat flux
is small (phase I), the flux-gradient relation plot shows the characteristics of linear transport regime with constant
. Associated with the increase of normalized heat flux, the
increases sharply at the critical ion temperature gradient (phase II), which is the typical characteristics of transport with a critical gradient mode and power degradation of heat transport with increasing
. At
= 2.102 sec, the ion temperature gradient increases sharply even for the small increase of
(phase III) and reaches the ITB state at
= 2.348 sec. Therefore, the phase I is the linear confinement state, which is similar to the weak
transport branch, and phase II is the L-mode where thermal diffusivity increases with gyro-Bohm nature as
. Phase III is the formation of ITB where the
decreases as the
is increased.
) shows the radial profile of intrinsic torque derived from the radial momentum flux using the two similar ITB discharges with co-NBI and counter-NBI. Momentum transport has three terms. The first term is the diffusive term proportional to velocity gradient (). The second term is non-diffusive term which is proportional to velocity (
). And the third term is the residual stress term driven by intrinsic torque which does not depend on
and
. When the direction of NBI is reversed, the sign of
and
is flipped, but the sign of the residual stress term should be unchanged. Therefore, residual stress term can be obtained from the sum of momentum flux of co-NBI and counter-NBI as [
by assuming same
and
for the plasma with co-NBI and counter-NBI. In the L-mode phase, the intrinsic torque is negative and drives the rotation in counter-direction (anti-parallel to the equivalent plasma current which gives the poloidal field produced by an external coil current) in the core and the intrinsic torque is positive and drives the rotation in co-direction. This intrinsic torque reversal in space in LHD L-mode plasma is similar to the flow reversal in space observed in SOC plasma in Alcator C-mod (see )). After the transition to the ITB phase, the intrinsic torque becomes positive and drives the plasma rotation in co-direction. This result is consistent with the disparity of toroidal rotation which is indicated by the significant contribution of spontaneous rotation in counter-direction in L-mode plasma [Citation138] and co-direction in the ITB plasma [Citation139] in LHD.
2.3.2. Particle transport (convection reversal)
The bifurcation of non-diffusive term of particle transport of bulk ion and impurity has been observed in various toroidal systems. Density peaking has been widely observed in the plasma with pellet injection [Citation140–Citation142], counter-NBI [Citation143], reversed magnetic shear in tokamak [Citation144,Citation145], and careful gas puff [Citation146]. The spontaneous density peaking is sometimes (but not always) observed in the H-mode plasmas [Citation147–Citation149]. Although the long sustainment of peaked density profiles with pellet injection is attributed to the reduction of the diffusive term of particle transport, the spontaneous density peaking requires the non-diffusive term of particle transport with negative sign, which is called inward pinch, as well as the reduction of the diffusive term.
Figure 23. (a) Density profile evolution in (a) the plasma with pellet injection, (b) H-mode plasma with off-axis ICRF, (c) ohmic H-mode and the relation between density gradient and temperature gradient in (d) the core region () and (e) the mid-radius ((
) and (f) the relation between density gradient and magnetic shear (from in [Citation149], and in [Citation150]).
![Figure 23. (a) Density profile evolution in (a) the plasma with pellet injection, (b) H-mode plasma with off-axis ICRF, (c) ohmic H-mode and the relation between density gradient and temperature gradient in (d) the core region () and (e) the mid-radius (() and (f) the relation between density gradient and magnetic shear (from Figure 1 in [Citation149], Figure 3 and Figure 4 in [Citation150]).](/cms/asset/6e463f96-4624-4db2-850a-33618a1a4079/tapx_a_1801354_f0023_oc.jpg)
Especially in the plasma without NBI (heated by ICRF), density peaking can not occur without a strong inward particle pinch. ,c) shows the density profile evolution of the pellet enhanced performance (PEP) mode with ICRF, off-axis ICRF H-mode, and ohmic H-mode in Alcator C-Mod [Citation149]. The sharp density gradient appears at major radius of 0.75 m, which indicates the formation of particle internal transport barrier (ITB). Peaked density in the PEP mode gradually decrease in magnitude and returns to pre-pellet levels 110 msec after the pellet injection. The internal poloidal magnetic field has been measured during lithium pellet PEP mode by imaging the pellet ablation trail. It was demonstrated that the current density profile following the pellet was hollow, resulting in a region of reverse shear in the plasma core. The slow density profile evolution indicates that the diffusion coefficient is low but there is no significant inward pinch to balance the outward particle flux due to particle diffusion. In contrast, the density peaking in the off-axis ICRF H-mode with and ohmic H-mode is purely due to the inward pinch, because there is almost no particle source in the core region in these high density ICRF and ohmic heated plasmas, where there is no beam fueling from NBI. The profile evolution, shown in ) starts just as the central density begins to rise. The core density continues to increase steadily over the next 300 msec. The discharge is finally terminated by the radiation collapse due to impurity accumulation in the core. The ohmic H-mode is typically induced by ramping the toroidal magnetic field down to a low value, and the plasma sawtooth activity slows and stops while the density is most peaked, suggesting that exceeds 1 for at least part of this event. In this case the ITB lasted more than 400 msec, at least ten energy confinement times, ending only as the plasma current began to ramp down in a controlled termination of the discharge. The central density continues to increase after the L-H transition, which shows the net particle flux at the ITB region is inward until the termination of the discharge. The net inward particle flux at the ITB region is clear evidence that the inward flux due to the inward pinch exceeds the outward flux due to the diffusion. It should be noted that although the density gradient is comparable between the PEP mode plasma and ohmic H-mode plasma, the sign of net radial particle flux is opposite which demonstrates two types of density peaking. One is reduction of diffusion term and the other is due to negative non-diffusive term (inward pinch).
Because the particle source is localized near the plasma edge and there is almost no particle source and radial flux and
in the plasma core (see Equationequation (1)
(1) ). The non-diffusive term is considered to have two terms. One is due to the electron temperature gradient (thermo-diffusion) and the other is due to magnetic shear and can be expressed as
[Citation150]. ,e) shows the relation between the density gradient and the temperature gradient in the core region (
) and the mid-radius (
). The dependence of
on
is opposite in the core and mid-radius. The coefficient,
is positive (
0.2) in the core, where ITG becomes dominant, while
is negative (
−0.2) in the mid-radius where TEM becomes dominant, due to the density gradient. The relation between density gradient and magnetic shear plotted in ) shows a positive slope with the coefficient of
= 0.8, which indicates that the inward pinch increases as the magnetic shear increases due to the peaking of the current density profile. Theoretical transport model predicts that the sign of the coefficient,
becomes positive and the first term is directed inwards in the plasmas dominated by the ITG instability, while
becomes positive and the first term is directed outward in the plasmas dominated by the TEM [Citation151]. The sign of the second term is always positive (directed inward) regardless of the dominant turbulence, which results in the inward non-diffusive particle flux even in the plasma dominated by the TEM. Because of the second term, density profile is expected to be more peaked for higher magnetic shear (larger (
) and higher internal inductance
in tokamak [Citation152]).
Figure 24. (a) Time evolution of line averaged density and plasma energy and radial profile of (b) electron temperature and (c) electron density, and (d) density dependence of energy confinement time (), impurity confinement time (
) with ISS95 and W7AS energy confinement scaling (
: solid curve and
: dashed curve) (from Figure 1, Figure 2, and Figure 3(a) in [Citation153]).
![Figure 24. (a) Time evolution of line averaged density and plasma energy and radial profile of (b) electron temperature and (c) electron density, and (d) density dependence of energy confinement time (), impurity confinement time () with ISS95 and W7AS energy confinement scaling (: solid curve and : dashed curve) (from Figure 1, Figure 2, and Figure 3(a) in [Citation153]).](/cms/asset/353ad60d-5c4f-4a83-90f5-58881ca1a81f/tapx_a_1801354_f0024_b.gif)
The negative non-diffusive term of impurity transport causes a serious problem, the so-called impurity accumulation, especially in the high confinement state where the ratio of non-diffusive term to diffusive term increases due to the reduction of diffusivity coefficient. The sign flip of non-diffusive term (convection) from negative to positive is a desirable bifurcation phenomena in high confinement plasma, because the impurity accumulation often observed in high confinement plasma can be suppressed by the positive convection of impurity transport. ) shows the time evolution of electron density stored energy and of L-mode normal confinement (NC dashed lines) and improved confinement (IC solid lines) mode which is assigned the acronym ‘high density H-mode’ (HDH) in Wendelstein 7-AS (W7-AS [Citation153]). The HDH discharge was produced by a rapid density buildup by gas puffing at the very start of the discharge during NBI initiation. The stored energy of HDH mode is almost double the stored energy of L-mode later in the discharge ( 0.5 sec). As seen in , electron temperature profile is similar but the electron density profile is quite different between the two confinement modes. Although the electron density is peaked in the L-mode (NC mode), the electron density profile in the HDH-mode (IC mode) is flat with significantly high edge electron density. Larger stored energy is due to the much higher edge density in the HDH plasma (IC mode). It should be noticed that this flat density is also due to the reduction of inward pinch (negative convection) of the particle transport which is significant in the NC mode. The flat electron density shows that the non-diffusive term of particle transport is almost zero in the HDH mode.
This HDH mode is characterized by the ELM-free H mode, without the disastrous side effect of impurity accumulation normally accruing at higher densities. ) shows the density dependence of energy confinement time (circles) and impurity confinement time (square) for the discharge with 1 MW NBI. Energy confinement time increases as the electron density is increased. The jump of energy confinement time at 1.5 10
m
is due to the transition from L-mode to HDH mode. The energy confinement time in the HDH mode is significantly large (15
20 ms), which is much higher than the scaling of the energy confinement time of ISS95 and W7-AS. The impurity confinement time is 30 times higher (300 ms) than the energy confinement time in the L-mode. This large impurity confinement time is not due to the low diffusivity but to the negative convection, where the outward radial flux of the diffusive term is balanced to the inward radial flux of the non-diffusive (convection) term. However, impurity confinement time significantly drops at the transition from L-mode to HDH-mode and the impurity confinement time in the HDH mode is 40
50 ms, which is only two to three times of energy confinement time. This significant drop of the ratio of impurity confinement time to energy confinement time at the transition from L-mode to HDH-mode is a significant benefit of bifurcation phenomena of the sign flip of convection (non-diffusive term) in the impurity transport.
The similar sign flip of convection of impurity was also observed in the ion ITB plasma in LHD. The outward convection in the ion ITB plasma was large enough to make the impurity density profile extremely hollow. Because the impurity density at the magnetic axis (plasma center) is smaller than the impurity density near the plasma edge by a factor of 5 10, this is assigned as ‘impurity hole’ [Citation154,Citation155]. The positive impurity density gradient in the ‘impurity hole’ causes degradation of confinement and results in slow termination of ion ITB. The formation of ‘impurity hole’ is occurring gradually after the formation of ion-ITB and the time scale of ‘impurity hole’ is
1 sec which is longer than the time scale of ion-ITB formation of 0.1 sec. This difference in time scale between impurity hole formation and ion-ITB formation results in the short sustainment of ion-ITB phase, because the ion-ITB can be sustained only in the period before the completion of impurity hole formation. In the deuterium plasma, the impurity hole formation is mitigated and the sustainment of the ion ITB phase becomes longer [Citation156].
Figure 25. (a) Time evolution of carbon density and (b) relation between radial particle flux of carbon normalized by the carbon density and the gradient of carbon density normalized by the carbon density. A solid line indicates the relationship in the case of zero convection velocity and constant diffusion coefficient (from Figure 1(d) and Figure 2 in [Citation157]).
![Figure 25. (a) Time evolution of carbon density and (b) relation between radial particle flux of carbon normalized by the carbon density and the gradient of carbon density normalized by the carbon density. A solid line indicates the relationship in the case of zero convection velocity and constant diffusion coefficient (from Figure 1(d) and Figure 2 in [Citation157]).](/cms/asset/33c9c639-509f-453f-8be7-587a4a51a982/tapx_a_1801354_f0025_oc.jpg)
The sign flip of convection of impurity was directly evaluated in the ion ITB plasma in LHD [Citation157]. shows the impurity behavior during the formation of ion-ITB in the LHD plasma. The carbon density increases before the transition from L-mode phase to ITB phase. After the transition from L-mode plasma to ITB plasma, the carbon density measured with charge exchange spectroscopy at various radii ( = 0.1, 0.48, 0.67, 0.89) starts to decrease, while the ion temperature increases. The central ion temperature reaches its maximum value at
= 4.2 sec. It should be noted that decrease of carbon density near the magnetic axis (
= 0.1) is much more significant than the decrease of carbon density near the plasma edge (
= 0.89), which indicates that the carbon density becomes hollow after the transition.
The radial particle flux of carbon is evaluated from the change carbon density (volume integrated time derivative of carbon density). ) shows the flux-gradient relation of carbon density at = 0.75, before (
= 3.93 sec) and after (
= 4.03 sec) the formation of the impurity hole. Before the formation of the impurity hole, the radial flux is negative (inward convection) with peaked carbon density (negative carbon density gradient
). After the transition, the radial flux becomes positive (outward convection) with peaked carbon density (negative gradient
) at
= 4.03 sec in a short time (within 0.1 sec). Then the carbon density gradient becomes positive (
) and carbon density profile becomes hollow. Outward radial carbon particle flux decreases as the carbon density gradient increases and the profile becomes extremely hollow, where the inward radial flux by positive density gradient is balanced with the outward radial flux by outward convection. The diffusion coefficient derived from the slope of the dashed line during the formation of the impurity hole is 0.12 m
/s, which is consistent with the long time scale of impurity transport (
1 sec). The outward convection velocity derived from the y-value at zero gradient is 0.32 m/s. It should be noted that the change in the sign of convection is much faster than the time scale of impurity transport. This rapid change in convection can not be explained by the change in neoclassical transport.
Although the outward convection of impurity transport is characteristics of ion ITB plasma in helical plasmas, the inward convection of impurity transport is usually observed in tokamak [Citation81]. (In some cases, when the density profile is flat the outward impurity convection and hollow impurity density profile is reported in the ITB-plasma [Citation158]). This difference is attributed to the difference of turbulent state between helical plasma and tokamak plasma. This is also one of the candidates to explain the difference of the density profile, where the flat or the hollow density profile is typical in helical plasma, while peaked density profile is typical in a tokamak plasma. Although the relation between turbulent state (such as TEM or ITG mode) and convection of particle of bulk ion and impurity is not well understood, the bifurcation phenomena of convection of impurity transport suggests that the sign of convection is sensitive to turbulent state.
Transport bifurcation of non-diffusive term, which is characterized by the sign flip of toroidal flow, convection of bulk ion and impurity ions, are mainly due to the change in turbulence type. This is because the turbulence structure (wave number vector of ,
,
) is different depending on the turbulence type and the sign of non-diffusive term is determined by the symmetry breaking (e.g.
,
). Correlation between the sign of non-diffusive term and the turbulence change between ITG and TEM are commonly observed and predicted by simulation. However, other changes in turbulence type can also cause the sign flip of non-diffusive term.
2.4. Isotope Mixing beyond diffusive/non-diffusive model
Isotope mixing is a new transport concept in the mixture plasma which can not be explained solely by the conventional diffusive/non-diffusive model described in Equationequation (1)(1) . In the conventional diffusive/non-diffusive model, each isotope has its own diffusion coefficient (D) and coefficients of non-diffusive term (C
, C
) as described in section 2.3.2. These coefficients between different isotope species (e.g. hydrogen and deuterium) have been considered by the electron density, temperature, magnetic shear, and radial profile of each isotope species is determined independently. However, recent simulation and experiment reveals that the radial profile of each isotope species is determined by the strength of coupling between two species. When the coupling between two species becomes strong, the radial profile of each isotope species becomes identical due to large ion-ion collisions. On the other hand, when the coupling between two species becomes weak, the radial profile of each isotope species can be different if the particle source location of each species is different.
Figure 26. Radial profiles of deuterium, hydrogen, electron density, deuterium (D) particle source by pure deuterium NBI and 50–50% H-D recycling (edge source), electron and ion temperature for (a)(b) ITG dominant regime and (c)(d) TEM dominant regime in the hydrogen (H) and deuterium (D) mixture plasmas (from Figure 16 and Figure 19 in [Citation162]).
![Figure 26. Radial profiles of deuterium, hydrogen, electron density, deuterium (D) particle source by pure deuterium NBI and 50–50% H-D recycling (edge source), electron and ion temperature for (a)(b) ITG dominant regime and (c)(d) TEM dominant regime in the hydrogen (H) and deuterium (D) mixture plasmas (from Figure 16 and Figure 19 in [Citation162]).](/cms/asset/d59eae64-cc90-4ca5-aa43-3a3d8268b914/tapx_a_1801354_f0026_oc.jpg)
In the one species plasma, the electron density is equal to ion density
, and the difference between electron diffusion coefficient
and ion diffusion coefficient
can not be resolved due to the quasi-neutral condition. This characteristic is analogized to the fact that ion thermal diffusivity and electron thermal diffusivity can not be resolved experimentally in the high density plasma where energy exchange between ion and electron is larger than the energy input for the ion or the electron. However, in the isotope mixture plasma (hydrogen and deuterium mixture plasma) the ratio of ion diffusion coefficient to electron diffusion coefficient
has a strong impact on isotope density profile. QuaLiKiz transport model [Citation159,Citation160] using nonlinear gyrokinetic simulations GKW code [Citation161] predicts that ion diffusion coefficient is much larger than that of electron (
) for the turbulence propagating in the ion diamagnetic direction (ITG mode) while that electron diffusion coefficient is much larger than that of ions (
) for the turbulence propagating in the electron diamagnetic direction (TEM) for bulk ion (
= 1). The difference of ion diffusion and electron diffusion is largest for bulk ions and the difference becomes smaller with impurity as ion charge
is increased. For example, the diffusion ratio
for ITG mode becomes 19 for Helium and 15 for carbon, while the diffusion ratio
for TEM becomes 5 for helium and 2 for carbon. The ratio of
has weak dependence on atomic mass
. This characteristic suggests that the impurity with larger
is more sensitive to the turbulent state than the bulk ions.
shows radial profile of electron (), hydrogen (
), and deuterium (
) density, deuterium source, and electron and ion temperature (
,
) in the plasma with
(ITG dominant regime) and in the plasma with
(TEM dominant regime) using plasma parameters in JET tokamak [Citation162]. Here, a 50–50 concentrations of H and D were imposed at the
= 0.85 boundary. The NBI particle source was imposed to be pure D in this calculation. The deuterium density (
) profile is peaked and hydrogen density (
) profile becomes hollow in the TEM dominant regime. This is due to the significant beam fueling contribution, which reaches 50% of edge source in the core region (
= 0.3–0.4). In contrast, in the ITG dominant regime, the deuterium density (
) profile is similar to the hydrogen density (
) profile and only slightly more peaked in deuterium density profile even for significant contribution of D-beam fueling as seen in D source. This is because the ion mixing between hydrogen and deuterium occurs owing to the large
ratio in the ITG dominant regime.
Figure 27. Radial profiles of (a) electron density, (b) electron and ion temperature, hydrogen density fraction before (non-mixing state) and after (isotope-mixing state), (c) hydrogen pellet, and (d) deuterium pellet injection (from Figure 6(a)(b) and Figure 4 in [Citation163]).
![Figure 27. Radial profiles of (a) electron density, (b) electron and ion temperature, hydrogen density fraction before (non-mixing state) and after (isotope-mixing state), (c) hydrogen pellet, and (d) deuterium pellet injection (from Figure 6(a)(b) and Figure 4 in [Citation163]).](/cms/asset/9df329cf-dded-4110-b2eb-e29cb3cb124c/tapx_a_1801354_f0027_oc.jpg)
The transition from non-mixing to mixing state was experimentally observed in the hydrogen and deuterium (H-D) mixture plasma in LHD [Citation163]. In this experiment, the radial profiles of density ratio of hydrogen to deuterium were measured with bulk charge exchange spectroscopy [Citation164]. shows the radial profiles of electron density, electron temperature and ion temperature before and after the pellet injection. Hydrogen fraction before and after the hydrogen pellet injection and deuterium pellet injection are also plotted in ) and (d), respectively. Hydrogen fraction is peaked before the pellet injection due to the H-beam fueling with deuterium dominant recycling condition. Because the particle deposition of pellet injection is located near the plasma edge at = 0.9, the hydrogen fraction is expected to become less peaked for the hydrogen pellet injection and more peaked for the deuterium pellet injection. However, the hydrogen fraction becomes flat after both the hydrogen and the deuterium pellet injections, which are clear evidence for the mixing state of the isotope.
Before the pellet injection, the electron density profile is slightly peaked (negative gradient at = 0.8) and the electron temperature is higher than the ion temperature (
). After the pellet injection, the electron density profile becomes hollow (positive gradient at
= 0.8), the electron temperature significantly decreases, but the decrease of ion temperature is relatively small, and the electron temperature is close to ion temperature (
). The gyrokinetic simulation code [Citation165–Citation167] predicts that TEM turbulence is unstable before the pellet injection and ITG turbulence becomes unstable after the pellet injection. This result is qualitatively consistent with the prediction of QuaLiKiz transport model + nonlinear GKW gyrokinetic simulation using the plasma parameters in JET. Therefore, the bifurcation of turbulent state (TEM or ITG) is expected to cause the bifurcation of isotope mixing and non-mixing state in the plasma.
The isotope mixing/non-mixing is critical to the deuterium-tritium (D-T) plasma in the future devices such as ITER. The isotope mixing is a favorable condition for fusion plasma, because the isotope ratio in the core plasma becomes identical to the isotope ratio at the plasma edge easily adjusted by gas puff. Bifurcation of mixing and non-mixing is expected to occur between bulk ion and impurity as well as between isotope species (H-D or D-T). Ion mixing between bulk ion and helium ash in D-T fusion plasma is also an important issue, because the helium ash produced by the fusion reaction in the D-T plasma tends to be accumulated at the plasma center in the non-mixing state.
Isotope mixing bifurcation is also caused by the change in turbulence type or the ratio of , where
is ion diffusivity coefficient and
is electron diffusivity coefficient. In the one-species plasma, the ion density profile becomes identical to electron density profile regardless of the ratio of
due to the quasi-neutrality condition. When the ion diffusion is smaller than electron diffusion coefficient (
), each isotope density profile depends on each particle source location and isotope density ratio profile becomes non-uniform. In contrast, when the ion diffusion is larger than the electron diffusion coefficient (
), isotope density ratio becomes uniform regardless of the particle source location, which is called isotope mixing. The transition from non-mixing to mixing is expected associated with the transition from TEM and ITG mode by the gyro-kinetic simulation.
3. MHD bifurcation
3.1. Bifurcation of static magnetic topology
3.1.1. Magnetic island
Figure 28. (a) Torn flux surfaces of = 3/2 magnetic islands of full width
, (b) schematic of radial pressure profiles through an O-point and an X-point with island
, and (c) the island growth,
, and decay,
, rate calculated with Rutherford equation for different levels of peak co-ECCD current density,
, normalized to the local equilibrium bootstrap current,
(from Figure 1 and Figure 2 in [Citation172]).
![Figure 28. (a) Torn flux surfaces of = 3/2 magnetic islands of full width , (b) schematic of radial pressure profiles through an O-point and an X-point with island , and (c) the island growth, , and decay, , rate calculated with Rutherford equation for different levels of peak co-ECCD current density, , normalized to the local equilibrium bootstrap current, (from Figure 1 and Figure 2 in [Citation172]).](/cms/asset/426bee3b-c197-43b6-b3b5-b82d3842d671/tapx_a_1801354_f0028_b.gif)
Bifurcation phenomena of magnetic topology between normal nested magnetic flux, magnetic island, and stochastic magnetic fields have been found in a toroidal plasma. A magnetic island is a closed magnetic flux surface bounded by a separatrix (X-point), isolating it from the rest of the space, which is created by the nonlinear growth of the tearing mode [Citation13,Citation168–Citation170]. The = 3/2 magnetic flux surface torn by the tearing mode of
= 3/2 rational surface is plotted in ). This bifurcation can be expressed by the so-called Rutherford equation (relation between island growth rate
and island width
) [Citation171] as seen in ) [Citation172]. Here
is an island full width at the O-point (O-pt) of the magnetic island and
and
are resistive diffusion time and minor radius at the magnetic island. One solution is the small width (
= 2 cm) and the other is the large width (
= 7.5 cm). The solution of small
is unstable solution because
when
, where
is the island width for zero
. In contrast, the solution of large
(indicated as saturate island) is stable because
for
and
for
. The width of saturate magnetic island tends to decrease as the fraction of peak co-ECCD current density is increased to the level comparable to bootstrap current density. When the fraction of ECCD current density is increased to the level twice the bootstrap current density, the magnetic island disappears (island healing) because there is no solution for
and
becomes negative everywhere. Then magnetic island is predicted to be healed by applying co-ECCD at the O-point of the magnetic island. In fact, the experimental test of stabilization of this mode by ECCD has been performed in tokamak plasmas [Citation173–Citation175]. The Rutherford equation predicts the nonlinear growth (rapid increase in width of magnetic island) and nonlinear stabilization (rapid decrease of magnetic island) to zero) of the neoclassical tearing mode for the slight change of plasma condition [Citation176].
3.1.2. Stochastization of magnetic field
In general, the neoclassical tearing mode (NTM) is unstable and magnetic island with = 2/1 mode is often observed at
= 2 rational surfaces in tokamak plasma [Citation177]. When the size of the magnetic island reaches a critical value, magnetic braiding or appearance of the secondary magnetic island can occur. The phenomenon has been predicted theoretically [Citation178] and also observed in experiment [Citation179,Citation180]. The overlapping of magnetic island at the same
surface and at two rational surfaces nearby can cause the stochastization of the magnetic field. The stochastization of the magnetic field has been recognized as one of the crucial issues in tokamak, because the stochastization in the edge region may enhance the edge transport and contribute to the mitigation of edge localized mode (EML) in the resonance magnetic perturbation (RMP) experiment [Citation181,Citation182].
Figure 29. Diagram of the feedback loop for magnetic topology bifurcation.
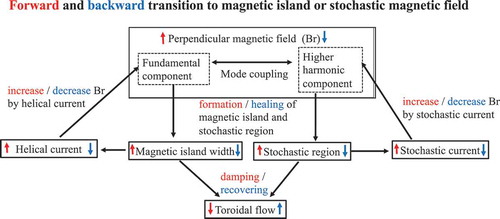
shows a diagram of the feedback loop for magnetic topology bifurcation. Once the magnetic field becomes stochastic by the increase of the perpendicular magnetic field , the higher harmonic helical component of toroidal current flowing on the magnetic field increases due to the stochastic magnetic field. This helical current enhances the high harmonic component of
and accelerates the stochastization of the magnetic field. On the other hand, when the high harmonic component of
is reduced, the higher harmonic helical component decreases and decelerates the stochastization of the magnetic field. Therefore, the bifurcation phenomena (transition from nested magnetic flux surface to stochastic magnetic field and back transition) can occur in the steady-state phase of the discharge [Citation183,Citation184]. The transition from nested magnetic flux surface to stochastic magnetic field has been experimentally observed in reversed-field pinch (RFP) and helical plasma, while there is no clear transition observed in tokamak plasma. In tokamak plasma, the transition to stochastic magnetic field by overlapping of magnetic island is expected to occur just before the disruption [Citation185,Citation186]. However, the transition has not been identified in the experiment due to the short time scale of disruption phenomena.
The stochastic magnetic field causes the damping of the toroidal flow, which contributes the suppression of stochastization of the magnetic field. Therefore, once the stochastization of magnetic field starts, the toroidal flow also starts to decrease and further stochastization of the magnetic field occurs. The relation between the stochastization of the magnetic field and flow damping is discussed in the subsection of flow damping.
Figure 30. Time evolution of (a) plasma current (b) magnetic fluctuation amplitude of the dominant mode (=1/7: black) and the secondary mode (
=1/8
1/23: red) and radial profiles of electron temperature in the quasi-single helicity (QSH) states (green) and the single-helical-axis (SHAx) state (red and blue), where magnetic fluctuation amplitude of the dominant mode exceeds 4% (from Figure 1 and Figure 3(a) in [Citation16]).
![Figure 30. Time evolution of (a) plasma current (b) magnetic fluctuation amplitude of the dominant mode (=1/7: black) and the secondary mode (=1/8 1/23: red) and radial profiles of electron temperature in the quasi-single helicity (QSH) states (green) and the single-helical-axis (SHAx) state (red and blue), where magnetic fluctuation amplitude of the dominant mode exceeds 4% (from Figure 1 and Figure 3(a) in [Citation16]).](/cms/asset/49b0a6ff-5203-42e4-9f4a-891852977272/tapx_a_1801354_f0030_oc.jpg)
Magnetic topology bifurcation (from stochastic magnetic field nested magnetic flux surface) and the transport barrier formation were observed in reversed-field pinch (RFP) [Citation16,Citation187–Citation189]. At the transition, the magnetic field perturbations with multimode in the stochastic state disappears and the magnetic field perturbations with only one single mode becomes dominant. As seen in , the spontaneous oscillation between two states is observed [Citation16]. One is multiple helicity state with no dominant mode and the other is the quasi-single-helicity (QSH) state where the dominant = 1/7 mode is much larger than the secondary modes with
= 1/8
1/23 mode in the steady state of plasma current. As the Lundquist number increases, the dominant mode amplitude grows, whereas the amplitude of the secondary ones is reduced.
When the amplitude of the dominant mode exceeds 4%, the internal transport barrier formation occurs. This is called the single-helical-axis (SHAx) state. The single-helical-axis (SHAx) state is characterized by the high central electron temperature which is almost double that in the quasi-single-helicity (QSH) state. Temperature gradient is almost zero (flat profile) in the core region (
0.25 m) in the QSH state. After the transition to the single-helical-axis (SHAx) state, the sharp temperature gradient appears at mid-radius (0.05 m
0.25 m), which refers to the formation of the internal transport barrier (ITB) associated with the magnetic topology bifurcation in RFP plasma. The spontaneous occurrence of a new self-organized helical equilibrium with a single-helical-axis, reduced magnetic fluctuations, and strong transport barriers provides a change of paradigm for the RFP. Although the RFP devices have toroidal symmetry, the plasma with single-helical-axis (SHAx) has self-organized helical structure produced by ohmic current with a helical structure. Therefore, it is interesting to compare the reverse phenomena in helical plasma.
The helical structure of the magnetic field in helical system is mainly created by the external helical coil current. In helical system, poloidal field created by external coil current is relatively weak near the plasma center and central rotational transform typically 0.3 (
3), while the edge
is close to 1 (
1). Therefore, the impact on toroidal current driven by neutral beam current drive (NBCD) is relatively small at the edge (5–10%) but can be large enough to modify the
and magnetic shear. The topology bifurcation from nested magnetic flux surface to stochastic magnetic field was observed in the helical plasma in LHD [Citation17].
Figure 31. (a) Time evolution of (a) temperature gradient, (b) magnetic shear at the rational surface of = 0.5, and (c) temperature fluctuations in the frequency range of 0.8–1.2 kHz. The radial profiles of electron temperature in the temperature flattening phase with and without MHD instability and in the peaked profile phase are also indicated. (d) Size of the magnetic island as a function of magnetic shear at the
= 0.5 rational surface (from and ) in [Citation17]).
![Figure 31. (a) Time evolution of (a) temperature gradient, (b) magnetic shear at the rational surface of = 0.5, and (c) temperature fluctuations in the frequency range of 0.8–1.2 kHz. The radial profiles of electron temperature in the temperature flattening phase with and without MHD instability and in the peaked profile phase are also indicated. (d) Size of the magnetic island as a function of magnetic shear at the = 0.5 rational surface (from Figure 3 and Figure 4(b) in [Citation17]).](/cms/asset/6249a69b-0195-4b76-b474-b8e1887a5e10/tapx_a_1801354_f0031_oc.jpg)
shows the time evolution of temperature gradient, magnetic shear at the rational surface of = 0.5, and temperature fluctuations in the frequency range of 0.8–1.2 kHz in LHD [Citation17]. In this discharge, the direction of NBI is exchanged at
= 4.3 sec from co-NBI to counter-NBI (co to ctr) or counter-NBI to co-NBI (ctr to co). The magnetic shear at the
= 0.5 (
= 2) rational surface was measured with the Motional Stark Effect (MSE) spectroscopy [Citation190–Citation193]. After the beam switch from counter-NBI to co-NBI, the central
decreases due to return current, while the edge
increases due to the neutral beam current drive (NBCD) in co-direction, which results in the increase of magnetic shear at mid-radius where
= 0.5 rational surface locates. (Please note that the
profile in the vacuum field in LHD is hollow and increases towards the plasma edge and magnetic shear are negative everywhere.) In contrast, magnetic shear at
= 0.5 rational surface decreases after the beam switch from co-NBI to counter-NBI due to the increase of central
and decrease of edge
.
The decrease of magnetic shear is transient because the return current decays in the current diffusion time of a few seconds and the magnetic shear tends to recover (increase) after = 5.3 sec. As seen in ), the
gradient at
= 0.5 rational surface shows the sudden drop at
= 4.6 sec and the flattening of
inside
= 0.5 rational surface is observed at
= 5.5 sec (time slice B), which implies the stochastization of magnetic field. At
= 6 sec, the temperature fluctuation suddenly appears near the
= 0.5 rational surface at
= 0.43 and
near the magnetic axis slightly recovers as seen in the
profile at
= 6.5 sec (time slice C). As the magnetic shear gradually increases, the temperature gradient at
= 0.5 rational surface suddenly recovers to the level before the NBI switch and temperature profile becomes peaked at the plasma center at
= 7.5 sec (time slice D).
In this discharge, there are three transitions of magnetic topology. The first transition is from nested magnetic flux surface to stochastic magnetic field at = 4.6 sec. The second transition is from a stochastic magnetic field to the magnetic flux with magnetic island at
= 6.0 sec. The third transition is the disappearance of the magnetic island and back to the nested magnetic flux surface at
= 7.4 sec. ) shows the effective island width,
, evaluated from the flattening region of
as a function of magnetic shear,
, at
= 0.5 rational surface in this discharge. The relation between
and
shows clear hysteresis characteristics in the topology bifurcation indicated as the loop from nested magnetic flux in low magnetic shear (time slice A)
stochastic magnetic field (time slice B)
magnetic island (time slice C)
nested magnetic flux surface in high magnetic shear (time slice D).
The dotted line is the island width expected from the error field, and the size of the magnetic island measured is even larger than the expectation. The growth of this stochastic magnetic island is within 50 ms without a significant fluctuation in and this time scale is much shorter than the time scale of change in magnetic shear and the size of the magnetic island decreases as the magnetic shear increases. This experiment demonstrates that the saturated magnetic island can have a bifurcation to the healed state (no magnetic island) by shrinking and healing or to the stochastic state (large magnetic island) by growing magnetic island with higher harmonic modes depending on the magnitude of the magnetic shear.
Experimental identification of magnetic topology whether it is a stochastic magnetic field or nested is difficult in the plasma with a magnetic island. This is because flattening is usually observed both at the O-point magnetic island and the region of the stochastic magnetic field [Citation194,Citation195].
flattening at the O-point magnetic island is not due to enhanced transport but is due to the lack of heat flux across the magnetic island. Most of the heat flux in the radial direction are through X-point of the magnetic island. Transport inside the magnetic island is even significantly reduced because of the small gradient of temperature. Reduced transport (low electron thermal diffusivity
) has been confirmed by the slow propagation of cold or heat pulse inside the magnetic island [Citation196–Citation198]. The significantly low value of ion thermal diffusivity
, which is one order of magnitude smaller than the nested magnetic flux surface outside the magnetic island was reported in JT-60 U [Citation199].
The pulse propagation experiment has been recognized to be a powerful tool to identify the magnetic topology whether nested or stochastic. The cold pulse is produced by the tracer encapsulated solid pellet (TESPEL [Citation200]) injection at the plasma edge and the cold pulse propagates from plasma edge to plasma center. In contrast, heat pulse is usually produced by the modulation electron cyclotron heating (MECH) near the plasma center and the heat pulse propagates from plasma center to the plasma edge. The cold and heat pulse propagation inside the magnetic island (at O-point) has the unique feature of bidirectional propagation. The pulse propagates from the boundary to the O-point of the magnetic island. The pulse propagation from inner () island boundary to the O-point is outward, while the propagation from outer (
) island boundary to the O-point is inward, here
is a radius of O-point of the magnetic island. Therefore, the radial profile of the delay time of the heat pulse calculated from the phase delay,
, as
has a peak at the O-point of the magnetic island, where
is the modulation frequency of MECH. The delay time inside the magnetic island is relatively large (1
10 ms) due to the reduced transport (low pulse propagation) and the modulation frequency of
was typically set to 40
50 Hz. In order to analyze the heat pulse propagation in the non-steady state plasma, where the amplitude and phase delay of the heat pulse change rapidly, the wavelet analysis for the heat pulse propagation has been developed [Citation201,Citation202].
Figure 32. Radial profiles of the delay time of a heat pulse in the plasma with (a) magnetic island in the discharge with a fast shear drop and (b) stochastic magnetic field in the discharge with a slow shear drop, and (c) time evolution of the normalized = 2/1 perturbation field,
, estimated from the saddle loop measurements. Poincaré map of the magnetic field of line calculated by the 3D equilibrium code in the plasmas with (d) an
= 2/1 magnetic island and (e) a stochastic region with
= 2/1, 4/2, 6/3, and 8/4 perturbations of toroidal current using the iota profile consistent with the measurements (from , , and in [Citation203]).
![Figure 32. Radial profiles of the delay time of a heat pulse in the plasma with (a) magnetic island in the discharge with a fast shear drop and (b) stochastic magnetic field in the discharge with a slow shear drop, and (c) time evolution of the normalized = 2/1 perturbation field, , estimated from the saddle loop measurements. Poincaré map of the magnetic field of line calculated by the 3D equilibrium code in the plasmas with (d) an = 2/1 magnetic island and (e) a stochastic region with = 2/1, 4/2, 6/3, and 8/4 perturbations of toroidal current using the iota profile consistent with the measurements (from Figure 3, Figure 4, and Figure 5 in [Citation203]).](/cms/asset/9b40ccc8-67f2-4170-82e8-92cf178602a7/tapx_a_1801354_f0032_oc.jpg)
)(b) shows radial profiles of the delay time of a heat pulse in the plasma with magnetic island in the discharge where the magnetic shear is decreased intentionally from standard shear ( 1 at
= 0.5 rational surface) to low magnetic shear 0.2
0.4 by switching the direction of NBI from co-NBI to counter-NBI [Citation203]. Radial profiles of deposition power density of modulated electron cyclotron heating (MECH) and neutral beam injection (NBI) are also plotted. Both magnetic island and stochastic magnetic field region appear in the plasma with low – medium magnetic shear. When the magnetic shear is high enough (
1 standard operation) the magnetic flux surface is completely nested in the core region. The slight difference of the drop rate of the magnetic shear causes the bifurcation of magnetic topology to the magnetic island or to the stochastic magnetic field at the
= 0.5 rational surface in the plasma core (
= 0.35). The magnetic island appears for (a) fast drop of magnetic shear below 0.5 (
= 0.49 at
= 4.8s and 0.39 at
= 5.1s), while the stochastic magnetic field region appears for (b) slow drop of magnetic shear keeping the magnetic shear above 0.5 (
= 0.58 at
= 4.8s and 0.51 at
= 5.1s). The stochastization of the magnetic field occurs for the medium magnetic shear of
0.5, while the fundamental mode (usually lowest order of
= 2/1) grows at low magnetic shear. In the discharge with fast drop of magnetic shear, although the magnetic shear across 0.5, the time period at
0.5 is too short to cause the transition to the stochastic magnetic field and the magnetic island grows when the magnetic shear decreases to below 0.5. The transition from nested magnetic flux surface to the stochastic magnetic field requires a certain time period of the medium magnetic shear in order to cause the overlapping of the higher harmonic magnetic islands at different rational surfaces nearby.
) shows the time evolution of the normalized = 2/1 perturbation field,
, estimated from the saddle loop measurements. The poloidal distribution of the magnetic flux in radial direction,
, and the fitted curve with
= 1 and 2 Fourier component at
= 5.1 s in the discharge with stochastic region by a slow magnetic shear drop and in the discharge with
= 2/1 magnetic island by a fast magnetic shear drop are also plotted. In the discharge with fast magnetic shear drop, the
= 2 Fourier component of the magnetic field perturbation,
, estimated from the saddle loop measurements start to increase from
= 4.8 sec, which is well correlated to the growth of magnetic island (an increase of island width indicated by vertical dashed lines) at
= 0.5 rational surface. However, in the discharge with fast magnetic shear drop, there is no increase of
observed, which is consistent with the growth of the stochastic magnetic field instead of the magnetic island. The
= 1 structure of
in this case is due to the small
= 1/1 magnetic island at
= 1 rational surface near the plasma edge. )(e) shows the Poincaré map of the magnetic field of line calculated by the 3D equilibrium code in the plasmas with an
= 2/1 magnetic island and a stochastic region with
= 2/1, 4/2, 6/3, and 8/4 perturbations of toroidal current using the
profile consistent with the measurements as a possible magnetic configuration as a result of bifurcation of magnetic topology.
In tokamak, the magnetic flux surface is usually nested. This is because the plasma tends to be terminated by the disruption as soon as the stochastization of the magnetic field occurs in the wide region in the core plasma by overlapping of magnetic islands. However, when there is external resonance or non-resonant magnetic perturbation (RMP or NRMP), the bifurcation between stochastic magnetic field and nested magnetic flux could occur in the edge region. It is commonly observed that edge localized mode (ELM) is suppressed or mitigated when the current of perturbation coil is large enough. The hysteresis relation between magnitude of perturbation field (current of perturbation coil) and the mitigation of edge localized mode (EML) is observed in the coil current ramp-up and ramp-down experiment in ASDEX [Citation204]. The coil current threshold for the ELM mitigation during the coil current ramp-up phase is much higher than the threshold at the coil current ramp-down phase. This apparent hysteresis suggests the bifurcation of magnetic topology. The similar hysteresis relation is also observed in KSTAR [Citation205]. The bifurcation of perpendicular velocity of turbulence which is mainly contributed by flow was found to be directly associated with the bifurcation between ELM suppression and mitigation. The hysteresis relation between the perpendicular velocity and RMP coil current is clearly observed. The coupling between turbulent fluctuation also shows a bifurcation. The nonlinear interaction between turbulent eddies is strong in the ELM suppression phase, while it is relatively weak in the ELM mitigation phase. The energy exchange between the turbulent eddies is expected to prevent the growth of the ELM activities. These experiments demonstrate very interesting interaction between magnetic topology,
flow, turbulence, and MHD stability.
3.1.3. Toroidal flow damping by magnetic island and stochastization
There are two processes for toroidal flow damping. One is toroidal moment loss due to the diffusion term of momentum transport, and the other is damping due to the so-called MHD mode locking [Citation206,Citation207], where the toroidal momentum loss occurs through the interaction of the
force of the currents induced in the vessel wall or the interaction of the
component of MHD mode and
component of error field [Citation208,Citation209].
Figure 33. (a) Time evolution of (a) Locked mode amplitude, (b) Ni XXVII ion toroidal rotation velocity, and (c) ICRH and NB heating power. (d) Time evolution of frequency and amplitude of =2/1 MHD mode. (e) Solution of equations to determine the normalized frequency of the MHD mode,
, as a function of
, where
is island width (from in [Citation210] and and in [Citation211]).
![Figure 33. (a) Time evolution of (a) Locked mode amplitude, (b) Ni XXVII ion toroidal rotation velocity, and (c) ICRH and NB heating power. (d) Time evolution of frequency and amplitude of =2/1 MHD mode. (e) Solution of equations to determine the normalized frequency of the MHD mode, , as a function of , where is island width (from Figure 9 in [Citation210] and Figure 1 and Figure 2 in [Citation211]).](/cms/asset/e7585826-a2e4-4308-ad58-cc11dc1b91b7/tapx_a_1801354_f0033_b.gif)
The transition to the MHD mode locking is characterized by the sudden increase of = 1 component of perturbation of radial magnetic field,
and decrease of toroidal ion flow velocity,
, (Ni
ion in this experiment) in the steady-state condition of heating power of NBI (
) and ICRH (
) in JET tokamak as seen in [Citation210]. ) shows the time evolution of
= 2 mode amplitude and frequency, which reflects the toroidal flow velocity at the location where the MHD mode exists [Citation211]. The
= 2 mode amplitude begins to increase at
= 0.52 sec and continues increasing in time. When this
= 2 mode amplitude exceeds a critical value, the abrupt decrease of mode frequency is observed. The growth of MHD mode (an increase of mode amplitude) precedes the flow damping (decrease of toroidal flow velocity). As the toroidal flow velocity decreases, the
= 2 mode amplitude increases further, which suggests the feedback process between growth of MHD mode and flow damping.
As seen in the solution of equations to determine the normalized frequency of the MHD mode, , as a function of
, where
is island width, shows hysteresis curve, at the transition to MHD mode locking. Here
is frequency of the MHD mode and
is the time scale of the penetration of the magnetic fluctuation into the resistive wall. In the 1st branch, the MHD mode frequency gradually decreases as the magnetic island width,
increases. When the magnetic island width,
reaches to the critical value (
= 21), the irreversible jump to the end branch takes place and the MHD mode frequency is significantly reduced to almost zero, which indicates the plasma toroidal rotation stops (flow damping) by the growth of the magnetic island. The toroidal flow damping due to growth of the magnetic island was found to be restricted inside the magnetic island in the plasma with MHD mode locking in JT-60 U [Citation199] and DIII-D [Citation212]. Highly localized flow damping inside the magnetic island results in the large flow shear at the boundary of the magnetic island because of the finite plasma toroidal flow driven by NBI torque outside the magnetic island.
Figure 34. (a) Time evolution of (a) toroidal flow velocity (b) magnetic shear and radial profiles of (c) toroidal flow velocity, (d) electron temperature, (e) ion temperature, and (f) electron density before ( = 5.64 sec) and after (
= 6.44 sec) the stochastization of magnetic field (from )(d) and in [Citation18]).
![Figure 34. (a) Time evolution of (a) toroidal flow velocity (b) magnetic shear and radial profiles of (c) toroidal flow velocity, (d) electron temperature, (e) ion temperature, and (f) electron density before ( = 5.64 sec) and after ( = 6.44 sec) the stochastization of magnetic field (from Figure 1(a)(d) and Figure 2 in [Citation18]).](/cms/asset/f531bffe-e9cb-4363-916b-d24534336f28/tapx_a_1801354_f0034_oc.jpg)
Since the overlapping of higher harmonic magnetic islands causes the stochastization of magnetic field, flow damping due to stochastic magnetic field is expected. In fact, significant flow damping by the stochastization of the magnetic field was observed in LHD as seen in [Citation18]. After the switch of the NBI direction from co-NBI to counter-NBI at 5.3 sec, the magnetic shear decreases from 1 to 0.5. Because the magnetic medium shear is necessary for the overlapping of higher harmonic magnetic islands at different rational surfaces nearby, the magnetic shear was controlled to be 0.5. In this experiment, the magnetic topology was identified by modulation ECH (MECH). The ECH power deposition is localized near the magnetic axis at which is experimentally determined by the location of zero delay time. The delay time profile before the stochastization of magnetic field (
= 5.75 sec) shows the monotonic increase from deposition location to the plasma edge, which is evidence for the nested magnetic flux surface. Magnetic stochastization occurs at
= 6.0 sec (0.3 sec after the magnetic shear reaches 0.5). The wide stochastization of the magnetic field in the core region (
) was identified by the wide flat region of the delay time of heat pulse provided by the modulation ECH (MECH) as seen in the delay time profile at
= 6.25s . The sudden drop of toroidal flow in the plasma core (
= 0 and
= 0.25) was observed associated with the transition from nested magnetic flux surface to stochastic magnetic field. The flow measurement with high time resolution shows that the drop of toroidal flow due to the stochastization is linear decay and not the exponential decay because of the feedback process between stochastization and flow damping. These results suggest that the damping of the flow is due to the change in the non-diffusive term of momentum transport [Citation139] or a direct electromagnetic effect associated with the stochastization of the magnetic field [Citation213,Citation214]. At
= 6.7 sec, the toroidal flow starts to recover associated with another transition from stochastic magnetic field to magnetic flux surface with magnetic island which is identified by the peaked delay time profile at
= 0.5, where the
= 0.5 rational surface locates.
The toroidal flow velocity, electron temperature, and ion temperature profiles show the significant flattening associated with the stochastization of the magnetic field. It is interesting that the electron temperature profile shows the complete flattening, but the ion temperature profile is slightly peaked. This is due to the difference in effective thermal diffusivity in the stochastic magnetic field between ion and electron. The thermal diffusivity in the stochastic region can be evaluated as , where
and
are the thermal velocities of electrons and ions, respectively, and
is the diffusion of the field line defined in [Citation215,Citation216]. Therefore, the effective thermal diffusivity in the stochastic magnetic field is proportional to the thermal velocity of particles and the difference in the magnitude of the flattening between ion and electron temperature profiles is due to the difference in the thermal velocity of ions and electrons. The change in the density profile associated with the bifurcation from nested to stochastic magnetic field is small as seen in ) because the electron density profile is flat in the core region even in the plasma with nested magnetic field. The flattening of toroidal flow is quite significant as seen in ). The drop of toroidal rotation velocity starts at the rational surface of
and expands to the magnetic axis in the time scale of 40 ms. This strong flow damping observed cannot be explained by the simple Rechester-Rosenbluth model [Citation217] because the increase of Prandtl number observed associated with the stochastization is 3 and much larger than that predicted (
1) and there are clear differences in the decay between ion temperature and toroidal flow velocity.
The topology bifurcations of magnetic flux surface have been found in various toroidal plasma in tokamak, reverse field pinch, and helical system. One is the bifurcation of magnetic topology between the normal nested magnetic flux surface and the flux surface with magnetic island, which is due to the helical current at the rational surface. The other is the bifurcation of magnetic topology to the stochastic magnetic field caused by the perturbation magnetic field perpendicular to the magnetic flux surface. The stochastization of the magnetic field is experimentally detected by the fast radial propagation of heat pulse. Significant flow damping of plasma flow is observed associated with the stochastization of the magnetic field.
3.2. Bifurcation of MHD instability (parity transition)
The parity of MHD instability is related to the magnetic topology. shows the diagram of magnetic topology, radial profile of electron temperature, and time evolution of electron temperature for the MHD oscillation with interchange parity and tearing parity. The interchange mode is usually driven by the pressure gradient at the rational surface and has a kink like (flute like) structure in the magnetic flux surface [Citation218–Citation220]. The displacement of magnetic flux surface, , which is usually identical to the equi-temperature surface, has even parity. Associated with the plasma rotation in poloidal direction, the temperature oscillation amplitude usually measured with ECE has a peak at the rational surface and the temperature oscillations across the rational surface (at A and at B) are in-phase. In contrast, the tearing mode is usually driven by the current gradient of rational surface and has a magnetic island structure in magnetic flux surface [Citation221]. The displacement of magnetic flux surface,
, has odd parity and the temperature profile has a flat region inside the magnetic island (O-point), while there is no flat region at X-point. Then the temperature oscillation amplitude has two peaks across the rational surface and the temperature oscillations across the rational surface (at A and at B) are out-of-phase. The tearing mode is usually observed in tokamak plasma where the normal magnetic is positive, while the interchange mode is usually observed where the normal magnetic shear is negative. Although the identification of driving force is not easy, the parity of MHD instability can be easily determined in experiment. Therefore, MHD instability with odd parity is called tearing parity, while the MHD instability with even parity is called interchange parity. From the theoretical point of view, the current gradient-driven mode is called tearing mode, while the pressure gradient-driven mode is called interchange mode. Tearing mode with interchange parity driven by current gradient can be unstable in tokamaks, which is called current-interchange tearing modes [Citation222]. The terminology of ‘mode’ is defined by driving force in the calculation in MHD theory, while the terminology of ‘parity’ is defined by the measurements in the experiment.
Figure 35. Diagram of magnetic topology, radial profile of electron temperature, and time evolution of electron temperature for the MHD oscillation with interchange parity and tearing parity.
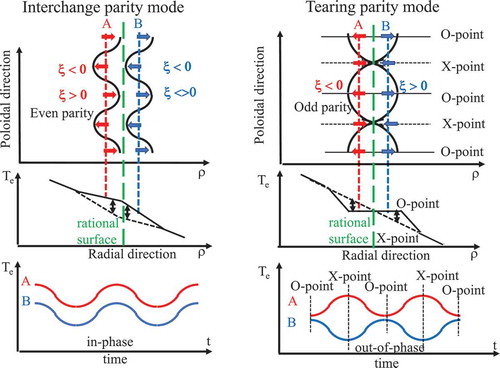
Figure 36. Amplitude and phase of oscillation of electron temperature measured with ECE with interchange parity (a)(b) at = 970 ms and tearing parity (c)(d) at
= 985 ms (from in [Citation224]).
![Figure 36. Amplitude and phase of oscillation of electron temperature measured with ECE with interchange parity (a)(b) at = 970 ms and tearing parity (c)(d) at = 985 ms (from Figure 5 in [Citation224]).](/cms/asset/3ad29bc1-5e2d-48cb-ac05-d937dfdcefd7/tapx_a_1801354_f0036_b.gif)
In general, MHD instability with interchange parity is more unstable in helical plasma where the normal magnetic shear is negative, while MHD instability with tearing parity is more unstable in tokamak where the normal magnetic shear is positive. Recently it has been reported that both interchange and tearing parity modes are unstable depending on the plasma parameter in both tokamak and helical plasma [Citation223–Citation226]. In the helical plasma, where the magnetic shear is negative, MHD instability with tearing parity is observed in the lower beta () plasma, while MHD instability with interchange parity is observed in the higher beta (
) plasma [Citation226]. Interchange modes can be unstable even in tokamak when the magnetic shear becomes negative. Resistive interchange modes have been observed in DIII-D negative central shear discharges [Citation223]. The topology transition from a resistive mode with interchange parity to a resistive mode with tearing parity was observed during the sudden collapse of central temperature in negative central shear plasmas in the DIII-D Tokamak as seen in [Citation224]. The central temperature drop starts at
= 940 ms and begins to recover at
= 975 ms. The temperature oscillation with interchange parity appears during the collapse phase, while the temperature oscillation with tearing parity appears during the recovery phase. The radial profile of the oscillation phase with interchange parity is characterized by the even parity without the phase jump (160 degrees at
= 0.3 and 170 degrees at
= – 0.3) across the
= 2 rational surface. In contrast, the radial profile of oscillation phase with tearing parity is characterized by the odd parity with the phase jump of 160 degrees (170
and 330
) at
= 0.3 and of 200 degrees (150
and 350
) at
= – 0.3 across the
= 2 rational surface. The oscillation amplitude profile is peaked at the rational surface for interchange parity mode, while the radial profile of oscillation amplitude with tearing parity has two peaks at
= 0.24 and
= 0.38 across the rational surface at
= 0.3. The difference in amplitude and phase of the oscillation is due to the difference of the magnetic topology of the nested magnetic flux and magnetic island.
Figure 37. (a)(b)(d)(e) Time evolution of poloidal magnetic field perturbation and contour of amplitude of = 1 (CW) and
= 1 (CCW) component and (c)(f) radial profiles of the plasma displacement in the phase (a)(b)(c) stationary 1/1 MHD mode with interchange parity and (d)(e)(f) rotating 1/1 MHD mode with tearing parity. (from ) and )(b)(f)(g) and )(f) in [Citation225]).
![Figure 37. (a)(b)(d)(e) Time evolution of poloidal magnetic field perturbation and contour of amplitude of = 1 (CW) and = 1 (CCW) component and (c)(f) radial profiles of the plasma displacement in the phase (a)(b)(c) stationary 1/1 MHD mode with interchange parity and (d)(e)(f) rotating 1/1 MHD mode with tearing parity. (from Figure 1(a) and Figure 2(a)(b)(f)(g) and Figure 4(b)(f) in [Citation225]).](/cms/asset/75e56a85-4815-4eba-b546-b0e35b39e353/tapx_a_1801354_f0037_oc.jpg)
Current driven MHD instability does not always have tearing parity but may have interchange parity depending on the condition. In contrast, pressure-driven MHD instability does not always have interchange parity, but may have tearing parity [Citation227]. The transition between pressure-driven MHD instability in tearing parity and that with interchange parity was reported in reversed field pinch plasma [Citation228] and helical plasmas [Citation225]. shows the transition of topology of MHD instability from stationary 1/1 mode with interchange parity to rotating 1/1 mode with tearing parity observed in LHD plasma [Citation225]. This transition is triggered by the very rapid growth of highly localized deformation in toroidal, poloidal, and the radial direction, namely tongue deformation [Citation229,Citation230] by = 0 and following minor plasma collapse with magnetic field reconnection. Similar highly localized deformation has been observed in RFP and tokamak plasma and has been called slinky mode [Citation231], fingerlike perturbation [Citation232], and solitary perturbation [Citation233]. Before the tongue deformation (
), the frequency of the mode is
4 kHz and the amplitude of mode traveling clockwise (CW) and counter clockwise (CCW) is almost identical, which indicates that this mode is stationary like a standing wave. This mode shows the repeated growth and decay in a time scale of ms (within few cycles of oscillation) but does not cause the minor collapse of plasma until the tongue deformation appears at non-resonant magnetic flux surface (not at the rational surface with low
mode). After the tongue deformation and collapse (
), the mode frequency increases to 10 kHz with gradual frequency chirping down afterward and the amplitude of mode of traveling CW becomes dominant, which indicates this mode is a rotating mode. The radial profile of displacement is evaluated from the fluctuation amplitude of electron temperature,
, and
gradient measured with ECE as
. The stationary
= 1/1 mode has a peak near the
=1 rational surface at
= 0.89 with interchange parity (even parity across
=1 rational surface). In contrast, rotating
= 1/1 mode has tearing parity (odd parity across
=1 rational surface). The transition from interchange parity to the tearing parity of the MHD mode is due to the change of magnetic topology of perturbation from flute type to magnetic island type.
These experimental observations show the fast magnetic field reconnection which is necessary for the bifurcation of magnetic topology at the rational surface. The time scale for the reconnection is much faster than the prediction of the Sweet-Parker model [Citation234]. The fast reconnection was also observed in the solar flare [Citation235,Citation236]. It is an interesting question what causes the fast reconnection and parity change associated with the minor collapse of plasma observed in these experiments.
The topology bifurcations of magnetic flux surface are also identified by the parity of MHD instability with respect to the rational surface. When the temperature oscillation across the rational surface has even parity, it is called MHD instability with interchange parity. In contrast, when the temperature oscillation across the rational surface has odd parity, it is called MHD instability with tearing parity. The transition between MHD instability with interchange parity and tearing parity occurs at the minor collapse with magnetic field reconnection.
4. Interplay between transport and MHD bifurcation
4.1. Turbulence spreading in magnetic island
Interplay between turbulent transport and MHD instability has been recognized to be a crucial issue in toroidal plasma and various theoretical works on this topic have been done [Citation237–Citation241]. Turbulence spreading corresponds to the spatio-temporal propagation of turbulence from a region where it is locally excited to a region of weaker excitation such as transport barrier [Citation90], magnetic island [Citation242], and scrape-off-layer [Citation243], and it plays an important role in determining the turbulence penetration into these regions [Citation244,Citation245] (see review [Citation246]). When the turbulence spreading into these regions is large enough, the discontinuity of temperature gradient at the boundary becomes small or disappears, while the discontinuity of or
gradient (second derivative of temperature) could be large when the turbulence spreading is shielded. Because the
flow shear is roughly proportional to the second derivative of temperature,
flow shear is expected to be enhanced at the sharp boundary where the discontinuity of the temperature gradient is large. On the other hand, turbulence spreading is theoretically expected to be shielded by the
flow shear [Citation247]. Therefore, the interaction between
flow shear and turbulence spreading have a feedback loop for the bifurcation between shallow turbulence penetration state and deep turbulence penetration state.
At the boundary of the magnetic island, turbulence spreading into magnetic island from outside the magnetic island is mainly through the X-point of the magnetic island [Citation242]. Since the magnetic field is stochastic near the X-point of the magnetic island, turbulence spreading should be sensitive to the width of the stochastic magnetic field. As discussed in section IV, the stochastization of magnetic field causes the flow damping. Then the interplay between the transport bifurcation ( flow shear and turbulence spreading) and MHD bifurcation (stochastization and flow damping) provide complicated feedback loops for the bifurcation phenomena in magnetic island. When the width of the stochastic region at the X-point becomes narrow,
flow shear increases, turbulence spreading is suppressed, the sharpness of boundary (discontinuity of the temperature gradient) increases, and the width of the stochastic region at the X-point decreases. This could be the process for the transition from high turbulence spreading state to low turbulence spreading state. In the back-transition, the width of the stochastic region at the X-point becomes wider,
flow shear decreases, turbulence spreading is enhanced, the sharpness of boundaries (discontinuity of the temperature gradient) decreases, and the width of the stochastic region at the X-point increases.
Figure 38. Diagram of the feedback loop for turbulence spreading bifurcation.
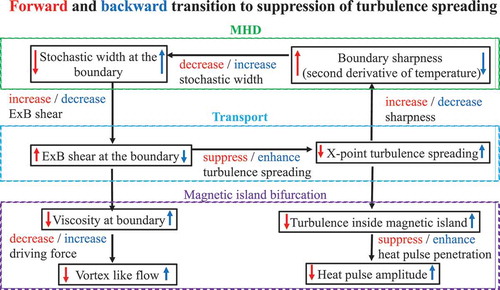
Because the turbulence level of spreading turbulence inside the magnetic island is too small to be detected, the amplitude of the heat pulse inside the magnetic island is measured as an indication of turbulence spreading. Turbulence level inside the magnetic island is dominated by the turbulence spreading into the magnetic island from outside because the locally excited turbulence can be negligible due to the flattening of temperature (zero temperature gradient) inside the magnetic island. Heat pulse propagation speed is a good measure of turbulence level. shows a diagram of the feedback loop for turbulence spreading bifurcation. When the turbulence level is low, the heat pulse propagates slowly. And when the turbulence level is high, the heat pulse propagates faster. As the heat pulse propagation speed is slowing down, the amplitude of the heat pulse decreases in the O-point region because most of the heat flux propagates toward the plasma edge through X-point. When the heat pulse amplitude is large due to high turbulence spreading state, it is called the high heat pulse accessibility state. In contrast, it is called the low heat pulse accessibility state when the heat pulse amplitude is small due to the low turbulence spreading. The flow shear at the boundary of the magnetic island becomes strong in the magnetic island without convective poloidal flow. However, associated with the appearance of convective poloidal flow inside the magnetic island,
flow shear at the boundary of the magnetic island becomes weak and the turbulence spreading increases. Therefore, convective poloidal flow inside the magnetic island could be a measure of turbulence spreading.
shows the contour of density fluctuation in the (,
) plane and helical cut measured with beam emission spectroscopy (BES) with phase-lock averaged over 250 island rotation cycles in DIII-D [Citation248]. Density fluctuation,
, inside the magnetic island (O-point of the magnetic island) is significantly lower than the fluctuation outside the magnetic island. The magnitude of the density fluctuation is not flux function. It is interesting that the density fluctuation is larger near the inner island boundary than the outer island boundary. Density fluctuation with helical cut shows that the reduction of density fluctuation amplitude at the O-point region is about 30%. The density fluctuation is significantly reduced near the O-point of the magnetic island where the temperature gradient is close to zero. The residual density fluctuation at the O-point of the magnetic island is considered to be turbulent not locally excited but propagating from outside the magnetic island by turbulence spreading.
Figure 39. Relative change of low- density turbulence
relative to before NTM onset in the (a) 2D contour in (
,
) and (b) helical cut at
= 206 cm. Time evolution of
and
at
=0.74 in the (c)X-point and (d) O-point phase, where
is the time delay between
and
(from )(e) in [Citation248] and ) in [Citation242]).
![Figure 39. Relative change of low- density turbulence relative to before NTM onset in the (a) 2D contour in (, ) and (b) helical cut at = 206 cm. Time evolution of and at =0.74 in the (c)X-point and (d) O-point phase, where is the time delay between and (from Figure 7(c)(e) in [Citation248] and Figure 3(d) in [Citation242]).](/cms/asset/f18b0581-9711-46e4-bff2-eaf279e013c6/tapx_a_1801354_f0039_oc.jpg)
In order to study how the turbulence propagates into magnetic island, the heat pulse propagation experiment was performed by applying the 50 Hz modulation ECH in the plasma with = 2/1 magnetic island [Citation242]. Here, an external perturbation coil referred to as the C-coil [Citation249] is used to control the size and the phase of the
= 2/1 magnetic island. The magnetic island width reaches to
= 0.16, which is large enough to obtain the precise radial propagation of heat pulse with ECE and density fluctuation with BES. The phase of C-coil was flipped by 180 degrees to measure the propagation of heat pulse and density fluctuation both at the O-point and at the X-point of the magnetic island. shows conditional averaged time evolution of
and
at
=0.74 in the X-point and the O-point phase with respect to the on/off time of modulation ECH, where
is the time delay between
and
. Because the density fluctuation amplitude increases associated with the increase of temperature, both density fluctuation amplitude and electron temperature are modulated by the modulation of ECH. The density fluctuation modulation precedes the heat pulse modulation in the O-point of the magnetic island, while the heat pulse modulation precedes the density fluctuation modulation in the X-point of the magnetic island. This is because the heat pulse propagates rapidly in radial direction as the projection of parallel heat pulse propagation with electron thermal velocity to the radial direction, while the density fluctuation, which does not propagate along the magnetic field line, propagates slowly across the magnetic flux surface near the X-point. In contrast, the heat pulse propagates slowly from the boundary of the magnetic island of the O-point due to the low level of fluctuation inside the magnetic island, while the density fluctuation propagates rapidly from X-point to O-point due to the turbulence spreading [Citation250]. Therefore, these experimental results are clear evidence of density fluctuation propagation from X-point to O-point (turbulence spreading) much faster than that heat pulse propagates from the boundary to the O-point of the magnetic island.
Figure 40. Time evolution of (a) modulation of electron temperature, , and ECH power,
, (b) modulation amplitude (envelop of
) of electron temperature modulation,
, (c) the modulation amplitude of the difference between the magnetic field measured with two magnetic probes,
, located at the toroidal angle of 200
and 307
, and contour of relative modulation amplitude of electron temperature in space and time during the (d) forward transition (from high accessibility to low accessibility state) and (e) backward transition (from low accessibility to high accessibility state) (from )(b)(c) and in [Citation19]).
![Figure 40. Time evolution of (a) modulation of electron temperature, , and ECH power, , (b) modulation amplitude (envelop of ) of electron temperature modulation, , (c) the modulation amplitude of the difference between the magnetic field measured with two magnetic probes, , located at the toroidal angle of 200 and 307, and contour of relative modulation amplitude of electron temperature in space and time during the (d) forward transition (from high accessibility to low accessibility state) and (e) backward transition (from low accessibility to high accessibility state) (from Figure 1(a)(b)(c) and Figure 6 in [Citation19]).](/cms/asset/54fa9b14-b403-488e-bb82-f059a08c1e5d/tapx_a_1801354_f0040_oc.jpg)
Self-regulated oscillation of transport and topology of magnetic islands was observed in DIII-D [Citation19]. This is a good example of interplay between transport bifurcation and MHD topology bifurcation. The amplitude of the heat pulse propagating into the O-point of the magnetic island shows the self-regulated oscillation associated with the bifurcation of turbulence spreading at the boundary of the magnetic island. shows the time evolution of modulation of electron temperature measured with ECE with a high pass filter ( 30 Hz),
, and ECH power of a series of ECH pulses, and modulation amplitude (envelope of
) of electron temperature modulation,
, using a low pass filter (
40 Hz) at
= 0.78 (O-point of magnetic island). ) the modulation amplitude of the difference between the magnetic field measured with two magnetic probes,
, located at the toroidal angle of 200
and 307
with the C-coil toroidal angle set at 185
, where the ECE diagnostics are located at a toroidal angle with 81
(at O-point of magnetic island). The modulation amplitude of the magnetic field is a measure of
=1 perturbation current, which is related to the width of the O-point of
= 2/1 magnetic island or stochasticity at X-point of the magnetic island. Their self-regulated oscillation in temperature and magnetic field shows the transition between the two states. One is high accessibility state which is characterized by the larger amplitude of modulation of electron temperature due to the heat pulse penetration. The other is low accessibility state, where the amplitude of modulation of electron temperature is small due to the shielding of the pulse penetration at the boundary of the magnetic island.
is a contour plot of relative modulation amplitude of electron temperature in space and time during the forward transition (from high accessibility to low accessibility magnetic state) and backward transition (from low accessibility to high accessibility state) at O-point of magnetic island at = 0.64–0.8. Although the location of the boundary of the magnetic island and the width of a magnetic island is unchanged during the forward and backward transition, the penetration of the heat pulse evaluated on the modulation amplitude shows a significant change. In the high accessibility state (
in (d) and
in (e)), the amplitude of the heat pulse gradually decreases towards the O-point of the magnetic island at
= 0.72. In contrast, in the low accessibility state (
in (d) and
in (e)), the amplitude of heat pulse drops significantly at the boundary of the magnetic island
= 0.64 and 0.8, which indicates the shielding of heat pulse penetration into magnetic island. Since the fluctuation propagates with heat pulse, the shielding of turbulence is also expected associated with the shielding of heat pulse penetration. Therefore, this transition between turbulence penetration due to strong turbulence spreading and turbulence shielding due to the suppression of turbulence spreading by
shear is also expected to occur. Turbulence spreading into the magnetic island has a bifurcation phenomenon through the interaction between
shear and the magnetic field stochastization at the X-point of the magnetic island. In this experiment, the penetration length of heat pulse is a good measure of turbulence spreading scale. The penetration depth of heat pulse (e-folding length of modulation amplitude) is
10
(2 cm) in the low accessibility and
25
(5 cm) cm in the high accessibility state. These penetration lengths are the same as the turbulence penetration length observed at the boundary of ITB in JT-60 U. (see )). Although there is no hysteresis observed between the penetration length of heat pulse and other plasma parameters, the time scale of the transition is different between forward transition (from high to low accessibility) and backward transition (from high to low accessibility). The time scale of the forward transition is 4 ms but the time scale of the backward transition is almost doubled (
7 ms). It is open to question why the backward transition (disappearance of
shear) is slower than the forward transition (appearance of
shear).
The X-point stochastization plays the role of valve for turbulence spreading into magnetic island. The magnitude of flow shear depends on the stochastization of the magnetic field. As the stochastization is developed, the
flow shear becomes weak.
flow shear at the boundary of the magnetic island is considered as the crucial regulator of the spreading, because
flow shear reduces turbulence spreading even in the region of
flow shear is narrow. The
can contribute the reduction of turbulence spreading as well as the reduction of locally driven turbulence level. The width of
flow shear region required for the turbulence spreading is much smaller than the width required for the suppression of locally driven turbulence in the transport barrier. In addition to this, the level of turbulence spreading also depends on the strength of the turbulence drive near the magnetic island.
Figure 41. Poincaré map of the magnetic field and radial profile of electron temperature at X-point and O-point of the magnetic island for the high accessibility state and the low accessibility state (from in [Citation250]).
![Figure 41. Poincaré map of the magnetic field and radial profile of electron temperature at X-point and O-point of the magnetic island for the high accessibility state and the low accessibility state (from Figure 4 in [Citation250]).](/cms/asset/7c7ea7a7-9e3e-4bec-9d5e-b6dc8b45726f/tapx_a_1801354_f0041_oc.jpg)
shows a possible picture of bifurcation of magnetic island between the high accessibility state and the low accessibility state. The heat pulse arriving at the boundary of the magnetic island at O-point quickly propagates to the X-point of the magnetic island along the magnetic field. In contrast, turbulence arriving at the X-point of the magnetic island propagates poloidally to the O-point of the magnetic island. In the high accessibility state, the second derivative of temperature and shear is relatively small due to the wider stochastic region of the magnetic island boundary as well as X-point of the magnetic island. In contrast, the second derivative of temperature and
shear becomes larger and island boundary becomes sharper due to the narrowing of the stochastic region at the X-point of the magnetic island. The interplay between
shear at the magnetic island boundary and sharpness of magnetic island boundary determined by the turbulence spreading is the key for this bifurcation. The bifurcation of turbulent state inside the magnetic island is characterized by the depth of penetration of the heat pulse. The heat pulse can penetrate deeper into the magnetic island when the turbulence spreading is large. The turbulence spreading is reduced by
flow shear at the boundary of magnetic island and the strength of
flow shear is weakened by the stochastization of the magnetic field at X-point. Therefore, the bifurcation of turbulent state inside the magnetic island is caused by the change of stochasticity of the magnetic field at X-point of the magnetic island.
4.2. Convective flow inside magnetic island
The bifurcation of shear strength at the boundary is related to the convective poloidal flow (the vortex around the magnetic island O-point) inside magnetic island. Convective poloidal flow inside the magnetic island has been identified by measurements of poloidal flow velocity of the impurity ion with charge exchange spectroscopy [Citation251] and more recently by the measurements of the Doppler shift of turbulence with Doppler reflectometer [Citation252], ECE imaging [Citation20], and Langmuir probe arrays [Citation253].
Figure 42. (a)Spectrogram of the Doppler reflectometer signals measured showing the evolution of the Doppler peak frequency as the magnetic island crosses the measurement region. Doppler reflectometer spectra (b) inner and (c) outer section of magnetic island and (d) schematic representation of the flux surfaces inside a magnetic island with the direction of the flow represented by the arrows (from and in [Citation252]).
![Figure 42. (a)Spectrogram of the Doppler reflectometer signals measured showing the evolution of the Doppler peak frequency as the magnetic island crosses the measurement region. Doppler reflectometer spectra (b) inner and (c) outer section of magnetic island and (d) schematic representation of the flux surfaces inside a magnetic island with the direction of the flow represented by the arrows (from Figure 5 and Figure 6 in [Citation252]).](/cms/asset/496aa4a6-06fa-49bd-94e3-3263cb88448e/tapx_a_1801354_f0042_oc.jpg)
) shows the time evolution of spectrogram of the Doppler reflectometer signals measured showing the evolution of the Doppler peak frequency as the magnetic island crosses the measurement region in TJ-II. In this experiment, first dynamic magnetic configuration scans were performed with the subsequent change in the rotational transform in time (from 1.66 to 1.72 at the plasma edge). The measurement location of Doppler reflectometer is determined by the density and the density profile is unchanged during this scan. Therefore, the detailed profile of Doppler shift of turbulence across the magnetic island can be obtained by the time evolution of Doppler peak frequency. The sudden jump of peak frequency was observed at 1212–1216 ms, which indicates the flip of poloidal flow across the O-point of the magnetic island.
shows the spectrum of turbulence inner and outer section of the magnetic island. The peak of Doppler shift is negative in the direction of ion diamagnetic drift ( −500 kHz) and positive in the electron diamagnetic drift direction (
100 kHz), which corresponds with the strong positive
inner half and the weak negative
outer half of magnetic island. The
shear is positive at the outer and inner island boundary (0.3 MV/m
and 0.4 MV/m
, respectively) and is negative at the O-point of the magnetic island. These values are slightly lower than those measured in TJ-II plasmas during the H-mode [Citation254] and during the LCO I-phase [Citation255]. The sign flip of the peak Doppler shift of turbulence is evidence of the convective poloidal flow as seen in the representation of the flux surfaces inside a magnetic island with the direction of the flow represented by the arrows in ). In these experimental conditions the plasma is in the so-called electron root: the radial electric field is positive in the entire plasma.
Figure 43. (a) Radial profiles of poloidal rotation velocity, for various currents of =1/1 external perturbation coils. The last closed surfaces are at
= 4.10 m. The major radius for the center of island,
, is indicated with a line as a reference. The dashed lines are fitted profiles of poloidal velocity to the measured values. Radial profiles of (b) radial electric field and (c) space potential (from in [Citation251] and in [Citation256] ) in [Citation258] modified.).
![Figure 43. (a) Radial profiles of poloidal rotation velocity, for various currents of =1/1 external perturbation coils. The last closed surfaces are at = 4.10 m. The major radius for the center of island, , is indicated with a line as a reference. The dashed lines are fitted profiles of poloidal velocity to the measured values. Radial profiles of (b) radial electric field and (c) space potential (from Figure 2 in [Citation251] and Figure 3 in [Citation256] Figure 3(b) in [Citation258] modified.).](/cms/asset/2ae0ffca-6571-4836-aac8-1cdc06f87657/tapx_a_1801354_f0043_oc.jpg)
The bifurcation phenomena of the convective poloidal flow (the vortex around the magnetic island O-point) inside the magnetic island was observed in the scan of the magnetic island width by = 1 perturbation field in LHD [Citation251] as seen in . The plasma is in the so-called ion root, where the poloidal rotation is negative in the electron diamagnetic direction in the entire plasma. When the coil current of the perturbation field is below the critical value (
1000 A), the poloidal flow velocity becomes zero inside the non-rotating magnetic island phase-locked by the steady-state
= 1 perturbation field. The width of the magnetic island increases as the coil current of the perturbation field is increased, and the poloidal flow velocity is kept to be zero for the island width less than 9 cm with the perturbation coil current of less than 900A . Because the plasma poloidal flow outside the magnetic island is almost unchanged even with the formation of the magnetic island, the strong poloidal flow shear and
shear is produced at both inner and outer island boundary. When the coil current of the perturbation field exceeds the critical value, convective poloidal flow (vortex-like flow) suddenly appears inside the magnetic island. This flow produced the finite radial electric field of the space potential with well structure. Before the appearance of the vortex-like flow, the radial electric field is zero and potential profile is flat inside the magnetic island [Citation256].
The vortex-like flow inside the magnetic island is due to the imbalance of the viscous force between the inner and outer boundaries of the magnetic island at the O-point. The plasma flow at the outer island boundary and at the inner island boundary are given as and
. Here,
is the width of magnetic island at the O-point and
and
/
are the poloidal flow velocity and its shear at the X-point of the magnetic island, respectively. There should be an energy source to sustain the velocity shear against the perpendicular viscosity. The power density to sustain the plasma flow should be balanced to the energy dissipation due to the viscosity at the boundary and inside the magnetic island. The power density
can be expressed as
where
,
are ion density and ion mass,
,
are the viscosity at the boundary and inside the magnetic island,
,
are the shear width at the island boundary and the velocity of vortex-like flow inside the magnetic island, respectively The. velocity,
, giving the minimum of
is considered to be the velocity of the vortex like flow at the O-point. The velocity of vortex-like flow at the O-point,
is expressed as
[Citation256].
The direction of the flow (sign of ) is determined by the sign of the radial electric field shear (
/
) at the X-point of the magnetic island. Therefore, the sign of
is reversed between ion root plasma (
and
/
) and electron root plasma (
and
/
) [Citation257]. The space potential profile has well structure (negative peak at the magnetic island) in the ion root plasma, while it has hill structure (positive peak at the magnetic island) in the electron root plasma [Citation258]. The plasma flow velocity inside the magnetic island (the magnitude of
) is proportional to the square of the island width and the viscosity at the boundary of the magnetic island,
. Once the viscosity,
, is increased by turbulence spreading into the magnetic island, vortex-like convective poloidal flow velocity
increases. Therefore, disappearance of vortex-like flow is considered to be the result of suppression of turbulence spreading and reduction of
at the boundary of the magnetic island. Strong
shear at the boundary of the magnetic island could contribute to the formation of ITB at the foot point of the magnetic island or the rational surface. In LHD the
= 2/1 magnetic island produced by the external perturbation field was found to reduce the power threshold for the transition from L-mode to electron ITB [Citation259]. The
shear at the boundary of magnetic island could be one of the candidates to explain the fact that the foot point of the ITB often locates near the rational surface in the steady-state phase in tokamak plasmas [Citation260–Citation262] and the transition from L-mode to H-mode phase is observed in the narrow window of rotational transform near the low order rational magnetic surface in helical plasmas [Citation263]. This complex interplay between transport and velocity shear is one of the candidates of the reduction of turbulence-driven transport in the proximity of rational surfaces [Citation264].
Recently, theoretical model for the structure bifurcation of electric potential (transition of parity with respect to the rational surface) inside magnetic island has been proposed to explain the critical width for the appearance of vortex-like convective poloidal flow [Citation265]. In this model, the radial electric field,
, is predicted to have even parity (
) for
and odd parity (
) for
, where the
is critical width for the bifurcation. There are two solutions of electric potential structure simulated for
depending on the initial condition. One is the potential profile with well structure (vortex rotating in a clockwise direction as seen in ) and the other is the potential profile with hill structure (vortex rotating in a counter-clockwise direction), which is also consistent with the observation in LHD. The bifurcation of flow inside the magnetic island is characterized by the appearance and disappearance of vortex flow and the even or odd parity of the radial electric field inside the magnetic island. This bifurcation from even to odd parity of
occurs when the width of magnetic island exceeds a critical value and the sign of the vortex is determined by the boundary condition of
flow shear at X-point of the magnetic island.
5. Summary
Figure 44. Diagram of transport bifurcation.
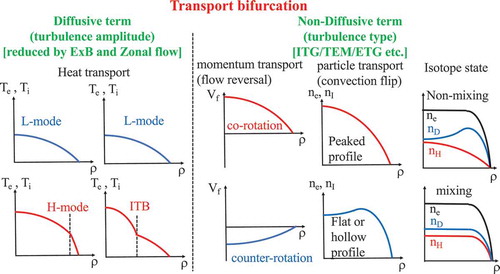
In the transport bifurcation, the bifurcation phenomena were observed in diffusive term and non-diffusive term as seen in . The bifurcation of the diffusive term is due to the transition of turbulence amplitude, while the bifurcation of non-diffusive term is due to the transition of turbulence type such as ITG, TEM, and ETG. The turbulence amplitude can be suppressed by the flow shear in shearing effect and zonal flow (oscillation radial electric field shear with small scale) with predator and prey between turbulence energy and zonal flow energy. Suppression of turbulence amplitude triggers the L-mode to H-mode transition at the plasma edge, while it triggers the transition from L-mode plasma to ITB plasma interior, which results in significant increase of temperature gradients near the plasma edge and core, respectively. The difference between the L-H transition and ITB formation is the trigger for the transition. In the ion-electron root transition and the L-H transition, usually the transition of the radial electric field triggers the formation of an improved mode. In contrast, the radial electric field acts as one of the elements of the feedback process for the transition.
In contrast, the transition of the turbulence mode (one of the examples is transition between TEM and ITG) triggers the sign flip of the non-diffusive term, which can be observed in the reversal of intrinsic flow and intrinsic torque (co-rotation or counter-rotation) in momentum transport and sign flip of particle convection especially in the impurity transport. The sign flip of convection of bulk ions causes the particle ITB characterized by the abrupt density peaking in the plasma without central particle fueling after the H-mode. The sign flip of convection is observed as the transition between impurity accumulation and impurity exhaust which results in peaked profile and flat or hollow profile, respectively. The transition of turbulence mode also triggers the transition from isotope non-mixing to mixing. The deuterium and hydrogen density profiles differ from each other in the non-mixing state but their density profiles become identical at the mixing state. In the isotope mixing state, radial distribution of isotope ratio (e.g. the ratio of hydrogen density of deuterium density in the isotope mixture plasma) becomes uniform regardless of the source location of each isotope species. The isotope mixing is attributed to the turbulence transition from TEM to ITG, where the ion diffusion is much larger than the electron diffusion. The transition of turbulence mode causing the sign flip of non-diffusive term does not affect the magnitude of diffusive term (diffusion coefficient, viscosity, and thermal diffusivity), because when one mode is stabilized then the other mode is destabilized to keep the total turbulence-driven flux constant.
Bifurcation is a somewhat generic concept, which can be expressed with state variables. One variable is for given states and the others for branching states with hidden variables controlling the branching. The state variable and hidden variables controlling the branching for the transport is summarized in . In helical system, the ion and electron radial flux have different dependence, which causes the bifurcation of the radial electric field and
flow and its shear. Since the
flow shear and zonal flow contributes the suppression of turbulence, it causes the bifurcation of turbulence amplitude and diffusive term of heat transport, namely electron thermal diffusivity (
) ion thermal diffusivity (
). In contrast, the bifurcations of non-diffusive term in the momentum and particle transport is not caused by the bifurcation of turbulence amplitude but by the bifurcation of the dominant turbulence type (e.g., TEM-ITG transition).
Table 1. Bifurcation of transport.
There are differences in bifurcation characteristics in transport channel (heat, momentum, electron particle, ion particle, and impurity transport). Although the change in turbulence type causes the bifurcation of non-diffusive term of momentum transport and particle transport, and impurity transport, the bifurcation of different channel (momentum and particle and impurity) does not occur at the same plasma parameters. This is due to the complexity of turbulent type (a mixture of ITG, TEM, and ETG with various populations). The contribution of non-diffusive term and diffusive term differs in heat, momentum, and particle transport. In the heat transport, the non-diffusive term is small and radial flux is mostly determined by the diffusive term. In the momentum transport, the diffusion term becomes dominant in the plasma with large external toroidal torque. However, the non-diffusive term is balanced to diffusive term in the plasma without external toroidal torque. In the particle transport, the non-diffusive term is nearly balanced to diffusive term in the plasma core in the steady state.
The turbulence type is a key for determining the sign of non-diffusive term and isotope mixing. Although, the state variables at the bifurcation can be observed easily in experiment, the identification of hidden variables controlling the branching is somewhat difficult in the experiment. There have been numerous studies for aiming the identification of turbulence type in toroidal plasma, but the identification of dominant turbulence has not been performed definitely in the experiment due to the complexities of turbulence in toroidal plasma. The theoretical model and simulation to bridge the state variables of bifurcation and hidden variables controlling the branching would be an emerging issue to identify the turbulent state using the state variables of bifurcation.
Figure 45. Diagram of MHD bifurcation.
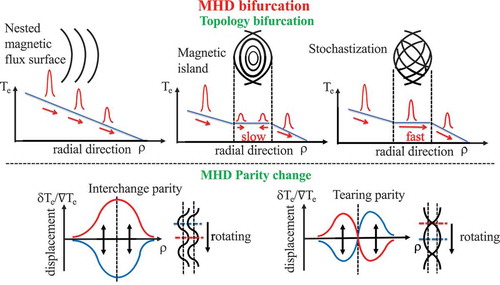
In the MHD bifurcation, the bifurcation between three magnetic topologies of nested magnetic flux surface, magnetic island, and stochastic magnetic field are observed in the static magnetic field and fluctuating magnetic field as seen in . The magnetic topology can be identified by the characteristics of propagation of heat pulse. The heat pulse produced in the core propagates outward (toward low temperature) with decreasing its amplitude in the nested magnetic flux surface. In the region of the magnetic island, the heat pulse propagation from the boundary of the magnetic island to the O-point of the magnetic island and becomes bi-directional (outward and inward). The propagation speed becomes slow due to the low turbulence level and amplitude becomes small because most of the heat pulse propagates across the X-point of the magnetic island. When the magnetic island becomes stochastic, the radial heat pulse propagation becomes very fast due to the large displacement of the magnetic field in the radial direction. The topology bifurcation between nested magnetic flux surface and magnetic island can be also identified easily with the parity change of displacement caused by MHD instability when the MHD mode is rotating poloidaly. This is because the MHD oscillation due to the magnetic island shows tearing parity (odd parity) displacement, while the MHD oscillation due to the kink of nested magnetic flux surface shows interchange parity (even parity) displacement. The transition of static magnetic topology from nested magnetic flux surface to stochastic magnetic field (stochastization) and magnetic island is observed as magnetic shear decreases in helical plasma. In the RFP plasma, where the magnetic field is typically stochastic, the transition from fluctuating stochastic magnetic field (multi-helicity state) to nested magnetic flux surface with helical structure (quasi-single-helicity state) is observed. The bifurcation of parity of MHD mode (so-called tearing parity and interchange parity) is observed in helical plasma, RFP, and tokamak plasma. The stochastization of the magnetic field causes the toroidal flow damping as well as the magnetic island. Once the toroidal flow starts to decrease, the stochastization of the magnetic field is accelerated. This observation demonstrates the strong coupling between magnetic topology and transport.
The state variable and hidden variables controlling the branching for the MHD and magnetic topology are summarized in . The growth and healing of magnetic island has been discussed by the increase or decrease of magnetic island width. This is because the direct measurements of helical current at rational surface, which causes the formation of magnetic island topology in the normal nested magnetic flux surface, are difficult in experiment. The stochastization of the magnetic field is caused by the magnetic field perpendicular to the flux surface. However, the direct measurement of the magnetic field perpendicular to the flux surface is very difficult because of the small amplitude of
. Since the heat pulse propagates along the magnetic field line, the heat pulse can be used as the tracer of the magnetic field. Then the speed of radial (perpendicular to the magnetic flux surface) propagation of heat pulse can be a good measure of displacement of magnetic flux surface due to
. The speed of radial propagation of heat pulse becomes much faster as the stochastization of the magnetic field is developed. The other approach to identify the magnetic topology is measurement of MHD instability parity, which is a foot stamp of magnetic topology. The direct measurements of magnetic topology of magnetic field are difficult but the MHD instability parity can be easily identified by the phase of temperature oscillation (even or odd) measured with ECE. Since the magnetic field reconnection is necessary for changing the magnetic topology, fast change of MHD parity (and fast change in magnetic topology) suggest the existence of fast reconnection in the toroidal plasma. Although the fast reconnection model has been proposed to the so-called sawtooth crash, but not to the minor collapse events that have been widely observed in experiment. It is also open to question how the fast reconnection is triggered by the MHD instability which is localized poloidally and toroidally (so-called non-resonant mode) [Citation230,Citation232,Citation233,Citation266].
Figure 46. Diagram of transport and MHD interplay.
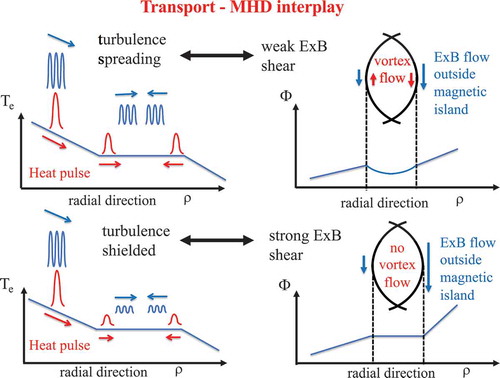
Table 2. Bifurcation of MHD.
Transport and MHD interplay are observed in the bifurcation phenomena in magnetic island as seen in . The key parameter of this bifurcation is shear across the magnetic island. When the
shear is weak due to the vortex-like flow inside the magnetic island, turbulence produced in the gradient region outside the magnetic island can penetrate into the magnetic island by turbulence spreading. This turbulence results in the deep penetration of the heat pulse into the magnetic island. In contrast, when
shear becomes strong in the case of no vortex-like flow, the turbulence spreading is shielded at the boundary of magnetic island (mainly X-point) and turbulence level inside the magnetic island becomes low. This reduction of the turbulence causes shallow penetration of the heat pulse into the magnetic island. Bifurcation phenomena of the magnetic island is considered to be triggered by the change in stochastic width at X-point of magnetic island. The locally excited turbulence should be small because of the flattening of the temperature inside the magnetic island. Therefore, turbulence spreading from outside the region of the magnetic island where finite temperature gradient exists is considered to be dominant inside the magnetic island. When the X-point stochastic width is reduced, the turbulence spreading is reduced by
shear and the discontinuity of the temperature gradient at the island boundary increases (the so-called sharp boundary magnetic island). The transition to a sharp boundary magnetic island is observed as the shielding of heat pulse penetration from outside to inside the magnetic island and the disappearance of the vortex like flow inside the magnetic island.
The state variable and hidden variables controlling the branching for the bifurcation of interplay between transport and MHD are summarized in the . The stochastization of the magnetic field at the X-point of the magnetic island is a key for turbulence spreading into the magnetic island and at the bifurcation of turbulence and flow inside the magnetic island. This is because the flow shear, which contribute to the suppression of the turbulence spreading, becomes weak due to the stochastization of the magnetic field at the X-point. The X-point stochastization plays a role of valve for turbulence spreading into magnetic island. When the magnitude of
flow shear decreases due to the stochastization of the magnetic field, the turbulence and heat pulse can penetrate deep inside the magnetic island. In contrast, when the stochastization of the magnetic field is mitigated, the turbulence spreading and heat pulse penetration is prevented by the strong
flow shear at the boundary of the magnetic island. The bifurcation of flow (appearance and disappearance of vortex flow) is also related to the bifurcation of
flow shear at the boundary of the magnetic island. The vortex flow appears when the strong
flow shear at the boundary of the magnetic island disappears. The direction of vortex flow (CW or CCW) and the parity of radial electric field with respect to the rational surface are determined by the sign of
flow at the X-point of the magnetic island.
Table 3. Bifurcation of interplay between transport and MHD.
The magnetic island is ideal for the turbulence spreading physics because the spreading turbulence can be much more dominant than the locally driven turbulence due to the flattening of temperature and density profile. In the region of normal magnetic flux surface, it is difficult to distinguish turbulence spreading and locally driven turbulence. Therefore, further theoretical and experimental studies of turbulence spreading should be performed by taking advantage of magnetic island. Turbulence spreading is also important for the turbulence in the scrape-off-layer (SOL), where the turbulence spreading from the pedestal region is expected to be more dominant than the locally driven turbulence [Citation243]. There are many experiments reported regarding the broadening of the radial profile of heat flux and the increase of power decay length, that are required for the reduction of the heat load on the divertor in tokamaks [Citation267–Citation270]. Since enhancement of turbulence in SOL is one of the candidates for broadening of the radial profile of heat flux, deeper understanding of turbulence in SOL is an emerging issue in the future. It is open to question how much the turbulence spreading contributes to the total turbulence in the L-mode region and the region with transport barrier in the plasma and how the turbulence spreading affects the dynamics of transport such as transition phenomena and non-local phenomena in toroidal plasmas.
In conclusion, the bifurcation of turbulence amplitude, turbulence mode, and magnetic field topology are the key parameters for various bifurcation phenomena observed in transport and MHD behaviour in a magnetically confined plasma. The bifurcation of the diffusive term of transport demonstrates the importance of turbulence suppression by shear. The bifurcation of non-diffusive term indicates that the change of turbulence mode and a sign of the non-diffusive term is a good measure for the turbulence mode (ITG or TEM), which is usually difficult to determine by turbulence measurements. In general, the magnetic topology can not be identified directly. The heat pulse propagation experiment was found to be a useful tool to identify the magnetic topology. Parity of MHD oscillation also gives important information regarding of magnetic topology. Various bifurcation phenomena observed in toroidal plasma are considered to be excellent footprints of turbulence change and magnetic topology change.
There are various resolved issues in the transport bifurcation. It is an interesting question whether any bifurcation of heat transport in the non-diffusive term, which has been usually neglected, can occur. In order to answer to this question, heat pulse propagation experiment with off-axis modulated heating is necessary. However, there have been few experiments for the identification of the non-diffusive term of heat transport. The correlation between non-diffusive term of momentum and non-diffusive term of particle transport is an important issue for understanding the impact of turbulence change to particle and momentum transport. More intensive study both in experiment and in theory is necessary in the future for understanding the non-diffusive term of momentum and particle transport rather than the diffusion term of heat transport, in which the turbulence suppression has been studied for more than several decades as a main topic of transport, because the gradient of density and toroidal flow has a significant impact on heat transport. Reconnection MHD topology bifurcation and parity change require the reconnection of magnetic field. Although the reconnection of the sawtooth crash has been studied, little attention has been paid to the reconnection in other minor collapse events such as ELM or energetic particle driven MHD collapse. The magnetic reconnection is a key for MHD bifurcation. More challenging theoretical models and simulations beyond the stability study should be developed in the future for a deeper understanding of magnetic reconnection and mechanism of minor collapse events. It is an interesting question how significant is the contribution of the turbulence spreading to total turbulence. Turbulence spreading can play an important role in the magnetic island, SOL region, and the boundary of transport barrier. The role of turbulence spreading in the dynamics of bifurcation is one of the unresolved issues in magnetically confined toroidal plasma.
Acknowledgements
The author would like to express his sincere thanks to Drs. M. Yoshinuma, T. Kobayashi, H. Lee, R. Sakamoto, N. Tamura, S. Inagaki, A. Fujisawa, S. Kado, Y. Liang, Y. Miura, Y. Sakamoto, K. Kamiya, M. Yoshida, T.E. Evans, G.R. McKee, M. Ono, with whom the author has worked together in LHD, CHS, JFT-2M, JT-60U, DIII-D and Drs. K. Itoh, P.H. Diamond, C. Hidalgo for their stimulating discussions. This article is dedicated to the memory of Prof. Sanae-I. Itoh (Kyushu Univ.) who achieved pioneering theoretical work on the bifurcation physics in magnetically confined toroidal plasmas. This work is supported by Grant-in-Aid for Scientific Research (No. 16H02442) of JSPS Japan. This work was also supported by the National Institute for Fusion Science grant administrative budget no. NIFS10ULHH021.
Disclosure statement
No potential conflict of interest was reported by the author.
References
- Itoh K, Itoh S-I, Fukuyama A. Transport and structural formation in plasmas. Bristol and Philadelphia., U.K: Institute of Physics Publishing; 1999. ( ISBN 0-7503-0449-9).
- Ito S-I, Yoshinobu K, edited by. Bifurcation phenomena in plasma. ISBN 4-9901142-5-6. Fukuoka, Japan: Kyushu University; 2002.
- Galeev AA, Sagdeev RZ, Furth HP, et al. Plasma diffusion in a toroidal stellarator. Phys Rev Lett. 1969;22:511.
- Mynick HE, Hitchon WNG. Effect of the ambipolar potential on stellarator confinement. Nucl Fusion. 1983;23:1053.
- Hastings DE, Houlberg WA, Shaing KC, et al. The ambipolar electric field in stellarators. Nucl Fusion. 1985;25:445.
- Diamond PH, McDevitt CJ, Gürcan ÖD. Physics of non-diffusive turbulent transport of momentum and the origins of spontaneous rotation in tokamaks. Nucl Fusion. 2009;49:045002.
- Wagner F, Becker G, Behringer K, et al. Regime of improved confinement and high beta in neutral-beam-heated divertor discharges of the ASDEX tokamak. Phys Rev Lett. 1982;49:1408.
- Itoh S-I, Itoh K. Model of L to H-mode transition in tokamak. Phys Rev Lett. 1988;60:2276.
- Adam JC, Tang WM, Rutherford PH. Destabilization of the trapped-electron mode by magnetic curvature drift resonances. Phys Fluids. 1976;19:561.
- Dannert T, Jenko F. Gyrokinetic simulation of collisionless trapped-electron mode turbulence. Phys Plasmas. 2005;12:072309.
- Romanelli F. Ion temperature-gradient-driven modes and anomalous ion transport in tokamaks. Phys Fluids B. 1989;1:1018.
- Rosenbluth MN, Hinton FL. Poloidal flow driven by ion-temperature-gradient turbulence in tokamaks. Phys Rev Lett. 1998;80:824.
- Rutherford PH. Nonlinear growth of the tearing mode. Phy Fluids. 1973;16:1903.
- Boozer A. Phys Fluids. Magnetic island growth. 1984;27: 2055.
- Hegna CC, Bhattacharjee A. Magnetic island formation in three-dimensional plasma equilibria. Phys Fluids B. 1989;1:392.
- Lorenzini R, Martines E, Piovesan P, et al. Self-organized helical equilibria as a new paradigm for ohmically heated fusion plasmas. Nat Phys. 2009;5:570.
- Ida K, Inagaki S, Yoshinuma M, et al. Bifurcation phenomena of a magnetic island at a rational surface in a magnetic-shear control experiment. Phys Rev Lett. 2008;100:045003.
- Ida K, Yoshinuma M, Tsuchiya H, et al. Flow damping due to stochastization of the magnetic field. Nat Commun. 2015;6:5816.
- Ida K, Kobayashi T, Evans TE, et al. Self-regulated oscillation of transport and topology of magnetic islands in toroidal plasmas. Sci Rep. 2015;5:16165.
- Choi T, Kim J, Kwon J-M, et al. Multiscale interaction between a large scale magnetic island and small scale turbulence. Nucl Fusion. 2017;57:126058.
- Kwon JM, Ku S, Choi MJ, et al. Gyrokinetic simulation study of magnetic island effects on neoclassical physics and micro-instabilities in a realistic KSTAR plasma. Phys Plasmas. 2018;25:052506.
- Ida K, Problems atomic science and technology no.6. Series: plasma physics 12, 10, (2006).
- Fujisawa A, Iguchi H, Minami T, et al. Experimental study of the bifurcation nature of the electrostatic potential of a toroidal helical plasma. Phys Plasmas. 2000;7:4152.
- Fujisawa A, Iguchi H, Idei H, et al. Discovery of electric pulsation in a toroidal helical plasma. Phys Rev Lett. 1998;81:2256.
- Ida K, Funaba H, Kado S, et al. Reduction of ion thermal diffusivity associated with the transition of the radial electric field in neutral-beam-heated plasmas in the large helical device. Phys Rev Lett. 2001;86:5297.
- Ida K, Hidekuma S. Space- and time-resolved measurements of ion temperature with the CVI 5292-Å charge-exchange recombination line after subtracting background radiation. Rev. Sci. Instrum. 1989;60:867.
- Ida K, Kado S, Liang Y, et al. Measurements of poloidal rotation velocity using charge exchange spectroscopy in a large helical device. Rev Sci Instrum. 2000;71:2360.
- Yoshinuma M, Ida K, Yokoyama M, et al. Charge-exchange spectroscopy with pitch-controlled double-slit fiber bundle on LHD. Fusion Sci Technol. 2010;58:375.
- Fonck RJ, Darrow DS, Jaehnig KP, et al. Determination of plasma-ion velocity distribution via charge-exchange recombination spectroscopy. Phys Rev A. 1984;29:3288.
- Stroth U, Itoh K, Itoh S-I, et al. Internal transport barrier triggered by neoclassical transport in W7-AS. Phys Rev Lett. 2001;86:5910.
- Diamond PH, Itoh S-I, Itoh K, et al. Zonal flows in plasma—a review. Plasma Phys Control Fusion. 2005;47:R35.
- Fujisawa A. A review of zonal flow experiments. Nucl Fusion. 2009;49:013001.
- Fujisawa A, Iguchi H, Minami T, et al. Electron thermal transport barrier and density fluctuation reduction in a toroidal helical plasma. Phys Rev Lett. 1999;82:2669.
- Ida K, Shimozuma T, Funaba H, et al. Characteristics of electron heat transport of plasma with an electron internal-transport barrier in the large helical device. Phys Rev Lett. 2003;91:085003.
- Shimozuma T, Kubo S, Idei H, et al. Formation of electron internal transport barriers by highly localized electron cyclotron resonance heating in the large helical device. Plasma Phys Contr Fusion. 2003;45:1183.
- Takeiri Y, Shimozuma T, Kubo S, et al. Formation of electron internal transport barrier and achievement of high ion temperature in large helical device. Phys Plasmas. 2003;10:1788.
- Estrada T, Krupnik L, Dreval N, et al. Electron internal transport barrier formation and dynamics in the plasma core of the TJ-II stellarator. Plasma Phys Contr Fusion. 2004;46:277.
- Takahashi H, Shimozuma T, Kubo S, et al. Extension of high T e regime with upgraded electron cyclotron resonance heating system in the large helical device. Phys Plasmas. 2014;21:061506.
- Tsujimura T, Kubo S, Takahashi H, et al. Development and application of a ray-tracing code integrating with 3D equilibrium mapping in LHD ECH experiments. Nucl Fusion. 2015;55:123019.
- Kenmochi N, Minami T, Takahashi C, et al. Characteristics of electron internal transport barrier in Heliotron J. Plasma Phys Contr Fusion. 2017;59:055013.
- ASDEX team. The H-Mode of ASDEX. Nucl Fusion. 1989;29:1959.
- Kaye SM, Bell MG, Bol K, et al. Attainment of high confinement in neutral beam heated divertor discharges in the PDX tokamak. Nucl Mater. 1984;121:115.
- Nagami M, Kasai M, Kitsunezaki A, et al. Energy confinement of beam-heated divertor and limiter discharges in Doublet III. Nucl Fusion. 1984;24:183.
- Tanga A, Behringer KH, Costley AE, et al. Magnetic separatrix experiments in JET. Nucl Fusion. 1987;27:1877.
- Sengoku S, Funahashi A, Hasegawa M, et al. Regime of improved confinement in neutral-beam –heated limiter discharges of a tokamak. Phys Rev Lett. 1987;59:450.
- Hoshino K, Yamamoto T, Kawashima H, et al. H mode observed in the JFT-2M tokamak with edge heating by electron cyclotron waves. Phys Rev Lett. 1989;63:770.
- Toi K, Kawahata K, Morita S, et al. Role of edge magnetic shear on the limiter H-mode transition of the JIPP T-IIU tokamak. Phys Rev Lett. 1990;64:1895.
- Tsuji S, Ushigusa K, Ikeda Y, et al. Observation of the limiter H-mode in the JT-60 tokamak with lower-hybrid current drive. Phys Rev Lett. 1990;64:1023.
- Osborne TH, Brooks NH, Burrell KH, et al. Observation of the H-mode in ohmically heated divertor discharges on DIII-D. Nucl Fusion. 1990;30:2023.
- Groebner RJ, Burrell KH, Seraydarian RP. Role of edge electric field and poloidal rotation in the L-H transition. Phys Rev Lett. 1990;64:3015.
- Ida K, Hidekuma S, Miura Y, et al. Edge electric-field profiles of H-mode plasmas in the JFT-2M tokamak. Phys Rev Lett. 1990;65:1364.
- Ida K, Hidekuma S, Kojima M, et al. Edge poloidal rotation profiles of H-mode plasmas in the JFT-2M tokamak. Phys Fluids B. 1992;4:2552.
- Biglari H, Diamond PH, Terry PW. Influence of sheared poloidal rotation on edge turbulence. Phys Fluids B. 1990;2:1.
- Diamond PH, Liang Y-M, Carreras BA, et al. Self-regulating shear flow turbulence: a paradigm for the L to H transition. Phys Rev Lett. 1994;72:2565.
- Itoh K, Itoh S-I, Kamiya K, et al. On the spatial structure of solitary radial electric field at the plasma edge in toroidal confinement devices. Plasma Phys Control Fusion. 2015;57:075008.
- Kamiya K, Itoh K, Itoh S-I, et al. Experimental validation of non-uniformity effect of the radial electric field on the edge transport barrier formation in JT-60U H-mode plasmas. Sci Rep. 2016;6:30585.
- Ida K, Miura Y, Matsuda T, et al. Evidence for a toroidal-momentum-transport nondiffusive term from the JFT-2M tokamak. Phys Rev Lett. 1990;74:1995.
- Ido T, Kamiya K, Miura Y, et al. Observation of the fast potential change at L-H transition by a heavy-ion-beam probe on JFT-2M. Phys Rev Lett. 2002;88:055006.
- Ida K, Fujita T. Internal transport barrier in tokamak and helical plasmas. Plasma Phys Control Fusion. 2018;60:033001.
- Fujisawa A, Itoh K, Iguchi H, et al. Identification of Zonal Flows in a Toroidal Plasma. Phys Rev Lett. 2004;93:165002.
- Itoh K, Toda S, Fujisawa A, et al. Physics of internal transport barrier of toroidal helical plasmas. Phys Plasmas. 2007;14:020702.
- Fujisawa A, Shimizu A, Nakano H, et al. Turbulence and transport characteristics of a barrier in a toroidal plasma. Plasma Phys Control Fusion. 2006;48:S205.
- Kim E-J, Diamond PH. Zonal flows and transient dynamics of the L-H transition. Phys Rev Lett. 2003;90:185006.
- Diamond PH, Hasegawa A, Mima K. Vorticity dynamics, drift wave turbulence, and zonal flows: a look back and a look ahead. Plasma Phys Control Fusion. 2011;53:124001.
- Schmitz L, Zeng L, Rhodes TL, et al. Role of zonal flow predator-prey oscillations in triggering the transition to H-mode confinement. Phys Rev Lett. 2012;108:155002.
- Cheng J, Dong JQ, Itoh K, et al. Dynamics of low-intermediate–high-confinement transitions in toroidal plasmas. Phys Rev Lett. 2013;110:265002.
- Kobayashi T, Itoh K, Ido T, et al. Spatiotemporal structures of edge limit-cycle oscillation before L-to-H transition in the JFT-2M tokamak. Phys Rev Lett. 2013;111:035002.
- Koide Y, Kikuchi M, Mori M, et al. Internal transport barrier on q =3 surface and poloidal plasma spin up in JT-60U high-β p discharges. Phys Rev Lett. 1994;72:3662.
- Greenfield CM, Schissel DP, Stallard BW, et al. Transport and performance in DIII-D discharges with weak or negative central magnetic shear. Phys Plasmas. 1997;4:1596.
- Fujita T, Ide S, Shirai H, et al. Internal transport barrier for electrons in JT-60U reversed shear discharges. Phys Rev Lett. 1997;78:2377.
- Gruber O, Wolf RC, Dux R, et al. Stationary H -mode discharges with internal transport barrier on ASDEX upgrade. Phys Rev Lett. 1999;83:1787.
- Wolf RC, Gruber O, Maraschek M, et al. Stationary advanced scenarios with internal transport barrier on ASDEX Upgrade. Plasma Phys Control Fusion. 1999;41:B93.
- Fujita T, Kamada Y, Ishida S, et al. High performance experiments in JT-60U reversed shear discharges. Nucl Fusion. 1999;39:1627.
- Fujita T. Spatial structure of internal and edge transport barriers. Plasma Phys Control Fusion. 2002;44:A19.
- Wolf R. Internal transport barriers in tokamak plasmas*. Plasma Phys Control Fusion. 2003;45:R1.
- Meyer H, Field AR, Akers RJ, et al. Formation of transport barriers in the MAST spherical tokamak. Plasma Phys Control Fusion. 2004;46:A291.
- Connor JW, Fukuda T, Garbet X. A review of internal transport barrier physics for steady-state operation of tokamaks. Nucl Fusion. 2004;44:R1.
- Litaudon X. Internal transport barriers: critical physics issues? Plasma Phys Control Fusion. 2006;48:A1.
- Ida K, Kondo K, Nagasaki K, et al. High ion temperature mode in heliotron- E. Phys Rev Lett. 1996;76:1268.
- Ida K, Osakabe M, Tanaka K, et al. Transition from L mode to high ion temperature mode in CHS heliotron/torsatron plasmas. Nucl Fusion. 1999;39:1649.
- Ida K, Sakamoto Y, Yoshinuma M, et al. Dynamics of ion internal transport barrier in LHD heliotron and JT-60U tokamak plasmas. Nucl Fusion. 2009;49:095024.
- Takahashi H, Osakabe M, Nagaoka K, et al. Extension of the operational regime in high-temperature plasmas and the dynamic-transport characteristics in the LHD. Nucl Fusion. 2013;53:073034.
- Nagaoka K, Takahashi H, Murakami S, et al. Integrated discharge scenario for high-temperature helical plasma in LHD. Nucl Fusion. 2015;55:113020.
- Takahashi H, Nagaoka K, Murakami S, et al. Extension of operational regime in high-temperature plasmas and effect of ECRH on ion thermal transport in the LHD. Nucl Fusion. 2017;57:086029.
- Takahashi H, Nagaoka K, Mukai K, et al. Realization of high T I plasmas and confinement characteristics of ITB plasmas in the LHD deuterium experiments. Nucl Fusion. 2018;58:106028.
- Ida K. Experimental studies of the physical mechanism determining the radial electric field and its radial structure in a toroidal plasma. Plasma Phys Control Fusion. 1998;40:1429.
- Ida K, Yamada H, Iguchi H, et al. Observation of parallel viscosity in a stellarator. Phys Rev Lett. 1991;67:58.
- Sakamoto Y, Kamada Y, Ide S, et al. Characteristics of internal transport barriers in JT-60U reversed shear plasmas. Nucl Fusion. 2001;41:865.
- Ida K, Rice JE. Rotation and momentum transport in tokamaks and helical systems. Nucl Fusion. 2014;54:045001.
- Ida K, Sakamoto Y, Takenaga H, et al. Transition between internal transport barriers with different temperature-profile curvatures in JT-60U tokamak plasmas. Phys Rev Lett. 2008;101:055003.
- Ida K, Sakamoto Y, Inagaki S, et al. Dynamic transport study of the plasmas with transport improvement in LHD and JT-60U. Nucl Fusion. 2009;49:015005.
- Ida K, Sakamoto Y, Yoshinuma M, et al. Measurement of derivative of ion temperature using high spatial resolution charge exchange spectroscopy with space modulation optics. Rev Sci Instrum. 2008;79:053506.
- Diamond PH, Lebedev VB, Newman DE, et al. Dynamics of transition to enhanced confinement in reversed magnetic shear discharges. Phys Rev Lett. 1997;78:1472.
- Ida K, Inagaki S, Sakamoto R, et al. Slow transition of energy transport in high-temperature plasmas. Phys Rev Lett. 2006;96:125006.
- Mantica P, Strintzi D, Tala T, et al. Experimental study of the ion critical-gradient length and stiffness level and the impact of rotation in the JET tokamak. Phys Rev Lett. 2009;102:175002.
- Colchin RJ, Schaffer MJ, Carreras BA, et al. Slow L-H transitions in DIII-D plasmas. Phys Rev Lett. 2002;88:255002.
- Kamiya K Ida K, Sakamoto Y, et al. Observation of a complex multistage transition in the JT-60U H-mode edge. Phys Rev Lett. 2010;105:045004.
- Kamiya K, Itoh K, Itoh S-I, et al. Multiple plasma transport states in the H-mode transition on JT-60U. Nucl Fusion. 2019;59:086046.
- Eriksson L-G, Fourment C, Fuchs V, et al. Discharges in the JET tokamak where the safety factor profile is identified as the critical factor for triggering internal transport barriers. Phys Rev Lett. 2002;88:145001.
- Nagashima K, Koide Y, Shirai H. Experimental determination of non-diffusive toroidal momentum flux in JT-60U. Nucl Fusion. 1994;34:449.
- Yoshida M, Kamada Y, Takenaga H, et al. Role of pressure gradient on intrinsic toroidal rotation in Tokamak Plasmas. Phys Rev Lett. 2008;100:105002.
- Yoshida M, Sakamoto Y, Honda M, et al. Core and edge toroidal rotation study in JT-60U. Nucl Fusion. 2012;52:023024.
- Rice JE, Boivin RL, Bonoli PT, et al. Observations of impurity toroidal rotation suppression with ITB formation in ICRF and ohmic H mode Alcator C-Mod plasmas. Nucl Fusion. 2001;41:277.
- Gürcan OD, Diamond PH, Hahm TS, et al. Turbulent equipartition and homogenization of plasma angular momentum. Phys Rev Lett. 2008;100:135001.
- Diamond PH, Kosuga Y, Gürcan ÖD, et al. An overview of intrinsic torque and momentum transport bifurcations in toroidal plasmas. Nucl Fusion. 2013;53:104019.
- Gürcan OD, Diamond PH, Hahm TS, et al. Intrinsic rotation and electric field shear. Phys Plasmas. 2007;14:042306.
- Gürcan OD, Diamond PH, Hennequin P, et al. Residual parallel reynolds stress due to turbulence intensity gradient in tokamak plasmas. Phys Plasmas. 2010;17:112309.
- Wang L, Diamond PH. Gyrokinetic theory of turbulent acceleration of parallel rotation in tokamak plasmas. Phys Rev Lett. 2013;110:265006.
- Diamond PH, Kim Y-B. Theory of mean poloidal flow generation by turbulence. Phys Fluids B. 1991;3:1626.
- Ida K, Minami T, Yoshimura Y, et al. Observation of toroidal flow antiparallel to the <ErxBθ> drift direction in the hot electron mode plasmas in the compact helical system. Phys Rev Lett. 2001;86:3040.
- Ida K, Minami T, Yoshimura Y, et al. Observation of flow reversal in plasmas with a neoclassical internal transport barrier in CHS. Plasma Phys Control Fusion. 2002;44:361.
- Bortolon A, Duval BP, Pochelon A, et al. Observation of spontaneous toroidal rotation inversion in ohmically heated Tokamak Plasmas. Phys Rev Lett. 2006;97:235003.
- Rice JE, Duval BP, Reinke ML, et al. Observations of core toroidal rotation reversals in Alcator C-Mod ohmic L-mode plasmas. Nucl Fusion. 2011;51:083005.
- Rice JE, Greenwald MJ, Podpaly YA, et al. Ohmic energy confinement saturation and core toroidal rotation reversal in Alcator C-Mod plasmas. Phys Plasmas. 2012;19:056106.
- Angioni C, McDermott RM, Casson FJ, et al. Intrinsic toroidal rotation, density peaking, and turbulence regimes in the core of tokamak plasmas. Phys Rev Lett. 2011;107:215003.
- Shi YJ, Kwon JM, Diamond PH, et al. Intrinsic rotation reversal, non-local transport, and turbulence transition in KSTAR L-mode plasmas. Nucl Fusion. 2017;57:066040.
- Rice JE, Cziegler I, Diamond PH, et al. Rotation Reversal bifurcation and energy confinement saturation in Tokamak Ohmic L -mode plasmas. Phys Rev Lett. 2011;107:265001.
- Rice JE, Gao C, Reinke ML, et al. Non-local heat transport, rotation reversals and up/down impurity density asymmetries in alcator C-Mod ohmic L-mode plasmas. Nucl Fusion. 2013;53:033004.
- Gentle KW, Rowan WL, Bravenec RV, et al. Strong Nonlocal effects in a tokamak perturbative transport experiment. Phys Rev Lett. 1995;74:3620.
- Mantica P, Galli P, Gorini G, et al. Nonlocal transient transport and thermal barriers in rijnhuizen tokamak project plasmas. Phys Rev Lett. 1999;82:5048.
- Inagaki S, Tokuzawa T, Tamura N, et al. How is turbulence intensity determined by macroscopic variables in a toroidal plasma? Nucl Fusion. 2013;53:113006.
- Ida K, Shi Z, Sun HJ, et al. Towards an emerging understanding of non-locality phenomena and non-local transport. Nucl Fusion. 2015;55:013022.
- Inagaki S, Tokuzawa T, Itoh K, et al. Observation of long-distance radial correlation in toroidal plasma turbulence. Phys Rev Lett. 2011;107:115001.
- Tamura N, Inagaki S, Ida K, et al. Observation of core electron temperature rise in response to an edge cooling in toroidal helical plasmas. Phys Plasmas. 2005;12:110705.
- Tamura N, Inagaki S, Tanaka K, et al. Impact of nonlocal electron heat transport on the high temperature plasmas of LHD. Nucl Fusion. 2007;47:449.
- Nagaoka K, Ida K, Yoshinuma M, et al. 3-D effects on viscosity and generation of toroidal and poloidal flows in LHD. Phys Plasmas. 2013;20:056116.
- Gao C, Rice JE, Sun HJ, et al. Non-local heat transport in Alcator C-Mod ohmic L-mode plasmas. Nucl Fusion. 2014;54:083025.
- Grierson BA, Chrystal C, Haskey SR, et al. Main-ion intrinsic toroidal rotation across the ITG/TEM boundary in DIII-D discharges during ohmic and electron cyclotron heating. Phys Plasmas. 2019;26:042304.
- Wang WX, Diamond PH, Hahm TS, et al. Nonlinear flow generation by electrostatic turbulence in tokamaks. Phys Plasmas. 2010;17:072511.
- Kwon J, Yi S, Rhee T, et al. Analysis of symmetry breaking mechanisms and the role of turbulence self-regulation in intrinsic rotation. Nucl Fusion. 2012;52:013004.
- Grierson BA, Wang WX, Ethier S, et al. Main-ion intrinsic toroidal rotation profile driven by residual stress torque from ion temperature gradient turbulence in the DIII-D tokamak. Phys Rev Lett. 2017;118:015002.
- Erofeev I, Fable E, Angioni C, et al. Theory-based modeling of LOC–SOC transitions in ASDEX Upgrade. Nucl Fusion. 2017;57:126067.
- Sung C, White AE, Howard NT, et al. Changes in core electron temperature fluctuations across the ohmic energy confinement transition in Alcator C-Mod plasmas. Nucl Fusion. 2013;53:083010.
- Sung C, White AE, Mikkelsen DR, et al. Quantitative comparison of electron temperature fluctuations to nonlinear gyrokinetic simulations in C-Mod Ohmic L-mode discharges. Phys Plasmas. 2016;23:042303.
- McDermott R, Angioni C, Conway GD, et al. Core intrinsic rotation behaviour in ASDEX Upgrade ohmic L-mode plasmas. Nucl Fusion. 2014;54:043009.
- Cao NM, Rice JE, Diamond PH, et al. Hysteresis as a probe of turbulent bifurcation in intrinsic rotation reversals on Alcator C-Mod. Nucl Fusion. 2019;59:104001.
- Ida K, Lee H, Nagaoka K, et al. Reversal of intrinsic torque associated with the formation of an internal transport barrier. Phys Rev Lett. 2013;111:055001.
- Yoshinuma M, Ida K, Yokoyama M, et al. Observations of spontaneous toroidal flow in the LHD. Nucl Fusion. 2009;49:075036.
- Ida K, Yoshinuma M, Nagaoka K, et al. Spontaneous toroidal rotation driven by the off-diagonal term of momentum and heat transport in the plasma with the ion internal transport barrier in LHD. Nucl Fusion. 2010;50:064007.
- Kamada Y, Yoshino R, Nagami M, et al. Effect of the q = 1 surface and sawtooth activity on pressure profiles and energy confinement in pellet fuelled JT-60 limiter plasmas. Nuclear Fusion. 1991;31:23.
- Tubbing BJD, Balet B, Bartlett DV, et al. H-mode confinement in JET with enhanced performance by pellet peaked density profiles. Nuclear Fusion. 1991;31:839.
- Ohyabu N, Morisaki T, Masuzaki S, et al. Observation of stable superdense core plasmas in the large helical device. Phys Rev Lett. 2006;97:055002.
- Ida K, Itoh S-I, Itoh K, et al. Density peaking in the JFT-2M tokamak plasma with counter neutral-beam injection. Phys Rev Lett. 1992;68:182.
- Hugon M, Milligen BPV, Smeulders P, et al. Shear reversal and MHD activity during pellet enhanced performance pulses in JET. Nucl Fusion. 1992;32:33.
- Levinton FM, Zarnstorff MC, Batha SH, et al. Improved confinement with reversed magnetic shear in TFTR. Phys Rev Lett. 1995;75:4417.
- Ongena J, Suttrop W, Bécoulet M, et al. Recent progress on JET towards the ITER reference mode of operation at high density. Plasma Phys Control Fusion. 2001;43:A11.
- Bush CE, Goldston RJ, Scott SD, et al. Peaked density profiles in circular-limiter H modes on the TFTR tokamak. Phys Rev Lett. 1990;65:424.
- Osborne TH, Leonard AW, Mahdavi MA, et al. Gas puff fueled H-mode discharges with good energy confinement above the Greenwald density limit on DIII-D. Phys Plasmas. 2001;8:2017.
- Fiore CL, Rice JE, Bonoli PT, et al. Internal transport barriers on alcator C-Mod. Phys Plasmas. 2001;8:2003.
- Hoang GT, Bourdelle C, Garbet X, et al. Parametric dependence of turbulent particle transport in tore supra plasmas. Phys Rev Lett. 2004;93:135003.
- Angioni C, Peeters AG, Pereverzev GV, et al. Density peaking, anomalous pinch, and collisionality in tokamak plasmas. Phys Rev Lett. 2003;90:205003.
- Weisen H, Zabolotsky A, Angioni C, et al. Collisionality and shear dependences of density peaking in JET and extrapolation to ITER. Nucl Fusion. 2005;45:L01.
- McCormick K, Grigull P, Burhenn R, et al. New advanced operational regime on the W7-AS stellarator. Phys Rev Lett. 2002;89:055001.
- Yoshinuma M, Ida K, Yokoyama M, et al. Observation of an impurity hole in the large helical device. Nucl Fusion. 2009;49:062002.
- Ida K, Yoshinuma M, Osakabe M, et al. Observation of an impurity hole in a plasma with an ion internal transport barrier in the large helical device. Phys Plasmas. 2009;16:056111.
- Ida K, Sakamoto R, Yoshinuma M, et al. The isotope effect on impurities and bulk ion particle transport in the large helical device. Nucl Fusion. 2019;59:056029.
- Yoshinuma M, Ida K, Nagaoka K, et al. Abrupt reversal of convective flow of carbon impurity during impurity-hole formation on the LHD. Nucl Fusion. 2015;55:083017.
- Wade MR, Houlberg WA, Baylor LR, et al. Experimental confirmation of impurity convection driven by the ion-temperature gradient in toroidal plasmas. Phys Rev Lett. 2000;84:282.
- Bourdelle C, Garbet X, Imbeaux F, et al. A new gyrokinetic quasilinear transport model applied to particle transport in tokamak plasmas. Phys Plasmas. 2007;14:112501.
- Citrin J, Bourdelle C, Casson FJ, et al. Tractable flux-driven temperature, density, and rotation profile evolution with the quasilinear gyrokinetic transport model QuaLiKiz. Plasma Phys Control Fusion. 2017;59:124005.
- Peeters AG, Camenen Y, Casson FJ, et al. The nonlinear gyro-kinetic flux tube code GKW. Comput Phys Commun. 2009;180:2650.
- Bourdelle C, Camenen Y, Citrin J, et al. Fast H isotope and impurity mixing in ion-temperature-gradient turbulence. Nucl Fusion. 2018;58:076028.
- Ida K, Nakata M, Tanaka K, et al. Transition between isotope-mixing and nonmixing states in hydrogen-deuterium mixture plasmas. Phys Rev Lett. 2020;124:025002.
- Ida K, Yoshinuma M, Yamasaki K, et al. Measurements of radial profile of hydrogen and deuterium density in isotope mixture plasmas using bulk charge exchange spectroscopy. Rev Sci Instrum. 2019;90:093503.
- Watanabe T-H, Sugama H. Velocity–space structures of distribution function in toroidal ion temperature gradient turbulence. Nucl Fusion. 2006;46:24.
- Nakata M, Nunami M, Sugama H, et al. Impact of hydrogen isotope species on microinstabilities in helical plasmas. Plasma Phys Control Fusion. 2016;58:074008.
- Nakata M, Nunami M, Sugama H, et al. Isotope Effects on trapped-electron-mode driven turbulence and zonal flows in helical and tokamak plasmas. Phys Rev Lett. 2017;118:165002.
- Hegna C,C. The physics of neoclassical magnetohydrodynamic tearing modes. Phys Plasmas. 1998;5:1767.
- Isayama A, Kamada Y, Ozeki T, et al. Measurement of magnetic island width in long-pulse, high- discharges in JT-60U. Plasma Phys Control Fusion. 1999;41:35.
- Urso L, Maraschek M, Zohm H, et al. Fitting of the rutherford equation for neoclassical tearing mode stabilisation in ASDEX upgrade. J Phys Conf Ser. 2005;25:266.
- Smolyakov AI. Nonlinear evolution of tearing modes in inhomogeneous plasmas. Plasma Phys Control Fusion. 1993;35:657.
- La Haye RJ, Günter S, Humphreys DA, et al. Control of neoclassical tearing modes in DIII–D. Phys Plasmas. 2002;9:2051.
- Isayama A, Kamada Y, Hayashi N, et al. Achievement of high fusion triple product, steady-state sustainment and real-time NTM stabilization in high- p ELMy H-mode discharges in JT-60U. Nucl Fusion. 2003;43:1272.
- Petty CC, Haye RJL, Luce TC, et al. Complete suppression of the m = 2/n = 1 neoclassical tearing mode using electron cyclotron current drive in DIII-D. Nucl Fusion. 2004;44:243.
- Classen IGJ, Westerhof E, Domier CW, et al. Effect of heating on the suppression of tearing modes in tokamaks. Phys Rev Lett. 2007;98:035001.
- Fitzpatrick RJ, Waelbroeck FL. Spontaneous healing and growth of locked magnetic island chains in toroidal plasmas. Phys Plasmas. 2012;19:112501.
- Brand H, de Baar, van den MR, et al. Integrated modelling of island growth, stabilization and mode locking: consequences for NTM control on ITER. Plasma Phys Control Fusion. 2012;54:094003.
- Diamond PH, Dupree TH, Tetreault DJ. Self-consistent model of stochastic magnetic fields. Phys Rev Lett. 1980;45:562.
- Donne AJH, van Gorkom JC, Udintsev VS, et al. Evidence for high- m secondary islands induced by large low- m islands in a tokamak plasma. Phys Rev Lett. 2005;94:085001.
- Liang Y, Koslowski HR, Krämer-Flecken A, et al. Observations of secondary structures after collapse events occurring at the q = 2 magnetic surface in the TEXTOR tokamak. Nucl Fusion. 2007;47:L21.
- Evans TE, Moyer RA, Burrell KH, et al. Edge stability and transport control with resonant magnetic perturbations in collisionless tokamak plasmas. Nature Phys. 2006;2:419.
- Liang Y, Koslowski HR, Thomas PR, et al. Active control of type-i edge-localized modes with n = 1 perturbation fields in the JET tokamak. Phys Rev Lett. 2007;98:265004.
- Ida K, Kobayashi T, Inagaki S, et al. Topology bifurcation of a magnetic flux surface in toroidal plasmas. Plasma Phys Control Fusion. 2015;57:014036.
- Ida K, Kobayashi T, Yoshinuma M, et al. Bifurcation physics of magnetic islands and stochasticity explored by heat pulse propagation studies in toroidal plasmas. Nucl Fusion. 2016;56:092001.
- Carreras B, Hicks HR, Holmes JA, et al. Nonlinear coupling of tearing modes with self-consistent resistivity evolution in tokamaks. Phys Fluids. 1980;23:1811.
- Wesson JA, Gill RD, Hugon M, et al. Disruptions in JET. Nucl Fusion. 1989;29:641.
- D´Angelo F, Paccagnella R. The stochastic diffusion process in reversed-field pinch. Phys Plasmas. 1996;3:2353.
- Sarff JS, Almagri AF, Anderson JK, et al. Tokamak-like confinement at a high beta and low toroidal field in the MST reversed field pinch. Nucl Fusion. 2003;43:1684.
- Bergerson WF, Auriemma F, Chapman BE, et al. Bifurcation to 3D helical magnetic equilibrium in an axisymmetric toroidal device. Phys Rev Lett. 2011;107:255001.
- Levinton FM, Fonck RJ, Gammel GM, et al. Magnetic field pitch-angle measurements in the PBX-M tokamak using the motional Stark effect. Phys Rev Lett. 1989;63:2060.
- Ida K, Yoshinuma M, Watanabe KY, et al. Measurements of rotational transform due to noninductive toroidal current using motional stark effect spectroscopy in the large helical device. Rev Sci Instrum. 2005;76:053505.
- Ida K, Yoshinuma M, Suzuki C, et al. Measurements of rotational transform with motional stark effect spectroscopy. Fusion Sci Technol. 2010;58:383.
- Dobbins TJ, Ida K, Suzuki C, et al. A motional Stark effect diagnostic analysis routine for improved resolution of iota in the core of the large helical device. Rev Sci Instrum. 2017;88:093518.
- de Vries PC, Waidmann G, Krämer-Flecken A, et al. Temperature profile perturbations due to magnetic islands in TEXTOR. Plasma Phys Control Fusion. 1997;39:439.
- Stephens HD, Den Hartog DJ, Hegna CC. Electron thermal transport within magnetic islands in the reversed-field pinch. Phys Plasmas. 2010;17:056115.
- Inagaki S, Tamura N, Ida K, et al. Observation of reduced heat transport inside the magnetic island o point in the large helical device. Phys Rev Lett. 2004;92:055002.
- Yakovlev M, Inagaki S, Shimozuma T, et al. Heat pulse propagation across the rational surface in a large helical device plasma with counter-neutral beam injection. Phys Plasmas. 2005;12:092506.
- Spakman QW, Hogeweij GMD, Jaspers RJE, et al. Heat pulse propagation studies around magnetic islands induced by the dynamic ergodic divertor in TEXTOR. Nucl Fusion. 2008;48:115005.
- Ida K, Kamiya K, Isayama A, et al. Reduction of ion thermal diffusivity inside a magnetic island in JT-60U tokamak plasma. Phys Rev Lett. 2012;109:065001.
- Tamura N, Sudo S, Khlopenkov KV, et al. Impurity transport studies by means of tracer-encapsulated solid pellet injection in neutral beam heated plasmas on LHD. Plasma Phys Control Fusion. 2003;45:27.
- Kobayashi T, Inagaki S, Itoh S-I, et al. Verification of wavelet analysis for a heat pulse propagation experiment. Plasma Phys Control Fusion. 2011;53:095012.
- Luxon JL. A design retrospective of the DIII-D tokamak. Nucl Fusion. 2002;42:614.
- Ida K, Inagaki S, Suzuki Y, et al. Topology bifurcation of a magnetic flux surface in magnetized plasmas. New J Phys. 2013;15:013061.
- Suttrop W, Eich T, Fuchs JC, et al. First observation of edge localized modes mitigation with resonant and nonresonant magnetic perturbations in ASDEX upgrade. Phys Rev Lett. 2011;106:225004.
- Lee J, Jeon YM, In Y, et al. Direct evidence of E × B flow changes at the onset of resonant magnetic perturbation-driven edge-localized mode crash suppression. Nucl Fusion. 2019;59:066033.
- Nave MFF, Wesson JA. Mode locking in tokamaks. Nucl Fusion. 1990;30:2575.
- Yagi Y, Koguchi H, Sakakita H, et al. Mode-locking phenomena in the TPE-RX reversed-field pinch plasma. Phys Plasmas. 1999;6:3824.
- Zohm H, Kallenbach A, Bruhns H, et al. Plasma Angular-Momentum Loss by MHD Mode Locking. Europhys Lett. 1990;11:745.
- Lazzaro E, Buttery RJ, Hender TC, et al. Error field locked modes thresholds in rotating plasmas, anomalous braking and spin-up. Phys Plasmas. 2002;9:3906.
- Snipes JA, Campbell DJ, Haynes PS, et al. Large amplitude quasi-stationary MHD modes in JET. Nucl Fusion. 1998;28:1085.
- de Vries PC, Waidmann G, Donné AJH, et al. MHD-mode stabilization by plasma rotation in TEXTOR. Plasma Phys Control Fusion. 1996;38:467.
- Tobias B, Chen M, Classen IGJ, et al. Rotation profile flattening and toroidal flow shear reversal due to the coupling of magnetic islands in tokamaks. Phys Plasmas. 2016;23:056107.
- Terry PW, Fiksel G, Ji H, et al. Ambipolar magnetic fluctuation-induced heat transport in toroidal devices. Phys Plasmas. 1996;3:1999.
- Mahmood A, Eriksson A, Weiland J. Electromagnetic effects on toroidal momentum transport. Phys Plasmas. 2010;17:122310.
- Lichtenberg AJ, Itoh K, Itoh S-I, et al. The role of stochasticity in sawtooth oscillations. Nucl Fusion. 1992;32:495.
- Itoh K, Itoh S-I, Fukuyama A, et al. Model of the major disruption in tokamaks. Nucl Fusion. 1992;32:1851.
- Rechester AB, Rosenbluth MN. Electron heat transport in a tokamak with destroyed magnetic Surfaces. Phys Rev Lett. 1978;40:38.
- Sakakibara S, Yamada H, Watanabe KY, et al. MHD characteristics in the high beta regime of the large helical device. Nucl Fusion. 2001;41:1177.
- Watanabe KY, Sakakibara S, Narushima Y, et al. Effects of global MHD instability on operational high beta-regime in LHD. Nucl Fusion. 2005;45:1247.
- Isayama A, Inagaki S, Watanabe KY, et al. Observation of localized oscillations at m /n = 2/1 rational surface during counter neutral beam injection in the large helical device. Plasma Phys Control Fusion. 2006;48:L45.
- Isayama A, Kamada Y, Ide S, et al. Complete stabilization of a tearing mode in steady state high-β p H-mode discharges by the first harmonic electron cyclotron heating/current drive on JT-60U. Plasma Phys Control Fusion. 2000;42:L37.
- Zheng LJ, Furukawa M. Current-interchange tearing modes: conversion of interchange-type modes to tearing modes. Phys Plasmas. 2010;17:052508.
- Chu MS, Greene JM, Lao LL, et al. Resistive interchange modes in negative central shear tokamaks with peaked pressure profiles. Phys Rev Lett. 1996;77:2710.
- Jayakumar R, Luce TC, Taylor TS, et al. Observation and analysis of a resistive mode with interchange parity in negative central shear plasmas in the DIII-D Tokamak. Phys Plasmas. 2002;9:5043.
- Ida K, Kobayashi T, Yoshinuma M, et al. Trigger mechanism for the abrupt loss of energetic ions in magnetically confined plasmas. Sci Rep. 2018;8:2804.
- Takemura Y, Watanabe KY, Sakakibara S, et al. Study of slowing down mechanism of locked-mode-like instability in helical plasmas. Nucl Fusion. 2019;59:066036.
- Ishizawa A, Nakajima N. Turbulence driven magnetic reconnection causing long-wavelength magnetic islands. Phys Plasmas. 2010;17:072308.
- Paccagnella R. Pressure driven tearing and interchange modes in the reversed field pinch. Phys Plasmas. 2013;20:012119.
- Arstimovich LA, A physicist’s ABC on plasma, first edition 1978, revised from the 1976 russian editions, English translation, Mir Publishers, (Moscow, 1978).
- Ida K, Kobayashi T, Itoh K, et al. Abrupt onset of tongue deformation and phase space response of ions in magnetically-confined plasmas. Sci Rep. 2016;6:36217.
- Fitzpatrick R. Formation and locking of the “slinky mode” in reversed-field pinches. Phys Plasmas. 1999;6:1168.
- Yun GS, Lee W, Choi MJ. Two-Dimensional visualization of growth and burst of the edge-localized filaments in KSTAR H -mode plasmas. Phys Rev Lett. 2011;107:045004.
- Lee JE, Yun GS, Lee W, et al. Solitary perturbations in the steep boundary of magnetized toroidal plasma. Sci Rep. 2017;7:45075.
- Parker EN. The solar-flare phenomenon and the theory of reconnection and annihilation of magnetic fields. ApJS. 1963;8:177.
- Yokoyama T, Shibata K. What is the condition for fast magnetic reconnection? ApJ. 1994;436:L197.
- Shibata K, Tanuma S. Plasmoid-induced-reconnection and fractal reconnection. Earth Planets Space. 2001;53:473.
- McDevitt CJ, Diamond PH. Multiscale interaction of a tearing mode with drift wave turbulence: A minimal self-consistent model. Phys Plasmas. 2006;13:032302.
- Ishizawa A, Waelbroeck FL. Magnetic island evolution in the presence of ion-temperature gradient-driven turbulence. Phys Plasmas. 2013;20:122301.
- Wang ZX, Li JQ, Kishimoto Y, et al. Magnetic-island-induced ion temperature gradient mode. Phys Plasmas. 2009;16:060703.
- Waelbroeck FL, Militello F, Fitzpatrick R, et al. Effect of electrostatic turbulence on magnetic islands. Plasma Phys Control Fusion. 2009;51:015015.
- Poli E, Bottino A, Hornsby WA, et al. Gyrokinetic and gyrofluid investigation of magnetic islands in tokamaks. Plasma Phys Control Fusion. 2010;52:124021.
- Ida K, Kobayashi T, Ono M, et al. Hysteresis relation between turbulence and temperature modulation during the heat pulse propagation into a magnetic Island in DIII-D. Phys Rev Lett. 2018;120:245001.
- Grenfell G, Milligen BPV, Losada U, et al. Measurement and control of turbulence spreading in the scrape-off layer of TJ-II stellarator. Nucl Fusion. 2019;59:016018.
- Hahm TS, Diamond PH, Lin Z, et al. Turbulence spreading into the linearly stable zone and transport scaling. Plasma Phys Control Fusion. 2004;46:A323.
- Gurcan OD, Diamond PH. Dynamics of turbulence spreading in magnetically confined plasmas. Phys Plasmas. 2005;12:032303.
- Hahm TS, Diamond PH. Mesoscopic transport events and the breakdown of Fick’s Law for turbulent fluxes. J Korean Phys Soc. 2018;73:747.
- Wang WX, Hahm TS, Lee WW, et al. Nonlocal properties of gyrokinetic turbulence and the role of E×B flow shear. Phys Plasmas. 2007;14:072306.
- Bardoczi L, Rhodes TL, Bañón Navarro A, et al. Multi-field/-scale interactions of turbulence with neoclassical tearing mode magnetic islands in the DIII-D tokamak. Phys Plasmas. 2017;24:056106.
- Scoville JT, La Haye RJ. Multi-mode error field correction on the DIII-D tokamak. Nucl Fusion. 2003;43:250.
- Ida K. On the interplay between MHD instabilities and turbulent transport in magnetically confined plasmas. Plasma Phys Control Fusion. 2020;62:014008.
- Ida K, Ohyabu N, Morisaki T, et al. Observation of plasma flow at the magnetic island in the large helical device. Phys Rev Lett. 2001;88:015002.
- Estrada T, Ascasíbar E, Blanco E, et al. Plasma flow, turbulence and magnetic islands in TJ-II. Nucl Fusion. 2016;56:026011.
- Zhao KJ, Shi YJ, Hahn SH, et al. Plasma flows and fluctuations with magnetic islands in the edge plasmas of J-TEXT tokamak. Nucl Fusion. 2015;55:073022.
- Estrada T, Happel T, Eliseev L, et al. Sheared flows and transition to improved confinement regime in the TJ-II stellarator. Plasma Phys Control Fusion. 2009;51:124015.
- Estrada T, Hidalgo C, Happel T, et al. Spatiotemporal structure of the interaction between turbulence and flows at the L-H transition in a toroidal plasma. Phys Rev Lett. 2011;107:245004.
- Ida K, Inagaki S, Tamura N, et al. Radial electric field and transport near the rational surface and the magnetic island in LHD. Nucl Fusion. 2004;44:290.
- Ida K, Yoshinuma M, Yokoyama M, et al. Control of the radial electric field shear by modification of the magnetic field configuration in LHD. Nucl Fusion. 2005;45:391.
- Ida K, Inagaki S, Yoshinuma M, et al. Potential structure and transport in the magnetic island in LHD. Fusion Sci Technol. 2010.;58:113.
- Ida K, Inagaki S, Shimozuma T, et al. Characteristics of transport in electron internal transport barriers and in the vicinity of rational surfaces in the large helical device. Phys Plasmas. 2004;11:2551.
- Joffrin E, Challis CD, Conway GD, et al. Internal transport barrier triggering by rational magnetic flux surfaces in tokamaks. Nucl Fusion. 2003;43:1167.
- Estrada T, Medina F, López-Bruna D, et al. Transitions to improved core electron heat confinement triggered by low order rational magnetic surfaces in the stellarator TJ-II. Nucl Fusion. 2007;47:305.
- Hidalgo C, Pedrosa MA, Sánchez E, et al. Generation of sheared poloidal flows via Reynolds stress and transport barrier physics. Plasma Phys Control Fusion. 2000;42:A153.
- Hirsch M, Grigull P, Wobig H, et al. Operational conditions and characteristics of ELM-events during H-mode plasmas in the stellarator W7-AS. Plasma Phys Control Fusion. 2000;42:A231.
- Hidalgo C, Pedrosa MA, Gonçalves B, et al. Fluctuations, sheared radial electric fields and transport interplay in fusion plasmas. New J Phys. 2002;4:51.
- Hu ZQ, Wang ZX, Wei L, et al. Structure bifurcation induced by wide magnetic islands. Nucl Fusion. 2020;60:056015.
- Cheng J, Dong JQ, Itoh K, et al. Formation of radially elongated flow leading to onset of type-III edge localized modes in toroidal plasmas. Nucl Fusion. 2020;60:046021.
- Ida K. Summary of the 27th IAEA fusion energy conference in the categories of EX/W, EX/D, and ICC. Nucl Fusion. 2019;59:117001.
- Jia L, Sun Y, Paz-Soldan C, et al. Dynamic divertor control using resonant mixed toroidal harmonic magnetic fields during ELM suppression in DIII-D. Phys Plasmas. 2018;25:056102.
- Coda S, Agostini M, Albanese R, et al. Physics research on the TCV tokamak facility: from conventional to alternative scenarios and beyond. Nucl Fusion. 2019;59:1112023.
- Maurizio R, Elmore S, Fedorczak N, et al. Divertor power load studies for attached L-mode single-null plasmas in TCV. Nucl Fusion. 2018;58:016052.