
 ?Mathematical formulae have been encoded as MathML and are displayed in this HTML version using MathJax in order to improve their display. Uncheck the box to turn MathJax off. This feature requires Javascript. Click on a formula to zoom.
ABSTRACT
Quantum oscillation is an important phenomenon in low temperature transport studies of topological materials. In three-dimensional topological insulators, Dirac semimetals, Weyl semimetals, and other topological nontrivial materials, the topologically nontrivial band structure will add a phase correction to the quantum oscillation patterns, which is known as the nontrivial Berry phase. Berry phase analysis via quantum oscillation is a powerful method to investigate the nontrivial band topology of topological materials. In this review, we introduce the concepts of the Berry phase and quantum oscillations, and provide some classification of topological materials. We then employ some important studies on each type of topological material to discuss the nontrivial Berry phase. We conclude by pointing out the importance of quantum transport studies on topological materials, as well as drawing attention to the exploration of the nontrivial Berry phase in a new material system that could shed more light on the topology-based electronics.
Graphical Abstract
1 Introduction
1.1 Berry phase and topology
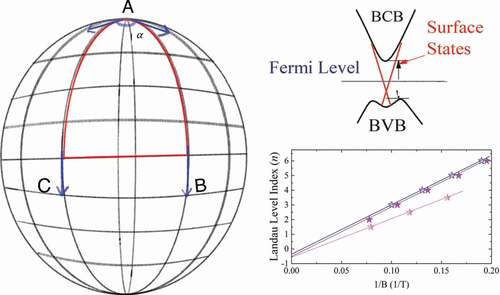
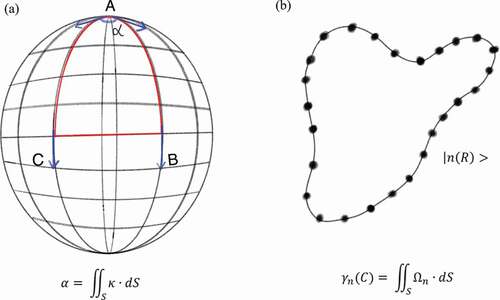
Generally, a parallel-transport vector may acquire a geometric phase after completing a closed path on a surface, as shown in . In quantum mechanics, a typical geometric phase was proposed by M. Berry [Citation1] in 1984, which is known as the Berry phase (). In analogy with geometric phase, which is the integral of the Gaussian curvature on an arbitrary curved surface, the Berry phase is the integral of the Berry curvature. If one thinks about the Aharonov-Bohm phase, which is the phase acquired by a charged particle traversing a loop including a magnetic flux, the Berry curvature and the Berry phase are analogous to the magnetic field and the magnetic flux.
Figure 1. Illustration of the geometrical phase generated along a closed path on a surface. (a) The geometric phase of a vector moving on a sphere. Initially at the north pole, the vector is parallel-transported along the longitude AB to the equator BC, and then to the longitude CA. Even though the vector has not been rotated at any point along its route, it has been rotated at an angle α. The angle α is the integral of the Gaussian curvature К over the area enclosed by the route. (b) The adiabatic evolution of a quantum state along a smooth circuit in the parameter space. The quantum parallel transport of a state means that
, namely, the change of a state cannot be along its own direction. After returning to the starting point, the state is rotated and acquires the Berry phase γn(C), which is the integral of the Berry curvature Ωn over the area S.
As illustrated in , the Berry phase is the geometric phase acquired by a quantum state after finishing an adiabatic evolution route. In a crystal, we have certain band structures due to the periodic potential, in which geometrical or topological features also exist and are related to how the wave functions change with the quasi-momentum across the Brillouin zone [Citation2]. In 1999, Mikitik and Sharlai [Citation3] demonstrated that the Berry phase is manifested in metal physics, and when the electron orbit links to the band-crossing line of the metal, the Berry phase is nonzero, therefore resulting in different quantization conditions.
1.2 Quantum oscillations
The semiclassical theory of quantum oscillations is related to Landau quantization in magnetic fields. Landau predicted that the magnetization of metals shows a periodic magnetic dependence at low temperatures, which was experimentally observed by Shubnikov and de Haas in magnetoresistance in a bismuth single crystal [Citation4] (namely, the Shubnikov-de Haas (SdH) oscillations), as well as by de Haas and van Alphen in magnetization of a bismuth single crystal [Citation5] (namely, the de Haas-van Alphen (dHvA) oscillations). Note that both experimental observations were reported independently, without awareness of Landau’s prediction. Moreover, these periodic oscillation effects not only appear in magnetoresistance or magnetization, but also in other physical properties, such as specific heat, the Seebeck effect, etc.
The following discussion is based on D. Shoenberg’s [Citation6] and A. B. Pippard’s [Citation7] books. In the semiclassical approximation, a free electron is governed by the Lorenz force when it moves in a homogeneous magnetic field, so that it shows helical motion along the magnetic field direction. This circular motion is described by the Bohr-Sommerfeld quantization rule:
where p is the momentum, r is the position variable, ħ is the reduced Planck’s constant, and n is an integer. An electron in a magnetic field possesses a momentum of p = mv – eA, where A is the magnetic vector potential of the magnetic field B (A = 1/2(r × B)), v is the velocity, and e and m are the charge and mass of an electron. The Lorentz force is:
where k is the wave vector in momentum space. By using the Stokes’ theorem, one can obtain EquationEquation 1(1)
(1) from EquationEquation 2
(2)
(2) . Since the expressions are in momentum space, the orbital area Ak in momentum space is related to the real space orbital area:
where kn is the radius of momentum space orbitals, which obeys the Onsager relation. The relation limits the allowed values of k in magnetic field and can be understood by Landau tubes, as shown in .
Figure 2. The reshaped Fermi surface from a sphere to Landau tubes.
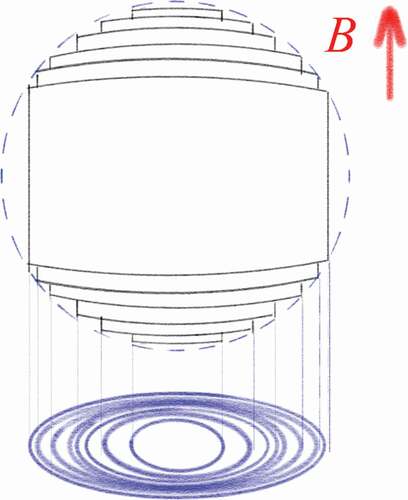
In the simplest case of a free electron gas, the Landau tubes are coaxial cylinders around the magnetic field, in which the cross-sectional area is described by Equations 2–3. In a real material within the independent electron approximation, the eigenstates of the system in applied magnetic fields will reshape the Fermi surface into concentric rings within the Landau tubes, as shown by . The increasing magnetic field results in expansion of the Landau tubes: the radii of the orbital states grow with , and the energy of states grows with B. With increasing magnetic field, the outermost Fermi tube is expanded to cross the Fermi surface, and it therefore leads to a high value of density of states (DOS); on further increasing, the Landau tube height shrinks to zero, and the DOS drops sharply. Thus, the DOS reaches a maximum at Ak = AFS, where AFS is the area of the largest orbital of the Fermi surface perpendicular to the field. At each time a Landau tube crosses the Fermi surface, the DOS shows a maximum, following by oscillation in physical properties. The oscillations are periodic with 1/B, and the period between two peaks is:
while the frequency is:
By obtaining the oscillation frequencies, one can study the extremal cross-sectional area of the Fermi surface perpendicular to the magnetic field.
As shown by D. Shoenberg6, in a real metal, the grand thermodynamic potential of electrons has an oscillatory component , which is a function of B:
Note that this equation is for the ideal crystal at zero temperature and does not account for the spins. The sum is due to the Fourier series’ decomposition, and p expresses the harmonics. The phase shift ± π/4 accounts for whether the extremal area of the Fermi surface is a minimum or a maximum. To account for any imperfection of the above mentioned conditions, extra phase shifts and damping will be applied to the relationship. The effect of finite temperature can be introduced via the Fermi-Dirac distribution:
where ε is the energy, T is the temperature, μ is the chemical potential, and kB is the Boltzmann constant. The damping of quantum oscillations originates from the thermal broadening of the Fermi surface following the Fermi-Dirac distribution at finite temperature. The reduction factor RT is expressed by:
where the theory has been extended to electron-electron interactions and introduces the effective mass m*. Crystalline defects and impurities contribute to the carriers’ scattering, with mean scattering time of τ, or the related average distance travelled between scatterings l:
where the Fermi velocity vF = and kF is the Fermi wavevector. Any finite scattering time will result in uncertainty in the energy levels. R. Dingle characterized this broadening by employing a Lorentzian distribution, and thereby obtained a damping factor:
where RD is the Dingle factor and TD = ħ/2πkBτ is the Dingle temperature. The Dingle temperature is used to estimate the mean free path:
In a magnetic system, the spin degeneracy is broken due to Zeeman splitting by:
where the g is the spin g factor ≈ 2. Electrons with different spins will be separated in energy by , and by a phase of:
where the is equal to the energy difference between two Landau levels. Moreover, there is an additional factor of reduction Rs:
Combining the aforementioned factors, the full formula to describe the quantum oscillations is obtained below:
where χ is defined in EquationEquation 8(8)
(8) and
is the curvature of the extremal orbit of the Fermi surface perpendicular to the magnetic field. Employing the damping factors in EquationEquation 15
(15)
(15) , one may obtain:
Here, the Berry phase ΦB has to be taken into account for a topological system: the of phase factor
in the sine term = (1/2 – ΦB/2π). The dimensionality of the Fermi surface determines the phase shift
, which is ±1/8 for a three-dimensional (3D) system, where the maximum or minimum determines the sign. In the two-dimensional (2D) case, the
.
1.3 Topological materials
Initially, C. L. Kane and E. J. Mele [Citation8] proposed that, with spin-orbital interaction/coupling (SOC), there is a new SOC term in the system Hamiltonian related to Haldane’s model. The SOC Hamiltonian can be taken separately for the spin angular momentum, Sz = ±1, which is equivalent to Haldane’s model for spinless electrons and also violates time reversal symmetry. This model suggests that the SOC introduces a periodic magnetic field with no net flux in the system, giving rise to a finite energy gap. At temperatures well below the gap, the double spin Haldane’s model finally leads to a quantized Hall conductance for each spin [Citation8]. In this situation, the edge modes are helical spin modes, which means that the spin-up electron and spin-down electron have opposite momenta. The quantum spin Hall effect is very important in quantum computing and information, but it is also important to note that the 2D topological insulators (TIs) only exist in buried interfaces of ultraclean semiconductors or atomic-scale thin layered materials, limiting systematic studies of the important properties of 2D TIs: e.g. their electronic structure, spin texture, and optical behavior. Moreover, the manipulation of one-dimensional (1D) conducting edges is also difficult to realize, whereas it is much more tractable to modulate the conductivity of a 2D edge in a 3D material. In 2007, researchers realized that the Z2 topological number in a 2D TI can be generalized to 3D materials [Citation9–11]. A simple model is that one may construct nontrivial 3D topological insulators by stacking 2D TI layers, so that the edge states may therefore become anisotropic surface states. The first 3D topological insulator to be identified experimentally was the semiconducting alloy Bi1-xSbx, the surface states of which were studied via angle-resolved photoelectron spectroscopy (ARPES) in 2008 [Citation12]. In 2009, a second generation of 3D topological insulator materials, as represented by Bi2Se3, was theoretically predicted [Citation13], with a single surface Dirac cone that was also verified via ARPES [Citation14]. Beyond the research on 3D topological insulators, more and more topological states have been predicted and verified. In recent years, the family of topological electronic structures has been expanded to include members beyond the 2D and 3D TIs that were first discovered. In 2011, L. Fu et al [Citation15]. proposed that new topological edge states can be protected by the symmetry of a crystallographic space group in materials identified as topological crystalline insulators. A year later, L. Fu and his collaborators predicted that, in SnTe, the mirror symmetry can protect the topological edge states [Citation16], which was soon experimentally verified [Citation17,Citation18]. In 2016, Bernevig et al [Citation19]. predicted that, in KHgSb, the glide plane symmetry would protect the hourglass type surface state on the (100) surface. The experimental verification of this particular surface state was conducted by T. Qian et al. via ARPES [Citation20]. Bernevig et al [Citation21]. also predicted that two perpendicular glide planes can also protect Dirac surface states, in which the Dirac cones coincide at one point, although this has not been verified yet.
In the last decade, researchers also extended the concept of topology from TIs to topological semimetals, the band structures of which are shown in . The topological semimetals possess two- or four-fold degenerate points in their bulk states. Since the low energy excitation Hamiltonian near the degenerate points shares the same form as the 4 × 4 Dirac function or the 2 × 2 Weyl function in quantum field theory, the related materials were named Dirac and Weyl semimetals. In 2011, X. Wan, Z. Fang, and X. Dai et al. predicted the Weyl semimetals Y2Ir2O7 [Citation22] and HgCr2Se4 [Citation23] with time reversal symmetry that is theoretically broken, although this has not been verified experimentally. Soon afterwards, the Dirac semimetals Na3Bi [Citation24] and Cd3As2 [Citation25], in which the Dirac cone states can be found in bulk bands, were predicted and experimentally observed via ARPES [Citation26,Citation27]. In 2015, TaAs, a system with broken inversion symmetry, was predicted to be a Weyl semimetal [Citation28]. The three dimensional Weyl cone structure in the bulk states, as well as the open Fermi arcs of surface states, were observed via ARPES [Citation29–31]. Also in 2015, the type II Weyl semimetal WTe2 was predicted [Citation32,Citation33] and experimentally verified [Citation33], in which the slopes of two bands along a certain direction have the same sign.
Figure 3. Band structures and the related Fermi surfaces of metals: normal metal, Dirac semimetal, Weyl semimetal, and topological nodal-line semimetal [Citation34].
![Figure 3. Band structures and the related Fermi surfaces of metals: normal metal, Dirac semimetal, Weyl semimetal, and topological nodal-line semimetal [Citation34].](/cms/asset/7b8a754f-0dfb-4952-85bf-b9bb7ff5fab2/tapx_a_2064230_f0003_oc.jpg)
There are three different fermions that could exist due to Lorentz invariance, namely, Dirac, Weyl, and Majorana fermions. In crystals, however, the symmetries involve 230 different space groups instead of the Poincaré group, where the Lorentz invariance no longer restricts the type of fermions. Therefore, exploring more fermion quasiparticles, as shown in , has become popular in condensed matter physics. In 2016, Kane et al [Citation35]. and Bernevig et al [Citation36]. predicted that the symmetry of complex space groups can protect triple-, six-fold-, and eight-fold-degenerate points. Near these degenerate points, the low energy excitation cannot be described by the standard models of quantum field theory. Soon afterwards, triple degenerate fermions protected by simple space group symmetry were predicted in WC family compounds [Citation37]. The experimental verifications by ARPES were reported by T. Qian et al., in which they found the triple degenerate points in the bulk states, as well as the surface Fermi arcs [Citation38,Citation39]. Moreover, the degenerate regions in the energy bands are not only on finite points (nodal points), but also on one-dimensional lines (nodal lines) or two-dimensional surfaces (nodal surfaces), namely, in nodal-line/surface semimetals. Predictions of the topological nodal-line/surface semimetals have been reported for many systems [Citation40–44], but experimental progress has been quite limited, and so far, only a few compounds have been verified experimentally, including the ZrSiS family [Citation45–47] and PbTaSe2 [Citation48]. The predictions and experimental progress on topological matter are fundamental to quantum mechanical studies of solid states, which is also the precondition of their applications in spintronics.
2 Berry phase in dirac systems
The first well studied 2D Dirac-fermion material was graphene, which is the single carbon monolayer exfoliated from graphite bulk [Citation49]. Long before the novel story of graphene, researchers had already done remarkable studies of graphite itself, to explore its Dirac-band-related electronic properties. The quasi-2D conductivity of graphite occurs mostly inside the carbon layers due to the hexagonal networks of overlapping π-bonds. A quantum oscillation study and Berry phase analysis were reported in 2004 by I. A. Luk’yanchuk and Y. Kopelevich, in which they mentioned that the minority carriers in graphite are 2D holes with conventional bands, while the majority carriers are both electrons (3D conventional bands) and holes (2D Dirac bands) [Citation50]. After graphene was successful exfoliated from graphite bulk, S.-C. Zhang et al [Citation51]. discovered the quantum Hall effect in a 2D graphene device, as shown in .
Figure 4. Quantized magnetoresistance and Hall resistance of a graphene device. a, Hall resistance and magnetoresistance measured at 30 mK and gate voltage, Vg = 15 V. The vertical arrows and the numbers on them indicate the values of magnetic field and the corresponding filling factors of quantum Hall states. The horizontal lines correspond to h/e2 values. The inset shows the QHE for a hole gas at Vg = −4 V, measured at 1.6 K. The quantized plateau for the filling factor ν = 2 is well-defined, and the second and the third plateaus with ν = 6 and 10, respectively, are also resolved. b, The Hall resistance (black) and magnetoresistance (Orange) as functions of gate voltage at fixed magnetic field B = 9 T, measured at 1.6 K. The same conventions as in a are used here. The upper inset shows a detailed view of high filling factor plateaus measured at 30 mK. c, A schematic diagram of the Landau level (LL) density of states (DOS) and corresponding quantum Hall conductance (σxy) as functions of energy. Note that in the quantum Hall states, σxy = -Rxy−1. The LL index n is shown next to the DOS peak. In the experiment, the Fermi energy EF can be adjusted by the gate voltage, and Rxy−1 changes by the amount of gse2/h as EF crosses a LL, where gs accounts for the spin and valley degeneracies [Citation51].
![Figure 4. Quantized magnetoresistance and Hall resistance of a graphene device. a, Hall resistance and magnetoresistance measured at 30 mK and gate voltage, Vg = 15 V. The vertical arrows and the numbers on them indicate the values of magnetic field and the corresponding filling factors of quantum Hall states. The horizontal lines correspond to h/e2 values. The inset shows the QHE for a hole gas at Vg = −4 V, measured at 1.6 K. The quantized plateau for the filling factor ν = 2 is well-defined, and the second and the third plateaus with ν = 6 and 10, respectively, are also resolved. b, The Hall resistance (black) and magnetoresistance (Orange) as functions of gate voltage at fixed magnetic field B = 9 T, measured at 1.6 K. The same conventions as in a are used here. The upper inset shows a detailed view of high filling factor plateaus measured at 30 mK. c, A schematic diagram of the Landau level (LL) density of states (DOS) and corresponding quantum Hall conductance (σxy) as functions of energy. Note that in the quantum Hall states, σxy = -Rxy−1. The LL index n is shown next to the DOS peak. In the experiment, the Fermi energy EF can be adjusted by the gate voltage, and Rxy−1 changes by the amount of gse2/h as EF crosses a LL, where gs accounts for the spin and valley degeneracies [Citation51].](/cms/asset/17a3c5b2-3b11-4cda-980e-0a7e2a2b08be/tapx_a_2064230_f0004_oc.jpg)
Exceptionally high mobility graphene samples were employed to explore the transport phenomena in the extreme magnetic quantum limit, such as the quantum Hall effect (QHE). From Zhang’s experiments, shows Rxy and Rxx of the sample as functions of magnetic field B at a fixed gate voltage Vg > VDirac. The overall positive Rxy indicates that the contribution is mainly from electrons. At high magnetic field, Rxy(B) exhibits plateaus, and Rxx vanishes, which are the hallmark of the QHE. At least two well-defined plateaus with values (2e2/h)−1 and (6e2/h)−1, where h is Planck’s constant, followed by the development of a (10e2/h)−1 plateau, are observed before the QHE features transform into Shubnikov-de Haas (SdH) oscillations at lower magnetic field. The quantization of Rxy for these first two plateaus is better than 1 part in 104, which is precise within the instrumental uncertainty. Zhang et al. observed the equivalent QHE features for holes (Vg < VDirac) with negative Rxy values (, inset). This quantization condition can be translated to the quantized filling factor ν = ±gs(n + 1/2) in the usual QHE language. In addition, there is an oscillatory structure developed near the Dirac point. While the QHE has been observed in many 2D systems, the QHE observed in graphene is distinctively different from those ‘conventional’ QHEs, since the quantization condition is shifted by a half integer. The sequence of half-integer multiples of quantum Hall plateaus shows the existence of the Berry phase in such a system. As noted by several workers, a consequence of the combination of time reversal symmetry with the novel Dirac point structure can be viewed in terms of the Berry phase arising from the band degeneracy point [Citation3,Citation52]. A direct implication of the Berry phase in graphene is discussed in the context of the quantum phase of a spin-1/2 pseudo-spinor that describes the sublattice symmetry [Citation53,Citation54]. This phase is already implicit in the half-integer-shifted quantization rules of the QHE. The 2D massless Dirac fermion behavior was also reported in graphene by K.S. Novoselov et al [Citation55].
Recently, a new measurement technique based on scanning tunneling microscopy (STM) has been developed to measure the Berry phase in quantum materials locally [Citation56–58]. As shown in , the STM measurements capture the electronic density of states of a 2D system with Landau quantization. The dI/dV spectra recorded in a constant magnetic field reflect the local DOS at variable tunneling energies E, calculated as E = EF + eVB (where EF is the Fermi energy, VB is the tunneling bias, and EF corresponds to VB = 0 V). shows representative high-magnetic-field dI/dV spectra of decoupled monolayer graphene, exhibiting the well-defined LLs of massless Dirac fermions. From the conventional dI/dV spectra acquired at different magnetic fields incremented by a small interval ΔB (), one can obtain the local DOS in the 2D magnetic field versus the energy plane (the (B, E) plane). In this experiment, the magnetic-field increment was ΔB = 0.05 T. displays the energy-fixed DOS as a function of magnetic field, derived from the local DOS in the (B, E) plane. The largest oscillations originated from the LLs sweeping through the fixed energy. To further explore the DOS oscillations in the STM measurements, the magneto-oscillation fan diagram is plotted in . This diagram plots the 1/Bn values of the nth minimum in the DOS against their index n. The wavefunction of the quasiparticles in a graphene system can be described by a pseudo-spinor, and its chirality is determined from the zero inverse-field intercept of each line in the fan plot. All intercepts β on the fan diagram of the graphene monolayer were very close to 0.5 (or −0.5), as shown in , indicating the π Berry phase in monolayer graphene. A nontrivial Berry phase was also reported by other experimenters [Citation57–63]. The 2D Dirac fermion has also been predicted [Citation64] and observed [Citation65] on the surface of a 3D topological insulator. The transport property related to topological surface states (TSS) shows a similar phase shift in Landau quantization related phenomena.
Figure 5. Local Berry phase measurement technique by scanning tunneling microscope (STM). (a) The STM setup, in which the DOS of 2D systems can be directly probed over a wide energy range. (b) Landau level spectra of monolayer graphene in various magnetic fields (4–12 T). The monolayer graphene was decoupled from its multilayer graphene substrate. The data are offset on the Y axis for clarity, and the top labels are the Landau level indices. (c) Landau level energies extracted from panel (b) versus sgn(n)(|n|B)1/2. (c) Energy-fixed DOS as functions of magnetic field for different tunneling biases VB. (d) Fan plot showing linear dependences of the Landau level indices, taken from the DOS oscillations in monolayer graphene versus 1/B for different tunneling biases. Points n, (n 1/2) are associated with the nth minima (maxima) of the DOS oscillations. The solid lines are the linear fitting results of the slope BE. Their n-axis intercepts (panel (e)) directly reflect a Berry phase of π in the monolayer graphene. Panel (e) also plots the intercepts in pristine monolayer graphene versus the back gate voltage Vg (top x-axis) [Citation56].
![Figure 5. Local Berry phase measurement technique by scanning tunneling microscope (STM). (a) The STM setup, in which the DOS of 2D systems can be directly probed over a wide energy range. (b) Landau level spectra of monolayer graphene in various magnetic fields (4–12 T). The monolayer graphene was decoupled from its multilayer graphene substrate. The data are offset on the Y axis for clarity, and the top labels are the Landau level indices. (c) Landau level energies extracted from panel (b) versus sgn(n)(|n|B)1/2. (c) Energy-fixed DOS as functions of magnetic field for different tunneling biases VB. (d) Fan plot showing linear dependences of the Landau level indices, taken from the DOS oscillations in monolayer graphene versus 1/B for different tunneling biases. Points n, (n 1/2) are associated with the nth minima (maxima) of the DOS oscillations. The solid lines are the linear fitting results of the slope BE. Their n-axis intercepts (panel (e)) directly reflect a Berry phase of π in the monolayer graphene. Panel (e) also plots the intercepts in pristine monolayer graphene versus the back gate voltage Vg (top x-axis) [Citation56].](/cms/asset/1a36d11f-4b16-452e-a893-348f77c9fca4/tapx_a_2064230_f0005_oc.jpg)
There is one important point to be mentioned before further Berry phase extraction from the magnetotransport experiments, which is the assignment rule of Landau indices to the peak/valley values in magnetotransport curves [Citation66–68]. In materials such as graphene, the entire current is carried by the two-dimensional electron gas. Therefore, the 2D conductance Gs and the resistance Rxx attain a deep minimum due to Ryx ≫ Rxx. This will be complicated, however, when multiple conductance channels coexist in a system, e.g. with large bulk conductance, the observed resistance attains maxima at Bn because Rxx = Gxx/(G2xx+ G2xy) ~ 1/Gxx [Citation66]. Therefore, different Landau indexing rules have been employed in different systems, as shown in this review. D.-X. Qu et al. reported TSS related transport properties in high mobility Bi2Te3 based devices [Citation69]. In low temperatures, strong SdH oscillations were observed in the devices, which show the Berry phase correction in their LLs. To extract more specific information on the surface states, the authors analyzed how the SdH amplitudes varied with T in samples Q2 and Q3 (measured with H||c). As shown in , the oscillation amplitudes in drxx/dH decreased rapidly as T was raised from 0.3 to 20 K. Although measurements were not carried out at intermediate θ in Q2 and Q3, the authors verified that the SdH peaks were absent at θ = 90°. In the index plot (), it can be confirmed that the (inverse) peak field 1/B falls on a straight line versus the integer n. For Q2 and Q3, the slopes yield oscillation frequency F = 33.3 and 28.6 T, with Fermi wave vector kF = 0.032 and 0.030 Å−1, respectively. In Q1, the shallower slope yields kF = 0.036 Å−1. Extrapolation of the high-field SdH peaks in Q1 is consistent with 0 < g < 1/2. To find the corresponding EF, the authors also determined the Fermi velocity vF. The T dependence of the amplitude Δσxx of the conductivity oscillations is given by Δσxx (T) = Δσxx (0)λ(T)/sinhλ(T). In low H, the degree of orbit bending is measured by the Hall mobility μ, given by μ = eτtr/m, where τtr is the transport lifetime. The effective electron mass can be obtained by fitting the T dependence of the conductivity amplitudes (). Because kF is known, vF = 3.7 and 4.2 × 10⁵ m s–1 for Q2 and Q3, respectively. Moreover, this yields EF = 94, 84, and 78 meV above the Dirac point in samples Q1, Q2, and Q3, respectively. Due to the Dirac band nature of 3D TIs’ surface states, one may obtain a π Berry phase shift in their Landau quantization related phenomena. Due to the complexity of conduction channels in topological insulators, one should be always careful about band structure deduction by quantum oscillations. With shifts in the Fermi level, the carrier compositions change significantly, which thus leads to quantum oscillations with different contributions. For instance, in the topological superconductor SrxBi2Se3, the SdH oscillations and bulk conduction band shape are highly dependent on the carrier density [Citation70,Citation71]. In addition, another critical effect in 3D TI has been predicted, the possibility of sample inhomogeneity and thermodynamical constraints, crucially affecting the phase of quantum oscillations. Therefore, the phase of magneto-oscillations, at least in most studied 3D TIs (bismuth chalcogenides), should be carefully used as sufficient evidence to prove Dirac-type behavior [Citation72].
Figure 6. (A) Derivative dryx/dH versus 1/H in sample Q3 measured at temperatures T between 0.3 and 20 K. (B) The conductance obtained after subtracting a smooth background based on curves measured above 20 K (ΔG) for sample Q2 at selected T over the same interval. (C) LL index plot of 1/H versus n for samples Q1, Q2, and Q3. The results are consistent with 0 < γ < 1/2. (D) T dependence of the normalized conductivity amplitude at 0.3 K in samples Q2 (with H = 12 T) and Q3 (7.8 T). Dingle plots used to determine quantum relaxation time for (E) sample Q2 and (F) sample Q3 [Citation69].
![Figure 6. (A) Derivative dryx/dH versus 1/H in sample Q3 measured at temperatures T between 0.3 and 20 K. (B) The conductance obtained after subtracting a smooth background based on curves measured above 20 K (ΔG) for sample Q2 at selected T over the same interval. (C) LL index plot of 1/H versus n for samples Q1, Q2, and Q3. The results are consistent with 0 < γ < 1/2. (D) T dependence of the normalized conductivity amplitude at 0.3 K in samples Q2 (with H = 12 T) and Q3 (7.8 T). Dingle plots used to determine quantum relaxation time for (E) sample Q2 and (F) sample Q3 [Citation69].](/cms/asset/83da725a-ce33-4ebc-96b0-1ac2f5801072/tapx_a_2064230_f0006_oc.jpg)
The TSS dominant nontrivial Berry phase in the 3D TI system has been widely discussed. In practice, the Berry phase situation for a 3D TI can be very complicated. For example, defects shift the bulk Fermi level into the conduction band in Bi2Se3 single crystal, resulting in non-Dirac bulk-dominant quantum oscillations with 0 Berry phase [Citation73]. Even with surface dominant transport for a 3D TI, the deviation of the surface state’s dispersion from the ideal linear shape results in a nontrivial Berry phase between 0 and π, e.g. 0.44π in Bi2Te2Se [Citation74,Citation75]. Another effective means of tuning the Berry phase in a 3D TI is magnetic doping. After magnetic ion doping, the spin texture of the topological surface states changes to a hedgehog-like spin texture, e.g. in magnetic-ion- doped Bi2Se3, the surface states were gapped due to the ferromagnetic ordering, and the spin texture became hedgehog-like [Citation76]. The Berry phase in such a magnetic doped topological insulator is defined based on the spin texture of the surface state Fermi surface, which, in this situation, can be tuned from π to 0 via shifting the Fermi level to the Dirac point [Citation76–79]. The ferromagnetic state in a topological insulator is very useful, because it enables the novel quantum anomalous Hall effect [Citation80], paving the way to dissipationless electronic conductance at zero magnetic field. Moreover, the tuning of the Berry phase to zero in a ferromagnetic TI also provides the conditions for axion dynamics [Citation76,Citation81]. Ferromagnetic ordering has been reported in 3d transition-metal-doped topological insulators, e.g. Mn:Bi2Te3 [Citation82,Citation83], Cr:TlBiTe2 [Citation84], and Cr: Bi2Se3 [Citation85].
Dirac fermions also exist in the 3D bulk states of materials, namely, 3D Dirac semimetals. An important example of a Dirac semimetal is Cd3As2, the transport properties of which have been reported by L.P. He et al [Citation86]. In , the oscillatory components ΔRxx and ΔRxy are plotted together at the lowest temperature T = 1.5 K. There are two clear features. First, the ΔRxy oscillations are phase-shifted by approximately 90° with respect to the ΔRxx oscillations for the low Landau levels, as expected. Secondly, no Landau level splitting is observed in the field range (n ≥ 5). is the Landau index plot, showing 1/B versus n for ΔRxx. The integer indices were assigned to the ΔRxx valley positions in 1/B and the half integer indices to the ΔRxx peak positions. According to the Lifshitz-Onsager quantization rule, the Landau index n is linearly dependent on 1/B. 2πβ is the Berry’s phase, and 2πδ is an additional phase shift resulting from the curvature of the Fermi surface in the third direction. δ changes from 0 for a quasi-2D cylindrical Fermi surface to 1/8 for a corrugated 3D Fermi surface. The data points in fall into a very straight line, and the linear extrapolation gives an intercept of 0.58. The authors also measured another Cd3As2 single crystal with less pronounced SdH oscillations, and the linear extrapolation gave nearly the same intercept of 0.56, as shown in . In the trivial parabolic dispersion case such as that involving conventional metals, the Berry’s phase 2πβ should be zero. For Dirac systems with linear dispersion, there should be a nontrivial π Berry’s phase (β = ½). The intercept 0.58 obtained in clearly reveals the π Berry’s phase, and thus provides strong evidence for the existence of Dirac fermions in Cd3As2. This π Berry’s phase has been clearly observed in 2D graphene and in bulk SrMnBi2, in which highly anisotropic Dirac fermions reside in the 2D Bi square net. The bulk Rashba semiconductor BiTeI also possesses a Dirac point and provides an alternative path to realizing the nontrivial π Berry’s phase, which was indeed experimentally detected [Citation87].
Figure 7. (a) The longitudinal resistivity of a Cd3As2 single crystal in zero magnetic field, with current in the (112) plane. A typical X-ray rocking curve of the (224) Bragg peak is shown in the inset. (b) The Hall resistance Rxy at 200, 100, 50, and 1.5 K. There are clear oscillations of Rxy at 1.5 K, as seen in the inset. (c) The Shubinikov – de Haas oscillations of longitudinal magnetoresistance (MR) at various temperatures, with the field perpendicular to the (112) planes. At 280 K, the MR is roughly linear without saturation, as high as 200% at B = 14.5 T. At 1.5 K, the oscillations appear at a field as low as 2 T, reflecting the high mobility of charge carriers in Cd3As2. (d) The high-field oscillatory components ΔRxx and ΔRxy at 1.5 K. The ΔRxy oscillations are phase shifted by approximately 90° with respect to the ΔRxx oscillations for the low Landau levels. No Landau level splitting is observed in the field range. (e) Landau index n plotted against 1/B. The closed circles denote the integer index (ΔRxx valley), and the open circles indicate the half integer index (ΔRxx peak). The index plot can be linearly fitted, giving an intercept of 0.58. The measurements of another single crystal labeled as sample B give a similar intercept of 0.56. From the inset, both intercepts of ΔRxx lie between 1/2 and 5/8, which is strong evidence for a nontrivial π Berry’s phase of 3D Dirac fermions in Cd3As2 [Citation86].
![Figure 7. (a) The longitudinal resistivity of a Cd3As2 single crystal in zero magnetic field, with current in the (112) plane. A typical X-ray rocking curve of the (224) Bragg peak is shown in the inset. (b) The Hall resistance Rxy at 200, 100, 50, and 1.5 K. There are clear oscillations of Rxy at 1.5 K, as seen in the inset. (c) The Shubinikov – de Haas oscillations of longitudinal magnetoresistance (MR) at various temperatures, with the field perpendicular to the (112) planes. At 280 K, the MR is roughly linear without saturation, as high as 200% at B = 14.5 T. At 1.5 K, the oscillations appear at a field as low as 2 T, reflecting the high mobility of charge carriers in Cd3As2. (d) The high-field oscillatory components ΔRxx and ΔRxy at 1.5 K. The ΔRxy oscillations are phase shifted by approximately 90° with respect to the ΔRxx oscillations for the low Landau levels. No Landau level splitting is observed in the field range. (e) Landau index n plotted against 1/B. The closed circles denote the integer index (ΔRxx valley), and the open circles indicate the half integer index (ΔRxx peak). The index plot can be linearly fitted, giving an intercept of 0.58. The measurements of another single crystal labeled as sample B give a similar intercept of 0.56. From the inset, both intercepts of ΔRxx lie between 1/2 and 5/8, which is strong evidence for a nontrivial π Berry’s phase of 3D Dirac fermions in Cd3As2 [Citation86].](/cms/asset/6eafdde4-cd33-4858-a3e8-66a6951888bf/tapx_a_2064230_f0007_oc.jpg)
3 Berry phase in weyl systems
Weyl semimetals evolve from Dirac semimetals in the presence of broken time-reversal symmetry (TRS) or space-inversion symmetry. The Weyl semimetal (WSM) phases in TaAs-class materials [Citation88–94] and WTe2 [Citation95,Citation96] are due to the loss of space inversion symmetry. For time reversal symmetry (TRS)-breaking Weyl semimetals, the breakthroughs have been mainly on Co3Sn2S2 [Citation97–103] and Co2MnGa [Citation104–108]. Here, we have chosen the quantum oscillations in TaAs and Co3Sn2S2 as examples to discuss the experimental observations on transport properties related to Weyl fermions. The transport behavior of TaAs reported by X. Huang et al. is shown in [Citation89]. displays the magnetic field dependence of the Hall resistivity ρxy in the temperature range from 2 to 300 K. As shown in the left inset of , at low temperatures, the negative slope in high magnetic fields indicates that electrons mainly dominate the transport processes. The Hall resistivity near 0 T presents nonlinear behavior. The Hall coefficient changes sign from negative to positive at higher temperatures, however, implying that the electron-dominated conduction mechanism transforms to a hole-type mechanism. The transition temperature as shown in is about 100 K. At this temperature, remarkably, the nonlinear feature of ρxy extends to a high field, where both the Hall resistivity and its slope change their signs, signaling the possibility of the coexistence of high-mobility electrons with low mobility holes. The carrier properties can be obtained by fitting the experimental data on the longitudinal conductivity σxx and Hall conductivity σxy with a two-carrier model.
Figure 8. Temperature dependence of the Hall resistivity and resistivity for TaAs. (a) The Hall resistivity measured at various temperatures from 2 to 300 K. The lower-left and the upper-right insets show the Hall resistivity at 2 and 300 K, respectively. The obvious SdH oscillations demonstrate the high quality of the sample. (b) The Hall resistivity at T = 90, 100, 120, and 150 K. (c) Temperature dependence of the carrier mobility μe and μh of electrons and holes deduced by the two-carrier model. Main panel: Fitting with σxy; inset: fitting with σxx. (d) Magnetic field dependence of the resistivity with θ = 0° at representative temperatures. (e) Main panel: Oscillatory components of ρxx at 1.8 K, obtained by subtracting the ρxx at 20 K. The open circles are the experimental data, and the red line is the best fit based on two oscillatory frequency components. Upper inset: The two frequency components extracted from the raw oscillation patterns in the main panel. Lower inset: Landau-level index plots of 1/B versus n for different oscillation frequencies. (f) The temperature dependence of the resistivity in a magnetic field perpendicular to the electric current. The red arrow indicates that the resistivity peak moves to high temperatures under higher magnetic fields. The inset gives the measurement configuration and zooms in on the case of 0 T [Citation89].
![Figure 8. Temperature dependence of the Hall resistivity and resistivity for TaAs. (a) The Hall resistivity measured at various temperatures from 2 to 300 K. The lower-left and the upper-right insets show the Hall resistivity at 2 and 300 K, respectively. The obvious SdH oscillations demonstrate the high quality of the sample. (b) The Hall resistivity at T = 90, 100, 120, and 150 K. (c) Temperature dependence of the carrier mobility μe and μh of electrons and holes deduced by the two-carrier model. Main panel: Fitting with σxy; inset: fitting with σxx. (d) Magnetic field dependence of the resistivity with θ = 0° at representative temperatures. (e) Main panel: Oscillatory components of ρxx at 1.8 K, obtained by subtracting the ρxx at 20 K. The open circles are the experimental data, and the red line is the best fit based on two oscillatory frequency components. Upper inset: The two frequency components extracted from the raw oscillation patterns in the main panel. Lower inset: Landau-level index plots of 1/B versus n for different oscillation frequencies. (f) The temperature dependence of the resistivity in a magnetic field perpendicular to the electric current. The red arrow indicates that the resistivity peak moves to high temperatures under higher magnetic fields. The inset gives the measurement configuration and zooms in on the case of 0 T [Citation89].](/cms/asset/8e81bd63-1e8d-4a46-9b10-6955632d4627/tapx_a_2064230_f0008_oc.jpg)
From the processing of the SdH oscillation data, the authors extracted the quantum oscillations by subtracting the MR data at 20 K from those at 1.8 K, as shown in ). The oscillatory spectrum is quite complex because of the contribution from several subbands, which is consistent with the band structure calculations. In order to get more reliable information on the oscillation phase factor, the authors tried to fit the data using an expression for the Lifshitz-Kosevich (LK) formula. Using the LK formula, the experimental data on Δρxx were well fitted by two oscillatory frequency components at 16 T and 7 T. The upper inset in ) plots the two components extracted from the raw oscillation patterns. The Berry phase can be estimated from the Landau index plots. The linear extrapolations of the Landau level index n versus 1/B yields the values of γ − δ to be around zero (for α = 16 T) and 0.96 (β = 7 T), respectively, which give strong evidence for the presence of nontrivial π Berry phases arising from 3D Weyl electrons.
The quantum oscillation study of Co3Sn2S2 by L. Ding et al [Citation109]. is representative of the quantum transport properties in a magnetic Weyl semimetal. ) and (e) displays the temperature dependence of the magnetoresistance under high magnetic field along the z-axis and y-axis. The SdH oscillations were studied with magnetic field exceeding 20 T. A plateau in magnetoresistance appears around 20 T when the magnetic field is parallel to the y-axis. When the magnetic field is parallel to the xy-plane, the saturation field for magnetization is about 23 T. Therefore, the resistivity plateau is concomitant with the field induced rotation of the magnetic moments from the z-axis to the xy-plane. As shown in ) and (f), the SdH oscillations become clearly visible after subtracting a polynomial background from the data. ) and (g) present the fast Fourier transform (FFT) spectra of the oscillating component, Δρ, at different temperatures. Some of the broad asymmetric peaks in the FFT spectrum, such as the peak around 430 T for H ∥ y are caused by the superposition of multiple peaks. The evolution of these peaks at different temperatures is shown in the inset of ).
Figure 9. Quantum oscillation study of Co3Sn2S2. (a, e) Magnetoresistance as a function of the magnetic field μ0H at different temperatures for H ∥ z-axis and H ∥ y-axis, respectively. (b, f) The oscillatory part of the resistivity Δρ for H ∥ z-axis and H ∥ y-axis, respectively. (c, g) Fast Fourier transform spectra at various temperatures. The inset shows the multi-peak fitting used to distinguish between superposed frequencies. (d, h) The LK fitting with the effective masses [Citation109].
![Figure 9. Quantum oscillation study of Co3Sn2S2. (a, e) Magnetoresistance as a function of the magnetic field μ0H at different temperatures for H ∥ z-axis and H ∥ y-axis, respectively. (b, f) The oscillatory part of the resistivity Δρ for H ∥ z-axis and H ∥ y-axis, respectively. (c, g) Fast Fourier transform spectra at various temperatures. The inset shows the multi-peak fitting used to distinguish between superposed frequencies. (d, h) The LK fitting with the effective masses [Citation109].](/cms/asset/7aacdd6f-4a03-4084-9282-6c96b80adebe/tapx_a_2064230_f0009_oc.jpg)
4 Berry phase in other topological materials
In Dirac semimetals, the bulk valence and conduction bands undergo linear band crossings at fourfold degenerate Dirac points protected by time reversal symmetry, inversion symmetry (IS), and crystal symmetry. By breaking either TRS or IS, each Dirac point can be broken into a pair of doubly degenerate Weyl points, accompanied by a surface Fermi arc. Beyond those studies on Dirac or Weyl fermions, topological nodal line semimetals (TNLSM) have also been proposed, where the bands cross along one-dimensional closed lines in k space instead of discrete points. One of the most studied TNLSM systems is the ZrSiS family, where Zr sites can be Zr or Hf, Si = Si/Ge/Sn, and S = S/Se/Te [Citation110–114]. Here, we introduce a transport study of ZrSiS by R. Singha et al [Citation115]. to demonstrate the nontrivial Berry phase related to topological nodal-line fermions.
In , the oscillation patterns for the two different components, are plotted as functions of 1/B at several representative temperatures. Because the oscillation peaks are very sharp and the field interval used in the measurements is not too small compared with the peak width, some fluctuations in the intensity can be observed in . The fast Fourier transform (FFT) analysis of the oscillatory components reveals oscillation frequencies of 14 T and 238 T. In an external magnetic field, a closed orbit is quantized following the Lifshitz–Onsager quantization rule, taking account of Berry’s phase, which is a phase shift determined by the dimensionality, having values of 0 and ±1/8 for the 2D and the 3D cases, respectively. The nature of the electronic band dispersion is determined by the value of the Berry phase, which is 0 for the conventional metals with parabolic band dispersions and π for the Dirac/Weyl-type electronic system with linear band dispersions. The Berry phase is extracted from the intercept of the x-axis (along which the Landau-level index n has been plotted) in the Landau-level fan diagram and takes on a value in the range of −1/8 to +1/8 for 3D Dirac fermions. In , the Landau-level fan diagram for the larger Fermi pocket in ZrSiS is plotted, with maxima of the SdH oscillation assigned as integers (n) and minima as half-integers (n + 1/2). Extrapolated linear fitting gives an intercept of 0.15(3). The sharp, symmetric, and well-separated oscillation peaks over a wide range (n = 27–53) and traceable down to 4 T imply that there is no significant error in determining the value of the intercept from the linear n vs. 1/B fit. On the other hand, with a higher magnetic field to achieve lower Landau levels, nonlinearity in the index plot may arise due to the Zeeman splitting of oscillation peaks, as observed for the 14 T frequency and discussed below. Similar to that observed for the 238 T frequency, a small intercept of −0.01 is obtained for the 14 T frequency. For both the Fermi pockets, the intercepts are very close to the range of ±1/8. For the smaller frequency, the experimental peak positions are seen to deviate slightly from a straight line, which can be attributed to the Zeeman splitting of the Landau levels. Furthermore, the authors calculated the Berry phase from the SdH oscillations at different angles (up to 20°) and did not find any significant change. Finding a reasonably accurate value of the Berry phase for higher angles is much more complicated due to the presence of multiple oscillation frequencies.
Figure 10. (A and B) SdH oscillations obtained by subtracting the smooth background from the MR measurements, plotted against inverse magnetic field (1/B) at different temperatures for the two deconvoluted components. The A and B insets show the corresponding FFT results. (C) The angular dependence of oscillation frequencies. For clarity, FFT results for different angles are shifted vertically. A schematic diagram of the experimental setup is shown in the inset. (D) Temperature dependence of the relative amplitude of SdH oscillations for both the Fermi pockets. (E) Landau-level index plot for the 238 T frequency oscillation, with the arrow showing the value of the y-axis intercept. The inset shows the x-axis intercept for the extrapolated linear fitting [Citation115].
![Figure 10. (A and B) SdH oscillations obtained by subtracting the smooth background from the MR measurements, plotted against inverse magnetic field (1/B) at different temperatures for the two deconvoluted components. The A and B insets show the corresponding FFT results. (C) The angular dependence of oscillation frequencies. For clarity, FFT results for different angles are shifted vertically. A schematic diagram of the experimental setup is shown in the inset. (D) Temperature dependence of the relative amplitude of SdH oscillations for both the Fermi pockets. (E) Landau-level index plot for the 238 T frequency oscillation, with the arrow showing the value of the y-axis intercept. The inset shows the x-axis intercept for the extrapolated linear fitting [Citation115].](/cms/asset/b64e096f-4148-4fa2-bf6d-82613641ebc4/tapx_a_2064230_f0010_oc.jpg)
The magnetic topological semimetals are also very important, due to the breaking of TRS. J. Y. Liu et al [Citation116]. reported a nontrivial topological state in a magnetic semimetal candidate, Sr1-yMn1-zSb2. To seek further evidence for relativistic fermions in Sr1-yMn1-zSb2, the Berry phase was accumulated along cyclotron orbits. For a Dirac/Weyl system, pseudo-spin rotation under a magnetic field should result in a non-trivial Berry phase, which can be accessed from the Landau level index fan diagram or a direct fit of the SdH/dHvA oscillation pattern to the LK formula. For a 2D or quasi-2D system with relativistic fermions, the intercept n0 on the n axis of the LL fan diagram is expected to be 1/2, for which the corresponding Berry phase is π. In , the authors present the LL fan diagram established using the oscillatory conductivity data (), which was obtained by subtracting the background from the conductivity (). Magnetic topological semimetals have also been reported among rare-earth related materials [Citation117,Citation118].
Figure 11. Non-trivial Berry phase of topological fermions in Sr1-yMn1-zSb2. a, The in-plane longitudinal and transverse (Hall) resistivities as functions of magnetic field measured at 2 K on a similar sample, A4; both ρxx and ρxy show strong SdH oscillations. b, The in-plane conductivity converted from the ρxx and ρxy data. c, The in-plane oscillatory conductivity Δσxx versus 1/B at 2 K. d, The Landau Level (LL) index fan diagram derived from the oscillatory conductivity at 2 K of sample A4. The integer LL indices (n) are assigned to the minima of Δσxx. The intercept n0 on the n axis obtained from the extrapolation of the best linear fit in the fan diagram is at n = 0.55 ± 0.02, suggesting that the π Berry phase has accumulated in the cyclotron orbits. e, FFT spectrum of the in-plane conductivity σxx at 2 K for sample A4. f, Fit of the dHvA oscillation pattern at 2 K to the LK formula (see the Methods) for sample C1, from which non-trivial Berry phases were also obtained [Citation116].
![Figure 11. Non-trivial Berry phase of topological fermions in Sr1-yMn1-zSb2. a, The in-plane longitudinal and transverse (Hall) resistivities as functions of magnetic field measured at 2 K on a similar sample, A4; both ρxx and ρxy show strong SdH oscillations. b, The in-plane conductivity converted from the ρxx and ρxy data. c, The in-plane oscillatory conductivity Δσxx versus 1/B at 2 K. d, The Landau Level (LL) index fan diagram derived from the oscillatory conductivity at 2 K of sample A4. The integer LL indices (n) are assigned to the minima of Δσxx. The intercept n0 on the n axis obtained from the extrapolation of the best linear fit in the fan diagram is at n = 0.55 ± 0.02, suggesting that the π Berry phase has accumulated in the cyclotron orbits. e, FFT spectrum of the in-plane conductivity σxx at 2 K for sample A4. f, Fit of the dHvA oscillation pattern at 2 K to the LK formula (see the Methods) for sample C1, from which non-trivial Berry phases were also obtained [Citation116].](/cms/asset/04746f94-8c67-47b1-9d63-d6427ae0013e/tapx_a_2064230_f0011_oc.jpg)
5 Future directions and prospects
The Berry phase in topological materials shows surprisingly attraction, especially in new material systems that have appeared in the last several years. As one of the most important pieces of evidence relating to the band topology, quantum oscillation studies are drawing increasing attention in condensed matter physics and materials science. The Berry phase in quantum oscillations can be employed as a method for exploring the band topology of a material, especially in rare earth compounds or tight-bonded compounds, in which density functional theory (DFT) calculations or ARPES experiments have more difficulties. Based on the crystallography, quality, and sample size, one can always choose magnetization, magnetic torque, magnetotransport measurements, or even local magnetotransport measurements in STM to identify the Berry phase. The nontrivial Berry phase is critical for several effects, such as the quantum anomalous Hall effect, axion electrodynamics, and quantum computation.
Acknowledgments
The authors acknowledge support from the Australian Research Council (ARC) through the ARC Centre of Excellence in Future Low-Energy Electronics Technologies (FLEET, CE170100039).
Disclosure statement
No potential conflict of interest was reported by the author(s).
Additional information
Funding
References
- Berry MV. Quantal phase factors accompanying adiabatic changes, proceedings of the royal society of London. A Math Phys Sci. 1984;392:45–27.
- Zak J. Berry’s phase for energy bands in solids. Phys Rev Lett. 1989;62:2747.
- Mikitik G, Sharlai YV. Manifestation of Berry’s phase in metal physics. Phys Rev Lett. 1999;82:2147.
- Shubnikov L, de Haas W. Leiden Commun. 207a (1930). Proc Netherlands R Acad Sci. 1930;33:130–163.
- De Haas W, Van Alphen P. The dependence of the susceptibility of diamagnetic metals upon the field, Proc. Netherlands Roy Acad Sci. 1930;33:1106–1118.
- Shoenberg D. Magnetic oscillations in metals. New York: Cambridge University Press; 2009.
- Pippard AB, Pippard PAB. Magnetoresistance in metals. Cambridge: Cambridge University Press; 1989.
- Kane CL, Mele EJ. Quantum spin Hall effect in graphene. Phys Rev Lett. 2005;95:226801.
- Fu L, Kane CL, Mele EJ. Topological insulators in three dimensions. Phys Rev Lett. 2007;98:106803.
- Moore JE, Balents L. Topological invariants of time-reversal-invariant band structures. Phys Rev B. 2007;75:121306.
- Fu L, Kane CL. Topological insulators with inversion symmetry. Phys Rev B. 2007;76:045302.
- Teo JCY, Fu L, Kane CL. Surface states and topological invariants in three-dimensional topological insulators: application to Bi1-xSbx. Phys Rev B. 2008;78. 10.1103/PhysRevB.78.045426
- Xia Y, Qian D, Hsieh D, et al. Observation of a large-gap topological-insulator class with a single Dirac cone on the surface. Nat Phys. 2009;5:398–402.
- Hsieh D, Xia Y, Qian D, et al. Observation of time-reversal-protected single-dirac-cone topological-insulator states in Bi2Te3 and Sb2Te3. Phys Rev Lett. 2009;103:146401.
- Fu L. Topological crystalline insulators. Phys Rev Lett. 2011;106:106802.
- Hsieh TH, Lin H, Liu J, et al. Topological crystalline insulators in the SnTe material class. Nat Commun. 2012;3:1–7.
- Tanaka Y, Ren Z, Sato T, et al. Experimental realization of a topological crystalline insulator in SnTe. Nat Phys. 2012;8:800–803.
- Dziawa P, Kowalski B, Dybko K, et al. Topological crystalline insulator states in Pb1−xSnxSe. Nat Mater. 2012;11:1023–1027.
- Wang Z, Alexandradinata A, Cava RJ, et al. Hourglass fermions. Nature. 2016;532:189–194.
- Ma J, Yi C, Lv B, et al. Experimental evidence of hourglass fermion in the candidate nonsymmorphic topological insulator KHgSb. Sci Adv. 2017;3:e1602415.
- Wieder BJ, Bradlyn B, Wang Z, et al. Wallpaper fermions and the nonsymmorphic Dirac insulator. Science. 2018;361:246–251.
- Wan X, Turner AM, Vishwanath A, et al. Topological semimetal and Fermi-arc surface states in the electronic structure of pyrochlore iridates. Phys Rev B. 2011;83:205101.
- Xu G, Weng H, Wang Z, et al. Chern semimetal and the quantized anomalous Hall effect in HgCr2Se4. Phys Rev Lett. 2011;107:186806.
- Wang Z, Sun Y, Chen X-Q, et al. Dirac semimetal and topological phase transitions in A3Bi (A= Na, K, Rb). Phys Rev B. 2012;85:195320.
- Wang Z, Weng H, Wu Q, et al. Three-dimensional Dirac semimetal and quantum transport in Cd3As2. Phys Rev B. 2013;88:125427.
- Liu Z, Zhou B, Zhang Y, et al. Discovery of a three-dimensional topological Dirac semimetal, Na3Bi. Science. 2014;343:864–867.
- Liu Z, Jiang J, Zhou B, et al. A stable three-dimensional topological Dirac semimetal Cd3As2. Nat Mater. 2014;13:677–681.
- Weng H, Fang C, Fang Z, et al. Weyl semimetal phase in noncentrosymmetric transition-metal monophosphides. Phys Rev X. 2015;5:011029.
- Lv B, Weng H, Fu B, et al. Experimental discovery of Weyl semimetal TaAs. Phys Rev X. 2015;5:031013.
- Lv B, Xu N, Weng H, et al. Observation of Weyl nodes in TaAs. Nat Phys. 2015;11:724–727.
- Lv B, Muff S, Qian T, et al. Observation of Fermi-arc spin texture in TaAs. Phys Rev Lett. 2015;115:217601.
- Soluyanov AA, Gresch D, Wang Z, et al. Type-II Weyl semimetals. Nature. 2015;527:495–498.
- Deng K, Wan G, Deng P, et al. Experimental observation of topological Fermi arcs in type-II Weyl semimetal MoTe2. Nat Phys. 2016;12:1105–1110.
- Weng H, Dai X, Fang Z. Topological semimetals predicted from first-principles calculations. J Phys. 2016;28:303001.
- Wieder BJ, Kim Y, Rappe A, et al. Double Dirac semimetals in three dimensions. Phys Rev Lett. 2016;116:186402.
- Bradlyn B, Cano J, Wang Z, et al. Beyond Dirac and Weyl fermions: unconventional quasiparticles in conventional crystals. Science. 2016;353:aaf5037.
- Weng H, Fang C, Fang Z, et al. Topological semimetals with triply degenerate nodal points in θ-phase tantalum nitride. Phys Rev B. 2016;93:241202.
- Zhu Z, Winkler GW, Wu Q, et al. Triple point topological metals. Phys Rev X. 2016;6:031003.
- Weng H, Fang C, Fang Z, et al. Coexistence of Weyl fermion and massless triply degenerate nodal points. Phys Rev B. 2016;94:165201.
- Huang H, Liu J, Vanderbilt D, et al. Topological nodal-line semimetals in alkaline-earth stannides, germanides, and silicides. Phys Rev B. 2016;93:201114.
- Hosen MM, Dimitri K, Belopolski I, et al. Tunability of the topological nodal-line semimetal phase in ZrSi X-type materials (X= S, Se, Te). Phys Rev B. 2017;95:161101.
- Xu Q, Yu R, Fang Z, et al. Topological nodal line semimetals in the CaP3 family of materials. Phys Rev B. 2017;95:045136.
- Yu R, Fang Z, Dai X, et al. Topological nodal line semimetals predicted from first-principles calculations. Front Phys. 2017;12:127202.
- Wang J-T, Chen C, Kawazoe Y. Topological nodal line semimetal in an orthorhombic graphene network structure. Phys Rev B. 2018;97:245147.
- Gu C, Hu J, Chen X, et al. Experimental evidence of crystal symmetry protection for the topological nodal line semimetal state in ZrSiS. Phys Rev B. 2019;100:205124.
- Emmanouilidou E, Shen B, Deng X, et al. Magnetotransport properties of the single-crystalline nodal-line semimetal candidates CaTX (T= Ag, Cd; X= As, Ge). Phys Rev B. 2017;95:245113.
- Hu J, Tang Z, Liu J, et al. Evidence of topological nodal-line fermions in ZrSiSe and ZrSiTe. Phys Rev Lett. 2016;117:016602.
- Bian G, Chang T-R, Sankar R, et al. Topological nodal-line fermions in spin-orbit metal PbTaSe2. Nat Commun. 2016;7:1–8.
- Novoselov KS, Geim AK, Morozov SV, et al. Electric field effect in atomically thin carbon films. Science. 2004;306:666–669.
- Luk’yanchuk IA, Kopelevich Y. Phase analysis of quantum oscillations in graphite. Phys Rev Lett. 2004;93:166402.
- Zhang YB, Tan YW, Stormer HL, et al. Experimental observation of the quantum Hall effect and Berry’s phase in graphene. Nature. 2005;438:201–204.
- Fang Z, Nagaosa N, Takahashi KS, et al. The anomalous Hall effect and magnetic monopoles in momentum space. Science. 2003;302:92–95.
- Ando T, Nakanishi T, Saito R. Berry’s phase and absence of back scattering in carbon nanotubes. J Phys Soc Jpn. 1998;67:2857–2862.
- McEuen PL, Bockrath M, Cobden DH, et al. Disorder, pseudospins, and backscattering in carbon nanotubes. Phys Rev Lett. 1999;83:5098.
- Novoselov KS, Geim AK, Morozov SV, et al. Two-dimensional gas of massless Dirac fermions in graphene. Nature. 2005;438:197–200.
- Ren Y-N, Zhang M-H, Yan C, et al. Local measurements of tunneling magneto-conductance oscillations in monolayer, Bernal-stacked bilayer, and ABC-stacked trilayer graphene. Sci China Phys Mech Astron. 2021;64:1–6.
- Dutreix C, Gonzalez-Herrero H, Brihuega I, et al. Measuring the Berry phase of graphene from wavefront dislocations in Friedel oscillations. Nature. 2019;574:219–222.
- Zhang Y, Su Y, He L. Local berry phase signatures of bilayer graphene in intervalley quantum interference. Phys Rev Lett. 2020;125:116804.
- Mesaros A, Sadri D, Zaanen J. Berry phase of dislocations in graphene and valley conserving decoherence. Phys Rev B. 2009;79:155111.
- Wright AR, McKenzie RH. Quantum oscillations and Berry’s phase in topological insulator surface states with broken particle-hole symmetry. Phys Rev B. 2013;87:085411.
- Bennaceur K, Guillemette J, Levesque PL, et al. Measurement of topological Berry phase in highly disordered graphene. Phys Rev B. 2015;92:125410.
- Kuntsevich AY, Shupletsov AV, Minkov GM. Simple mechanisms that impede the Berry phase identification from magneto-oscillations. Phys Rev B. 2018;97:195431.
- Datta B, Adak PC, Shi LK, et al. Nontrivial quantum oscillation geometric phase shift in a trivial band. Sci Adv. 2019;5:eaax6550.
- Zhang H, Liu C-X, Qi X-L, et al. Topological insulators in Bi2Se3, Bi2Te3 and Sb2Te3 with a single Dirac cone on the surface. Nat Phys. 2009;5:438–442.
- Chen Y, Analytis JG, Chu J-H, et al. Experimental realization of a three-dimensional topological insulator, Bi2Te3. Science. 2009;325:178–181.
- Xiong J, Luo Y, Khoo Y, et al. High-field Shubnikov–de Haas oscillations in the topological insulator Bi2Te2Se. Phys Rev B. 2012;86:045314.
- Xiang F-X, Wang X-L, Veldhorst M, et al. Observation of topological transition of Fermi surface from a spindle torus to a torus in bulk Rashba spin-split BiTeCl. Phys Rev B. 2015;92:035123.
- Zhao W, Cortie D, Chen L, et al. Quantum oscillations in iron-doped single crystals of the topological insulator Sb2Te3. Phys Rev B. 2019;99:165133.
- Qu D-X, Hor YS, Xiong J, et al. Quantum oscillations and Hall anomaly of surface states in the topological insulator Bi2Te3. Science. 2010;329:821–824.
- Almoalem A, Silber I, Sandik S, et al. Link between superconductivity and a Lifshitz transition in intercalated Bi2Se3. Phys Rev B. 2021;103:174518.
- Liu Z, Yao X, Shao J, et al. Superconductivity with topological surface state in SrxBi2Se3. J Am Chem Soc. 2015;137:10512–10515.
- Kuntsevich AY, Shupletsov A, Minkov G. Simple mechanisms that impede the Berry phase identification from magneto-oscillations. Phys Rev B. 2018;97:195431. 10.1103/PhysRevB.97.195431.
- Busch M, Chiatti O, Pezzini S, et al. High-temperature quantum oscillations of the Hall resistance in bulk Bi2Se3. Sci Rep. 2018;8:1–8.
- Taskin A, Ando Y. Berry phase of nonideal Dirac fermions in topological insulators. Phys Rev B. 2011;84:035301.
- Ren Z, Taskin A, Sasaki S, et al. Large bulk resistivity and surface quantum oscillations in the topological insulator Bi2Te2Se. Phys Rev B. 2010;82:241306.
- Xu S-Y, Neupane M, Liu C, et al. Hedgehog spin texture and Berry’s phase tuning in a magnetic topological insulator. Nat Phys. 2012;8:616–622.
- Lu H-Z, Shi J, Shen S-Q. Competition between weak localization and antilocalization in topological surface states. Phys Rev Lett. 2011;107:076801.
- Zhao W, Chen L, Yue Z, et al. Quantum oscillations of robust topological surface states up to 50 K in thick bulk-insulating topological insulator. Npj Quant Mater. 2019;4:1–6.
- Zhao W, Trang CX, Li Q, et al. Massive Dirac fermions and strong Shubnikov–de Haas oscillations in single crystals of the topological insulator Bi2Se5 doped with Sm and Fe. Phys Rev B. 2021;104:085153.
- Chang C-Z, Zhang J, Feng X, et al. Experimental observation of the quantum anomalous Hall effect in a magnetic topological insulator. Science. 2013;340:167–170.
- Essin AM, Moore JE, Vanderbilt D. Magnetoelectric polarizability and axion electrodynamics in crystalline insulators. Phys Rev Lett. 2009;102:146805.
- Hor Y, Roushan P, Beidenkopf H, et al. Development of ferromagnetism in the doped topological insulator Bi2−xMnxTe3. Phys Rev B. 2010;81:195203.
- Checkelsky JG, Ye J, Onose Y, et al. Dirac-fermion-mediated ferromagnetism in a topological insulator. Nat Phys. 2012;8:729–733.
- Wang Z, Segawa K, Sasaki S, et al. Ferromagnetism in Cr-doped topological insulator TlSbTe2. APL Mater. 2015;3:083302.
- Haazen P, Laloë J-B, Nummy T, et al. Ferromagnetism in thin-film Cr-doped topological insulator Bi2Se3. Appl Phys Lett. 2012;100:082404.
- He L, Hong X, Dong J, et al. Quantum transport evidence for the three-dimensional Dirac semimetal phase in Cd3As2. Phys Rev Lett. 2014;113:246402.
- Murakawa H, Bahramy MS, Tokunaga M, et al. Detection of Berry’s Phase in a Bulk Rashba Semiconductor. Science. 2013;342:1490–1493.
- Huang SM, Xu SY, Belopolski I, et al. A Weyl Fermion semimetal with surface Fermi arcs in the transition metal monopnictide TaAs class. Nat Commun. 2015;6:1–6.
- Huang XC, Zhao LX, Long YJ, et al. Observation of the Chiral-Anomaly-Induced Negative Magnetoresistance in 3D Weyl Semimetal TaAs. Phys Rev X. 2015;5:031023.
- Lv BQ, Weng HM, Fu BB, et al. Experimental discovery of Weyl Semimetal TaAs. Phys Rev X. 2015;5:031013. 10.1103/PhysRevX.5.031013.
- Weng HM, Fang C, Fang Z, et al. Weyl semimetal phase in noncentrosymmetric transition-metal monophosphides. Phys Rev X. 2015;5:011029. 10.1103/PhysRevX.5.011029.
- Xu SY, Belopolski I, Alidoust N, et al. Discovery of a Weyl fermion semimetal and topological Fermi arcs. Science. 2015;349:613–617.
- Lv BQ, Xu N, Weng HM, et al. Observation of Weyl nodes in TaAs. Nat Phys. 2015;11:724–727. 10.1038/nphys3426.
- Yang LX, Liu ZK, Sun Y, et al. Weyl semimetal phase in the non-centrosymmetric compound TaAs. Nat Phys. 2015;11:728–732.
- Soluyanov AA, Gresch D, Wang ZJ, et al. Type-II Weyl semimetals. Nature. 2015;527:495–498. 10.1038/nature15768.
- Wu Y, Jo NH, Ochi M, et al. Temperature-Induced Lifshitz Transition in WTe2. Phys Rev Lett. 2015;115:166602.
- Li SH, Gu GX, Liu EK, et al. Epitaxial growth and transport properties of magnetic weyl semimetal Co3Sn2S2 thin films. ACS Appl Electron Mater. 2020;2:126–133.
- Shama RKG, Singh Y, Singh Y. Observation of planar Hall effect in the ferromagnetic Weyl semimetal Co3Sn2S2. J Magn Magn Mater. 2020;502:166547.
- Xu YS, Zhao JZ, Yi CJ, et al. Electronic correlations and flattened band in magnetic Weyl semimetal candidate Co3Sn2S2. Nat Commun. 2020;11:1–11.
- Xu QN, Liu EK, Shi WJ, et al. Topological surface Fermi arcs in the magnetic Weyl semimetal Co3Sn2S2. Phys Rev B. 2018;97:235416.
- Yang R, Zhang T, Zhou LQ, et al. Magnetization-Induced Band Shift in Ferromagnetic Weyl Semimetal Co3Sn2S2. Phys Rev Lett. 2020;124:077403.
- Morali N, Batabyal R, Nag PK, et al. Fermi-arc diversity on surface terminations of the magnetic Weyl semimetal Co3Sn2S2. Science. 2019;365:1286–1291.
- Liu C, Yi CJ, Wang XY, et al., Anisotropic magnetoelastic response in the magnetic Weyl semimetal Co3Sn2S2. Science China ‒ Physics Mechanics & Astronomy. 2021. 64:1–9.
- Sakai A, Mizuta YP, Nugroho AA, et al. Giant anomalous Nernst effect and quantum-critical scaling in a ferromagnetic semimetal. Nat Phys. 2018;14:1119–1124.
- Guin SN, Manna K, Noky J, et al. Anomalous Nernst effect beyond the magnetization scaling relation in the ferromagnetic Heusler compound Co2MnGa. Npg Asia Mater. 2019;11:1–9.
- Markou A, Kriegner D, Gayles J, et al. Thickness dependence of the anomalous Hall effect in thin films of the topological semimetal Co2MnGa. Phys Rev B. 2019;100:054422.
- Xu LC, Li XK, Ding LC, et al. Anomalous transverse response of Co2MnGa and universality of the room-temperature ratio alpha(A)(ij)/sigma(A)(ij) across topological magnets. Phys Rev B. 2020;101:180404.
- Belopolski I, Manna K, Sanchez DS, et al. Discovery of topological Weyl fermion lines and drumhead surface states in a room temperature magnet. Science. 2019;365:1278–1281.
- Ding L, Koo J, Yi C, et al. Quantum oscillations, magnetic breakdown and thermal Hall effect in Co3Sn2S2. J Phys D Appl Phys. 2021;54:454003.
- Klemenz S, Lei SM, Schoop LM. Topological semimetals in square-net materials. In: Clarke DR, editor. Annual review of materials research. 2019;49: 185–206.
- Kumar N, Manna K, Qi YP, et al. Unusual magnetotransport from Si-square nets in topological semimetal HfSiS. Phys Rev B. 2017;95:121109.
- Muechler L, Topp A, Queiroz R, et al. Modular arithmetic with nodal lines: drumhead surface states in ZrSiTe. Phys Rev X. 2020;10:011026.
- Guo L, Chen TW, Chen C, et al. Electronic transport evidence for topological nodal-line semimetals of ZrGeSe single crystals. ACS Appl Electron Mater. 2019;1:869–876.
- Cheng ZW, Zhang ZY, Sun HG, et al. Visualizing Dirac nodal-line band structure of topological semimetal ZrGeSe by ARPES. APL Mater. 2019;7:051105.
- Singha R, Pariari AK, Satpati B, et al., Large nonsaturating magnetoresistance and signature of nondegenerate Dirac nodes in ZrSiS, Proceedings of the National Academy of Sciences U.S.A., 114 (2017) 2468–2473.
- Liu J, Hu J, Zhang Q, et al. A magnetic topological semimetal Sr1−yMn1−zSb2 (y, z < 0.1). Nat Mater. 2017;16:905–910.
- Wu F, Guo C, Smidman M, et al. Anomalous quantum oscillations and evidence for a non-trivial Berry phase in SmSb. Npj Quant Mater. 2019;4:1–6.
- Fang Y, Tang F, Ruan YR, et al. Magnetic-field-induced nontrivial electronic state in the Kondo-lattice semimetal CeSb. Phys Rev B. 2020;101:094424.