
 ?Mathematical formulae have been encoded as MathML and are displayed in this HTML version using MathJax in order to improve their display. Uncheck the box to turn MathJax off. This feature requires Javascript. Click on a formula to zoom.
ABSTRACT
Since its first implementation in 2006, in fluorescence detected Fourier transform excitation spectroscopy of rubidium atoms, phase modulation is being increasingly used in nonlinear spectroscopy. Some of the important features of the technique are the excitation spectroscopy using signals that are relevant to photoactive devices (fluorescence and photocurrent), prospect of nonlinear spectroscopy of isolated systems such as single quantum dots or molecules, multidimensional spectroscopy, investigation of higher order recombination processes in semiconductors, etc. Although most of applications of phase modulated light fields have been on nonlinear spectroscopy in the perturbative regime, few efforts have been made recently to use it in the nonperturbative regime. In this review, we discuss the development of the technique since its inception, recent advances and future applications in strong field laser–matter interactions.
GRAPHICAL ABSTRACT
1. Historical background
Phase modulation is an important tool to isolate nonlinear contributions in action signals induced by ultrashort laser pulses. Today’s methods evolved from the investigation of wavepacket interferometry by detecting fluorescence induced by a pair of phase-locked femtosecond pulses done by Scherer et al. [Citation1,Citation2] in the 1990s. The method allowed one to set the phase of the vibronic wavepackets launched by spectrally broad pulses independently from the time-delays between the two pulses. The setup used interference of the two beams at a particular wavelength as the reference relative to which the signals from the interfering wavepackets were detected. Only in-phase signals were monitored in the initial experiments. Later, a phase-cycling of optical fields was implemented to select certain third order signals relevant for two-dimensional (2D) spectroscopy [Citation3]. These experiments measured fluorescence from rubidium atoms resulting from a three pulse excitation. The Fourier transform along the interpulse time delays provided the 2D spectra and the addition of the signals obtained from the different phase sequence allowed the selection of certain pathways. A sequence of 16 different inter-pulse phases was used to select the pathways that generate the photon-echo signals. The results showed that two electronic states with transition energies at 794.7 and 780 nm share the common ground state. In 2006, Tekavec et al. implemented a different scheme of wavepacket interferometry where the phase difference between two pulses was continually swept at a radiofrequency [Citation4]. This technique has been termed as phase modulation. The scheme, in essence, is equivalent to using a sequence of two pulses with slightly different offset frequencies to excite the system. As the phases of the wavepackets are defined by the laser pulses, their interference modulates the population of the excited state at the beat frequency and its harmonics, which is easily observed in coherent [Citation5] as well as incoherent signals [Citation6,Citation7]. Linear light–matter interactions produce modulation at the beat frequency while nonlinear interactions produce additional modulations at higher harmonics [Citation8]. The method was quickly extended to excitation using a four pulse sequence to acquire 2D spectra of atomic rubidium showing coupling between two electronic states [Citation9], as was observed by phase cycling previously [Citation3]. Another important advancement in the field was marked by the first measurements of conformation-dependent exciton coupling in a molecular dimer [Citation10].
Early on it had been realized that fluorescence is only one of the many incoherent action signals that could be used in multi-dimensional spectroscopy using phase modulation and phase cycling. Other useful signals are photoions, photocurrent and photoacoustics. These days, photocurrent detection scheme is considered to be particularly interesting as it enables a direct investigation of ultrafast processes that contribute to the functionality of photosensors and photovoltaic devices. The first proof-of-principle photocurrent detected 2D spectroscopy in 2013 [Citation11] has been quickly followed by its application in understanding the role of multiple exciton generation in quantum dots on external photocurrents [Citation12]. Although photocurrent detected 2D/nonlinear spectroscopy is a powerful and unique diagnostic tool to investigate the relationship between the electronic structure, dynamics and functionality of photoactive devices, recent results have indicated some limitations [Citation13]. The method is not suitable in systems where incoherent mixing of populations and their subsequent nonlinear relaxation dynamics are inherent. Some organo-halide perovskites have this limitation [Citation13–15]. Other new directions that are expected to immensely broaden the use of the technique in atomic, molecular and optical physics include photoion detected spectroscopy [Citation16–19], generation of phase modulated XUV pulse pairs [Citation20,Citation21], and separation of high order and cascaded nonlinear signals [Citation22,Citation23]. Apart from providing a clear picture of the relationship between electronic structure and functionality, nonlinear spectroscopy based on incoherent action signals have unique advantages that include spectroscopy with high spatial resolution – typically beyond the diffraction limit of optical fields [Citation16] and even at the level of a single molecule [Citation24–26], 2D spectroscopy at UV [Citation12,Citation27], deep UV [Citation20] and XUV [Citation21] wavelengths. However, the difficulty in detecting very weak signals and long measurement times have been the bottlenecks in some of these frontiers.
Nonlinear spectroscopy by manipulating phases of the light fields is evolving rapidly. Here, we focus on reviewing the development, current trend and possible future advancements in investigating highly nonlinear light–matter interactions. For an in-depth review on phase cycling, we guide readers to the references [Citation28] and [Citation29]. This short review is organized as follows. First, we present an overview of the fundamentals of the technique, including typical experimental setups. The important applications as well as the limitations of the technique and their mitigation are the core of Section 3. In Section 4, we offer our vision about the future prospects of the technique in extreme field laser–matter interactions, including a preliminary set of numerical simulations. Finally, in Section 5 we end our contribution with a short conclusion.
2. Principle of phase modulation in nonlinear spectroscopy and experimental realizations
Phase modulation of femtosecond pulses is achieved by shifting the carrier frequency. Acousto-optic frequency shifters are commonly used for this purpose. For a pulse described by , where
is the pulse envelope and
the carrier frequency, a frequency shift by
produces a field given by
. In most of the measurements, we use a pulse sequence with two or more pulses. The combined electric field is then given by
where is the number of pulses,
is pulse index,
and
are the envelope and frequency of each pulse, respectively. Usually, the pulses in the sequence are obtained by splitting one beam. Thus,
is the same for all the pulses. The peak amplitudes,
, may not be the same. In fact, a thorough optimization is necessary to obtain equal amplitudes for all the pulses. Nevertheless, for a conceptual understanding of the effect of phase modulation in nonlinear signals, we assume the amplitudes to be the same. When the pulses overlap in time, an
order polarization,
, induced by the pulse sequences is given by [Citation30]
and the population excited by the absorption of -photons,
, is given by
The population modulates at frequencies with
. A coherent emission resulting from the
order polarization (EquationEquation.(2
(2)
(2) )), when detected by a linear photodetector, also shows modulations at the same frequencies as the incoherent signal resulting from
-photon absorption. In the case of two-photon absorption due to two pulses, the population modulates at a number of frequencies. Most of them are at optical frequencies, which cannot be detected electronically. Thus, they do not contribute to the signals measured by photodetectors. Modulations are also present at two frequencies
and
, which being in the radiofrequency range, can be followed by photodetectors. If the lifetime of the detected signal is shorter than the repetition rate of the laser, the ratio of the amplitudes of the two signals is
[Citation6,Citation31].
The expression for the modulation frequencies of the excited population (EquationEquation.(3(3)
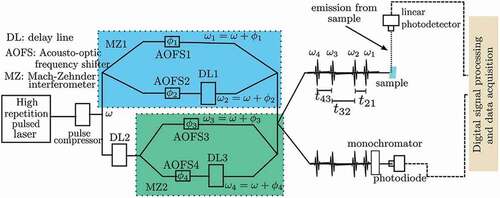
(3) )) shows that only the pulse sequences with even number of pulses can generate external signals that modulate at radio frequencies. In 2D spectroscopy using phase modulation, a sequence of four pulses (see for a typical experimental setup) produces detectable modulations at
,
and
. The signals isolated at the three frequencies are called rephasing, non-rephasing and double quantum coherence, respectively. These signals have the same physical interpretation as in electronic 2D spectroscopy measured by detecting the coherent response from the system (here referred to as conventional 2D spectroscopy) [Citation32–34]. Physically, the rephasing signals arise from the photon echoes and the non-rephasing signals arise from the free decay of the non-linear polarization induced in the sample. However, the pathways that contribute to the signals may not be the same in the two methods (see section 3 for an example). In a measurement, the 2D response function
is obtained in time domain by varying the interpulse time delays. The first pair of pulses act as the pump and the second pair as the probe. The Fourier transform with respect to
and
give the 2D spectra
as a function of pump and probe frequency at different pump-probe delay times
. Similar to that in conventional 2D spectroscopy [Citation32,Citation34], the electronic structure of the system is inferred from the peak positions, inhomogeneities from the lineshapes and dynamics (both coherent and incoherent dynamics) from the evolution of the peaks along
.
Figure 1. Schematics of experimental setup for fluorescence-detected two dimensional spectroscopy (FD2DS). A pulsed laser beam is split into two. Each beam goes through a Mach-Zehnder interferometer (MZ). Acousto-optic frequency shifters AOFS1, 2, 3 and 4 on the arms of the interferometers MZ1 and MZ2 modulate the phases of the beams at frequencies ,
,
and
, respectively. The AOFs add substantial chirp to the pulses, thus pulse compressor(s) are necessary to compensate for the temporal broadening. The spectral width of the laser pulse should cover the electronic states that are of interest. Delay line DL1 controls the time delay
between the pulses (pulse 1 and pulse 2) in the two arms of MZ1. Similarly DL2 controls the time delay
between the pulses 2 and 3. The time delay
between pulse 4 and pulse 3 is controlled by DL3. All the beams after MZ1 and MZ2 are recombined using a 50/50 beam splitter. One of the outputs from the beam splitter is used to excite the sample, while the other output goes to a monochromator. The monochromator selects a narrow spectrum of the light, which is used as the reference. The fluorescence (signal) from the sample is detected by a sensitive photodetector and its output is detected phase synchronously with respect to the reference. Lock-in amplifiers or similar digital signal processing algorithms are used to demodulate the signals at the frequencies
(also known as rephasing signal) and
(also known as non-rephasing signal). The measured signals are complex valued, i.e. they have amplitude and phase components. The measured 2D response function
is Fourier transformed along
and
to obtain the a sequence of 2D spectra
at different pump-probe delay times
.
One of the drawbacks of 2D spectroscopy using phase modulation has been the long measurement time. Compared to the coherent signal-detected 2D spectroscopy, which requires scanning along only two time axes, and
, the action signal-detected 2D spectroscopy requires scanning along all three time axes. This drawback has partly been addressed in recent days with the implementation of faster data acquisition and signal processing methods. In the original implementation [Citation9,Citation10], one of the outputs of both the interferometers in were passed through monochromators separately to obtain two references at
and
, which were then electronically mixed to produce the references at the rephasing and non-rephasing frequencies. Two lock-in amplifiers were used to demodulate the signals to obtain the real and imaginary parts of rephasing and non-rephasing spectra. In recent implementations [Citation12,Citation35], one of the outputs after combining all four pulses is directed to the sample while the other output is sent to a monochromator to produce the reference. The signal and reference are digitized simultaneously with a fast digitizer, the references at required frequencies are generated digitally and the signals are demodulated using either Fast Fourier transforms or specialized algorithms of signal processing [Citation36–40]. This has maximized the utilization of large amounts of data acquired during the measurements. Not only the 2D spectra but linear as well as nonlinear spectra using higher order nonlinear signals and double quantum coherence can be obtained from a single measurement. On the fly demodulation of relevant signals during continuous scanning of the time delays has also been demonstrated for faster measurements [Citation41].
On the computational side, two different approaches have been used to compute the action-signal based nonlinear and 2D spectra. The first approach uses response functions to calculate the different interaction pathways and spectra are obtained by summing selected pathways [Citation42–45]. This approach is also broadly used in modelling 2D spectra based on coherent signals [Citation34]. The second approach is an ‘in-silico’ method that simulates the experiments. The observables in the experiments have been calculated by solving the time evolution of the density matrix using the Lindblad master equation. Phase modulation is used to separate the relevant nonlinear signals in exactly the same manner as it is done in the experiments [Citation46,Citation47]. Although, this approach is computationally intensive, it gives results that closely match with the experiments and can be applied to simulate light-matter interaction beyond the perturbative limit. Recently, Anda and Cole have shown the equivalence of phase cycling and phase modulation in computing 2D spectra [Citation48]. Phase cycling may be advantageous here because of substantially reduced computational costs. The same may not be true in experiments as one also has to maximize the signal to noise ratio. Further development in the implementation using time-dependent density functional theory [Citation49] is expected to allow us to compute nonlinear and 2D spectra using fully ab-initio methods, i.e. without relying on adjustable external parameters to model the system hamiltonian.
3. Applications
Phase modulation has been used to investigate nonlinear light–matter interactions in atoms [Citation7,Citation9], molecules [Citation50], molecular aggregates [Citation51,Citation52], polymers [Citation35,Citation43] and semiconductors [Citation11–13]. While most of the measurements in atomic and molecular systems have been done to test the method and compare it with conventional 2D spectroscopy, measurements in molecular dimers, aggregates, polymers and semiconductors have provided unexpected results and new insights on the relationship between the electronic structure and functionality in natural as well as artificial systems.
Fluorescence-detected two dimensional spectroscopy (FD2DS) of porphyrin dimers has been used to determine the conformation and ultrafast population transfer [Citation10,Citation53]. Temperature dependent studies have shown that similar dimers adopt folded and extended conformations in lipid membranes [Citation42]. Using excitation at UV-wavelengths, conformations of dinucleotides in solutions have been found to differ from the conformations in DNA [Citation27]. Similarly, fluorophores attached to DNA have yielded valuable information about the conformation and static disorder induced by the local environment [Citation54,Citation55].
The unique features of phase modulation-based nonlinear spectroscopy have been vital in the investigation of electronic structure of large molecular aggregates. Experiments have been done on bacterial light harvesting complex (LH2) [Citation51,Citation52]. In these systems, FD2D spectra are starkly different from coherent signal-detected spectra (conventional 2D spectra). This has prompted a vigorous discussion on the actual interaction pathways and dynamics that is detected in FD2DS [Citation44,Citation45,Citation47,Citation56]. The LH2 complex investigated in the studies has 27 bacteriochlorophyll (BChl) molecules arranged in two rings [Citation57] that are responsible for absorption bands at 800 nm and 850 nm (see ). The outer ring, which has 9 molecules, absorbs at 800 nm and the inner, which has 18 molecules, absorbs at 850 nm. The BChl molecules in the inner ring are closely packed with significant inter-pigment excitonic interactions. There has been a debate on whether the pigments in the two rings are also excitonically coupled. Such coupling leads to off-diagonal peaks in the conventional 2D spectra. Measurements done by Harel et al., show weak off-diagonal peaks when pump and probe beams overlap [Citation58,Citation59], indicating very weak coupling between the chromophores in the two rings. Questions remained if and how do such couplings contribute to the functionality of the system. These questions have partly been answered by FD2DS.
Figure 2. Arrangement of BChl chromophores in bacterial LH2 (a) and FD2D spectra when pump and probe pulses overlap (b) [Citation52]. The peaks on the diagonal at 800 nm and 850 nm are commonly assigned to the outer ring and the inner, respectively. The outer ring has 9 BChl molecules and the inner ring has 18 closely packed BChl molecules. The off-diagonal peaks indicate that absorption by one of the bands reduces the absorption by the other. A four-level system depicting the electronic states participating in the excitations by the pump and probe pulses (c). µ are the transition dipole moments. The corresponding FD2D spectra simulated using phase modulation (d) [Citation46].
![Figure 2. Arrangement of BChl chromophores in bacterial LH2 (a) and FD2D spectra when pump and probe pulses overlap (b) [Citation52]. The peaks on the diagonal at 800 nm and 850 nm are commonly assigned to the outer ring and the inner, respectively. The outer ring has 9 BChl molecules and the inner ring has 18 closely packed BChl molecules. The off-diagonal peaks indicate that absorption by one of the bands reduces the absorption by the other. A four-level system depicting the electronic states participating in the excitations by the pump and probe pulses (c). µ are the transition dipole moments. The corresponding FD2D spectra simulated using phase modulation (d) [Citation46].](/cms/asset/45eef6e0-cc86-4649-b379-ec8ee1287bf0/tapx_a_2090856_f0002_oc.jpg)
The off-diagonal peaks in FD2D spectra at zero pump-probe delay are prominent [Citation50,Citation52], in contrast to the weak peaks observed in conventional 2D spectra. There are technical differences between the two methods due to the dissimilarities in the origins of the signals that are measured. In FD2DS, as only the chromophores fluoresce or fluorescence from them can be selectively detected by using proper filters, the coherent response from the solvent, surrounding proteins and other chromophores are not detected. This is not the case in conventional 2D, where coherent response from all sources within the excitation volume are detected. In this case, one expects additional signals from the environment that obscure the off-diagonal peaks. shows the electronic states that are involved in the excitations. The 2D spectra of the model simulated by using phase modulation () agrees well with the experiments.
It should be noted that the interpretation of the results have been debated. The disagreements hinge on the argument that technical differences alone do not explain why the off-diagonal peaks are comparable to the diagonal ones in the FD2D spectra. Using the response function based on Feynman diagrams and including the exciton–exciton annihilation process, Maly et al. indicated that exciton-exciton annihilation in LH2 could give the off-diagonal peaks [Citation44]. This prompted a significant revision in the interpretation of the signal in the 2D spectra. In general, the detected signal is a combination of contributions from three excitation pathways commonly called as the ground state bleach (GSB), stimulated emission (SE) and excited state absorption (ESA). Feynman diagrams of these pathways in a three level system are shown in . The Feynman diagrams depict the evolution of the density matrix under the interactions with the laser pulses. The contribution from each pathway can be positive or negative. Using the sign convention , where n is the number of interactions on the bra (or ket) side of the density matrix, GSB and SE pathways have positive contributions and ESA has a negative contribution in conventional 2D. Consequently, ESA reduces the overall signal and, in LH2, it cancels most of the off-diagonal features due to GSB [Citation45]. In FD2DS, the measured signal is the sum from four pathways, GSB, SE, ESAI and ESAII. Contributions from ESAI and ESAII have opposite signs. In molecular systems, because of the sub-picosecond relaxation to the first excited state from higher excited states, the quantum yield of emission is usually the same, irrespective of which excited electronic state is populated. Thus, ESAI and ESAII cancel each other. Detailed calculations based on a perturbative approach [Citation45] and an ‘in-silico’ non-perturbative simulation of the experiment [Citation47,Citation48], indicate that the off-diagonal peaks are due to the weak couplings. Exciton–exciton annihilation is important in cancelling the ESA pathways, thereby revealing the contributions from GSB, which give prominent off-diagonal peaks. However, investigation of the complex dynamics in LH2 and its variants using FD2DS have only begun [Citation51]. Further studies are needed for a better understanding of the electronic structure, dynamical processes and their role in the functionality of the system.
Figure 3. Feynman diagrams of the interaction pathways that give rise to rephasing signals in conventional 2D (left) and FD2DS (right). Similar pathways contribute to non-rephasing signals (see [Citation53] and [Citation46] for details). Dashed arrows represent coherent emission and wiggly arrows represent fluorescence from the system. Three pathways, ground state bleach (GSB), stimulated emission (SE) and excited state absorption (ESA), contribute to the signal in conventional 2D. The contributions from GSB and SE are positive while the contribution from ESA is negative. The sign of the contribution is given by (−1)n, where n is the number of interactions on the bra (or the ket) of the density matrix. Four pathways, GSB, SE, ESAI and ESAII, contribute to the signal in FD2DS out of which GSB, SE and ESAI have negative contributions and ESAII has positive contribution [Citation47]. In most molecular system, the population in the second excited state, relaxes to the first excited state,
, from which the fluorescence is emitted. Thus, ESAI and ESAII cancel each other, leaving GSB and SE as the net contributors to the signal.
![Figure 3. Feynman diagrams of the interaction pathways that give rise to rephasing signals in conventional 2D (left) and FD2DS (right). Similar pathways contribute to non-rephasing signals (see [Citation53] and [Citation46] for details). Dashed arrows represent coherent emission and wiggly arrows represent fluorescence from the system. Three pathways, ground state bleach (GSB), stimulated emission (SE) and excited state absorption (ESA), contribute to the signal in conventional 2D. The contributions from GSB and SE are positive while the contribution from ESA is negative. The sign of the contribution is given by (−1)n, where n is the number of interactions on the bra (or the ket) of the density matrix. Four pathways, GSB, SE, ESAI and ESAII, contribute to the signal in FD2DS out of which GSB, SE and ESAI have negative contributions and ESAII has positive contribution [Citation47]. In most molecular system, the population in the second excited state, |2⟩ relaxes to the first excited state, |1⟩, from which the fluorescence is emitted. Thus, ESAI and ESAII cancel each other, leaving GSB and SE as the net contributors to the signal.](/cms/asset/871af144-6366-4d53-8118-c227f2ac6eb7/tapx_a_2090856_f0003_oc.jpg)
Nonlinear spectroscopy using phase modulation and photoelectron/ion detection has progressed rapidly [Citation17–19]. 1D and 2D spectroscopy using two and four-pulse sequences have been reported. Most of the experiments have been done on rubidium atoms and clusters. Excitations induced by single to multiple photons have been studied to observe and quantify multiquantum coherences [Citation19]. Highly sensitive 2D spectroscopy has revealed modifications of the potential energy surface of a rubidium cluster by the solvent environment (helium), and dynamic Stokes shifts. More importantly, the sensitivity of the experiments are now good enough to investigate long-range dipole–dipole interactions () [Citation19,Citation60] in atomic clusters.
Photocurrent detection is another scheme with important applications in material characterization, photosensors, emitters and photovoltaics. It has become a truly ‘in-operando’ method of spectroscopy, relating the electronic structure and its dynamics in a material system with functionality in devices. Since its first demonstration in 2013 by Nardin et al. [Citation11], photocurrent-detected two dimensional spectroscopy (PC2DS) has been applied to semiconductor quantum dot based devices [Citation12], organic solar cells [Citation13,Citation35,Citation43] and semiconductor devices [Citation13,Citation43]. In quantum dot based devices, PC2DS has been crucial in understanding the timescale of multiple exciton generation (MEG) and if the extra excitons generated in the process can be extracted in external circuits. Different models of dynamics in quantum dots have been proposed that predict different timescales for MEG. In one possible model, the absorption of a high energy photon initially excites a single exciton that, at later times, undergoes mixing with a multiparticle state to produce many excitons [Citation61]. Another scheme assumes direct excitation of the multiparticle state to account for efficient MEG [Citation62]. Results of PC2DS support the former model and have shown that the multiplication of a single exciton in quantum dots occurs in a timescale of few hundred femtoseconds after the initial excitation of a single-particle state [Citation12]. Moreover, as the signatures of MEG are obtained from an external photocurrent, it implies that the excitons generated via MEG can be extracted in an external circuit. Detailed theoretical simulations have shown this to be the case [Citation63]. In addition, the simulations have shown that the yield of MEG is higher in the quantum dots in which the charges are extracted out of the system suggesting MEG may be more efficient when photovoltaic devices are in operation.
PC2DS has also been used to investigate ultrafast dynamics in polymer solar cells. For some time it has been conjectured that the charge separation in polymer solar cells occurs within few tens of femtoseconds after excitation [Citation64–67]. In 2014, Falke et al., reported an oscillatory signal in pump-probe spectroscopy of a polymer-fullerene organic solar cell, which implies that a coherent vibronic coupling between the electronic and nuclear degrees of freedom plays a key role in the charge delocalization and transfer across the donor–acceptor interface [Citation68]. However, these results only show the existence of coherent processes aiding the charge transfer but do not directly prove their relevance in the external photocurrent. Using PC2DS, Bian et al. [Citation35], have recently shown that the charges separated by vibronic coherence indeed contribute to the external photocurrent in high efficiency polymer solar cells. The measurements have been done on a solar cell composed of a polymer-fullerene blend. Oscillatory signals have been observed in devices with a power conversion efficiency of 9.5%. Such oscillations are lacking in devices with lower efficiency (see ), indicating that vibronic coherences improve device performance. New devices have reported efficiencies over 18%. The underlying ultrafast processes that enable such record efficiencies are yet to be investigated. PC2DS will likely be the appropriate diagnostic tool to answer these technologically relevant questions.
Figure 4. Photocurrent-detected 2D spectroscopy (PC2DS) of PTB7/PC71BM binary donor-acceptor (left) and PTB7/PCDTBT/PC71BM ternery blend (right) solar cells. The power conversion efficiency of the binary blend is less than 5% while that of the ternery blend is 9.5%. Strong oscillations are observed only in the PC2DS of the ternary blend within 100 fs of the pump-probe delay, indicating that vibronic coherence contribute to the photocurrent generation in high efficiency polymer solar cells.
Although a powerful technique for device characterization, PC2DS is still under development. Some limitations have also been identified. The main limitation is that the technique cannot be used in devices that have systemic nonlinearities resulting from the so-called ‘incoherent population mixing’ [Citation13]. Hybrid lead-halide perovskites have been identified as such systems. In these systems, nonlinear process of carrier–carrier scattering is active even at low excitation densities. Polymer solar cells [Citation13,Citation35] and quantum dot based devices [Citation12] are examples where PC2DS can be used. Effects of macroscopic polarization, due to many-body states that have discernible probability of two or more particles jointly being excited, on the nonlinear signals has also been discussed [Citation69]. However, such effects can be minimized by lowering the excitation density. Nevertheless, when applying PC2Ds, one has to first ascertain that nonlinear population dynamics or similar effects, over longer timescales before the charges are extracted from the device, do not dominate the signal. A recently proposed method of characterizing the nonlinear signal based on its phase relative to the linear signal could be used to differentiate the incoherent population mixing from the true coherent signals [Citation47]. Similarly, if the features in the spectra show changes in ultrafast timescales (few tens of femtoseconds), then one can use PC2DS to investigate the relationship between electronic structure, ultrafast dynamics and functionality of photoactive devices.
4. Prospects
Over the last decade, nonlinear spectroscopy using phase modulation has matured to an extent that it can be used as a diagnostic tool to characterize functionally important dynamics in photoactive systems. Fluorescence and photocurrent detection schemes are likely to be widely used in the future. Proof-of-concept experiments based on photoacoustics and photothermal effects may emerge soon as other modes of action-detected nonlinear spectroscopy. Meanwhile, photoion and high-harmonic detection schemes are poised to unravel details of nonlinear dynamics in nonperturbative regimes. Nevertheless, it is important to note that phase modulation adds complexity to the experimental setups. One has to carefully weigh the benefits of the methods compared to traditional forms of nonlinear spectroscopy. Some types of measurements where these methods either enable or outperform the traditional ones are (i) investigation of nonlinear interaction of isolated systems, down to the level of single molecule, and ultrafast dynamics in them, (ii) investigation of the electronic structure during and right after the absorption of photons in a pump-probe type measurement that is devoid of coherent artifacts and (iii) investigation of the relationship between electronic structure and functionality in photoactive systems.
On the computational front, phase cycling and phase modulation methods have been shown to be appropriate for calculating the effects of nonlinear dynamics on the detected signals. These methods can be adapted to calculate the outcome of nonlinear dynamics when materials are subjected to extreme fields. Effects such as high-harmonic generation in gases and solids and field driven currents in dielectrics are within the scope.
Investigation of light–matter interaction at extremely high fields is at the forefront of research. Nowadays, by focusing ultrashort laser pulses on atoms, molecules or solid targets, possibly in the presence of nano-structures, the targets can be subjected to an ultra-intense electric field, with peak field strengths approaching the electric field that binds the atoms themselves [Citation70–74]. Such fields allow the exploration of the interaction between strong electromagnetic coherent radiation and an atomic, molecular or solid system with unprecedented spatial and temporal resolution and study novel nonlinear phenomena. One of the most prominent strong field-induced processes in atoms, molecules and, recently, bulk matter, is high-harmonic generation (HHG). In HHG, an electron is freed from an atom or molecule through tunnel ionization (in a solid it is promoted from the valence to the conduction band), which occurs close to the maximum of the electric field. Within the oscillating field, the ‘free’ electron can thus accelerate along oscillating trajectories gaining kinetic energy. When the electric field reverses its direction, a recollision with the parent ion could occur, roughly when the laser field approaches a zero value (in a solid, the electron re-encounter its left-behind hole). The energy gained during the journey in the laser-continuum is up-converted into a high-energy photon, typically in the UV or XUV range.
On the one hand, HHG can be used to generate attosecond pulses (1 attosecond = 10–18 s) in the XUV, or even in the soft x-ray regime. Such pulses themselves may be subsequently employed for dynamical ultrafast spectroscopy of matter; despite carrying modest pulse energies, they exhibit excellent coherence properties. Combined with femtosecond pulses they can also be used to extract information about the laser pulse electric field itself. HHG sources therefore offer an important alternative to other sources of XUV and x-ray radiation: synchrotrons, free electron lasers (FELs), x-ray lasers, and laser plasma sources. On the other hand, HHG pulses can provide structural information about the target atom, molecule or solid, with a sub-fs temporal and sub-Å spatial resolutions. To decode such information from a highly nonlinear HHG signal is a challenge, and, typically, one relies on (i) reduced dimensionality models or (ii) approximated approaches, such as the strong field approximation (SFA) [Citation75]. Application of phase modulation may offer an appropriate method to disentangle the pathways that contribute to such complex signals.
Our preliminary calculations using a 1D time-dependent Schrödinger numerical solver have shown promises in this regard. For linearly polarized laser pulses, the dynamics of an atomic electron in a strong laser field is mainly along the direction of the field. It is reasonable, therefore, to model the HHG in a 1D spatial dimension by solving the following Schrödinger equation (1d-TDSE):
To model an atom in 1D, it is common to use the quasi-Coulomb potential
where the parameter is tuned to match the ionization potential of the atom under consideration. The potential due to the laser electric field linearly polarized along the x-axis is written in the dipole approximation as
where is the time-dependent laser electric field. The initial state in the 1D-TDSE is the ground state (GS) of the system before we turn on the laser (
) and it can be found solving an eigenvalue problem once the spatial coordinate
has been discretized. EquationEquation (4)
(4)
(4) can be solved numerically by using the Crank-Nicolson scheme [Citation71]. Two important aspects should to be taken into account: (i) to assure the stability of the numerical integration, the ratio between the resolution of time and space, i.e.
should to be sufficiently less than 1; (ii) in order to avoid reflections and spurious contributions to the electronic wave function an adequate treatment of the boundary conditions is necessary.
Once having found the time-dependent electronic state from the 1D-TDSE (4), we can calculate the harmonic spectrum as follows. The harmonic yield of an atom is proportional to the Fourier transform of the acceleration
of its active electron. That it,
where can be obtained by using he following commutator relation
where is the Hamiltonian defined in the EquationEquation. (4)
(4)
(4) . The function
is called the dipole spectrum, since
gives the spectral profile measured in HHG experiments. Here, we have employed a 1D hydrogen atom driven by 2 identical pulses, with an intensity
W/cm
each, a wavelength
nm and 6 total cycles long (
fs). Varying the phase
between them, we compute the HHG spectrum from EquationEquation. (7)
(7)
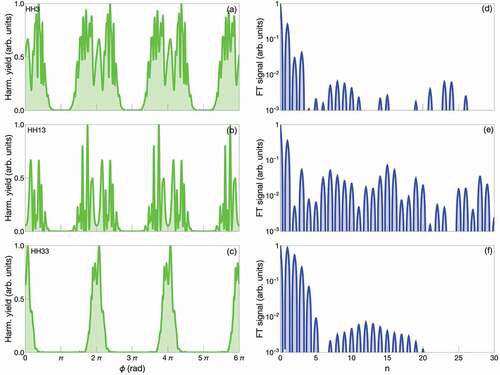
(7) In )-(c) we plot the high-order harmonic 3 (HH3), 13 (HH13) and 33 (HH33), respectively, as a function of
. We have chosen a low-order harmonic (HH3), one at the plateau (HH13) and finally one in the region close to the cutoff (HH33) (the semiclassical calculated HHG cutoff is around the 33th harmonic). We observe a series of oscillations that decrease towards zero for
, with
(here the 2 pulses cancel each other). Interestingly, the shape of these plots is not symmetrical with respect to
, as is expected in the linear regime. By Fourier transforming the )-(c), we obtain )-(f), where we can see the Fourier components of the each high-order harmonic signal. A clear peak for
is visible (that corresponds to the
, where the 2 pulses coincide and generate the maximum signal). A proper framework to analyze the results have yet to be developed. Nevertheless, one can quickly observe that even HH3 has contributions from high order nonlinear response. The plateau region has contributions from the highest nonlinear interactions, and ironically beyond the cutoff, lower order nonlinear response prevail. Overall, these preliminary results show that application of phase modulation in the non-pertubative regime of light–matter interaction may open up new computational and experimental methods to get further insights into the highly nontrivial processes.
Figure 5. (a)-(c) high-harmonic order yield as a function of the phase between the pulses ; (d)-(f) Fourier transform of the panels (a)-(c) (in log scale).
5. Conclusions
In this short review, we have discussed the historical background, concepts, applications and prospects of phase modulation in nonlinear spectroscopy in the perturbative as well as non-perturbative regime. Since its inception, techniques based on phase modulation have focused on studying relationship between electronic structure, dynamics and functionality of various systems. The methods have matured to a stage such that one could use them as diagnostic tools. Recent experiments and computational results indicate that similar techniques could be applied to investigate light–matter interactions at extreme electromagnetic fields in order to obtain a more detailed picture of the processes involved in such interactions. Development of an appropriate framework to analyze the huge data sets acquired in these experiments with rich information content is expected to be the next frontier in this research direction.
Acknowledgments
The authors acknowledge financial support from the Guangdong Province Science and Technology Major Project (Future functional materials under extreme conditions - 2021B0301030005). KJK acknowledges support from the World Academy of Science (TWAS) under Grant No. 20-278 RG/PHYS/AS_G-FR3240314165.
Disclosure statement
No potential conflict of interest was reported by the author(s).
References
- Scherer NF, Carlson RJ, Matro A, et al. Fluorescence-detected wave packet interferometry: time resolved molecular spectroscopy with sequences of femtosecond phase-locked pulses. J Chem Phys. 1991 aug;95:1487–22. Available from https://aip.scitation.org/doi/abs/10.1063/1.461064
- Ziegler LD, Scherer NF. Nonlinear polarization description of phase-locked pulse-pair spectroscopy. J Chem Phys. 1992 aug;97:4704–4713. Available from https://aip.scitation.org/doi/abs/10.1063/1.463872
- Tian P, Keusters D, Suzaki Y, et al. Femtosecond phase-coherent two-dimensional spectroscopy. Science. 2003 jun;300:1553–1555. Available from https://www.science.org/doi/abs/10.1126/science.1083433
- Tekavec PF, Dyke TR, Marcus AH. Wave packet interferometry and quantum state reconstruction by acousto-optic phase modulation. J Chem Phys. 2006 nov;125:194303. Available from https://aip.scitation.org/doi/abs/10.1063/1.2386159
- Tian P, Warren WS. Ultrafast measurement of two-photon absorption by loss modulation. Opt Lett. sep 2002;27:1634. Available from https://www.osapublishing.org/viewmedia.cfm?uri=ol-27-18-1634&seq=0&html=true
- Karki KJ, Kringle L, Marcus AH, et al. Phase-synchronous detection of coherent and incoherent nonlinear signals. J Opt (U K). 2016;18:015504.
- Bruder L, Binz M, Stienkemeier F. Efficient isolation of multiphoton processes and detection of collective resonances in dilute samples. Phys Rev A Atomic, Molecular, and Optical Physics. 2015 nov;92:053412. Available from https://journals.aps.org/pra/abstract/10.1103/PhysRevA.92.053412
- Kumar P, Karki KJ. Two-photon excitation spectroscopy of 1,5–diphenyl-1,3,5-hexatriene using phase modulation. J Phys Commun. 2019;3:035008.
- Tekavec PF, Lott GA, Marcus AH. Fluorescence-detected two-dimensional electronic coherence spectroscopy by acousto-optic phase modulation. J Chem Phys. dec 2007;127:214307. Available from http://aip.scitation.org/doi/10.1063/1.2800560
- Lott GA, Perdomo-Ortiz A, Utterback JK, et al. Conformation of self-assembled porphyrin dimers in liposome vesicles by phase-modulation 2D fluorescence spectroscopy. Proc Natl Acad Sci USA. 2011 oct;108:16521–16526. Available from https://www.pnas.org/content/108/40/16521-https://www.pnas.org/content/108/40/16521.abstract
- Nardin G, Autry TM, Silverman KL, et al. Multidimensional coherent photocurrent spectroscopy of a semiconductor nanostructure. Opt Express. 2013 nov;21:28617. Available from https://www.osapublishing.org/viewmedia.cfm?uri=oe-21-23-28617&seq=0&html=true
- Karki KJ, Widom JR, Seibt J, et al. Coherent two-dimensional photocurrent spectroscopy in a pbs quantum dot photocell. Nat Commun. 2014 dec;5:1–7. Available from https://www.nature.com/articles/ncomms6869
- Grégoire P, Srimath Kandada AR, Vella E, et al. Incoherent population mixing contributions to phase-modulation two-dimensional coherent excitation spectra. J Chem Phys. sep 2017;147:114201. Available from https://aip.scitation.org/doi/abs/10.1063/1.4994987
- Kumar P, Shi Q, Karki KJ. Enhanced radiative recombination of excitons and free charges due to local deformations in the band structure of MAPbBr3 perovskite crystals. J Phy Chem C. 2019;123:13444–13450.
- Ghosh S, Pradhan B, Zhang Y, et al. Nature of the different emissive states and strong exciton-phonon couplings in quasi-two-dimensional perovskites derived from phase-modulated two-photon micro-photoluminescence spectroscopy. Phys Chem Chem Phys. 2021;23:3983–3992.
- Aeschlimann M, Brixner T, Fischer A, et al. Coherent two-dimensional nanoscopy. Science. 2011;333:1723–1726.
- Bruder L, Mudrich M, Stienkemeier F. Phase-modulated electronic wave packet interferometry reveals high resolution spectra of free Rb atoms and Rb He molecules. Phy Chem Chem Phys. sep 2015;17:23877–23885. Available from https://pubs.rsc.org/en/content/articlehtml/2015/cp/c5cp03868e-https://pubs.rsc.org/en/content/articlelanding/2015/cp/c5cp03868e
- Bruder L, Bangert U, Binz M, et al. Coherent multidimensional spectroscopy of dilute gas-phase nanosystems. Nat Commun. 2018 nov;9:1–7. Available from https://www.nature.com/articles/s41467-018-07292-w
- Bruder L, Eisfeld A, Bangert U, et al. Delocalized excitons and interaction effects in extremely dilute thermal ensembles. Phys Chem Chem Phys. 2019 jan;21:2276–2282. Available from https://pubs.rsc.org/en/content/articlehtml/2019/cp/c8cp05851b-https://pubs.rsc.org/en/content/articlelanding/2019/cp/c8cp05851b
- Wituschek A, Bruder L, Klein LS, et al. Stable interferometric platform for phase modulation of seeded free-electron lasers. Opt Lett. 2019 feb;44:943. Available from https://www.osapublishing.org/viewmedia.cfm?uri=ol-44-4-943&seq=0&html=true
- Wituschek A, Bruder L, Allaria E, et al. Tracking attosecond electronic coherences using phase-manipulated extreme ultraviolet pulses. Nat Commun. 2020 feb;11:1–7. Available from https://www.nature.com/articles/s41467-020-14721-2
- Karki KJ. Increasing the density of modes in an optical frequency comb by cascaded four-wave mixing in a nonlinear optical fiber. Phys Rev A. oct 2017;96:043802. Available from https://journals.aps.org/pra/abstract/10.1103/PhysRevA.96.043802
- Chen J, Krasavin A, Ginzburg P, et al. Evidence of high-order nonlinearities in supercontinuum white-light generation from a gold nanofilm. ACS Photonics. 2018;5:1927–1932.
- Brinks D, Stefani FD, Kulzer F, et al. Visualizing and controlling vibrational wave packets of single molecules. Nature. 2010 jun;465:905–908. Available from https://www.nature.com/articles/nature09110
- Hildner R, Brinks D, Stefani FD, et al. Electronic coherences and vibrational wave-packets in single molecules studied with femtosecond phase-controlled spectroscopy. Phys Chem Chem Phys. 2011 jan;13:1888–1894. Available from https://pubs.rsc.org/en/content/articlehtml/2011/cp/c0cp02231d-https://pubs.rsc.org/en/content/articlelanding/2011/cp/c0cp02231d
- Liebel M, Toninelli C, Van Hulst NF. Room-temperature ultrafast nonlinear spectroscopy of a single molecule. Nat Photon. dec 2018;12:45–49. Available from https://www.nature.com/articles/s41566-017-0056-5
- Widom JR, Johnson NP, Von Hippel PH, et al. Solution conformation of 2-aminopurine dinucleotide determined by ultraviolet two-dimensional fluorescence spectroscopy. New J Phys. 2013 feb;15:025028. Available from https://iopscience.iop.org/article/10.1088/1367-2630/15/2/025028-https://iopscience.iop.org/article/10.1088/1367-2630/15/2/025028/meta
- Tan HS. Theory and phase-cycling scheme selection principles of collinear phase coherent multi-dimensional optical spectroscopy. J Chem Phys. 2008 sep;129:124501. Available from https://aip.scitation.org/doi/abs/10.1063/1.2978381
- Tan HS. The development and applications of phase cycling in multidimensional optical spectroscopy. In: Springer series in optical sciences. Vol. 226. Singapore: Springer Verlag; 2019. p. 87–103.
- Boyd RW The nonlinear optical susceptibility. In: Nonlinear optics. Cambridge,Massachusetts: Academic Press; 2020. p. 1–64.
- Osipov VA, Shang X, Hansen T, et al. Nature of relaxation processes revealed by the action signals of intensity-modulated light fields. Phys Rev A. 2016;94.
- Jonas -DMT-DFS; 2003. Available from: http://www.annualreviews.org/doi/10.1146/annurev.physchem.54.011002.103907
- Khalil M, Demirdöven N, Tokmakoff A. Coherent 2D IR spectroscopy: molecular structure and dynamics in solution. J Phys Chem A. 2003 jul;107:5258–5279. Available from https://pubs.acs.org/doi/abs/10.1021/jp0219247
- Cho M Coherent two-dimensional optical spectroscopy; 2008. Available from https://pubs.acs.org/doi/abs/10.1021/cr078377b
- Bian Q, Ma F, Chen S, et al. Vibronic coherence contributes to photocurrent generation in organic semiconductor heterojunction diodes. Nat Commun. 2020;11:617.
- Karki K, Torbjörnsson M, Widom JR, et al. Digital cavities and their potential applications. J Instrum. 2013 may;8:T05005. Available from https://iopscience.iop.org/article/10.1088/1748-0221/8/05/T05005-https://iopscience.iop.org/article/10.1088/1748-0221/8/05/T05005/meta
- Fu S, Sakurai A, Liu L, et al. Generalized lock-in amplifier for precision measurement of high frequency signals. Rev Sci Instrum. 2013;84:115101.
- Jin A, Fu S, Sakurai A, et al. Note: high precision measurements using high frequency gigahertz signals. Rev Sci Instrum. 2014;85:126102.
- Olsson M, Edman F, Karki KJ. Direct measurement of fast transients by using boot-strapped waveform averaging. Rev Sci Instrum. 2018;89:035104.
- Uhl D, Bruder L, Stienkemeier F. A flexible and scalable, fully software-based lock-in amplifier for nonlinear spectroscopy. Rev Sci Instrum. aug 2021;92:083101. Available from https://aip.scitation.org/doi/abs/10.1063/5.0059740
- Agathangelou D, Javed A, Sessa F, et al. Phase-modulated rapid-scanning fluorescence-detected two-dimensional electronic spectroscopy. J Chem Phys. 2021 sep;155:094201. Available from https://aip.scitation.org/doi/abs/10.1063/5.0057649
- Widom JR, Lee W, Perdomo-Ortiz A, et al. Temperature-dependent conformations of a membrane supported zinc porphyrin tweezer by 2D fluorescence spectroscopy. J Phys Chem A. 2013 jul;117:6171–6184. Available from https://pubs.acs.org/doi/abs/10.1021/jp400394z
- Vella E, Li H, Grégoire P, et al. Ultrafast decoherence dynamics govern photocarrier generation efficiencies in polymer solar cells. Sci Rep. 2016 jul;6:1–12. Available from https://www.nature.com/articles/srep29437
- Malý P, Mančal T. Signatures of exciton delocalization and exciton-exciton annihilation in fluorescence-detected two-dimensional coherent spectroscopy. J Phys Chem Lett. 2018 oct;9:5654–5659. Available from https://pubs.acs.org/doi/abs/10.1021/acs.jpclett.8b02271
- Kunsel T, Tiwari V, Matutes YA, et al. Simulating fluorescence-detected two-dimensional electronic spectroscopy of multichromophoric systems. J Phys Chem B. 2019 jan;123:394–406. Available from https://pubs.acs.org/doi/abs/10.1021/acs.jpcb.8b10176
- Damtie FA, Wacker A, Pullerits T, et al. Two-dimensional action spectroscopy of excitonic systems: explicit simulation using a phase-modulation technique. Phys Rev A. 2017;96:053830.
- Kalaee AAS, Damtie F, Karki KJ. Differentiation of true nonlinear and incoherent mixing of linear signals in action-detected 2D spectroscopy. J Phys Chem A. 2019;123:4119–4124.
- Anda A, Cole JH. Two-dimensional spectroscopy beyond the perturbative limit: the influence of finite pulses and detection modes. J Chem Phys. mar 2021;154:114113. Available from https://aip.scitation.org/doi/abs/10.1063/5.0038550
- Cho D, Rouxel JR, Kowalewski M, et al. Phase cycling RT-TDDFT simulation protocol for nonlinear XUV and X-ray molecular spectroscopy. J Phys Chem Lett. 2018 mar;9:1072–1078. Available from https://pubs.acs.org/doi/abs/10.1021/acs.jpclett.8b00061
- Tiwari V, Matutes YA, Konar A, et al. Strongly coupled bacteriochlorin dyad studied using phase-modulated fluorescence-detected two-dimensional electronic spectroscopy. Opt Express. 2018 aug;26:22327–22341. Available from https://www.osapublishing.org/viewmedia.cfm?uri=oe-26-17-22327&seq=0&html=true
- Tiwari V, Matutes YA, Gardiner AT, et al. Spatially-resolved fluorescence-detected two-dimensional electronic spectroscopy probes varying excitonic structure in photosynthetic bacteria. Nat Commun. 2018 dec;9:1–10. Available from www.nature.com/naturecommunications
- Karki KJ, Chen J, Sakurai A, et al. Before Förster. Initial excitation in photosynthetic light harvesting. Chem Sci. 2019;10:7923–7928.
- Perdomo-Ortiz A, Widom JR, Lott GA, et al. Conformation and electronic population transfer in membrane-supported self-assembled porphyrin dimers by 2D fluorescence spectroscopy. J Phys Chem B. 2012 sep;116:10757–10770. Available from https://pubs.acs.org/doi/abs/10.1021/jp305916x
- Kringle L, Sawaya NP, Widom J, et al. Temperature-dependent conformations of exciton-coupled Cy3 dimers in double-stranded DNA. J Chem Phys. feb 2018;148:085101. Available from https://aip.scitation.org/doi/abs/10.1063/1.5020084
- Heussman D, Kittell J, Kringle L, et al. Measuring local conformations and conformational disorder of (Cy3)2 dimer labeled DNA fork junctions using absorbance, circular dichroism and two-dimensional fluorescence spectroscopy. Faraday Discuss. 2019 jul;216:211–235. Available from https://pubs.rsc.org/en/content/articlehtml/2019/fd/c8fd00245b-https://pubs.rsc.org/en/content/articlelanding/2019/fd/c8fd00245b
- Kühn O, Mančal T, Pullerits T. Interpreting fluorescence detected two-dimensional electronic spectroscopy. J Phys Chem Lett. 2020 feb;11:838–842. Available from https://pubs.acs.org/doi/abs/10.1021/acs.jpclett.9b03851
- McDermott G, Prince SM, Freer AA, et al. Crystal structure of an integral membrane light-harvesting complex from photosynthetic bacteria. Nature. 1995;374:517–521. Available from https://www.nature.com/articles/374517a0
- Harel E, Engel GS, Long PD. Single-shot ultrabroadband two-dimensional electronic spectroscopy of the light-harvesting complex LH2. Opt Lett. may 2011;36:1665–1667. Available from https://opg.optica.org/viewmedia.cfm?uri=ol-36-9-1665&seq=0&html=true-https://opg.optica.org/abstract.cfm?uri=ol-36-9-1665-https://opg.optica.org/ol/abstract.cfm?uri=ol-36-9-1665
- Harel E, Engel GS. Quantum coherence spectroscopy reveals complex dynamics in bacterial light-harvesting complex 2 (LH2). Proc Natl Acad Sci U S A. jan 2012;109:706–711. Available from https://www.pnas.org/content/109/3/706-https://www.pnas.org/content/109/3/706.abstract
- Li ZZ, Bruder L, Stienkemeier F, et al. Probing weak dipole-dipole interaction using phase-modulated nonlinear spectroscopy. Phys Rev A. may 2017;95:052509. Available fromhttps://journals.aps.org/pra/abstract/10.1103/PhysRevA.95.052509
- Nair G, Chang LY, Geyer SM, et al. Perspective on the prospects of a carrier multiplication nanocrystal solar cell. Nano Lett. may 2011;11:2145–2151. Available from https://pubs.acs.org/doi/abs/10.1021/nl200798x
- Schaller RD, Agranovich VM, Klimov VI. High-efficiency carrier multiplication through direct photogeneration of multi-excitons via virtual single-exciton states. Nature Phys. nov 2005;1:189–194. Available from https://www.nature.com/articles/nphys151
- Damtie FA, Karki KJ, Pullerits T, et al. Optimization schemes for efficient multiple exciton generation and extraction in colloidal quantum dots. J Chem Phys. 2016 aug;145:064703. Available from https://aip.scitation.org/doi/abs/10.1063/1.4960507
- Kaake LG, Moses D, Heeger AJ. Coherence and uncertainty in nanostructured organic photovoltaics. J Phys Chem Lett. jul 2013;4:2264–2268. Available from https://pubs.acs.org/doi/abs/10.1021/jz4010569
- Mukamel S. Comment on “coherence and uncertainty in nanostructured organic photovoltaics”. J Phys Chem A. 2013 oct;117:10563–10564.
- Schott M, Aslangul C. Comment on “coherence and uncertainty in nanostructured organic photovoltaics”. J Phys Chem A. feb 2014;118:1538. Available from https://pubs.acs.org/sharingguidelines
- Kaake LG, Moses D, Heeger AJ. Reply to “comment on ‘coherence and uncertainty in nanostructured organic photovolatics’“. J Phys Chem A. 2013 oct;117:10565. Available from https://pubs.acs.org/doi/full/10.1021/jp408700m
- Falke SM, Rozzi CA, Brida D, et al. Coherent ultrafast charge transfer in an organic photovoltaic blend. Science. 2014 may;344:1001–1005. Available from https://www.science.org/doi/abs/10.1126/science.1249771
- Mukamel S. Communication: the origin of many-particle signals in nonlinear optical spectroscopy of non-interacting particles. J Chem Phys. 2016 jul;145:041102. Available from https://aip.scitation.org/doi/abs/10.1063/1.4960049
- Krausz F, Ivanov M. Attosecond physics. Rev Mod Phys. 2009 Feb;81:163–234. Available from https://link.aps.org/doi/10.1103/RevModPhys.81.163
- Ciappina MF, Pérez-Hernández JA, Landsman AS, et al. Attosecond physics at the nanoscale. Rep Prog Phys. 2017 mar;80:054401. Available from
- Kruchinin SY, Krausz F, Yakovlev VS. Colloquium: strong-field phenomena in periodic systems. Rev Mod Phys. 2018 Apr;90:021002. Available from https://link.aps.org/doi/10.1103/RevModPhys.90.021002
- Schoetz J, Wang Z, Pisanty E, et al. Perspective on petahertz electronics and attosecond nanoscopy. ACS Photonics. 2019;6:3057–3069.
- Park J, Subramani A, Kim S, et al. Recent trends in high-order harmonic generation in solids. Adv Phys X. 2022;7:2003244.
- Amini K, Biegert J, Calegari F, et al. Symphony on strong field approximation. Rep Prog Phys. 2019 oct;82:116001.