
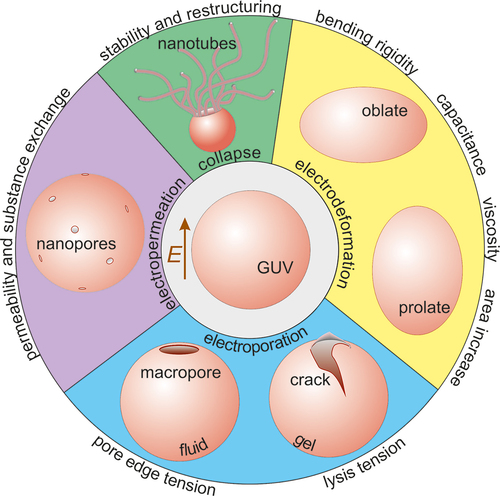
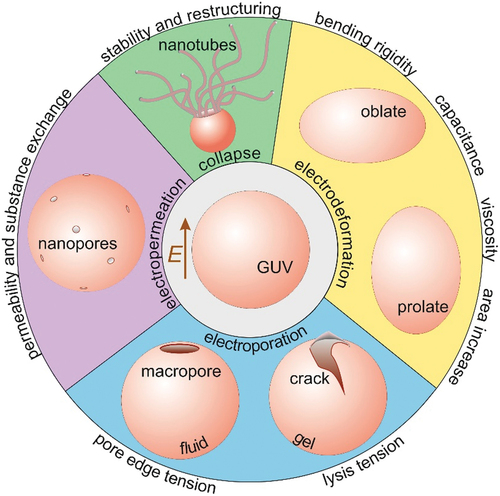
ABSTRACT
Knowledge of the material properties of membranes is crucial to understanding cell viability and physiology. A number of methods have been developed to probe membranes in vitro, utilizing the response of minimal biomimetic membrane models to an external perturbation. In this review, we focus on techniques employing giant unilamellar vesicles (GUVs), model membrane systems, often referred to as minimal artificial cells because of the potential they offer to mimick certain cellular features. When exposed to electric fields, GUV deformation, dynamic response and poration can be used to deduce properties such as bending rigidity, pore edge tension, membrane capacitance, surface shear viscosity, excess area and membrane stability. We present a succinct overview of these techniques, which require only simple instrumentation, available in many labs, as well as reasonably facile experimental implementation and analysis.
GRAPHIAL abstract
1 Introduction
Biological membranes are essential for the maintenance of cellular homeostasis and changes in their physiology have been associated with several pathological conditions [Citation1]. The plasma membrane is relatively flexible and can adopt complex (and highly curved) morphologies during key cellular processes such as endocytosis [Citation2] and exocytosis [Citation3], cell migration [Citation4], cytokinesis [Citation5], trafficking [Citation6] and signaling [Citation7] pathways. The membrane mechanics, rheology and stability are the determinants of the cell response to external perturbations. Understanding this response is justified by the ever increasing quest for techniques in biomedical engineering and treatment. The response of cells to electric fields has received significant attention as means for the development of novel therapeutic strategies. For example, electrofusion has been used for the production of monoclonal antibody and cancer vaccines [Citation8] and it has been reported as a promising approach towards treatment of diabetes [Citation9]. Other examples include electroporation in tumor ablation [Citation10], electrochemotherapy [Citation11,Citation12], exogenous cell engraftment [Citation13], gene and drug delivery [Citation14], cell transfection [Citation15] and inactivation of microorganisms [Citation16]. However, because of the high complexity of cells, the complete bioelectrochemical mechanisms and functions of individual cell components such as the plasma membrane during these electromicromanipulation methods remain poorly understood.
Giant unilamellar vesicles (GUVs) as cell-sized, simple biomembranes are one of the most convenient cell-mimetic models for membrane characterization [Citation17–21]. Mechanical, rheological and electrical properties such as bending rigidity, stretching elasticity, lysis tension, edge tension, viscosity and capacitance, can be directly assessed from microscopy observations of GUVs [Citation18]. Deformation and poration of vesicles exposed to electric fields have contributed substantially to increasing our understanding of electric-field-based applications on cells as well as for resolving membrane physical characteristics [Citation22–25]. This review focuses on recent developments in the characterization of these membrane properties (considering the short size of the review, the references will be far from exhaustive). Typical values of various material properties of lipid membranes (in fluid and gel phases) deduced from such studies are given in . In the following sections, we shortly introduce fundamental membrane material properties and provide a summary of the available practical methods for assessing them. We also indicate advantages and limitations of these methods. Finally, we discuss the application of electric fields to assess membrane area stored in fluctuations and address one last membrane property that is unique for the application of electric fields, namely increased membrane permeation, i.e. electropermeability.
Table 1. Typical membrane material properties of lipid membranes in the fluid and gel phases deduced from manipulation of GUVs. Example techniques used to assess these properties are indicated with emphasis on approaches employing electric fields. For more references with data on specific properties, see respective sections.
2 Membrane bending rigidity
The membrane bending rigidity () defines the energy needed to change membrane curvature. It can be assessed using diverse approaches based on microscopy observation of GUVs such as fluctuation spectroscopy (see e.g [Citation40–43].) and response to external stimuli (for a review see [Citation44]). The latter approach includes employing electric fields, e.g. alternating current (AC) or direct current (DC) electric square pulses applied to a quasi-spherical vesicle to create a mechanical force. This force gently pulls area stored in suboptical membrane undulations and deforms the GUVs into ellipsoids. Shape deformation and relaxation of vesicles can then be analyzed to extract membrane bending rigidity.
2.1 Bending rigidity from vesicle electrodeformation
Vesicle electrodeformation to assess membrane bending rigidity is an experimentally less-demanding method compared to approaches, which rely on complex setups, for example, micropipettes (requiring very precise measurement of the differential pressure in the region of small membrane tensions) or optical tweezers (see overview in [Citation44]). In this approach, GUVs are exposed to an uniform AC field. This generates electrical stresses in the membrane suppressing thermal undulations and deforming a quasi-spherical vesicle into ellipsoid shapes [Citation45–48], see . In the experiments, the field frequency generally ranges between 1 and 300 kHz and the field amplitude is increased stepwise typically by 0.4–1 kV/m when the suspending medium contains 1 mM NaCl (note that for low conductivity solutions low frequency can cause poration [Citation49], which should be avoided). The electric stress induced on the membrane is known to depend quadratically on the amplitude of the applied electric field [Citation46,Citation50]. The flattening of the membrane fluctuations triggers an increase in the apparent area of the vesicle [Citation40,Citation45,Citation46,Citation51]:
Figure 1. Membrane bending rigidity obtained from different types of vesicle electromanipulation. (a) Electrodeformation of giant vesicles subjected to an AC field. Upper panel: Phase contrast images of a GUV at 300 kHz and field amplitudes of 2, 10 and 20 kV/m (left to right). The scale bar corresponds to 25 µm. Reproduced from [Citation40]. Lower panel: Change in the area of a GUV as a function of increasing electric field strength (the field strength is in V/m, and the curvatures in 1/m). From the slope of the data (solid line), one obtains the bending rigidity following EquationEq. (1)(1) . Adapted from supplementary material of [Citation51]. (b) Relaxation of GUVs exposed to a DC pulse. Upper panel: The shape factor
is shown in real time for 8 different vesicles denoted by different colors; time zero corresponds to the end of the DC pulse. The insert shows a sketch of a GUV deformed into a prolate ellipsoid and the two vesicle semi axes
and
(the field direction is along
). Lower panel: Time normalization (by
see text and [Citation58] for notations) and translation by a constant leads to collapse of the data form all 8 vesicles. The solid curve is the theoretical prediction in [Citation58]. The bending rigidity is calculated from the intial part of the relaxation curve, also referred to as ‘entropic’ regime. Reprinted with permission from [Citation58] Copyright (2015) by the American Physical Society.
![Figure 1. Membrane bending rigidity obtained from different types of vesicle electromanipulation. (a) Electrodeformation of giant vesicles subjected to an AC field. Upper panel: Phase contrast images of a GUV at 300 kHz and field amplitudes of 2, 10 and 20 kV/m (left to right). The scale bar corresponds to 25 µm. Reproduced from [Citation40]. Lower panel: Change in the area of a GUV as a function of increasing electric field strength (the field strength is in V/m, and the curvatures in 1/m). From the slope of the data (solid line), one obtains the bending rigidity following EquationEq. (1)(1) . Adapted from supplementary material of [Citation51]. (b) Relaxation of GUVs exposed to a DC pulse. Upper panel: The shape factor is shown in real time for 8 different vesicles denoted by different colors; time zero corresponds to the end of the DC pulse. The insert shows a sketch of a GUV deformed into a prolate ellipsoid and the two vesicle semi axes and (the field direction is along ). Lower panel: Time normalization (by see text and [Citation58] for notations) and translation by a constant leads to collapse of the data form all 8 vesicles. The solid curve is the theoretical prediction in [Citation58]. The bending rigidity is calculated from the intial part of the relaxation curve, also referred to as ‘entropic’ regime. Reprinted with permission from [Citation58] Copyright (2015) by the American Physical Society.](/cms/asset/c913cfd7-0d5e-4992-83ef-3c663f934364/tapx_a_2125342_f0001_oc.jpg)
where is the projected surface area of the vesicle,
is the initial vesicle area,
is the Boltzmann constant,
is the temperature,
is the electric field and the curvatures at the equator (
) and pole (
) of the vesicle are
,
,
,
and
are the vesicle semi-axes along and perpendicular to the field direction (see sketch in );
refers to a constant frequency-dependent factor. Thus, the membrane bending rigidity
can be obtained from the slope of the plot of the logarithmic term as a function of the area change
, see . The theory for vesicle electrodeformation has been developed in [Citation52–55].
Among others, the method has been employed to quantify the effect of cholesterol on the bending rigidity of membranes prepared from binary mixtures of cholesterol with dioleoylphosphatidylcholine (DOPC) or with sphingomyelin [Citation40]. The effect was found specific to lipid structure: the bending rigidity of DOPC-based membranes was not altered by cholesterol while sphingomyelin-based ones become softer with increasing cholesterol fraction [Citation40]. The bending rigidity of phase-heterogeneous membranes such as GM1-doped ones, exhibiting gel-like domains in fluid environment, have also been explored through fluctuation analysis, vesicle electrodeformation and micropipette aspiration [Citation51]. Both fluctuation spectroscopy and vesicle electrodeformation experience the signature of the gel-like domains while the micropipette aspiration technique only allowed exploring the rigidity of the fluid phase. Recently, we utilized the electrodeformation method to measure the bending rigidity of asymmetric vesicles exhibiting tubes. This system is difficult to characterize using conventional methods such as flickering spectroscopy due to lack of excess area for fluctuations. These asymmetric membranes were found to be stiffer than symmetric ones [Citation45].
GUV electrodeformation is a very practical and easy to implement method for measuring the membrane bending rigidity. Compared to the micropipette aspiration technique, it can access more easily and probe more extensively the low tension regime, because tension changes can be applied and regulated more finely with the electric field. However, the electrodeformation approach also has some limitations. It cannot be applied for analysis of membranes containing charged lipids (such as phosphatidylserine or phosphatidylglycerol) or vesicles prepared in solutions of high salt concentrations (where the field is screened). Accumulation of excess charges and absorbance of ions on the membrane surface resulting in transmembrane asymmetry and spontaneous curvature effects [Citation56,Citation57], could be enhanced at the vesicle poles upon electric field application, which may interfere in the analysis.
2.2 Bending rigidity from vesicle relaxation dynamics after the application of DC pulses
Bending rigidity can also be deduced from the relaxation dynamics of giant vesicles after application of square DC pulses [Citation58]. In this approach, a spherical vesicle is exposed to a strong DC field of 100–160 kV/m amplitude and duration of 50–100 µs, which causes the vesicle to deform into an ellipsoid. After switching off the electric field, the ellipsoidal vesicle relaxes back to a sphere. The ellipticity of a vesicle is defined by the shape factor . The relaxation process is governed by the membrane bending rigidity
, and the medium viscosity
, and depends on the initial tension
and the radius
of the particular vesicle. At large deformation (high
), the relaxation is entropy driven followed by a regime of constant tension at lower values of the shape factor
. Yu et al. [Citation58] demonstrated that upon normalizing the time by
, the relaxation follows a unique solution. The values of both
(to calculate
) and
can be obtained by minimizing the error between data sets from different vesicles and the theoretical solution. The time normalization coupled with translation allows collapsing the data from different vesicles (with different radii and initial tensions) into a master curve, see , lower panel. The theoretical predictions were validated with experimental results from the relaxation dynamics of cholesterol-doped vesicles. The model is applicable only for membranes with moderate surface shear viscosity.
3 Edge tension from pore dynamics
Upon pore formation, the edge tension is the energetic cost per unit length of the pore rim to reorient the amphiphilic lipid molecules and shield the hydrophobic bilayer core from water. The edge tension can be determined from monitoring the closing of micron-sized pores (macropores) induced by the application of strong DC pulses on GUVs [Citation59–61].
The theoretical model describing pore dynamics in giant vesicle was introduced by Brochard-Wyart et al. [Citation62,Citation63], who considered the interplay of pore opening and leak-out of internal solution caused by the Laplace pressure. The pore evolution was found to consist of four successive stages [Citation62–64]: (i) fast growth, in which the pore nucleates and then opens exponentially, (ii) the pore reaches its maximum radius followed by (iii) a quasi-static leak-out, in which the internal solution of the vesicle slowly leaks through the pore, and finally (iv) fast closure, during which the size of the pore becomes very small while the pore closes at a constant velocity. Within these four stages, the quasi-static leak-out (stage three) covers the majority of the pore lifetime. The theoretical model describing the third leak-out stage sets the basis of a fast and easily applicable experimental method for deducing the membranes edge tension [Citation59], see . In this method, a strong DC pulse, either millisecond long (20–80 kV/m for 5 ms) or shorter (300 kV/m for 150 μs), can be applied to induce micron-sized pores in GUVs. These macropores are then monitored under a phase contrast microscope using fast camera imaging and pore sizes are determined. According to the hydrodynamic model, in the third leak-out regime, the porated region described by the quantity shows a linear decrease as a function of time [Citation62]:
Figure 2. Pore edge tension analysis. (a) Response of a POPC GUV exposed to a DC pulse (3 kV/cm, 150 μs). Macropores are first visualized in the third frame. The field direction is illustrated with a white arrow. The scale bar is 10 µm. Reproduced from [Citation59]. (b) Characterization of the porated region time dependence of another vesicle shown in the insert (phase contrast image and binarized image of the right vesicle half). The red open circles show experimental data. The solid line is a linear fit and the edge tension is deduced from its slope following the dependence in EquationEq. (2)(2) . Adapted from Biophys. J., 99, T. Portet and R. Dimova,A new method for measuring edge tensions and stability of lipid bilayers: effect of membrane composition, pp. 3264–3273, Copyright (2010), with permission from Elsevier. (c) Main window of the pore edge tension analysis software PoET illustrating the experimental setting and a processed video in the left panel with detected pore rim and indicated pore diameter. Reproduced from [Citation61].
![Figure 2. Pore edge tension analysis. (a) Response of a POPC GUV exposed to a DC pulse (3 kV/cm, 150 μs). Macropores are first visualized in the third frame. The field direction is illustrated with a white arrow. The scale bar is 10 µm. Reproduced from [Citation59]. (b) Characterization of the porated region time dependence of another vesicle shown in the insert (phase contrast image and binarized image of the right vesicle half). The red open circles show experimental data. The solid line is a linear fit and the edge tension is deduced from its slope following the dependence in EquationEq. (2)(2) . Adapted from Biophys. J., 99, T. Portet and R. Dimova,A new method for measuring edge tensions and stability of lipid bilayers: effect of membrane composition, pp. 3264–3273, Copyright (2010), with permission from Elsevier. (c) Main window of the pore edge tension analysis software PoET illustrating the experimental setting and a processed video in the left panel with detected pore rim and indicated pore diameter. Reproduced from [Citation61].](/cms/asset/8acbe374-3365-4c1e-832d-222529325f41/tapx_a_2125342_f0002_oc.jpg)
Here is the GUV radius,
is the current pore radius,
is time,
is viscosity of the solution and
is the edge tension. Thus, the edge tension can be deduced from the slope of the time dependence of
, . The relatively fast process of pore closure (in the range of a few hundred milliseconds) requires fast digital imaging (e.g. at 1000 frames per second) to resolve the pore for edge tension analysis. This yields hundreds of images for analysis. Leomil et al. [Citation61] designed a user-friendly, free and open-source software (PoET) in Python for completely automated image processing for edge tension analysis, see . The method was applied to investigate the role of cholesterol and charged lipids on pore stability as well as medium conditions such as the presence of ions, GM1 or detergents affecting the edge tension [Citation59–66].
This experimental approach cannot be applied to deflated or tubulated vesicles, and in principle to vesicles, which deform excessively. Pore closure should not be obstructed and the method is not applicable to multilamellar vesicles either.
The edge tension can also be roughly estimated from the macropore lifetime and size provided that knowledge of the membrane viscosity is available [Citation67]. In this approach, the pore lifetime is described to depend on the pore size as where
is the membrane viscosity, and
is the maximal pore radius. The edge tension can be then obtained from the slope of pore radius versus pore lifetime plot [Citation62,Citation67].
4 Membrane capacitance
Lipid bilayers are impermeable to ions. Application of an electric field leads to accumulation of charges near the membrane surfaces. Thus, the membranes act as a capacitor shielding the cell content from an external electric field. However, charging of the bilayer occurs in a finite time interval and during this period, the cell interior is exposed to the field. This can destabilize the structural integrity and lead to cell death. Hence, accurate knowledge of the charging time, which depends on the membrane capacitance, is desirable. Various methods exist to measure membrane capacitance, for example patch-clamp and dielectrophoresis [Citation68–71]. However, complex analysis and low throughput have limited the application of such methods. A simpler GUV-based method was introduced in [Citation72]. If the solution conductivity inside the vesicle is less than that outside, the GUV experiences a prolate to oblate shape transition under AC electric field as the frequency is increased [Citation47,Citation48,Citation52]. The critical frequency, , of this transition can be used to extract the membrane capacitance [Citation47,Citation72]
where is the size of the vesicle,
is the ratio between solution conductivity inside to outside. The critical frequency,
, can be determined from performing a frequency sweep, as shown in , and with all other parameters set experimentally, the membrane capacitance,
, can be determined from EquationEq. (3)
(3) non-invasively. Using this approach, it was found that increasing the sugar concentration in solutions increases the bilayer capacitance [Citation73,Citation74]. Faizi et al. [Citation45] developed the method further by showing that the same data in can be used to simultaneously determine membrane capacitance and bending rigidity in one step. Like the classical Kummrow-Helfrich electrodeformation method [Citation46], instead of plotting the area strain as a function of electric field strength at a fixed frequency like in or also (lower panel), the plot of area strain with frequency dependent prolate shape at a fixed field strength can also be utilized to yield the bending rigidity, as given in . Both approaches yield the same bending rigidity but the frequency-dependent analysis yields capacitance and bending rigidity simultaneously. The method has higher accuracy for thicker membranes. At low frequencies, electrokinetic flows may arise causing vesicle motion, and thus hindering the experiments.
Figure 3. Electrodeformation of GUVs to measure membrane capacitance. (a) Frequency-dependent deformation of a POPC vesicle exposed to a uniform AC electric field at kV/m. The critical frequency
is used to determine the membrane capacitance from EquationEq. (3)
(3) . (b) Area strain dependence on the applied electric field strength for the same vesicle in (A) at a fixed frequency 0.2 kHz. The size of the vesicle is
26
m and the conductivity ratio is
. The electric field amplitude is changed from 2 to 10 kV/m in steps of 0.25 kV/m. The obtained bending rigidity is 12.67
. (c) Area strain dependence on the applied field frequency at a fixed field strength 6 kV/m. The expression of the electric stress
can be found in [Citation45]. The data is fitted in the prolate regime,
, from panel (A). The obtained bending rigidity is 14.97
. Reproduced from [Citation45] by permission of John Wiley and Sons.
![Figure 3. Electrodeformation of GUVs to measure membrane capacitance. (a) Frequency-dependent deformation of a POPC vesicle exposed to a uniform AC electric field at kV/m. The critical frequency is used to determine the membrane capacitance from EquationEq. (3)(3) . (b) Area strain dependence on the applied electric field strength for the same vesicle in (A) at a fixed frequency 0.2 kHz. The size of the vesicle is 26 m and the conductivity ratio is . The electric field amplitude is changed from 2 to 10 kV/m in steps of 0.25 kV/m. The obtained bending rigidity is 12.67 . (c) Area strain dependence on the applied field frequency at a fixed field strength 6 kV/m. The expression of the electric stress can be found in [Citation45]. The data is fitted in the prolate regime, , from panel (A). The obtained bending rigidity is 14.97 . Reproduced from [Citation45] by permission of John Wiley and Sons.](/cms/asset/108eb3ba-2e1e-4ad2-b0ae-52b37fe17369/tapx_a_2125342_f0003_oc.jpg)
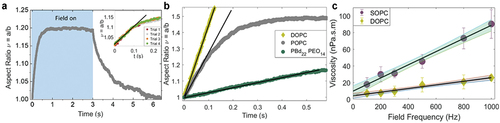
5 Surface shear viscosity
Self-assembled lipids in bilayer membranes are held together by non-covalent bonds. As a result, a bilayer behaves as a two-dimensional viscous fluid to in-plane deformation. Viscosity is a key property of cell membranes that influences transport of biomolecules and membrane remodeling. Experimentally measuring the membrane viscosity using GUVs has remained challenging due to complex experimental designs and models with complicated analysis, e.g. see for review [Citation75]. The implementation of some methods is limited to few specific membrane compositions; for example domain-based methods are limited to phase separated membranes and diffusion-based methods are probe dependent [Citation76–79]. Recently, Faizi et al. [Citation75] demonstrated that membrane viscosity can be obtained from transient deformation of GUVs in electric fields. The method is non-invasive, high throughput, probe independent and able to measure membrane viscosity of a wide range of compositions and phase state. Briefly, upon application of a uniform electric field, a quasi-spherical vesicle at conductivity condition deforms into a prolate ellipsoid, . The method analyzes the initial deformation rate of the vesicle aspect ratio,
, as the AC electric field is turned on at a particular frequency
, see . The slope depends on the membrane viscosity:
Figure 4. Electrodeformation of GUVs as a method to measure membrane viscosity. (a) A uniform AC electric field deforms a GUV into a prolate ellipsoid as shown by the evolution of the aspect ratio Here, time zero refers to turning on the field. The inset shows that repeated deformation of the same GUV does not alter the membrane structure. (b) Vesicles made of different composition (DOPC, POPC, and diblock-copolymer) deform at a different rate revealing different shear viscosities; the field strength and frequency are 8 kV/m and 1 kHz. (c) Viscosity measured at different frequencies at a fixed field strength. Extrapolation to the vertical intercept yields the zero-frequency shear viscosity corresponding to the viscosity in the absence of field. Reprinted from Biophys. J. 121, H.A. Faizi, R. Dimova, P.M. Vlahovska, A vesicle microrheometer for high-throughput viscosity measurements of lipid and polymer membranes, pp. 910–918 Copyright (2022), with permission from Elsevier.
where is the characteristic rate-of-strain imposed by the electric field with
being the permittivity of the solution, and
is the dimensionless surface viscosity,
and
are the viscosities of the membrane and the bulk solution; the expression of the electric stress
can be found in [Citation75]. The apparent viscosities are measured at different frequencies in the range 0.1–1 kHz. Linear extrapolation yields the zero-frequency viscosity, which corresponds to the viscosity in the absence of electric field (). The data provided new insights into the relation between membrane viscosity, composition, and structure [Citation75]. The only current limitation of the method is that it is not yet developed to probe charged membranes.
6 Assessing membrane area stored in fluctuations
Vesicle shapes are defined by the membrane spontaneous curvature and the ratio of the vesicle area and volume [Citation80,Citation81]. Chemical and physical triggers such as temperature [Citation80], osmotic deflation/inflation [Citation82], light [Citation83,Citation84], incorporation of amphiphilic molecules [Citation85,Citation86] and fusion [Citation87] can change the membrane surface area, see examples in . When excess membrane area is stored in fluctuations or protrusions in the form of buds or tubes, manipulation techniques are needed to quantify the area changes. The two common methods to resolve the excess area stored in thermal fluctuations are micropipette aspiration and AC-field electrodeformation of GUVs, the latter being easier in terms of experimental implementation, as discussed in detail below. Furthermore, the application of a weak DC field to a vesicle resting on an electrode (for example, indium tin oxide coated glass) can be used to pull out fluctuations. The vesicle overall shape and contact curvature detected with confocal microscopy (see ) can be used to assess the adhesion energy and membrane tension [Citation88].
Figure 5. Vesicle electrodeformation and assessment of hidden area stored in membrane fluctuations. (a,b) Modulating vesicle adhesion by DC field. Confocal vertical cross sections of a non-adhering (a) and adhered (b) GUV (green). The scale bar represents 20 µm. Upon switching on the field, the vesicle adheres to the electrode (red) viewed in reflection. White arrows point to the contact curvature (left arrows) and membrane undulations (right). Undulations get suppressed after applying the DC field (1 V) in panel (b). (a,b) Reprinted from Biophys. J. 111, J. Steinkühler, J. Agudo-Canalejo, R. Lipowsky and R. Dimova, Modulating vesicle adhesion by electric fields, pp. 1454–1464, Copyright (2016), with permission from Elsevier [Citation88]. (c) Area increase and budding of a vesicle caused by photo-isomerization of an azo-benzene derivative (F-azo) incorporating in the membrane upon UV-light irradiation (purple region in graph). The area increase is assessed from simultaneous application of an AC field (10 kV/m, 1 MHz). Phase contrast images and degree of deformation plots over time are shown for 0.25 mM F-azo. The time stamps are indicated on the images upper left corners; 0 corresponds to turning the field on. The UV irradiation (violet region in the plot) starts after 7.1 s (). The scale bar is 10 μm. Reproduced from [Citation83]. (d-f) GUV area increase caused by insertion of Triton TX-100 just before membrane solubilization. Phase contrast sequences of POPC (d) and POPC/cholesterol (e) GUVs under an AC field (20 kV/m, 200 kHz) after addition of an aliquot of a concentrated Triton X-100 solution (80 mM). Scale bars are 10 μm. (f) Relative area increase (ΔA/A0) measured from the maximum aspect ratio using EquationEq. (5)
(5) displayed by the vesicle before contrast loss and membrane solubilization. Each data point represents one GUV. Mean values with standard deviation are shown in green. (d-f) Adapted with permission from Langmuir, 31, 378–386, B. Mattei, A.D.C. França, K.A. Riske,Solubilization of Binary Lipid Mixtures by the Detergent Triton X-100: The Role of Cholesterol. Copyright 2015 American Chemical Society.
![Figure 5. Vesicle electrodeformation and assessment of hidden area stored in membrane fluctuations. (a,b) Modulating vesicle adhesion by DC field. Confocal vertical cross sections of a non-adhering (a) and adhered (b) GUV (green). The scale bar represents 20 µm. Upon switching on the field, the vesicle adheres to the electrode (red) viewed in reflection. White arrows point to the contact curvature (left arrows) and membrane undulations (right). Undulations get suppressed after applying the DC field (1 V) in panel (b). (a,b) Reprinted from Biophys. J. 111, J. Steinkühler, J. Agudo-Canalejo, R. Lipowsky and R. Dimova, Modulating vesicle adhesion by electric fields, pp. 1454–1464, Copyright (2016), with permission from Elsevier [Citation88]. (c) Area increase and budding of a vesicle caused by photo-isomerization of an azo-benzene derivative (F-azo) incorporating in the membrane upon UV-light irradiation (purple region in graph). The area increase is assessed from simultaneous application of an AC field (10 kV/m, 1 MHz). Phase contrast images and degree of deformation plots over time are shown for 0.25 mM F-azo. The time stamps are indicated on the images upper left corners; 0 corresponds to turning the field on. The UV irradiation (violet region in the plot) starts after 7.1 s (image 2A). The scale bar is 10 μm. Reproduced from [Citation83]. (d-f) GUV area increase caused by insertion of Triton TX-100 just before membrane solubilization. Phase contrast sequences of POPC (d) and POPC/cholesterol (e) GUVs under an AC field (20 kV/m, 200 kHz) after addition of an aliquot of a concentrated Triton X-100 solution (80 mM). Scale bars are 10 μm. (f) Relative area increase (ΔA/A0) measured from the maximum aspect ratio using EquationEq. (5)(5) displayed by the vesicle before contrast loss and membrane solubilization. Each data point represents one GUV. Mean values with standard deviation are shown in green. (d-f) Adapted with permission from Langmuir, 31, 378–386, B. Mattei, A.D.C. França, K.A. Riske,Solubilization of Binary Lipid Mixtures by the Detergent Triton X-100: The Role of Cholesterol. Copyright 2015 American Chemical Society.](/cms/asset/c29a3ffc-6f91-40e8-8870-1141ff67cbd2/tapx_a_2125342_f0005_oc.jpg)
For freely suspended GUVs, whose internal solution has higher conductivity than the external one, moderate AC fields pull out the excess membrane area stored in thermal fluctuations by deforming the vesicles into prolate ellipsoids [Citation48]. The vesicle surface area, can be then calculated from measuring the vesicle semi-axes:
This approach was used to quantify the area increase from fusion of small cationic liposomes to anionic GUVs and quantify the efficiency of a newly developed method for protein-free fusion [Citation87]. Light-induced shape changes and membrane mechanics of GUVs was evaluated via electrodeformation under photodamage in the presence of lipids with a porphyrin group [Citation89], methylene blue [Citation85] and azobenzene-containing photoswitchable molecules [Citation83,Citation84,Citation90] (), establishing a platform for reversible light-induced modulation of membrane shape and mechanics. Electrodeformation of GUVs allowed also the quantitatively montior the dynamics of incorporation of the detergent Triton X-100 into membranes of different compositions [Citation86], see .
There are some requirements for applying GUV electrodeformation to assess membrane area changes. The membrane should not be in the gel phase or permeable to ions, otherwise the vesicle will not deform under electric field. When GUVs undergo large deformations, they may attain non-elliptical shapes and form buds and tubes at the poles (as in , image 4a). In such cases, the area increase cannot be calculated by the expression for an ellipsoid EquationEq. (5)(5) .
7 Membrane electropermeabilization and stability
Lipid membranes are permeable to water but practically impermeable to ions, hydrophilic molecules and nanoparticles (permeability to water can be directly measured on GUVs, see e.g [Citation91]). Electric fields are used to enhance membrane permeability to these species, by opening pores in the membrane (as demonstrated above for micron-sized pores). Membrane stability during electroporation is of crucial importance for the optimization of applications in medicine [Citation92,Citation93] and food processing [Citation16]. Loss of membrane integrity can be associated with formation of a pore, which can continue to expand until the vesicle collapses, i.e. vesicle bursting [Citation60,Citation94]. The vesicle response could also consist of developing long-lived submicroscopic pores while restoring the spherical vesicle shape [Citation95,Citation96]. These pores allow the transport of molecules that would otherwise not cross the membrane, i.e. electropermeabilization. Poration occurs above a critical tension called lysis tension (see example values in ). It is typically assessed by micropipette aspiration of vesicles [Citation97]. Vesicle electroporation can also serve to estimate the lysis tension [Citation59,Citation98].
7.1 Membrane instability and vesicle bursting in electric fields
Membrane stability in electric fields is sensitive to composition, especially presence of charged lipids, and phase state. Lira et al. [Citation60] studied the influence of medium and lipid charge on the stability of multicomponent GUVs in more detail. Upon exposure to shorter DC pulses (300 kV/m, 150 µs), negatively charged GUVs exhibited complete or partial bursting, or gradual permeation through submicroscopic pores, see . Both partially and completely bursting vesicles revealed internal and external tubes. The latter are a signature of membrane asymmetry (and substantial spontaneous curvature [Citation99]) which could result from the asymmetric distribution of charged lipids in the membrane [Citation57].
Figure 6. Evaluation of membrane stability through electroporation and electropermeabilization. Examples of bursting vesicles observed under phase contrast (a) and epifluorescence (b) microscopy. (c) Phase-contrast images of an electropermeabilized vesicle showing macropore closure but loss of optical contrast over time because of remaining submicroscopic pores. The GUVs were subjected to a DC pulse (300 kV/m, 150 μs). The field direction is indicated with an arrow. The scale bars are 10 µm. The time relative to the beginning of the pulse is shown on each snapshot. (a,b and c) are reproduced from [Citation60]. (d) Differential interference contrast (a, d) and confocal (b, c, e, f) images of vesicles forming cracks and wrinkles (folds) after exposure to a DC pulse (600 kV/m, 300 μs). The folds and cracks are indicated with arrows. The electrode polarity is indicated with a plus and a minus sign in (a). Images are reproduced from [Citation107].
![Figure 6. Evaluation of membrane stability through electroporation and electropermeabilization. Examples of bursting vesicles observed under phase contrast (a) and epifluorescence (b) microscopy. (c) Phase-contrast images of an electropermeabilized vesicle showing macropore closure but loss of optical contrast over time because of remaining submicroscopic pores. The GUVs were subjected to a DC pulse (300 kV/m, 150 μs). The field direction is indicated with an arrow. The scale bars are 10 µm. The time relative to the beginning of the pulse is shown on each snapshot. (a,b and c) are reproduced from [Citation60]. (d) Differential interference contrast (a, d) and confocal (b, c, e, f) images of vesicles forming cracks and wrinkles (folds) after exposure to a DC pulse (600 kV/m, 300 μs). The folds and cracks are indicated with arrows. The electrode polarity is indicated with a plus and a minus sign in (a). Images are reproduced from [Citation107].](/cms/asset/57d084f8-4a7c-4cc8-926e-4756fc0e38bd/tapx_a_2125342_f0006_b.gif)
Stability of pores strongly depends on the composition, molecular shape and chain saturation of the lipids in the membrane as well as the presence of salts and other solutes in the GUV internal and external solutions [Citation59,Citation60,Citation100,Citation101]. Incorporation of cone-shaped molecules such as phosphatidylinositol [Citation101], GM1 ganglioside [Citation66,Citation102], detergent Tween20 [Citation64] and α-hemolysin [Citation103] are reported to increase the lifetime of macropores whereas inverted-cone shape molecules such as cholesterol [Citation64] and phosphatidylethanolamine [Citation101] reduce the electroporation threshold and result in shorter pore lifetimes. Studies with actin filaments [Citation104,Citation105] and agarose hydrogels [Citation100,Citation106] present in the membrane vicinity demonstrated that such polymer networks slow down the resealing process of macropores and result in more permeabilized GUVs.
Vesicle stability under the influence of electric pulses has been explored also for membranes in the gel phase. Because of the increased stiffness and toughness of these membranes (see ), stronger field strength (roughly fivefold) is needed to deform such vesicles compared to those with membrane in the fluid state [Citation107]. Furthermore, gel-phase vesicles undergo intra-pulse shape relaxation and exhibit wrinkles parallel to the field direction. Exposure to even stronger DC pulses, induces membrane cracks leading to irreversible rupture of the gel-phase vesicles, see , whereby requiring much higher transmembrane potentials for poration compared to fluid-phase vesicles [Citation107], see also .
Perrier et al. [Citation108] took the electroporation studies with gel-phase vesicles one step further by investigating GUVs exhibiting gel and fluid phase coexistence. Exposure of such vesicles with domain to porating electric pulses resulted in expelling fluid-phase lipids and associated decrease in vesicle size (this effect was observed earlier also for completely fluid vesicles exposed to repeated pulses [Citation109]). Furthermore, the gel-phase domains were observed to buckle [Citation108], consistently with the wrinkling detected in entirely gel-phase membranes [Citation107], see .
The limitations of such observations is imposed by the resolution of detail that can be detected for the membrane restructuring. On the one hand, while observations under transmission microscopy (e.g. phase contrast or bright field) can reach unprecedented speed of 20,000 frames per second (fps), they are not able to resolve the resulting membrane structures. On the other hand, epifluorescence and confocal microscopy have improved resolution, especially in the porated area, which can restructure into lipid nanotubes, but these approaches are significantly slower with acquisition frequency of maximum around 300 fps and 30 fps, respectively. None of the currently available imaging approaches allows for live detection of nano-sized pores in the membrane.
7.2 Quantifying membrane electropermeabilization
Vesicle electropermeabilization reflects the long-term stability and the dynamic structural changes in the membrane after exposure to DC pulses. When membrane components are reorganized or chemically modified by the electric field, submicroscopic defects can develop, affecting the structural integrity of the lipid bilayer and leading to increased membrane permeabilization [Citation95,Citation110]. Recent studies demonstrated that electric-field induced chemical modifications are particularly triggered in unsaturated lipids due to peroxidation [Citation111–113]. Strong electric fields can generate reactive oxygen species in the vesicle media, which can initiate multistep oxidative damage mechanisms on unsaturated lipids thus prompting the phospholipids to undergo primary or secondary oxidation. These changes enable the influx and efflux of ions, small molecules or even macromolecules such as nucleic acids [Citation114]. In the absence of chemical changes, transport of molecules in electropermeabilized membranes is not completely diffusive [Citation115–117]; electrostatic interactions of the transported molecules with the membrane and pore interface play a significant role in the kinetics of electropermeabilization. In order to assess electropermeabilization dynamics of GUVs, a number of imaging and characterization techniques including phase contrast, epifluorescence and confocal microscopy, amperometry, patch clamp, electrochemiluminescence and coherent anti-Stokes Raman scattering (CARS) microscopy have been applied previously [Citation60,Citation66,Citation68,Citation100,Citation118–121].
One of the least demanding methods to visualize membrane permeability in GUVs is to generate a sugar asymmetry between the interior and exterior solutions by dispersing GUVs grown in sucrose solution into iso-osmolar glucose solution and monitor the associated contrast [Citation122–124]. The refractive index difference between the two media results in the generation of a sharp vesicle contour under phase contrast microscopy, see first image in . Upon the formation of electric-field induced submicroscopic pores, the sharp optical contrast decreases in time due to the passage of sugar molecules across the membrane. This membrane leakage can be characterized through analysis of the intensity profile of a line crossing the vesicle [Citation60,Citation100,Citation121,Citation125]. Similarly to sugars, various aqueous fluorescent dyes and/or labeled macromolecules such as dextran and nucleic acids can also be added in the external or internal GUV media for monitoring electropermeation dynamics under epifluorescence or confocal microscopy [Citation100,Citation104,Citation126], see . For example, sulforhodamine B (SRB) was encapsulated in GUVs immobilized in agarose gel to monitor diffusion kinetics [Citation100]. The fluorescence signal of SRB added to the external vesicle solution was used to investigate the electric-field response of GUVs encapsulating actin cortex mimetic [Citation104]. Addition of calcein to the outer media of GUVs exposed to a train of ultrashort unipolar and bipolar nanosecond pulses allowed comparison to the response of cells through experimental and simulation data [Citation127]. Leakage and long-term stability of GUVs doped with GM1 has also been characterized by adding calcein to the outer vesicle solution [Citation66]. In addition to assessing long-term electropermeation kinetics of GUVs, labeled molecules of different sizes can be used to estimate the size of the nanopores in the electropermeabilized membrane [Citation60].
Figure 7. Electropermeabilization monitored with different approaches. (a) GUV internalization of dyes introduced at different times (before pulse, t ≈ 0, and 5–10 min after macropore resealing) reveals three types of vesicle response (membrane in red): pores reseal (no permeation; first column), short-living pores reseal within 1–2 minutes (middle column) and long-living pores persist (last column). Calcein (green) is added prior to poration (time ≈ 0, upper row) and shows the immediate dye permeation occurring in the first 1–2 min after the pulse as well as long-term permeability in the presence of long-living pores (last column). Atto-647 (cyan, lower row) is added 5–10 min after electroporation and reports the presence of long-lived pores only (last column). Scale bars: 20 µm. Reproduced from [Citation60]. (b) Electropermeabilization of a GUV imaged under CARS microscopy. Images N = 1, 10, 20 and 30 are part of a time series acquired with an interval between each image of 310 ms. White arrows indicate nanotubes shed from the GUVs upon electropermeabilization. The yellow arrow indicates the electric field direction. The scale bar is 10 µm. (b) Reprinted from Bioelectrochemistry, 87, C. Mauroy, T. Portet, M. Winterhalder, E. Bellard, M.-C. Blache, J. Teissié, A. Zumbusch, M.-P. Rols, Giant lipid vesicles under electric field pulses assessed by non invasive imaging, pp. 253–259, Copyright (2012), with permission from Elsevier.
![Figure 7. Electropermeabilization monitored with different approaches. (a) GUV internalization of dyes introduced at different times (before pulse, t ≈ 0, and 5–10 min after macropore resealing) reveals three types of vesicle response (membrane in red): pores reseal (no permeation; first column), short-living pores reseal within 1–2 minutes (middle column) and long-living pores persist (last column). Calcein (green) is added prior to poration (time ≈ 0, upper row) and shows the immediate dye permeation occurring in the first 1–2 min after the pulse as well as long-term permeability in the presence of long-living pores (last column). Atto-647 (cyan, lower row) is added 5–10 min after electroporation and reports the presence of long-lived pores only (last column). Scale bars: 20 µm. Reproduced from [Citation60]. (b) Electropermeabilization of a GUV imaged under CARS microscopy. Images N = 1, 10, 20 and 30 are part of a time series acquired with an interval between each image of 310 ms. White arrows indicate nanotubes shed from the GUVs upon electropermeabilization. The yellow arrow indicates the electric field direction. The scale bar is 10 µm. (b) Reprinted from Bioelectrochemistry, 87, C. Mauroy, T. Portet, M. Winterhalder, E. Bellard, M.-C. Blache, J. Teissié, A. Zumbusch, M.-P. Rols, Giant lipid vesicles under electric field pulses assessed by non invasive imaging, pp. 253–259, Copyright (2012), with permission from Elsevier.](/cms/asset/23f1b45c-0b02-4a75-95d0-1bc83eff6830/tapx_a_2125342_f0007_oc.jpg)
Another important application of electropermeabilization of vesicles is that it allows exploring the electric-field-based delivery of genes [Citation128] and nucleic acids [Citation129]. Contradictions between proposed mechanisms of gene and nucleic acid electrotransfer in cells [Citation96,Citation130–132] have made it necessary to simplify the studies through less complex membrane models like GUVs. By staining DNA (fragments) and siRNA, it is possible to monitor their entry in GUVs from confocal images and fluorescence intensity analysis, characterizing the electrophoretic force for DNA translocation [Citation110,Citation133], efficiency or translocation and dependence on pore and DNA size [Citation134,Citation135].
Another effective way of monitoring passive transport of molecules is using patch clamp and amperometry [Citation119]. Messina et al. [Citation118] combined amperometry with the patch clamp technique to investigate the transport of redox-tagged molecules through GUV and cellular membranes, while monitoring patch quality and sealing via electrochemical impedance spectroscopy and measuring the coefficients of partition and diffusion of the redox-tagged molecules. Combining amperometry, epifluorescence imaging and electrochemiluminescence allowed the characterization of release from GUVs ruptured on electrodes via surface polarization [Citation120]. Amperometry has a millisecond range temporal resolution to quantify the release dynamics of electroactive species, however it lacks spatial resolution [Citation136,Citation137]. This can be compensated by combining the method with electrochemiluminescence and epifluorescence imaging. Garten et al. [Citation68] established a technique based on whole-GUV patch-clamping, which allowed investigating how membrane composition and tension modulate permeation through the ion channel gramicidin. The technique holds promises for electrophysiological studies of ion channels and transporters at physiologically relevant range of membrane tensions. Stability of the vesicles in patch-clamp techniques presents a challenge and needs optimization for the specific membrane composition.
Electropermeabilization and lipid loss in the membrane can also be detected through coherent anti-Stokes Raman scattering (CARS) microscopy [Citation96]. This is a dye-free and non-invasive optical technique, in which the samples are monitored by the intrinsic vibrational resonances of the constituting molecules [Citation138]. Mauroy et al. [Citation121] used this technique to investigate the effect of pulse parameters on the membrane permeabilization in terms of lipid loss and shape deformations, see . CARS signals can be collected via a suitably adapted confocal microscope. For lipid bilayers, CH-stretching vibrations are recorded to generate optical contrast [Citation139]. The technique is beneficial in preventing imaging artefacts stemming from the use of fluorescence dyes and enables the visualization of pure lipid bilayers in the absence of any exogenous molecules. However, imaging multicomponent vesicles is very difficult because of overlap of the multiple vibrational bands [Citation138].
8 Outlook
Giant vesicles under the influence of electrical field provide a complete toolbox to probe the membrane elastic, electrical and rheological properties as summarized in . Most of the reviewed methods have been utilized for simple or multi-component bilayers as well as polymer membranes. Climbing up the ladder of bottom-up synthetic biology approaches, the next step would be to probe membranes with increasing complexity. Examples include membranes with several components, including membranes with reconstituted proteins, and cell-derived plasma membranes (blebs) as their compositional and structural complexity closely represents the lipidomics and proteomics of plasma membrane. The electrodeformation methods can be utilized to explore other synthetic systems such as polymersomes, protein condensates and shells, hybrid polymer-lipid vesicles, asymmetric membranes or dendrimersomes with scarcely assessed material properties. Increasing the system complexity will require expanding the theoretical description of some of the approaches to account for charges, both in the membrane and in the solution.
Figure 8. An overview of the spectrum of techniques for assessing membrane material properties and characteristics from exposing giant GUVs to elelctric fields as reviewed in this work: bending rigidity, capacitance, membrane surface shear viscosity, area stored in fluctuations, lysis tension, pore edge tension, permeability and stability after poration.
Despite significant progress in our understanding of the interaction of vesicles with electric fields, there are still open questions. Extreme vesicle shapes such as the transient sharp edges [Citation140] in GUVs remains an unsolved mystery. The electromechanics of biomembranes undergoing phase transition and domain formation remains poorly understood [Citation54,Citation141]. While the effect of intrinsic lipid charges on membrane rigidity is well understood both theoretically and experimentally [Citation142–144], the rheology of charged membranes is not explored. Membrane elastic properties such as rigidity, stretching modulus, tension and spontaneous curvature can all be modulated by the transmembrane potential across the membrane. The theoretical models are limited to planar membranes [Citation145–146], and the experimental verification is lacking.
We close this review by reiterating that the described experimental approaches for characterizing the membrane from monitoring the response of GUVs to electric fields are simple and high throughput. The experimental setup, requiring two electrodes and a standard signal generator, can be easily implemented in a moderately equipped lab. Simple squeezing, tearing, deforming and electrocuting giant vesicles offers facile access to unravelling material characteristics of membranes.
Acknowledgments
M.A. acknowledges support from the International Max Planck Research School (IMPRS) on Multiscale Bio-Systems. H.A.F., P.M.V. and R.D. acknowldege support by the National Science Foundation under grant NSF PHY-1748958. K.A.R. acknowledges financial support of FAPESP (2016/13368-4). P.M.V and H.A.F acknowledge financial support by NIGMS award 1R01GM140461.
Disclosure statement
No potential conflict of interest was reported by the author(s).
Correction Statement
This article has been republished with minor changes. These changes do not impact the academic content of the article.
Additional information
Funding
References
- Lee AG. Biological membranes: the importance of molecular detail. Trends Biochem Sci. 2011;36:493–27.
- Basquin C, Trichet M, Vihinen H, et al. Membrane protrusion powers clathrin-independent endocytosis of interleukin-2 receptor. EMBO J. 2015;34:2147–2161.
- Lee E, Knecht DA. Visualization of actin dynamics during macropinocytosis and exocytosis. Traffic. 2002;3:186–192.
- Schmidtke DW, Diamond SL. Direct observation of membrane tethers formed during neutrophil attachment to platelets or P-selectin under physiological flow. J Cell Biol. 2000;149:719–730.
- Caballero D, Pinto IM, Rubinstein BY, et al. Protrusion membrane pearling emerges during 3D cell division. Phys Biol. 2019;16:066009.
- Davis DM, Sowinski S. Membrane nanotubes: dynamic long-distance connections between animal cells. Nat Rev Mol Cell Biol. 2008;9:431–436.
- Chauveau A, Aucher A, Eissmann P, et al. Membrane nanotubes facilitate long-distance interactions between natural killer cells and target cells. Proc Natl Acad Sci U S A. 2010;107:5545–5550.
- Kandušer M, Ušaj M. Cell electrofusion: past and future perspectives for antibody production and cancer cell vaccines. Expert Opin Drug Deliv. 2014;11:1885–1898.
- Guo-Parke H, McCluskey JT, Kelly C, et al. Configuration of electrofusion-derived human insulin-secreting cell line as pseudoislets enhances functionality and therapeutic utility. J Endocrinol. 2012;214:257–265.
- Davalos RV, Mir LM, Rubinsky B. Tissue Ablation with Irreversible Electroporation. Ann Biomed Eng. 2005;33:223.
- Gothelf A, Mir LM, Gehl J. Electrochemotherapy: results of cancer treatment using enhanced delivery of bleomycin by electroporation. Cancer Treat Rev. 2003;29:371–387.
- Probst U, Fuhrmann I, Beyer L, et al. Electrochemotherapy as a new modality in interventional oncology: a Review. Technol Cancer Res Treat. 2018;17:1–12.
- Chang TT, Zhou VX, Rubinsky B. Using non-thermal irreversible electroporation to create an in vivo niche for exogenous cell engraftment. BioTechniques. 2017;62:229–231.
- André F, Mir LM. DNA electrotransfer: its principles and an updated review of its therapeutic applications. Gene Ther. 2004;11:S33–S42.
- Kim TK, Eberwine JH. Mammalian cell transfection: the present and the future. Anal Bioanal Chem. 2010;397:3173–3178.
- Mahnič-Kalamiza S, Vorobiev E, Miklavčič D. Electroporation in food processing and biorefinery. J Membr Biol. 2014;247:1279–1304.
- Dimova R. Giant vesicles and their use in assays for assessing membrane phase state, curvature, mechanics, and electrical properties. Annu Rev Biophys. 2019;48:93–119.
- Dimova R, Marques C. The Giant Vesicle Book. Boca Raton: Taylor & Francis Group, LLC; 2019.
- Dimova R, Aranda S, Bezlyepkina N, et al. A practical guide to giant vesicles. Probing the membrane nanoregime via optical microscopy. J Phys. 2006;18:S1151–S1176.
- Walde P, Cosentino K, Engel H, et al. Giant vesicles: preparations and applications. ChemBioChem. 2010;11:848–865.
- Fenz SF, Sengupta K. Giant vesicles as cell models. Integr Biol. 2012;4:982–995.
- Perrier DL, Rems L, Boukany PE. Lipid vesicles in pulsed electric fields: fundamental principles of the membrane response and its biomedical applications. Adv Colloid Interface Sci. 2017;249:248–271.
- Dimova R, Riske KA, Aranda S, et al. Giant vesicles in electric fields. Soft Matter. 2007;3:817–827.
- Dimova R, Bezlyepkina N, Jordö MD, et al. Vesicles in electric fields: some novel aspects of membrane behavior. Soft Matter. 2009;5:3201–3212.
- Portet T, Mauroy C, Démery V, et al. Destabilizing giant vesicles with electric fields: an overview of current applications. J Membr Biol. 2012;245:555–564.
- Rawicz W, Olbrich KC, McIntosh T, et al. Effect of chain length and unsaturation on elasticity of lipid bilayers. Biophys J. 2000;79:328–339.
- Tian AW, Capraro BR, Esposito C, et al. Bending stiffness depends on curvature of ternary lipid mixture tubular membranes. Biophys J. 2009;97:1636–1646.
- Sorre B, Callan-Jones A, Manneville J-B, et al. Curvature-driven lipid sorting needs proximity to a demixing point and is aided by proteins. Proc Nat Acad Sci. 2009;106:5622–5626.
- Dimova R, Pouligny B, Dietrich C. Pretransitional effects in dimyristoylphosphatidylcholine vesicle membranes: optical dynamometry study. Biophys J. 2000;79:340–356.
- Meleard P, Gerbeaud C, Pott T, et al. Bending elasticities of model membranes: influences of temperature and sterol content. Biophys J. 1997;72:2616–2629.
- Evans E, Needham D. Physical properties of surfactant bilayer membranes: thermal transitions, elasticity, rigidity, cohesion and colloidal interactions. J Phys Chem. 1987;91:4219–4228.
- Needham D, Evans E. Structure and mechanical properties of giant lipid (DMPC) vesicle bilayers from 20.degree.C below to 10.degree.C above the liquid crystal-crystalline phase transition at 24.degree.C. Biochemistry. 1988;27:8261–8269.
- Aranda-Espinoza H, Bermudez H, Bates FS, et al. Electromechanical Limits of Polymersomes. Physical Review Letters. 2001; 87: 208301.
- Dimova R, Riske KA. Electrodeformation, electroporation, and electrofusion of giant unilamellar vesicles. In: Miklavcic D, editor. Handbook of electroporation. Cham: Springer International Publishing; 2016. p. 1–18.
- Faizi HA, Tsui A, Dimova R, et al. Bending rigidity, capacitance, and shear viscosity of giant vesicle membranes prepared by spontaneous swelling, electroformation, gel-assisted, and phase transfer methods: a comparative study. Langmuir. 2022;38:10548–10557.
- Salipante PF, Vlahovska PM. Vesicle deformation in DC electric pulses. Soft Matter. 2014;10:3386–3393.
- Dimova R, Seifert U, Pouligny B, et al. Hyperviscous diblock copolymer vesicles. Eur Phys J E. 2002;7:241–250.
- Dimova R, Dietrich C, Hadjiisky A, et al. Falling ball viscosimetry of giant vesicle membranes: finite-size effects. Eur Phys J B. 1999; 12: 589–598.
- Heimburg T. The capacitance and electromechanical coupling of lipid membranes close to transitions: the effect of electrostriction. Biophys J. 2012;103:918–929.
- Gracià RS, Bezlyepkina N, Knorr RL, et al. Effect of cholesterol on the rigidity of saturated and unsaturated membranes: fluctuation and electrodeformation analysis of giant vesicles. Soft Matter. 2010;6:1472–1482.
- Brochard F, Lennon JF. Frequency spectrum of the flicker phenomenon in erythrocytes. J Phys. 1975;36:1035–1047.
- Faizi HA, Reeves CJ, Georgiev VN, et al. Fluctuation spectroscopy of giant unilamellar vesicles using confocal and phase contrast microscopy. Soft Matter. 2020;16:8996–9001.
- Pecreaux J, Döbereiner H-G, Prost J, et al. Refined contour analysis of giant unilamellar vesicles. Eur Phys J E. 2004;13:277–290.
- Dimova R. Recent developments in the field of bending rigidity measurements on membranes. Adv Colloid Interface Sci. 2014;208:225–234.
- Faizi HA, Dimova R, Vlahovska PM. Electromechanical characterization of biomimetic membranes using electrodeformation of vesicles. ELECTROPHORESIS. 2021;42:2027–2032.
- Kummrow M, Helfrich W. Deformation of giant lipid vesicles by electric fields. Phys Rev A. 1991;44:8356–8360.
- Yamamoto T, Aranda-Espinoza S, Dimova R, et al. Stability of spherical vesicles in electric fields. Langmuir. 2010;26:12390–12407.
- Aranda S, Riske KA, Lipowsky R, et al. Morphological transitions of vesicles induced by alternating electric fields. Biophys J. 2008;95:L19–L21.
- Harbich W, Helfrich W. Alignment and opening of giant lecithin vesicles by electric fields. Z Naturforschung A. 1979;34:1063–1065.
- Niggemann G, Kummrow M, Helfrich W. The bending rigidity of phosphatidylcholine bilayers: dependences on experimental method, sample cell sealing and temperature. Journal de Physique II. 1995;5:413–425.
- Fricke N, Dimova R. GM1 Softens POPC membranes and induces the formation of micron-sized domains. Biophys J. 2016;111:1935–1945.
- Vlahovska PM, Gracià RS, Aranda-Espinoza S, et al. Electrohydrodynamic model of vesicle deformation in alternating electric fields. Biophys J. 2009;96:4789–4803.
- Hu Y, Vlahovska PM, Miksis MJ. Electrohydrodynamic assembly of colloidal particles on a drop interface. Math Biosci Eng. 2021;18:2357–2371.
- Vlahovska PM. Electrohydrodynamics of Drops and Vesicles. Annu Rev Fluid Mech. 2019;51:305–330.
- Vlahovska PM. Electrohydrodynamics of soft particles: role of the interface. in AIChE Annual Meeting, Conference Proceedings, Philadelphia (PA, USA). 2008.
- Karimi M, Steinkühler J, Roy D, et al. Asymmetric ionic conditions generate large membrane curvatures. Nano Lett. 2018;18:7816–7821.
- Steinkühler J, De Tillieux P, Knorr RL, et al. Charged giant unilamellar vesicles prepared by electroformation exhibit nanotubes and transbilayer lipid asymmetry. Sci Rep. 2018;8:11838.
- Yu M, Lira RB, Riske KA, et al. Ellipsoidal Relaxation of Deformed Vesicles. Phys Rev Lett. 2015;115:128303.
- Portet T, Dimova R. A new method for measuring edge tensions and stability of lipid bilayers: effect of membrane composition. Biophys J. 2010;99:3264–3273.
- Lira RB, Leomil FSC, Melo RJ, et al. To close or to collapse: the role of charges on membrane stability upon pore formation. Adv Sci. 2021;8:2004068.
- Leomil FSC, Zoccoler M, Dimova R, et al. PoET: automated approach for measuring pore edge tension in giant unilamellar vesicles. Bioinf Adv, 2021. 1: p. vbab.;:037.
- Brochard-Wyart F, Gennes PG, Sandre O. Transient pores in stretched vesicles: role of leak-out. Phys A Stat Mech Appli. 2000;278:32–51.
- Sandre O, Moreaux L, Brochard-Wyart F. Dynamics of transient pores in stretched vesicles. Proc Nat Acad Sci. 1999;96:10591.
- Karatekin E, Sandre O, Guitouni H, et al. Cascades of transient pores in giant vesicles: line tension and transport. Biophys J. 2003;84:1734–1749.
- Sabri E, Aleksanyan, M, Brosseau, C, Dimova, R . Effects of solution conductivity on macropore size dynamics in electroporated lipid vesicle membranes. Bioelectrochemistry. 2022;147:108222.
- Aleksanyan M, Lira RB, Steinkühler J, et al. GM1 asymmetry in the membrane stabilizes pores. Biophys J. 2022;121:3295–3302.
- Riske KA, Dimova R. Electro-deformation and poration of giant vesicles viewed with high temporal resolution. Biophys J. 2005;88:1143–1155.
- Garten M, Mosgaard LD, Bornschlögl T, et al. Whole-GUV patch-clamping. Proc Natl Acad Sci U S A. 2017;114:328–333.
- Henslee EA. Review: dielectrophoresis in cell characterization. Electrophoresis. 2020;41:1915–1930.
- Gentet LJ, Stuart GJ, Clements JD. Direct measurement of specific membrane capacitance in neurons. Biophys J. 2000;79:314–320.
- Liu P, Zabala-Ferrera O, Beltramo PJ. Fabrication and electromechanical characterization of freestanding asymmetric membranes. Biophys J. 2021;120:1755–1764.
- Salipante PF, Knorr RL, Dimova R, et al. Electrodeformation method for measuring the capacitance of bilayer membranes. Soft Matter. 2012;8:3810–3816.
- Vitkova V, Mitkova D, Antonova K, et al. Sucrose solutions alter the electric capacitance and dielectric permittivity of lipid bilayers. Colloids and Surfaces A. Colloids Surf A Physicochem Eng Asp. 2018;557:51–57.
- Vitkova V, Yordanova V, Staneva G, et al. Dielectric properties of phosphatidylcholine membranes and the effect of sugars. Membranes. 2021;11:847.
- Faizi HA, Dimova R, Vlahovska PM. A vesicle microrheometer for high-throughput viscosity measurements of lipid and polymer membranes. Biophys J. 2022;121:910–918.
- Adrien, V., G. Rayan, K. Astafyeva, I. Broutin, M. Picard, P. Fuchs, W. Urbach, and N. Taulier. 2022.How to best estimate the viscosity of lipid bilayers. Biophysical Chemistry. 281:106732.
- Cicuta P, Keller SL, Veatch SL. Diffusion of liquid domains in lipid bilayer membranes. J Phys Chem A. 2007;111:3328–3331.
- Sakuma Y, Kawakatsu T, Taniguchi T, et al. Viscosity landscape of phase-separated lipid membrane estimated from fluid velocity field. Biophys J. 2020;118:1576–1587.
- Jahl PE, Parthasarathy R. Assessing the use of ellipsoidal microparticles for determining lipid membrane viscosity. Biophys J. 2021;120:5513–5520.
- Dobereiner H-G, Evans E, Kraus M, et al. Mapping vesicle shapes into the phase diagram: a comparison of experiment and theory. Phys Rev E. 1997;55:4458–4474.
- Lipowsky R. Understanding giant vesicles: a theoretical perspective. In: Dimova R, Marques C, editors. The giant vesicle book. Boca Raton: Taylor & Francis Group, LLC; 2019. p. 73–168.
- Micheletto, Y., N. Silveira, A. Dal-Bó, F. Giacomelli, N. Filho, T. Frizon, C. Marques, and A. Schroder. 2017. Study on the Application of Electric Field to Giant Vesicles Comprised of 1,2-Dilauroyl-Sn-Glycero-3-Phosphatidylcholine Using Optical Fluorescence Microscopy. Materials Research. 20. doi: 10.1590/1980-5373-mr-2016-0700
- Georgiev VN, Grafmüller A, Bléger D, et al. Area increase and budding in giant vesicles triggered by light: behind the scene. Adv Sci. 2018;5:1800432.
- Aleksanyan, M., F. Crea, V. Georgiev, A. Grafmueller, J. Heberle, and R. Dimova (2021). Modulating membrane shape and mechanics by light. EUROPEAN BIOPHYSICS JOURNAL WITH BIOPHYSICS LETTERS. SPRINGER ONE NEW YORK PLAZA, SUITE 4600, 139. NEW YORK, NY, UNITED STATES.
- Mertins O, Bacellar IL, Thalmann F, et al. Physical damage on giant vesicles membrane as a result of methylene blue photoirradiation. Biophys J. 2014;106:162–171.
- Mattei B, França ADC, Riske KA. Solubilization of binary lipid mixtures by the detergent triton X-100: the role of cholesterol. Langmuir. 2015;31:378–386.
- Lira RB, Robinson T, Dimova R, et al. Highly efficient protein-free membrane fusion: a giant vesicle study. Biophys J. 2019;116:79–91.
- Steinkühler J, Agudo-Canalejo J, Lipowsky R, et al. Modulating vesicle adhesion by electric fields. Biophys J. 2016;111:1454–1464.
- Riske KA, Sudbrack TP, Archilha NL, et al. Giant vesicles under oxidative stress induced by a membrane-anchored photosensitizer. Biophys J. 2009;97:1362–1370.
- Erkan-Candag H, Krivic D, Gsell MAF, et al. Characterization of DAG binding to TRPC channels by target-dependent cis–trans isomerization of OptoDArG. Biomolecules. 2022;12:799.
- Bhatia T, Robinson T, Dimova R. Membrane permeability to water measured by microfluidic trapping of giant vesicles. Soft Matter. 2020;16:7359–7369.
- Yarmush ML, Golberg A, Serša G, et al. Electroporation-based technologies for medicine: principles, applications, and challenges. Annu Rev Biomed Eng. 2014;16:295–320.
- Dev SB, Rabussay DP, Widera G, et al. Medical applications of electroporation. IEEE Trans Plasma Sci. 2000;28:206–223.
- Riske KA, Knorr RL, Dimova R. Bursting of charged multicomponent vesicles subjected to electric pulses, Soft Matter. 2009;5:1983–1986.
- Kotnik T, Rems, L, Tarek, M, Miklavčič, D. Membrane electroporation and electropermeabilization: mechanisms and models. Annu Rev Biophys. 2019;48(1):63–91.
- Rols M-P. Electropermeabilization, a physical method for the delivery of therapeutic molecules into cells. Biochim Biophys Acta - Biomembr. 2006;1758:423–428.
- Olbrich K, Rawicz W, Needham D, et al. Water permeability and mechanical strength of polyunsaturated lipid bilayers. Biophys J. 2000;79:321–327.
- Salipante PF, Shapiro ML, Vlahovska PM. Electric field induced deformations of biomimetic fluid membranes. Vol. 16. Compiègne, France: Procedia IUTAM; 2015. p. 60–69.
- Lipowsky R. Spontaneous tubulation of membranes and vesicles reveals membrane tension generated by spontaneous curvature. Faraday Discussions. 2013;161:305–331.
- Lira RB, Steinkühler J, Knorr RL, et al. Posing for a picture: vesicle immobilization in agarose gel. Sci Rep. 2016;6:25254.
- van Uitert I, Le Gac S, van den Berg A. The influence of different membrane components on the electrical stability of bilayer lipid membranes. Biochim Biophys Acta - Biomembr. 2010;1798:21–31.
- Dasgupta R, Miettinen MS, Fricke N, et al. The glycolipid GM1 reshapes asymmetric biomembranes and giant vesicles by curvature generation. Proc Natl Acad Sci U S A. 2018;115:5756–5761.
- Chen S, Yang D, Wen Y, et al. Dysregulated hemolysin liberates bacterial outer membrane vesicles for cytosolic lipopolysaccharide sensing. PLoS Pathog. 2018;14:e1007240–e1007240.
- Perrier DL, Vahid A, Kathavi V, et al. Response of an actin network in vesicles under electric pulses. Sci Rep. 2019;9:8151.
- Muralidharan A, Rems L, Kreutzer MT, et al. Actin networks regulate the cell membrane permeability during electroporation. Biochim Biophys Acta Biomembr. 2021;1863:183468.
- Lira RB, Dimova R, Riske KA. Giant unilamellar vesicles formed by hybrid films of agarose and lipids display altered mechanical properties. Biophys J. 2014;107:1609–1619.
- Knorr RL, Staykova M, Gracià RS, et al. Wrinkling and electroporation of giant vesicles in the gel phase. Soft Matter. 2010;6:1990–1996.
- Perrier DL, Rems L, Kreutzer MT, et al. The role of gel-phase domains in electroporation of vesicles. Sci Rep. 2018;8:4758.
- Portet T, Camps I Febrer F, Escoffre J-M, et al. Visualization of membrane loss during the shrinkage of giant vesicles under electropulsation. Biophys J. 2009;96:4109–4121.
- Portet T, Favard C, Teissié J, et al. Insights into the mechanisms of electromediated gene delivery and application to the loading of giant vesicles with negatively charged macromolecules. Soft Matter. 2011;7:3872–3881.
- Rems L, Tang, X, Zhao, F, Pérez-Conesa, S, Testa, I, Delemotte, L . Identification of electroporation sites in the complex lipid organization of the plasma membrane. eLife. 2022;11:e74773.
- Breton M, Amirkavei M, Mir LM. Optimization of the electroformation of giant unilamellar vesicles (GUVs) with unsaturated phospholipids. J Membr Biol. 2015;248:827–835.
- Gabriel B, Teissié J. Generation of reactive-oxygen species induced by electropermeabilization of Chinese hamster ovary cells and their consequence on cell viability. Eur J Biochem. 1994;223:25–33.
- Wiczew D, Szulc N, Tarek M. Molecular dynamics simulations of the effects of lipid oxidation on the permeability of cell membranes. Bioelectrochemistry; 2021;141:107869.
- Sözer EB, Levine ZA, Vernier PT. Quantitative limits on small molecule transport via the electropermeome — measuring and modeling single nanosecond perturbations. Sci Rep. 2017;7:57.
- Sözer EB, Pocetti CF, Vernier PT. Transport of charged small molecules after electropermeabilization — drift and diffusion. BMC Biophys. 2018;11:4.
- Sözer EB, Pocetti CF, Vernier PT. Asymmetric patterns of small molecule transport after nanosecond and microsecond electropermeabilization. J Membr Biol. 2018;251:197–210.
- Messina P, Lemaître F, Huet F, et al. Monitoring and quantifying the passive transport of molecules through patch-clamp suspended real and model cell membranes. Angew Chem Int Ed Engl. 2014;53:3192–3196.
- Mosharov EV, Sulzer D. Analysis of exocytotic events recorded by amperometry. Nat Methods. 2005;2:651–658.
- Ben Trad F, Wieczny V, Delacotte J, et al. Dynamic electrochemiluminescence imaging of single giant liposome opening at polarized electrodes. Anal Chem. 2022;94:1686–1696.
- Mauroy C, Portet, T, Winterhalder, M, Bellard, E, Blache, MC, Teissié, J, Zumbusch, A, Rols, MP Giant lipid vesicles under electric field pulses assessed by non invasive imaging. Bioelectrochemistry. 2012;87:253–259.
- Akashi K, Miyata H, Itoh H, et al. Preparation of giant liposomes in physiological conditions and their characterization under an optical microscope. Biophys J. 1996;71:3242–3250.
- Dos Santos Cabrera MP, Alvares DS, Leite NB, et al. New insight into the mechanism of action of wasp mastoparan peptides: lytic activity and clustering observed with giant vesicles. Langmuir. 2011;27:10805–10813.
- Ewins E, Lira RB, Zhang W, et al. Poly(Ionic Liquid) nanoparticles selectively disrupt biomembranes. Adv Sci. 2019;6:1801602.
- Lira RB, Steinkühler J, Knorr RL, et al. Posing for a picture: vesicle immobilization in agarose gel. Sci Rep. 2016;6:25254.
- Golzio M, Teissié J, Rols M-P. Direct visualization at the single-cell level of electrically mediated gene delivery. Proc Natl Acad Sci U S A. 2002;99:1292–1297.
- Sözer EB, Haldar S, Blank PS, et al. Dye transport through bilayers agrees with lipid electropore molecular dynamics. Biophys J. 2020;119:1724–1734.
- Young JL, Dean DA. Electroporation-mediated gene delivery. Adv Genet. 2015;89:49–88.
- Broderick KE, Humeau LM. Electroporation-enhanced delivery of nucleic acid vaccines. Expert Rev Vaccines. 2015;14:195–204.
- Rosazza C, Deschout H, Buntz A, et al. Endocytosis and endosomal trafficking of DNA after gene electrotransfer in vitro. Mol Ther Nucleic Acids. 2016;5:e286.
- Escoffre J-M, Mauroy C, Portet T, et al. Gene electrotransfer: from biophysical mechanisms to in vivo applications: part 2 - In vivo developments and present clinical applications. Biophys Rev. 2009;1:185.
- Venslauskas MS, Šatkauskas S. Mechanisms of transfer of bioactive molecules through the cell membrane by electroporation. Eur Biophys J. 2015;44:277–289.
- Breton M, Delemotte L, Silve A, et al. Transport of siRNA through lipid membranes driven by nanosecond electric pulses: an experimental and computational study. J Am Chem Soc. 2012;134:13938–13941.
- Yu M, Tan W, Lin H. A stochastic model for DNA translocation through an electropore. Biochim Biophys Acta - Biomembr. 2012;1818:2494–2501.
- Sachdev S, Muralidharan A, Choudhary DK, et al. DNA translocation to giant unilamellar vesicles during electroporation is independent of DNA size. Soft Matter. 2019;15:9187–9194.
- Barlow ST, Figueroa B, Fu D, et al. Membrane tension modifies redox loading and release in single liposome electroanalysis. Anal Chem. 2021;93:3876–3882.
- Choi Y, Park C, Kang Y, et al. Temporally resolved electrochemical interrogation for stochastic collision dynamics of electrogenerated single polybromide droplets. Anal Chem. 2021;93:8336–8344.
- Winterhalder MJ, Zumbusch A. Beyond the borders — biomedical applications of non-linear Raman microscopy. Adv Drug Deliv Rev. 2015;89:135–144.
- Zumbusch A, Langbein W, Borri P. Nonlinear vibrational microscopy applied to lipid biology. Prog Lipid Res. 2013;52:615–632.
- Riske KA, Dimova R. Electric pulses induce cylindrical deformations on giant vesicles in salt solutions. Biophys J. 2006;91:1778–1786.
- Vlahovska PM. Voltage-morphology coupling in biomimetic membranes: dynamics of giant vesicles in applied electric fields. Soft Matter. 2015;11:7232–7236.
- Faizi HA, Frey SL, Steinkühler J, et al. Bending rigidity of charged lipid bilayer membranes. Soft Matter. 2019;15:6006–6013.
- Winterhalter M, Helfrich W. Effect of surface charge on the curvature elasticity of membranes. J Phys Chem. 1988;92:6865–6867.
- Lekkerkerker HNW. Contribution of the electric double layer to the curvature elasticity of charged amphiphilic monolayers. Physica A. Phys A Stat Mech Appli. 1989;159:319–328.
- Lacoste D, Menon GI, Bazant MZ, et al. Electrostatic and electrokinetic contributions to the elastic moduli of a driven membrane. Eur Phys J E. 2009;28:243–264.
- Loubet B, Hansen PL, Lomholt MA. Electromechanics of a membrane with spatially distributed fixed charges: flexoelectricity and elastic parameters. Phys Rev E. 2013;88:062715.