
ABSTRACT
The deformation of interatomic distances with respect to those of the perfect crystal generates atomic-level strain. In nanoalloys, strain can arise because of finite size, morphology, domain structure and lattice mismatch between their atomic compounds. Strain can strongly affect the functional properties of nanoalloys, as it alters their electronic energy levels. Moreover, atomic-level strain generates atomic-level stress, which in turn results in distortions induced by strain. When the stress accumulated in a nanoalloy exceeds a certain level, the particle can relax that stress by undergoing structural transitions such as shape and/or chemical ordering transitions. Atomic-level strain is then a powerful tool to control and manipulate the structural and functional properties of nanoalloys. This requires a combined theoretical and experimental approach both to deeply understand the physical origin of strain, and to characterize it with a sub-angstrom resolution. Here, we present a theoretical analysis of the main sources of strain in nanoalloys, we analyse how atomic-level strain can be experimentally measured with transmission electron microscopy, we discuss its effect on the functional properties of nanoalloys, finally we describe how atomic-level stress arises from atomic-level strain, and how stress can induce structural transformations at the nanoscale.
Graphical abstract
1. Introduction
Atomic-level strain is the deformation of interatomic distances with respect to those of the perfect crystal. In the case of a bulk material, strain can be introduced in the surface region by growing one metal epitaxially on another, by defect engineering, i.e. doping impurities (including vacancies) into materials, or, in flexible materials, by mechanical deformation [Citation1,Citation2]. In low-dimensional multimetallic nanoparticles strain may be naturally present. The different sources of strain can be classified into intrinsic or extrinsic [Citation3]. Intrinsic strain is caused by the structure of the nanoparticle and arises because of finite size [Citation4], morphology [Citation5] or domain structure [Citation6,Citation7]. Alternatively, strain can be caused by extrinsic factors such as lattice mismatch between top and subsurface layers of atoms (as at an interface within a core–shell bimetallic nanoparticle [Citation8]) or for interfacial interactions with supports [Citation3,Citation7,Citation9].
The presence of atomic-level strain can strongly affect the functional properties of nanoparticles and nanoalloys. This has been demonstrated in the case of catalysis [Citation1,Citation10–12], plasmonics [Citation13–21] and magnetism [Citation22–30] by several theoretical and experimental studies. Particularly, the level of d-band centre is closely related to the adsorption and desorption characteristics of the catalyst surface. In a strained particle, the atomic positions are displaced from the corresponding bulk conditions, thus affecting the superposition between orbitals centered on different atoms, and hence the catalytic capabilities of the particle. Similarly, the saturation magnetization and plasmonic resonance of nanoparticles are also altered in strained nanoparticles. Another consequence of the presence of atomic-level strain is atomic-level stress, which indicates whether the atom is either in a compressive or tensile local environment. Stress results from the distortions induced by strain. This effect can be particularly noticeable in nanoalloys with atomic components having a significant size mismatch, and with peculiar chemical arrangements such as core shell ones. When the stress accumulated in a nanoalloy exceed a certain level, it can be advantageous for the particle to relax that stress by undergoing structural transitions that can involve changes in its shape and/or chemical arrangement, and other phase transitions. This was the object of recent theoretical and experimental works that show that stress effects can be the driving force for the stabilization or destabilization of some geometric motifs [Citation31,Citation32].
The strong impact that strain has on the structural and functional properties of a nanoalloy motivated a deep research also on understanding how to quantitatively evaluate the strain in a nanoparticle and nanoalloy. Particularly, high-resolution transmission electron microscopy has been demonstrated to be an important tool for determining with subatomic precision atomic positions. Such positions can be successfully used to evaluate the displacements of atoms in strained particles, and mapping the strain of the nanoparticle. To this goal, several methods have been developed both to experimentally acquire images with a high signal-to-noise ratio and computationally analyse the images to determine the atomic positions with sub-angstrom precision [Citation33–40].
This Review is organized as follows: In Section 2, the possible origins of strain in nanoparticles and nanoalloys are analysed. We show that, in most cases, strain depends on the position and it is strongly anisotropic; this has deep consequences on nanoparticles properties, including stress. In Section 3, we analyse how atomic-level strain can be experimentally measured, and we review a selection of relevant results achieved on strain measurement in nanoparticles. In Section 4, we discuss the effect of strain in catalytic, magnetic and optical properties of nanoparticles and nanoalloys. Finally, in Section 5, we deeply analyse atomic-level stress arising from atomic-level strain, and we discuss how it can induce structural transformations at the nanoscale.
2. Atomic-level strain in nanoparticles and nanoalloys
Here, we discuss the possible causes of atomic-level strain in metallic nanoparticles and nanoalloys. Different types of nanoscale effects are at the origin of peculiar non-homogeneous strain distributions, which contribute to some of the structural, chemical and physical properties of these systems.
Finite-size objects are subjected to the Laplace pressure, which is due to the presence of a curved interface between two phases; in the case of nanoparticles, the two phases are the solid metallic phase and the surrounding vacuum. For a perfectly spherical nanoparticle of radius , the Laplace pressure
is given by [Citation41]
where is the average surface energy, i.e. the energetic cost of creating a solid-vacuum interface in the perfect bulk crystal. The Laplace pressure is inversely proportional to the nanoparticle radius: for small nanoparticles, a strongly positive pressure is calculated (
is of the order of
GPa for
2 nm [Citation42]), and, as a consequence, some degree of compressive strain is expected.
We note that Laplace model is far too simple to describe pressure and strain in metallic nanoparticles. According to the model, pressure is constant within the nanoparticle volume, whereas, as we will see, pressure (and strain) is strongly non-homogeneous, and also non-isotropic. Indeed, perfectly spherical nanoparticles do not exist, as the faceted nature of the surface cannot be neglected at these sizes. The real shape of the nanoparticle must be taken into account.
Nanoparticles can take several different geometric shapes, which can be classified in crystalline and noncrystalline. Nanoparticles belonging to crystalline motifs are fragments of bulk crystals. The symmetry of the bulk crystal is preserved, for example the face-centered cubic (fcc), body-centered cubic (bcc) or hexagonal close-packed (hcp) lattice. On the other hand, noncrystalline nanoparticles cannot be seen as fragments of any crystal lattice. Such structures are possible as the constraint of translational invariance of infinite bulk crystals does not apply to nanoscale systems. Here, we discuss strain effects in two of the most common geometric structures, which are representative of the two types of structural motifs: the crystalline fcc truncated octahedron, and the noncrystalline icosahedron.
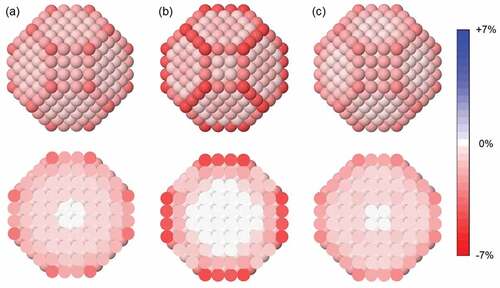
In ) the strain map of a regular truncated octahedron made of 586 Ag atoms (corresponding to a diameter of 2.7 nm) is displayed. For each atom in the nanoparticle, the average atomic strain
has been calculated as
Figure 1. Strain maps of the regular truncated octahedron made of 586 Ag atoms: (a) total strain, (b) inter-shell strain and (c) intra-shell strain. Definitions of the different strain types are in the main text. For all cases, in the top row we show the nanoparticle surface, whereas in the bottom row we show a cross section.
where is the number of nearest-neighbour bonds formed by atom
,
is the distance between
and its nearest-neighbour
and
is the nearest-neighbour distance of the metal (Ag) in the bulk. Two atoms are considered as nearest-neighbours if their distance do not exceed 1.15
.
Interatomic distances have been evaluated after the local relaxation of the structure, according to the SMATB atomic interaction model. The SMATB potential (also known as Gupta or RGL potential) [Citation43–45] is commonly used for modelling nanoparticles made of transition or noble metals in atomistic computer simulations; for these systems, a good agreement between the predictions of the SMATB model and those of ab initio Density Functional Theory (DFT) calculations is generally obtained [Citation32,Citation46–50]. For all atoms, a certain degree of compressive (negative) strain is observed, as predicted by the Laplace model. However, as anticipated, strain is strongly non-homogenous: the most negative values are found in the nanoparticle surface, and strain approaches zero while moving towards the nanoparticle center; for the innermost sites basically no strain is calculated. Moreover, surface sites are not equivalent: strain is higher for vertex (−3.0%) and edge sites (−2.1%), and lower for facet sites (from −1.3% to −0.9%).
The high degree of surface strain is due to the inverse relationship between the coordination number of a metal atom and the length of its bonds, i.e. the equilibrium distances with its nearest neighbours. This effect is well established in the literature [Citation51–54], and its consequences on the structure and properties of nanoscale systems have been discussed in several works [Citation55–61]. The contraction of surface bonds has been measured in the case of Au crystalline nanoparticles of size 3–5 nm [Citation62]; the correlation between contraction and coordination number has been verified, with edge atoms contracting more than those on facets. On the other hand, the measured internal strain was small. Experimental results of Ref [Citation62]. are therefore in qualitative agreement with the simulated strain map of ).
In ) we show the strain map of perfect icosahedron made of 561 Ag atoms. The size of this nanoparticle is almost equal to the size of the truncated octahedron of ), so that we can easily compare the two geometric structures. These turn out to behave rather differently in terms of atomic strain. Two main differences can be pointed out. (i) For some of the internal atoms of the icosahedron we calculate strongly negative strain values; highly contracted distances are found for atoms in the fivefold axes and, especially, for the atom in the central site (−6.7%). This behaviour is opposite to that of the truncated octahedron, in which internal interatomic distances are very close to the ideal bulk spacing. (ii) In the icosahedron, surface atoms on the (111) facets are subjected to tensile (positive) strain, meaning that their nearest neighbour distances are larger than the ideal one. Though the calculated strain values are quite small (0.3–0.7%), the difference with the case of the truncated octahedron is evident, as no positive strain values are obtained for any of the atoms of the crystalline nanoparticle.
Figure 2. Strain maps of the perfect icosahedron made of 561 Ag atoms: (a) total strain, (b) inter-shell strain and (c) intra-shell strain. Definitions of the different strain types are in the main text. For all cases, in the top row we show the nanoparticle surface, whereas in the bottom row we show a cross section. We note that intra-shell strain is not defined for the most internal shell, which consists only of a single atom (the central one).
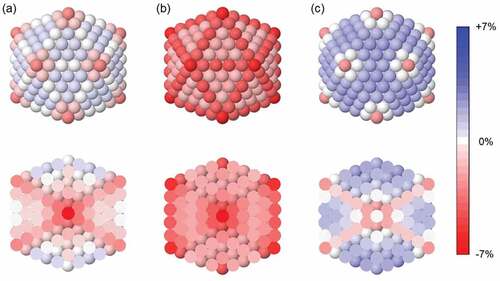
The noncrystalline character of the icosahedron is key to understand its peculiar strain map. As already mentioned, this structure is not the fragment of a perfect crystal. It can be thought of as composed of 20 tetrahedra sharing a common vertex in the central site [Citation63]. Tetrahedra are crystalline fcc structures, but when they are packed together to build the icosahedron, large interstices are formed between them; huge distortions are therefore needed to fill such empty spaces, and the interatomic distances change accordingly. Specifically, distances are contracted in the innermost sites and expanded on the surface plane, as shown by the strain map of ).
In summary, for crystalline nanoparticles such as the truncated octahedron, strain distribution is mostly due to the coordination-number/bond-length correlation at the surface, whereas in the case of noncrystalline icosahedral nanoparticles shape and symmetry effects are dominant. In both cases, strain is considerably non-homogenous; this is more evident for the icosahedron, in which the calculated strain values go from strongly negative (in the central site) to mildly positive (in the surface).
In ) and 2(a), we have shown maps of the total average strain, which is calculated for each atom by considering all its nearest neighbours distances. However, a more detailed analysis shows that strain is strongly anisotropic in most cases. To single out this effect, strain has to been calculated along different well-defined directions. Now we consider two types of anisotropic strain, namely inter-shell and intra-shell strain. Here, shells are the concentric atomic layer building up the nanoparticle structure. Intra-shell strain is calculated as in EquationEq. 2(2) , but
is replaced by the number
of the nearest neighbours of atom
in the same shell; for evaluating inter-shell strain
is replaced by
, which is the number of nearest neighbours of atom
belonging to a different shell, i.e. to the more internal or to the more external one.
Inter- and intra-shell strain maps have been calculated for the Ag truncated octahedron of size 586 atoms, and are displayed in ) and (c), respectively. The comparison between the two maps highlights the anisotropy of atomic-level strain both in the surface and in the internal part of the structure. Suface edge and vertex atoms are subjected to strong inter-shell strain, due to the compression of the distances with their neighbouring atoms in the subsurface layer; by comparison, distances with other surface atoms are less modified. The same kind of anisotropy is observed for surface atoms in the center of the (111) facets, whereas for atoms on the (100) facets the major contribution is given by intra-shell strain. If we look at the internal sites, we can notice that inter-shell strain is quite strong for atoms in the subsurface, and it is negligible for atoms in the inner shells; however, for those atoms, intra-shell strain is still present.
Strain anisotropy is even more striking in icosahedral nanoparticles. Inter- and intra-shell strain maps for the Ag icosahedron of size 561 atoms are shown in ) and (c), respectively. The two maps are totally different. Inter-shell strain is negative everywhere, meaning that all interatomic distances are compressed in the radial direction. Such radial compression becomes stronger and stronger when going towards the nanoparticle center, but it is already present in the surface layer. On the other hand, intra-shell strain is mostly positive, except for atoms belonging to the fivefold axes. The highest values of intra-shell strain are found for surface atoms in the (111) facets (1.9%); we note that, for those atoms, inter- and intra-shell strain take opposite signs, meaning that interatomic distances are contracted in the radial direction and expanded on the surface plane. The same behaviour is found for edge atoms and for many of the atoms in the internal sites (not in the fivefold axes). Such opposite contributions are sometimes almost perfectly balanced, so that the total strain turns out to be close to zero (see edge and subsurface atoms in )). We want to emphasize that, in this case, the zero value of the total strain does not mean that interatomic distances are close to the ideal ones; on the contrary, all distances are either contracted or expanded, so that atoms are in a highly strained local environment.
We have shown that, to fully characterize atomic-level strain in metallic nanoparticles, anisotropy must be taken into account. Although at present strain anisotropy is difficult to detect experimentally, we believe that it must not be neglected in theoretical calculations. Firstly, an analysis limited to the total strain may be misleading: some atoms may appear not subjected to strain, while in fact their interatomic distances are all strained, but in opposite ways. Moreover, strain anisotropy is at the origin of anisotropic atomic stress, which may strongly affect the stability of specific geometric structures; this point will be deeply discussed in Section 5.
So far we have presented a detailed analysis of atomic-level strain in truncated octahedral and icosahedral nanoparticles. Other geometric structures exhibit different strain distributions; these can be more similar to either the strain distribution of the truncated octahedron, shown in , or to the one of the icosahedron, in . All crystalline structures, such as the complete octahedron and the complete/truncated tetrahedron, are characterized by a strain distribution similar to that of , with compressive strain mostly limited to the atomic layers close to the surface, and almost unstrained atomic distances in the central region. When some defects interrupt the perfect crystallinity of the fcc structure, e.g. in the case of twin planes, a significant amount of strain is present in the vicinity of such defects. Noncrystalline nanoparticles exhibit highly non-homogenous and non-isotropic strain distributions, such as those in . Among them, we mention the decahedron, in which strain is weaker than in the icosahedron and mostly concentrated in the surface and in the vicinity of the fivefold axis and of the five twin planes.
In nanoalloys, in which two different atomic species are present, strain originates from the synergistic combination of geometric shape and chemical ordering. As for the effect of shape, the considerations that we have made for pure nanoparticles apply also to nanoalloys; however, the introduction of a second element may strongly affect the strain distribution, especially when there is a considerable size mismatch between the two atomic species.
Chemical ordering is the pattern in which the different elements of a bimetallic nanoparticle are arranged [Citation42,Citation64]. Two main classes of chemical ordering can be identified, namely the mixing and the nonmixing or phase-separated patterns. The energetic stability of these patterns is mainly due to the behaviour of the bulk bimetallic alloy: the tendency towards mixing in the bulk induces the formation of mixing patterns also at the nanoscale; on the other hand, a weak mixing tendency can be the driving force for the formation of stable phase-separated patterns. Other driving forces for nonmixing behaviour at the nanoscale are the difference in surface energy and the size mismatch between the two elements.
In the case of mixing patterns, equilibrium interatomic distances are modified according to the lattice mismatch of the two elements, as in bulk alloys; the average lattice constant of the nanoparticle can be calculated according to the Vegard’s law [Citation65,Citation66], which have been verified experimentally for different nanoscale bimetallic systems [Citation67–70]. The modified constant falls between those of the two metals, and depends on the composition of the nanoalloy.
In nanoalloys, some degree of atomic-level strain can be observed also in the case of phase-separated systems. Indeed, in phase-separated core-shell nanoalloys strain can be quite high; this is true for atoms of both species, i.e. those in the inner core of the nanoparticle, and those in the outer shell. Between the two, shell strain is most interesting for applications; for example, the catalytic activity of nanoalloys has been shown to be deeply influenced by the strain of interatomic distances in the surface and subsurface layers (this point will be discussed in more detail in Section 4). Therefore, much effort has been employed to measure surface strain in core-shell nanoalloys; some results can be found in Ref [Citation71–78].
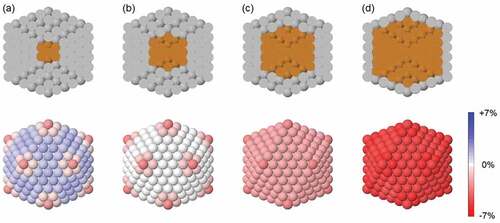
The effect of chemical ordering on the surface strain distribution in core-shell nanoalloys can be visualized in . Here, we consider Cu@Ag nanoparticles of icosahedral shape and of size 561 atoms, with different compositions. These structures are obtained from the Ag icosahedron of , by replacing some of the internal Ag atoms by Cu ones. From (a) to (d), more and more atoms are replaced, so that the size of the Cu core increases at the expense of the Ag shell; the shell decreases by one atomic layer each time, and in (d) only a single-layer Ag skin covers the Cu core. The structures are then relaxed according to the SMATB potential. Since Cu atoms are smaller than Ag ones (the mismatch between the bulk lattice constants is of 13%), in these Cu@Ag nanoparticles the interatomic Ag-Ag distances in the shell are modified compared to the ones in the pure Ag icosahedron. Specifically, they have to reduce to better adapt to the Cu core, the contraction becoming stronger and stronger as the size of the Cu core increases. In we show the distribution of intra-shell strain on the nanoparticle surface, for the four different sizes of the Cu core. In (a), the core is made of 13 Cu atoms, and the Ag shell is thick four atomic layers; though the core is rather small, its effect on the surface strain is not negligible, as one can notice by comparing the intra-shell strain map with that of the pure Ag icosahedron in ). All intra-shell distances decrease; for example, intra-shell strain in the (111) facets decreases from 1.9% to 1.4%. In (b), a further atomic layer is added to the Cu core. In this case, the effect is striking: atoms on the (111) facets are no longer subjected to intra-shell strain (a very small strain value of 0.2% is calculated). The replacing of Ag atoms with Cu ones in the nanoparticle core is therefore effective in releasing most of the initial surface strain, bringing the intra-surface interatomic distances close to the optimal bulk ones. This has a beneficial impact on the energetic stability of the nanoparticle, as we will deeply discuss in Section 5. If the size of the Cu core is further increased, intra-shell strain decreases even more, and it becomes negative. In the surface of the two-layer and single-layer Ag shells of (c) and (d), (111) atoms are subjected to −1.9% and −4.6% intra-shell strain, respectively. In conclusion, in core-shell nanoalloys with significant size mismatch between the two metallic species, it is possible to affect the surface strain by tuning the core size. Surface strain changes from positive to close to zero, and then to strongly negative, with major consequences on the nanoparticle stability and on its application properties.
Figure 3. Effect of the core size on the surface strain distribution of Cu@Ag nanoalloys. All nanoparticles have a perfectly icosahedral geometric shape and a total size of 561 atoms. Core and shell compositions are as follows: (a) 13-atoms Cu core and 4-layers Ag shell; (b) 55-atoms Cu core and 3-layers Ag shell; (c) 147-atoms Cu core and 2-layers Ag shell; (d) 309-atoms Cu core and single-layer Ag shell. In the top row, the nanoparticle cross-section shows its chemical ordering. In the bottom row we show the intra-shell strain map of the nanoparticle surface.
3. Transmission electron microscopy for quantitative strain analysis
The most important techniques for measuring the interatomic distances in nanoparticles are based on electron microscopy and X-ray diffraction. In the following, we focus on electron microscopy techniques, which allow to precisely evaluate interatomic strain of individual nanoparticles. On the other hand, X-ray techniques are used to evaluate the average strain on the whole nanoparticle sample [Citation79,Citation80].
Due to the high resolution, high accuracy and reduced contrast delocalization, spherical aberration corrected (Cs-corrected) high-resolution transmission electron microscopy (HRTEM) and scanning transmission electron microscopy (STEM), are indispensable tool for atomic-scale studies of nanoparticles [Citation3,Citation6,Citation8,Citation33,Citation71,Citation74,Citation81].
So far, a variety of approaches have been developed to characterize strain in nanoalloys. A relatively easy, fast, and accessible way to obtain qualitative information on a distribution of nanoalloys consists in combining HRTEM and high-angle annular dark field (HAADF) images. The bright field HRTEM mode provides information regarding the particle structure and lattice spacing, while the dark field data measured by HAADF give information related to high angle scattered electrons, which normally depends on the atomic number, .
This HRTEM-HAADF combined method is mainly used to characterize nanoalloys with a core-shell chemical ordering, as it allows the observation of interfaces between layers of different elements due to the presence of a strain field [Citation81,Citation82].
HRTEM-HAADF was successfully used by Garcia-Gutierrez et al. [Citation81] to investigate the structure of AuPt nanoalloys. By analyzing individual nanoalloys a strong contrast that could be interpreted as core-shell was observed. Such strong contrast was not ascribable to an atomic number contrast (due to the very similar of Au and Pt, 79 and 78 respectively), but to internal strain. The static atomic displacement associated with this strain field present in the interface enhances the high angle scattering events and increases the image intensity to yield the bright contrast [Citation83] in the core-shell interface.
The advent of aberration correction and the advances in digital imaging and image-processing techniques have enabled sub-angstrom resolution STEM imaging of atoms and atomic columns, and have offered the possibility of locally determining the strain of materials at subnanometric scale using HRTEM images. It is important to note that the reliability of strain mapping determination is still problematic, since it relies on the assumption of a constant spatial relationship between the intensity maxima in the HRTEM micrograph and the relative positions of the atomic columns in the specimen. However, this assumption is sometimes compromised by a variety of effects such as thin foil relaxation, local crystal tilts and thickness and/or composition variation across the material [Citation84]. To address these issues, several methodologies have been reported. Here, we present three of the most widely used, Peak Finding (PF), Geometric Phase analysis (GP), and 4D-STEM.
Peak-finding (PF) methods work in real space. First, the atom columns are identified as intensity maxima, and then fitted as 2D Gaussian functions [Citation39]. The center of each Gaussian is the refined atom column position. Once the atom columns are assigned and located, the column distance from its four orthogonal nearest neighbors can be calculated. By deriving the displacement field between such refined positions and the positions of the unstrained atoms, the displacement field is obtained. From this latter, it is finally possible to calculate the strain field of the nanoparticle as described in Ref [Citation84].
With this approach, Gan et al. [Citation74] investigated the structure of dealloyed PtFe nanoalloys 4–5 nm large using aberration-corrected HRTEM. The particles are imaged using the negative-Cs technique, which was shown to give high contrast and low noise. The positions of each atomic column were measured by fitting the image areas with an intensity maximum to 2D Gaussian functions with an error of around 2 pm. Using the positions of the atomic columns, the authors obtain the area of each triangle unit bounded by the nearest distance along
,
, and
directions (denoted as
), as indicated in ). The value of
is proportional to the square of the local lattice parameter (
). Therefore, by converting
to the lattice parameter
that was further converted to the contraction percentage related to an ideal Pt lattice parameter (i.e.
), they could obtain a 2D mapping of the lattice strain relative to the bulk Pt lattice on the ångstrom scale. The result reported in ) shows the mapping of the lattice strain for PtFe nanoalloy in ) and of a pure Pt particle in (c). It can be seen that there is a lattice-contracted region at the inner part of dealloyed PtFe nanoparticles which can be directly related to the formation of a PtFe alloy core according to Vegard’s law, while the surface region can be regarded as a Pt shell. Combining these results with image simulations, the authors could demonstrate in individual particles the presence of percolated lattice-contracted PtFe core in a Pt shell.
Figure 4. (a) Aberration-corrected HRTEM image of a dealloyed PtFe nanoparticle, (b) map of the lattice contraction relative to the bulk Pt lattice (i.e. %) in the dashed rectangle of (a). (c) Map of the lattice contraction of a pure Pt nanoparticle. Adapted with permission from [Citation74]. Copyright 2012 American Chemical Society.
![Figure 4. (a) Aberration-corrected HRTEM image of a dealloyed PtFe nanoparticle, (b) map of the lattice contraction relative to the bulk Pt lattice (i.e. %) in the dashed rectangle of (a). (c) Map of the lattice contraction of a pure Pt nanoparticle. Adapted with permission from [Citation74]. Copyright 2012 American Chemical Society.](/cms/asset/cd3ca51d-5e48-4533-ad02-812874ff5aea/tapx_a_2127330_f0004_oc.jpg)
Optimizing the contrast and reducing the noise of the images is particularly important to improve the accuracy in determining the strain field.
In this respect, Walsh et al. [Citation6] investigated the strain in 3 nm sized Au nanodecahedra using a PF approach. To optimize the contrast, the authors imaged with a slightly negative spherical aberration value corrected to the third order and a slightly positive defocus value [Citation85].
Pingel et al. [Citation3] developed multiple approaches to improve signal-to-noise ratio (SNR). Particularly, the authors first acquired tens to hundreds of consecutive HAADF-STEM images of the same particle. Then, they performed a nonrigid image registration to remove image distortions, and an averaging of the image series. Moreover, to reduce the electron-beam induced damage, all the images were acquired at low electron beam currents ( 3 pA). This method guaranteed high precision images where the atomic column positions could be measured with sub-pixel accuracy using two-dimensional Gaussian fitting.
With this approach, the authors could characterize the strain in supported Pt nanoparticles, as shown in . By extracting from the atomic columns positions the local displacements ()) and strain ()), the authors found that the Pt supported particles are subjected to two strain regimes: a moderate 1–3 strain associated with grain, surface and interface structures, and a strong and localised 3–10
strain at the interface between the particle and the support.
Figure 5. (a) High-precision atomic-resolution HAADF STEM image of a supported Pt particle. (b) Displacement maps showing the deviation of each atomic column position from their unstrained lattice positions, as indicated in the legend. (c) Atomic resolution strain maps within three crystallographic planes, as indicated above the NPs. The colour scale indicates variations in nearest-neighbour separations spanning from −4% (red, compressive) to 4% (blue, expansive). Strains above these thresholds are highlighted in yellow (compressive) and turquoise (expansive). Scale bar corresponds to 3 nm. Adapted with permission from [Citation3]. Copyright © 2018, Nilssen et al.
![Figure 5. (a) High-precision atomic-resolution HAADF STEM image of a supported Pt particle. (b) Displacement maps showing the deviation of each atomic column position from their unstrained lattice positions, as indicated in the legend. (c) Atomic resolution strain maps within three crystallographic planes, as indicated above the NPs. The colour scale indicates variations in nearest-neighbour separations spanning from −4% (red, compressive) to 4% (blue, expansive). Strains above these thresholds are highlighted in yellow (compressive) and turquoise (expansive). Scale bar corresponds to 3 nm. Adapted with permission from [Citation3]. Copyright © 2018, Nilssen et al.](/cms/asset/78fd251c-dd22-4b57-856a-17407b64c7fe/tapx_a_2127330_f0005_oc.jpg)
Differently from the PF approach, Geometric Phase (GP) methodology works in Fourier space, and it is based on the idea that a translational variation in a real-space image is reflected as a phase variation in Fourier space. GP consists of filtering the images acquired with an asymmetric filter centred on a Bragg spot and performing an inverse Fourier transform [Citation84]. Doing so, it is possible to obtain information about local displacements in a direction which is normal to the lattice fringes corresponding to position of the Bragg spot. Further technical details can be found in Refs. [Citation39,Citation86].
4D-STEM is an alternative approach to PF and GP. This approach requires to illuminate the sample with a unit-cell sized electron beam. This will produce a so-called nanobeam electron diffraction pattern, where the diffraction disks do not overlap with the central undiffracted transmitted electron beam. A schematic of a 4D-STEM experimental setup is shown in ) [Citation39].
Figure 6. (a) Schematic of a 4D-STEM experimental setup with an electron probe semiangle () of 5 mrad. An ADF detector present above the 4D-STEM camera also simultaneously captures an ADF image. (b-g) Comparison of measured
strain through multiple techniques: (b) 4D-STEM disk fitting, (d) geometric phase analysis, (f) two-dimensional Gaussian fitting of individual atom columns in a high-angle annular dark-field imaging (HAADF)-STEM image. (c, e, g) Variation of
strain in the region marked by the black dashed rectangle in panel b, d, f respectively. Adapted with permission from [Citation39]. Copyright © 2020, American Chemical Society.
![Figure 6. (a) Schematic of a 4D-STEM experimental setup with an electron probe semiangle () of 5 mrad. An ADF detector present above the 4D-STEM camera also simultaneously captures an ADF image. (b-g) Comparison of measured strain through multiple techniques: (b) 4D-STEM disk fitting, (d) geometric phase analysis, (f) two-dimensional Gaussian fitting of individual atom columns in a high-angle annular dark-field imaging (HAADF)-STEM image. (c, e, g) Variation of strain in the region marked by the black dashed rectangle in panel b, d, f respectively. Adapted with permission from [Citation39]. Copyright © 2020, American Chemical Society.](/cms/asset/0e002a7d-8596-4cc5-bdd6-cbc48734110c/tapx_a_2127330_f0006_oc.jpg)
An enlightening comparison between the three methods presented (PF, GP, and 4D-STEM) was performed by Mukherejee et al. [Citation39]. In this work, the authors performed lattice strain measurements of core-shell Rh@Pt nanoparticles using these three methods. The authors particularly focused on comparing the strain maps of in the same region of the same nanoalloys.
indicates the relative dilatation/compression of the lattice distances along the
direction. It consists in the diagonal values of the Cauchy strain tensor, which are calculated as the derivative with respect to
of the deformation in the
direction. This corresponds to measuring the relative change in interatomic distances along
direction.
The authors found that, besides being the strain maps visually similar, 4D-STEM was overall the most effective approach demonstrating that the shell had a higher lattice parameter compared to the core. GP plots showed a localized region of apparently compressive strain, not present in the 4D-STEM data, which was shown to be an artifact of the GP method. Conversely, the authors note that in the averaged strain measured from PF, it was not possible to visualize the higher unit cell parameter in the particle shell as compared to the core. Finally, a significantly higher variance of the strain in both the GP and PF data as compared to the 4D-STEM strain data was also reported. A summarizing image is shown on the right panel of .
The studies mentioned above prove that it is possible to experimentally quantify the strain distribution in nanoparticles and nanoalloys, however, they also shine light on how challenging it can be to obtain reliable strain maps, and to accurately interpret them. These difficulties are intrinsic of all methods based on the characterization of single 2D projection of the particles, and recently motivated a promising research towards the investigation of the 3D nature of the lattice strain [Citation34].
The starting point of this method consists in acquiring a large amount of 2D images, each of them representing a projection of the particle, and processing them to obtain a 3D reconstruction of the object. One of the most important advantages of this approach is that the 3D reconstruction yields all atom coordinates as a direct output so that the 3D displacement map can be calculated with respect to a reference region in a straightforward way. Another advantage is that 3D maps allow to determine a possible lattice expansion/contraction along the direction, information that cannot be extracted from a single 2D projection image [Citation34]. Refs. [Citation33–38] explain in detail how to obtain 3D reconstruction of nanoparticles; here, we present two remarkable examples provided by Kim et al. [Citation33] and by Goris et al. [Citation34] which show how 3D reconstructions can be used to obtain a 3D strain mapping with sub-angstrom resolution.
Kim et al. [Citation33] studied the strain distribution in colloidal Pt nanocrystals dispersed in a liquid cell. The 2D projections of the particles were obtained by acquiring images of the particles while they were moving into the liquid. The 3D reconstruction obtained from the 2D projections could reach a resolution of 0.72 Å. The 3D reconstructions were then compared with the fcc structure with a best-fit lattice parameter as a reference, which allowed the authors to obtain the atomic displacement field, and to map the full six-element strain tensor of the particles for each atomic position in 3D space (see and Fig. S20 in Ref [Citation33].).
With this approach, the authors could observe that the surface atoms of the nanocrystals had a larger strain compared with the core atoms. The origin of this larger strain was ascribed to a major disorder of the surface atoms, probably due to the accommodation of surface ligands.
Goris et al. [Citation34] proposed a reconstruction algorithm to study the 3D strain distribution in Au decahedral nanoparticles. Several 2D projections of the particles were obtained by tomography and then reconstructed in a 3D map. Each atom was then modeled by a 3D Gaussian function enabling a direct calculation of its coordinates. The final 3D reconstruction obtained for a Au nanodecahedron is shown in ).
Figure 7. (a) 3D visualization of the tomographic reconstruction of a Au nanodecahedron containing more than 90000 atoms, oriented along three different directions that are rotated over 0°, 45°, and 90°, respectively. [bottom] 3D strain analysis of a Au dechaedral nanoparticle. (b) Slice through the volume. The strain distribution is visualized using a color code and scaled between ±5%. (c) Variation of the lattice parameter along x. The mean interatomic distances and corresponding standard deviations are calculated from sets of equivalent distances in consecutive slices. (d) Slice through the
volume. The strain distribution is visualized using a color code and scaled between ±5%. (e) Variation of the lattice parameter along z. The mean interatomic distances and corresponding standard deviations are calculated from sets of equivalent distances in consecutive slices. Adapted from [Citation34]. Copyright © 2015 American Chemical Society.
![Figure 7. (a) 3D visualization of the tomographic reconstruction of a Au nanodecahedron containing more than 90000 atoms, oriented along three different directions that are rotated over 0°, 45°, and 90°, respectively. [bottom] 3D strain analysis of a Au dechaedral nanoparticle. (b) Slice through the volume. The strain distribution is visualized using a color code and scaled between ±5%. (c) Variation of the lattice parameter along x. The mean interatomic distances and corresponding standard deviations are calculated from sets of equivalent distances in consecutive slices. (d) Slice through the volume. The strain distribution is visualized using a color code and scaled between ±5%. (e) Variation of the lattice parameter along z. The mean interatomic distances and corresponding standard deviations are calculated from sets of equivalent distances in consecutive slices. Adapted from [Citation34]. Copyright © 2015 American Chemical Society.](/cms/asset/2a9f7d92-c55f-4c51-8f75-b0219de9b772/tapx_a_2127330_f0007_oc.jpg)
The authors then computed the derivatives of the displacement map so that 3D volumes are obtained corresponding to and
(see )). Furthermore, the variation of the lattice parameters was investigated along
and
based on the same slices (c,e). With this technique, the authors found a systematic outward expansion of the lattice both along the
and
directions. The expansion along
was limited to a few of the outer atomic layers and showed an asymmetry, likely related to the presence of a carbon support. These 3D results allowed to determine an outward lattice expansion of the particle along the
direction, which could not have been characterized without applying a 3D methodology.
4. Strain effects on the functional properties of nanoalloys
Strain changes the distances between atoms, and the superposition between orbitals centered on different atoms. As a result, a rich family of properties can be tuned by controlling the strain in a nanoparticle. As extensively investigated, catalytic [Citation1,Citation10–12], electronic [Citation20], optical [Citation13–21], magnetic [Citation22–30], mechanical [Citation87–89], and thermal [Citation90,Citation91] properties of nanoparticles can all be altered by applying strain [Citation1].
Strain in a nanoparticle also induces stress at the atomic level. This in turn can generate a phase transition [Citation92,Citation93] and phase segregation [Citation94–96], as well as several other momentous properties [Citation1,Citation97].
Here, we examine the effect of strain on the functional properties of nanoalloys, whereas the effects on the structural properties will be discussed in Section 5.
4.1. Chemical properties
Strain plays a dominant role in determining the catalytic activities for the nanoalloys. By forming alloys, a lattice strain is generated from the lattice mismatch between different components [Citation76,Citation98–102]. Given their low dimensionality, strain impacts their surface reactivity over more than a few atomic layers making it a powerful factor to modify the adsorption energies of reactive intermediates [Citation3,Citation8,Citation103,Citation104], and hence the catalytic properties of the nanoalloy.
The enhancement of catalytic performance is often related to the change of adsorption and binding energy of species on the bimetallic surface [Citation7]. The adsorption ability depends directly on the surface d-band level of the nanoparticles; when the d-band level is high, the adsorption is strong. By using DFT calculation, it has been shown that single metal atoms under strain have a broadened d-band along the direction of strain [Citation2]. With tensile strain, atoms are pulled away from their original stable locations, causing a decrease in the overlapping of the d orbitals among atoms. The level of d-band centre is closely related to the adsorption and desorption characteristics of the catalyst surface. The adsorptive binding energy of various chemical catalytic systems has a linear dependence on the catalyst d-band centre [Citation71]. CO and hydrogen adsorption/desorption, hydrogenation, oxygen reduction, and reforming are some widely studied reactions and processes [Citation100,Citation105]. Based on the above argument, the activity and selectivity can be improved by manipulating the composition (ligand effect) or the nanostructure (strain effect) of the bimetallic nanoparticles.
Cai et al. [Citation8] designed a platform based on Pd@Au core–shell nanoalloys to explore the synergistic effect of surface strain and interfacial polarization for enhanced photocatalytic performance in CO2 reduction. Enabled by the different lattice constants and electronegativities between Pd and Au, it was found that a compressive strain on the Au surface shifts up the d-band center and strengthens the adsorption of the key intermediate *COOH, while charge polarization occurring at the interface between Pd and Au facilitates charge separation and increases electron density at the Au surface.
Bok et al. [Citation106] synthetised atomically dispersed Au on tensile-strained Pd nanoparticles, to develop a novel catalyst design principle, enabling independent optimization of binding energies of reaction intermediates to improve the catalytic performance as well as notable resistance to CO poisoning. To induce a significant local tensile strain in Pd nanoparticles, the Pd precursors are reduced in a confined space of metal-organic frameworks (MOFs), see . Such local tensile strain remains even when a controlled amount of Au is incorporated to form M-AuPd.
Figure 8. (a) Tensile strain generation on AuPd alloy nanoparticle through MOF-confined reduction. Schematic of a nanoparticle synthesized in confined space. (b) Calculated Gibbs free energy diagram (at U = 0 V vs the computational hydrogen electrode model) for CO2 reduction via the COOH* intermediate on pristine Pd(111) with 0% (blue) or 4% (yellow) of lateral tensile strain applied to the bottom-most layer of the slab model, and Au1–Pd(111) with the distance between the adsorbate and Au1 of 2.5 Å and 4% of lateral tensile strain applied to the bottom-most layer of the slab model (Orange). Adapted from [Citation106]. Copyright © 2021, American Chemical Society.
![Figure 8. (a) Tensile strain generation on AuPd alloy nanoparticle through MOF-confined reduction. Schematic of a nanoparticle synthesized in confined space. (b) Calculated Gibbs free energy diagram (at U = 0 V vs the computational hydrogen electrode model) for CO2 reduction via the COOH* intermediate on pristine Pd(111) with 0% (blue) or 4% (yellow) of lateral tensile strain applied to the bottom-most layer of the slab model, and Au1–Pd(111) with the distance between the adsorbate and Au1 of 2.5 Å and 4% of lateral tensile strain applied to the bottom-most layer of the slab model (Orange). Adapted from [Citation106]. Copyright © 2021, American Chemical Society.](/cms/asset/29546711-eee2-4a8a-b75a-70ce2fa12709/tapx_a_2127330_f0008_oc.jpg)
Strasser et al. [Citation71] found that strain is at the origin of an exceptional electrocatalytic reactivity for the ORR of dealloyed Pt–Cu particles. By means of aberration-corrected, HAADF-STEM it was found that strain forms in Pt-enriched surface layers (shells) that are supported on an alloy particle core with a smaller lattice parameter. The compression in the shell modifies the d-band structure of the Pt atoms, and thereby weakens the adsorption energy of reactive intermediates compared to unstrained Pt and results in an increase in the catalytic reactivity, consistent with DFT-based calculations.
4.2. Optical properties
The investigation of the relationship between the optical properties of nanoparticles and strain has pointed out several interesting facts in the last decades. For example, Qian and Park [Citation14] showed that both compressive and tensile strain affect some optical properties of Au nanoparticles. In particular, they performed some calculations within the Mie scattering theory showing that for spherical Au nanoparticles in the range 10–100 nm there is a substantial change in the surface plasmon resonance (SPR) wavelength as well as in the intensity of absorption and scattering coefficients (see ). Following the works of Cai et al. [Citation15] and of Lermé et al. [Citation16], they implemented some modifications both to the free and core dielectric functions so that a direct dependence on the lattice parameter (and thus on strain) was highlighted. Such modifications demonstrated that, for all sizes, tensile strain induces a blue shift in the surface plasmon resonance wavelength as well as an increase in both absorption and scattering coefficients.
Figure 9. (a) Absorption and (b) scattering efficiencies for a 100 nm diameter gold nanoparticle as a function of strain. Reprinted from [Citation14], Copyright 2010, with permission from Elsevier.
![Figure 9. (a) Absorption and (b) scattering efficiencies for a 100 nm diameter gold nanoparticle as a function of strain. Reprinted from [Citation14], Copyright 2010, with permission from Elsevier.](/cms/asset/32230790-82d8-406c-a92a-ee01895b2518/tapx_a_2127330_f0009_oc.jpg)
On the other hand, compressive strain induces a red shift and a decrease in those coefficients. Moreover, it was also shown that, thanks to tensile strain, the intensity of the electric field in the proximity of the nanoparticle surface can be strongly increased, which is a very useful result for surface enhanced Raman scattering (SERS) applications; 5% tensile strain was found to increase the maximum local electric field by 63%. Again, for compressive strain the opposite holds. Thus, all these results pointed out that by controlling strain (in particular tensile strain), it is possible to enhance some optical properties of gold spherical nanoparticles of different sizes. The same authors also investigated silver spherical nanoparticles in the range 5–60 nm [Citation17] showing similar results, the only difference being the absence of a significant shift for plasmon resonance wavelength. This result has been attributed to the difference between interband transition wavelength and plasmon resonance wavelength, which is bigger for silver than for gold. A red shift in the surface plasmon resonance wavelength was observed experimentally in the work of Ameer et al. [Citation19], where some Ag nanoparticles were compressed rolling a glass tube on them with different amounts of load. In this process, the average nanoparticle diameter increased from 97 to 173 nm, and the height decreased from 85 to 28 nm. It was shown that the SPR red shift can be controlled by the amount of load applied to the tube. In particular, for the maximum load of 100 N, a shift of 192 nm was observed. Concerning other materials, the influence of strain on other optical properties was studied in the work of Satar et al. [Citation21]. Here, it is shown that for BiFeO3 nanoparticles with an approximate size of 80 nm there is a dependence of the energy band gap on strain. In particular, they calculated that for both tensile and compressive strain there is a decrease of such gap.
4.3. Magnetic properties
Some results were also obtained in the context of magnetic properties of nanoparticles and their relationship with strain. In the work of Shih and Wu [Citation22] Au nanoparticles in the average size range of 3.7–7.9 nm were prepared and studied. These nanoparticles were found to present some strain, both compressive and tensile, depending on size. The saturation magnetization was observed to substantially depart from the predicted Bloch law [Citation107], thus indicating the presence of some magnetic anisotropy. Following the uniaxial anisotropy Heisenberg model [Citation108,Citation109], they found that there exists some magnetic anisotropic energy which again depends on size. Finally, it was shown that strain and magnetic anisotropic energy have a very similar trend, thus suggesting that it is possible to tune such energy by means of strain.
Due to the possibility of various applications in different fields such as drug delivery, information storage and magnetoelectronic devices, Co nanoparticles have received a lot of attention in the recent years. In the works of Singh and Khare [Citation23,Citation24], the dependence between saturation magnetization and strain was studied for Co
nanoparticles in the size range 16–30 nm. It was found that there is some tensile strain in nanoparticles, increasing with the number of vacancies and defects, and decreasing with temperature and size. The saturation magnetization was observed to have a concave trend, increasing up to sizes near 20 nm and then decreasing up to the maximum size. This size dependence was attributed to a competition between two opposite effects. For smaller nanoparticles, the magnetization primarily depends on size, increasing with diameter. For larger sizes instead, decreasing strain induces a cationic redistribution from octahedral to tetrahedral sites. This in turn alters the inverse spin canting angle between octahedral sites, thus modifying the saturation magnetization of nanoparticles. An experimental observation suggests that this angle relates linearly with strain, since also the migration of
cations from octahedral to tetrahedral site shows a linear dependence with strain. In synthesis, the authors showed that it is indeed possible to obtain a manual modification of the saturation magnetization of Co
nanoparticles, through the control of their strain. Very similar results were also obtained by Ojha and Kant [Citation25].
Another aspect of the effect of strain on magnetic properties of NPs was investigated in the work of Manna et al. [Citation26]. Here, they showed with micromagnetic simulations that Ni nanocubes with an edge length of 200 nm undergo a transition when even moderate value of compressive strain are applied ( in absolute value). In particular, it was demonstrated that the magnetization configuration at remanence, which is characterized by the presence of magnetic vortexes on the sides of the cube, gradually turns into a simpler configuration with no vortexes, as the compressive strain is increased.
5. Strain-induced structural transformations of nanoalloys
In the previous Section, we have described the influence of atomic-level strain on the properties of nanoparticles and nanoalloys, in many application fields. Here we address another important issue, i.e. the effect of strain on the stability of specific configurations, in the case of nanoalloys of different kinds. This peculiar effect has been the object of recent works, mostly of theoretical and computational character [Citation31,Citation32,Citation40,Citation46,Citation48,Citation49,Citation110–117], but, in some cases, supported by experimental observations [Citation31,Citation114].
In Section 2, we have shown that nanoscale and alloying effects are at the origin of the distortion of interatomic distances in nanoalloys; in some cases, such distortions can be quite large, as in phase-separated core-shell nanoalloys with icosahedral geometry (see ). However, as one can easily guess, only a limited amount of strain can be tolerated by the nanoparticle: if strain is too high, the structure becomes unstable, and transformations towards less strained configurations are likely to take place. Such transformations can be predicted theoretically, by energy and stress calculations.
The most stable nanoalloy configurations at sufficiently low temperatures are typically identified by global optimization searches, which allow to find the lowest-energy geometric shapes and chemical arrangements for a given size and composition [Citation42]. These simulations are usually performed by using atomistic interaction models, such as the SMATB potential already introduced in Section 2; however, energy differences between the most relevant structures obtained in the simulations can be evaluated by DFT calculations, in order to check the relative stability of the different motifs also at the ab initio level. Using this scheme, the stability of nanoalloy shapes and chemical arrangements is evaluated, as a function of the size or of the composition; when the inversion of the relative stability of two motifs is observed (i.e. when the sign of the energy difference changes), it is said that a transformation between those motifs takes place. We remark that these are not dynamical transformations between configurations of a given nanoalloy, but changes in the equilibrium configuration of the system, due to the modification of either its size or composition.
Stress calculations allow to understand whether the above-mentioned transformations can be ascribed to strain effects. For each atom in the nanoparticle, we can define the local stress tensor as [Citation118]
In this equation, is the atomic energy of the
-th atom,
is the volume of the
-th atom in its bulk crystal structure,
and
(with
) are the cartesian components of the vector
joining atoms
and
,
is the distance between the two atoms. The local stress tensor quantifies the energetic cost of local strain. We note that, to calculate the stress tensor according to EquationEq. 3
(3) , we need to evaluate the energy of each given atom in the nanoparticle; this can be done if we use atomistic potentials, in which the total energy of the system is calculated as the sum of single-atom contributions, but it is not possible within the DFT approach, in which a similar quantity cannot be easily defined. The physical dimensions of the local stress tensor are those of a pressure; indeed, the trace of the tensor is proportional to the isotropic local pressure on atom
[Citation42]:
indicates compressive stress on atom
, and it is associated to negative atomic-level strain, i.e. to the contraction of interatomic distances with respect to the bulk value. On the contrary,
indicates tensile stress, and positive strain (expansion of bond distances), on atom
. In the first case, atom
would better fit in its site if it was smaller than it actually is, in the second case if it was bigger. Finally,
indicates the absence of stress, as it would be in the perfect infinite crystal. However, as in the case of strain, stress can be largely anisotropic, so that values of
close to zero may actually originate from the balance of contributions of opposite sign. To quantify anisotropic effects, the three principal stress components can be considered separately [Citation31]; these correspond to the eigenvalues of the symmetric 3
3 matrix, whose sum gives the isotropically averaged atomic pressure
. The non-homogeneous character of atomic-level strain, which has been extensively discussed in Section 2, is naturally reflected on the stress distribution within the nanoparticle, which can be visualized by stress maps of the same kind of those in . Usually, strain and stress maps closely match.
The comparison of total energy and stress calculations shows that highly stressed (and strained) structures are typically associated with high energy values, whereas the relaxation of stress is energetically advantageous. Moreover, stress relaxation has been proved to be the driving force for different structural transformations in nanoalloys. Due to stress effects, some specific configurations are either stabilized or destabilized, while varying the size and/or the composition of the system. Both the chemical ordering and the geometric shape of the nanoalloy can be affected, so that a wide variety of transformations has been observed and described in the recent literature. In the following, we discuss the most relevant results on this topic.
5.1. Stress-driven transformations of chemical ordering
Transformations in the chemical ordering pattern of bimetallic nanoparticles have been observed for both phase-separating [Citation48,Citation112] and intermixing systems [Citation114,Citation116], and have been related to the relaxation of atomic stress at the interface between the two metals.
Bochicchio et al. [Citation112] analysed different weakly miscible systems adopting core-shell chemical ordering at the nanoscale (Cu@Ag, Ni@Ag, Co@Ag and Co@Au), and investigated the optimal shape and placement of the core for different nanoparticle sizes, compositions and geometric shapes. In the case of the icosahedral geometry, a morphological instability of the core has been found. Specifically, the equilibrium shape and position of the core depend on the nanoalloy composition, changing from highly symmetric and perfectly centered to irregular and off-centered if the size of the core is increased above a critical value. The critical core size at which the transition takes place depends on the system and on the total size of the icosahedral nanoparticle (sizes of 561, 923 and 1415 atoms have been considered in the paper). The author calculated the local pressure on the atoms of the core, and showed that the core transformation is due to internal stress relaxation effects, coupled with the lattice mismatch between the smaller atoms of the core (Cu, Ni or Co) and the larger atoms of the shell (Ag or Au). When the core is small, its atoms are subjected to positive compressive stress, and the central placement of the core is therefore stabilized. When the core exceeds the critical size, stress on the outer core atoms becomes negative; substituting some of them with the larger Ag/Au atoms is therefore energetically favourable, as it allows to release some of the internal stress.
Laasonen et al. [Citation48] further investigated this chemical ordering transformation, in the case of core-shell M@Ag (M Cu, Ni, Co) icosahedral nanoalloys of size 561 and 1415 atoms. The authors calculated the overall pressure map of the nanoparticle for different compositions, and above the critical core size they considered both the centered-core configuration and the lowest-energy configuration with off-centered and asymmetric core. They found that, above the critical size, the atomic pressure is strongly negative (tensile stress) in the outer layer of the centered symmetric core, whereas it is positive (compressive stress) in the innermost layer of the Ag shell; the pressure difference at the core-shell interface is therefore quite large. In off-centered core configurations, pressure is generally closer to zero, and stress distribution is much more homogenous within the nanoparticle. Pressure maps obtained for Ni@Ag nanoparticles are displayed in , and clearly show the most effective stress equilibration achieved in off-centered core configurations. In the competition between centered and off-centered core, other effects have to be taken into account: the number of the strong M-M bonds is higher in the centered core configuration, whereas when the core is off-centered and asymmetric, more lower-energy M-Ag bonds are created; however, off-centered cores allow to put some M atoms in subsurface positions, which are quite favourable for these systems [Citation119]. When the core is sufficiently large, stress relaxation and subsurface effects overcompensate for the loss of M-M bonds, and the transformation occurs. In Ref [Citation48], the stronger energetic stability of off-centered cores of sufficiently large sizes has been confirmed also by DFT calculations.
Figure 10. Cross sections of AgNi icosahedra with centered symmetric and off-center low-symmetry cores. In the left column the arrangement of the atomic species is shown, with Ni atoms in red and Ag atoms in grey. In the right column the corresponding local pressure maps are shown. Negative, zero, and positive pressures correspond to blue, green, and red atoms, respectively. (a1) and (a2): 561-atom icosahedron with centered symmetric core. (b1) and (b2): 561-atom icosahedron with off-center core. (c1) and (c2): 1415-atom icosahedron with centered symmetric core. (d1) and (d2): 1415-atom icosahedron with off-center core. The Ni core is made of 147 atoms in (a1), (a2), (b1) and (b2), and of 309 atoms in (c1), (c2), (d1) and (d2). Reprinted with permission from [Citation48]. Copyright 2013 American Chemical Society.
![Figure 10. Cross sections of AgNi icosahedra with centered symmetric and off-center low-symmetry cores. In the left column the arrangement of the atomic species is shown, with Ni atoms in red and Ag atoms in grey. In the right column the corresponding local pressure maps are shown. Negative, zero, and positive pressures correspond to blue, green, and red atoms, respectively. (a1) and (a2): 561-atom icosahedron with centered symmetric core. (b1) and (b2): 561-atom icosahedron with off-center core. (c1) and (c2): 1415-atom icosahedron with centered symmetric core. (d1) and (d2): 1415-atom icosahedron with off-center core. The Ni core is made of 147 atoms in (a1), (a2), (b1) and (b2), and of 309 atoms in (c1), (c2), (d1) and (d2). Reprinted with permission from [Citation48]. Copyright 2013 American Chemical Society.](/cms/asset/9fe89ebb-fb3f-47ac-986c-899e07202506/tapx_a_2127330_f0010_oc.jpg)
An unusual chemical ordering transition was experimentally observed in AgPt nanoalloys by Pirart et al. [Citation114]. The authors pointed out the formation of the defect-free L11 ordered phase in small nanoparticles (up to 2.5 nm), with the alternation of pure Ag and Pt atomic layers in the (111) orientation; in larger nanoparticles the ordered phase breaks into multiple domains or is interrupted by faults. A precise HRTEM/STEM chemical ordering characterization showed that, in all cases, the AgPt L11 domains are surrounded by an extremely thin (mostly monoatomic) Ag surface layer, here referred to as Ag-skin. We note that, generally, an increase in the size of a nanoscale material is associated with the increased stability of its ordered phases, whereas in this case the opposite occurs. The L11 phase breaking in large object is due to internal stress relaxation effects, as the author demonstrated by calculations. The stability of the L11@Ag-skin phase in small nanoparticles was verified at the ab initio level, by full-DFT global optimization of chemical ordering of a 79-atoms truncated octahedron. Energy and stress calculations on larger nanoparticles were performed by an original atomistic many-body potential that stabilizes the L11 ordered phase for the AgPt system. According to the model, the L11@Ag-skin phase is energetically favourable up to 103 total atoms, corresponding to nanoparticle sizes of
3 nm, in good agreement with the experiments. For larger sizes, more complex arrangements become more stable, in which the surface layer is completely made of Ag atoms, the subsurface layer is enriched in Pt and the layer below is enriched in Ag (L11@Pt@Ag structures). These correspond to multidomain arrangements, with a central L11 core surrounded by thin L11 domains, with different orientations and three-layer thickness. Pressure maps show that the L11@Pt@Ag arrangement allows for a better stress equilibration compared to the more symmetrical L11@Ag in 1289-atoms truncated octahedral nanoparticles. Internal stress originates from the mismatch between the larger Ag and the smaller Pt atoms forming the alternating planes, which are compressed and stretched, respectively; an additional contribution is due to the presence of the Ag-skin surrounding the AgPt core. Stress increases with the nanoparticle size, so that when a critical size is reached, the perfect L11 breaks into multiple domains.
This topic was further analyzed by Front and Mottet [Citation116], who employed Monte Carlo simulations to study the chemical ordering of AgPt truncated octahedral nanoparticles of sizes atoms, corresponding to
nm, at which multidomain arrangements are observed in the experiments. The authors compared the perfect L11 phase surrounded by the Ag-skin (here referred to as L11/Ag) with different types of multidomain configurations. These configurations and their corresponding local stress maps are shown in , for the truncated octahedron of 2951 atoms. The best configuration is the one made by a reduced L11 ordered phase in the core, surrounded by an alternance of Ag/Pt/Ag concentric shells from the surface (L11/Pt/Ag structure in ). This is the structure which better allows to release the stress at the vicinity of the surface shell.
Figure 11. Different configurations for the AgPt truncated octahedron of size 2951 atoms, at composition 63.3% Ag. In the top row the nanoparticle cross-section shows its chemical arrangement, with Pt atoms in red and Ag atoms in grey. In the bottom row the corresponding stress maps are shown (local pressure is measured in GPa). From [Citation116]. Copyright IOP Publishing. Reproduced with permission. All rights reserved.
![Figure 11. Different configurations for the AgPt truncated octahedron of size 2951 atoms, at composition 63.3% Ag. In the top row the nanoparticle cross-section shows its chemical arrangement, with Pt atoms in red and Ag atoms in grey. In the bottom row the corresponding stress maps are shown (local pressure is measured in GPa). From [Citation116]. Copyright IOP Publishing. Reproduced with permission. All rights reserved.](/cms/asset/c42a13c5-413f-4769-847b-965b75fb5115/tapx_a_2127330_f0011_oc.jpg)
5.2. Surface rearrangements in core-shell nanoalloys
In core-shell nanoalloys with large size mismatch between the two metallic species, interatomic distances on the surface are usually strained. Surface strain can be particularly high in the case of a single-layer thick shell (sometimes referred to as skin) surrounding a core made of smaller atoms, as we have shown in . In these core-skin configurations, surface atoms may undergo different types of rearrangements, which allow to reduce to some extent their initial strain. Such strain-induced surface rearrangements are responsible for the formation of new peculiar shapes, which are not observed in elemental nanoparticles.
In icosahedral core-skin nanoalloys, the surface layer may assume configurations different from the Mackay stacking, namely the anti-Mackay [Citation120] and the chiral stacking [Citation46]. These configurations are shown in . In the anti-Mackay icosahedron, surface atoms occupy hcp-like instead of fcc-like sites on top of the Mackay core; surface atoms are fewer than in the Mackay case, and their intra-shell nearest-neighbour distances are more stretched. Due to the high degree of tensile stress on the surface, the anti-Mackay icosahedron is not a stable structure for elemental nanoparticles; on the other hand, for some sizes and compositions, it corresponds to the lowest-energy configuration of core-skin nanoalloys with large lattice mismatch, such as Cu@Ag, Co@Ag, Ni@Ag and Ni@Au [Citation40,Citation46,Citation110,Citation121,Citation122]. In these cases, the larger Ag/Au surface atoms benefit from a less dense shell; surface stress is reduced compared to the Mackay case, and the anti-Mackay structure is therefore more energetically favourable. The anti-Mackay stacking is favorable not only at magic sizes and compositions, i.e. those at which a perfect anti-Mackay shell can be built, but also for different amounts of shell atoms: for smaller amounts, incomplete anti-Mackay shells have been observed; for larger amounts, islands form on top of a perfect anti-Mackay layer. These results have been obtained by global optimization searches for AgCu nanoalloys [Citation40,Citation110], and further confirm the energetic stability of the anti-Mackay icosahedral motif.
Figure 12. Icosahedral core-skin Cu@Ag nanoparticles. The Cu core is a perfect Mackay icosahedron of 147 atoms, whereas the Ag skin takes different stacking: (A) Mackay, (B) anti-Mackay and (C) chiral. In (A) the Ag shell is made of 162 atoms, in (B) and (C) it is made of 132 atoms. In the bottom row the stacking of the three outer atomic layer is shown, with the Ag surface layer in grey, and the two underlying Cu layers in Orange (subsurface) and yellow (third layer). In (A) Ag atoms occupy fcc-like sites with respect to the Cu layers, whereas (B) they occupy hcp-like sites. In (C) the shell has undergone a chiral distortion, so that Ag atoms are displaced from the hcp-like sites. Reprinted with permission from [Citation46]. Copyright 2010 American Chemical Society.
![Figure 12. Icosahedral core-skin Cu@Ag nanoparticles. The Cu core is a perfect Mackay icosahedron of 147 atoms, whereas the Ag skin takes different stacking: (A) Mackay, (B) anti-Mackay and (C) chiral. In (A) the Ag shell is made of 162 atoms, in (B) and (C) it is made of 132 atoms. In the bottom row the stacking of the three outer atomic layer is shown, with the Ag surface layer in grey, and the two underlying Cu layers in Orange (subsurface) and yellow (third layer). In (A) Ag atoms occupy fcc-like sites with respect to the Cu layers, whereas (B) they occupy hcp-like sites. In (C) the shell has undergone a chiral distortion, so that Ag atoms are displaced from the hcp-like sites. Reprinted with permission from [Citation46]. Copyright 2010 American Chemical Society.](/cms/asset/899792a1-8582-47bf-a8f8-bdb5cb3c82eb/tapx_a_2127330_f0012_oc.jpg)
The chiral icosahedron is obtained from the anti-Mackay icosahedron by a chiral distortion of the shell. This structure has been observed for the first time by Bochicchio and Ferrando [Citation46], in the case of Cu@Ag, Co@Ag, Ni@Ag and Ni@Au nanoalloys. The authors performed global optimization searches at different magic sizes and composition for the perfect anti-Mackay core-skin configurations. They found that, at small sizes, the anti-Mackay configuration actually corresponds to the global minimum; however, for sufficiently large nanoparticles, another structure is more energetically favourable, i.e. the chiral icosahedron. The stability reversal of the two icosahedral motifs at increasing nanoparticle size has been verified also at the DFT level.
Recently, Settem and Kanjarla [Citation122] investigated the anti-Mackay-to-chiral transformation in the case of Cu@Ag nanoparticles, and explained it by considering the interplay between core and shell energetics. The author calculated the energy contribution of the Cu core and of the Ag shell separately, according to the embedded-atom method (EAM) atomistic potential. They found that, at each magic size and composition, the energy of the Ag shell is lower when it takes the chiral stacking, whereas the energy of the Cu core is lower in the anti-Mackay structure. The shell and the core therefore prefer different stacking, and the balance between these two opposite preferences determines which is the most stable configuration at each size. At small sizes, the core contribution prevails and the anti-Mackay icosahedron turns out to be the lowest-energy structure. The absolute values of the energy variation of the Ag shell (negative) and of the Cu core (positive) due to the anti-Mackay-to-chiral transformation both increase with nanoparticle size, but with different velocities; the Ag contribution increases more rapidly, so that, at some critical size, the transformation becomes energetically favourable. The smallest magic size at which the chiral stacking is more favourable than the anti-Mackay one is 521 atoms (Ag212Cu309). The critical size depends on the system, and specifically on the lattice mismatch between core and shell atoms: in systems with larger lattice mismatch than AgCu (AgCo, AgNi and AuNi) the transition to chiral stacking is already favourable at size 127 [Citation46]. In the case of AgCu, the transformation was further analysed by measuring the bond length changes. The Cu–Cu bonds are compressed, whereas some of the Ag-Cu bonds become stretched and some become shorter, as the Ag atoms are displaced from the ideal hcp-like stacking positions; these changes are responsible for the increase of the core energy upon transition to the chiral stacking. Also the distances between Ag atoms in the shell move away from the ideal ones; however, in this case, strain effects are overcompensated by the creation of new Ag–Ag bonds, so that the Ag shell always benefits from the transition. Finally, we note that, as in the case of the anti-Mackay configuration, shells with chiral stacking have been observed also for non-magic sizes [Citation40,Citation110].
Truncated octahedral core-skin nanoalloys may undergo surface reconstruction, as well. Rearranged truncated octahedral shells have been first observed by Baletto et al. [Citation123] in molecular dynamics simulations of the growth of Ag shells on Cu truncated octahedra, then by Delfour et al [Citation124] in Monte Carlo simulations of AgCu truncated octahedral nanoalloys of different compositions. Bochicchio and Ferrando [Citation112] observed surface reconstructions in Co@Au truncated octahedral nanoalloys, involving the (100) Au facets covering the Co core. A major contribution to the understanding of such surface rearrangements was given by Panizon and Ferrando [Citation32]; the authors combined atomistic and DFT calculations to analyze the behaviour of multiple truncated octahedral core-skin nanoalloys (Co@Au, Co@Pt, Ni@Pt, Co@Ag, Ni@Ag, Cu@Ag, Cu@Au, Rh@Au, Ni@Rh and Ni@Pd), and found that morphological transformations of the surface layer are always energetically favourable. Recently, Settem et al [Citation117] identified different types of surface reconstructions, which are shown in . The configurations in the figure have been obtained in the case of truncated octahedral Cu cores of different sizes surrounded by a monolayer Ag shell, but, as the authors state, they are common to a wide class of bimetallic systems with large lattice mismatch, such as AgNi, AgCo, PtCo, PdNi and AuRh. In all cases, the structural transformation is restricted to the surface layer, whereas the core keeps its original shape; however, the arrangement of the shell affects both the surface and the internal strain, with deep consequences on the nanoparticle stability.
Figure 13. Possible surface arrangements in truncated octahedral core-skin nanoalloys. In some cases the inner core is shown. Surface atoms are coloured according to their energy, whereas core atoms are coloured according to their stacking. (a) Perfect truncated octahedron. (b-c) Shell rearrangements with (111) facets in fcc stacking and pseudo hexagonal facets; in (b), pseudo hexagonal facets have rhombic shape. (d-e) Shell rearrangements with (111) facets in hcp stacking. (f-g) Shell rearrangements with half of the (111) facets in fcc stacking and half in hcp stacking. All configurations have been obtained for Cu@Ag nanoalloys, but have been observed in many other bimetallic systems with lattice mismatch between core and shell atoms. Reprinted [Citation117], Copyright 2022, with permission from Elsevier.
![Figure 13. Possible surface arrangements in truncated octahedral core-skin nanoalloys. In some cases the inner core is shown. Surface atoms are coloured according to their energy, whereas core atoms are coloured according to their stacking. (a) Perfect truncated octahedron. (b-c) Shell rearrangements with (111) facets in fcc stacking and pseudo hexagonal facets; in (b), pseudo hexagonal facets have rhombic shape. (d-e) Shell rearrangements with (111) facets in hcp stacking. (f-g) Shell rearrangements with half of the (111) facets in fcc stacking and half in hcp stacking. All configurations have been obtained for Cu@Ag nanoalloys, but have been observed in many other bimetallic systems with lattice mismatch between core and shell atoms. Reprinted [Citation117], Copyright 2022, with permission from Elsevier.](/cms/asset/f0948ab7-622d-4b0d-881e-707f8443d465/tapx_a_2127330_f0013_oc.jpg)
In ) the Ag atoms occupy fcc sites, building up a perfect truncated octahedron; due to the lattice mismatch between core and shell atoms, the latter are subjected to compressive strain, which can be partially released by some surface rearrangements. Indeed, perfect fcc shells are stable only in the case of Ni@Cu nanoalloys, in which the mismatch is low (2.6% compared to 7–15% of the other bimetallic systems). Energetically favourable surface reconstructions include the transformation of the open (100) facets into close-packed (111)-like pseudo hexagonal facets, as in ) and (c). The (111) facets are not involved in the transformation and keep the original fcc stacking.
In the shell arrangement of ), the pseudo hexagonal facts have rhombic shape, so that the overall structure has pyritohedral symmetry. The square-to-rhombus transformation of the (100) facets is the first type of rearrangement of the truncated octahedral shell that has been described in the literature [Citation123,Citation124]. More recently, it has been extensively discussed by Panizon and Ferrando [Citation32]. The authors found that the transition from the truncated octahedral to the pyritohedral shell arrangement considerably lowers the energy of the nanoparticle, for different bimetallic systems in the size range 2–3 nm. The energy gain is due to the formation of new nearest-neighbours bonds in the original (100) facets, and to the equilibration of the atomic stress; pressure maps show that the initially high compressive stress in the middle of the surface facets is strongly reduced after the shell transformation, and that the tensile stress on the core atoms diminishes as well.
The configuration of ) is obtained by an alternative surface rearrangement, in which the adjacent atomic rows of the original (100) facets shift in opposite directions; in this way a different type of pseudohexagonal facet is created. This configuration has been previously observed in different core-skin nanoalloys [Citation32,Citation112]. In Ref [Citation32], the formation of pyritohedral structures with rhombic facets is not observed in nanoparticles larger than 3 nm; at these sizes, the authors found that the shell reshaping always produce configurations similar to that of ).
In Ref [Citation117], the authors describe novel shell arrangements, in which the (111) facets are either in hcp () and (e)) or in a mixed fcc/hcp stacking () and (g)); these arrangements are proved to be more energetically favourable compared to the fcc ones, since the surface is less dense and stress is therefore reduced.
Surface rearrangements have been observed also in core-shell nanoalloys in which the shell is thicker than a single layer. In Cu@Ag and Rh@Au nanoalloys with two-layer thick shells, both Ag/Au layers undergo fcc-type reconstructions, with the formation of pseudohexagonal facets [Citation117].
In the case of AgCu, some strain-induced reshaping of the Ag surface has been observed by Settem et. al [Citation115] also in nanoparticles with very small amounts of Cu atoms. The authors showed that the defect-free truncated octahedral shape is stable only when few Cu atoms are included in the Ag matrix (below 2.5 atom % at size 405 atoms); if the amount of Cu is increased, the formation of stacking defects on the nanoparticle surface becomes energetically favourable. The number of surface defects, which consist of (111) facets in hcp stacking, increases with the amount of Cu atoms in the nanoalloys. The transition from the defect-free to the defective truncated octahedron is due to strain effects: adjacent (111) facets in hcp stacking create highly compressed subsurface sites below the interposed edge, in which the small Cu atoms can favourably accommodate.
Finally, strain-induced surface rearrangements have been observed also in decahedral core-skin Cu@Ag, Co@Ag, Ni@Ag and Co@Au nanoalloys [Citation32,Citation117]. Dechaedral shells undergo the same types of reconstructions as truncated octahedral ones, with (111) facets in either fcc-like, hcp-like or mixed fcc/hcp-like stacking. The (100)-like facets of the Marks decahedron transform into closed-packed pseudohexagonal facets, which can take rhombic shape. In all cases, the shell becomes chiral, as observed for icosahedral nanoparticles.
5.3. Shape transformations at varying nanoalloy composition
In some cases, the relaxation of atomic-level stress induces drastic changes in the overall nanoparticle shape. Such transformations occur in nanoalloys with some degree of lattice mismatch between the two metallic components, and are triggered by variations in their composition. Specifically, when some critical composition is reached, the relative stability of two competing geometric motifs is reversed; the new equilibrium shape allows for a better relaxation of the local stress that originates from putting together atoms of different sizes. This effect opens up interesting opportunities in the application field, as it is possible to control the geometric shape of the nanoalloy by tuning its composition.
The first example of composition-dependent structural transformation has been reported by Bochicchio et al. [Citation111]. The author considered AuPt nanoalloys of size 55 atoms and performed global optimization searches to find the lowest-energy isomer at each possible composition. In most cases, the perfect icosahedron turned out to be the best structure; however, the authors identified a window of intermediate compositions in which a different structure, belonging to the decahedral motif, is more stable.
Panizon et. al [Citation49] studied how the presence of small percentages of impurities affects the geometric shape of nanoalloys containing up to a few thousand atoms. The authors observed that morphology transitions from crystalline to icosahedral structures can be forced by using small impurities, which are able to release some compressive stress at the core of icosahedral matrices. We note that, in single-component clusters, large icosahedra are typically metastable structures; they can be obtained as a result of the kinetics of the growth process, but they may transform into lower-energy crystalline structures later on. The work of Panizon et al. shows that the stability of icosahedra can be largely increased by inserting a very small amount of impurities, making thus possible their employment in the application field.
The authors considered a wide variety of bimetallic systems, and employed global optimization searches within the atomistic SMATB model and DFT calculation to compare the stability of the crystalline truncated octahedron and of the icosahedron depending on the nanoalloy composition. The fcc-to-icosahedron transformation was observed in CuAg, NiAg, CoAg, NiCu and CoAu nanoalloys of size 586 atoms. These are phase-separating systems, taking core-shell chemical arrangements at equilibrium, with the first (smaller) element in the nanoparticle core. Pure Ag, Cu and Au 586-atoms clusters take the perfect truncated octahedral shape at equilibrium, whereas icosahedra are considerably higher in energy; however, if some impurities of smaller atomic size are inserted (Cu/Ni/Co in Ag, Ni in Cu and Co in Au), the energy difference between the two motifs decreases and, when a critical threshold is reached, the stability reversal is observed, as shown in the top panel of . The critical percentage of impurity at which the transformation takes place is different for the different systems; specifically, it depends on the initial energy difference between the two motifs, and on the lattice mismatch between the two metallic species. However, in all cases, small percentages of impurities are needed to stabilize the icosahedral shape, in the range 1.4–6%. For Cu@Ag nanoalloys the same transformation has been observed also at much larger sizes, up to 2406 atoms; the critical Cu percentage increases with size, but it remains lower than 4% (see the bottom panel of ).
Figure 14. Top: Energy difference between the best icosahedron and the best fcc structure as a function of the percentage of impurities I% for core-shell systems at size 586: Cu@Ag (gray), Ni@Ag (mauve), Co@Ag (green), Ni@Cu (Orange), and Co@Au (yellow). The change of sign in
indicates a transition from fcc to icosahedron. Note that the fcc-to-icosahedron transformation takes place in Cu@Ag and not in Ag@Cu, as incorrectly written in the schematic representation. Bottom: critical percentage of impurities I% at which the transition occurs as a function of the nanoparticle size
in the case of Cu@Ag nanoalloys. Reprinted with permission from [Citation49]. Copyright 2014 American Chemical Society.
![Figure 14. Top: Energy difference between the best icosahedron and the best fcc structure as a function of the percentage of impurities I% for core-shell systems at size 586: Cu@Ag (gray), Ni@Ag (mauve), Co@Ag (green), Ni@Cu (Orange), and Co@Au (yellow). The change of sign in indicates a transition from fcc to icosahedron. Note that the fcc-to-icosahedron transformation takes place in Cu@Ag and not in Ag@Cu, as incorrectly written in the schematic representation. Bottom: critical percentage of impurities I% at which the transition occurs as a function of the nanoparticle size in the case of Cu@Ag nanoalloys. Reprinted with permission from [Citation49]. Copyright 2014 American Chemical Society.](/cms/asset/8197cb74-803a-4cb4-a0d2-480198ba0d94/tapx_a_2127330_f0014_oc.jpg)
The fcc-to-icosahedron transformation takes place also in bimetallic systems with rather different properties, such as NiPd. At the nanoscale, the smaller Ni atoms have the tendency to occupy the inner sites, but, at variance with the previous systems, Ni and Pd present a tendency to intermix in the bulk crystal on the Pd-rich side [Citation125]. The incorporation of the small Ni impurities within the Pd matrix induces the same shape transformation observed in phase-separating systems. However, in this case, Ni atoms do not form a compact aggregate in the innermost sites of the icosahedron, which are the more strongly compressed, but are somewhat diluted; stress relaxation is less effective, therefore the transformation occurs at larger impurity percentages ( 10% at size 586).
Finally, the authors analysed the behaviour of Rh@Ni nanoalloys; this system is weakly miscible, but with the atoms of the matrix being smaller than the impurities. Here, the transition is in the opposite direction: substituting Rh impurities inside an icosahedral Ni matrix of magic size 923 atoms causes a transition to a fcc truncated octahedral structure for a critical impurity percentage of 8%. Again, this shape transformation is due to atomic stress relaxation effects.
Nelli et al. [Citation31] demonstrated both experimentally and theoretically that the shape of AuPd nanoalloys can be controlled by varying their composition. The morphology of different nanoparticle samples grown in the gas phase was characterized by aberration-corrected HRTEM/STEM; the samples were prepared by using different amounts of Au, which was varied from 0% (pure Pd nanoparticles) to 35%. Depending on the Au content, rather different shape distributions were observed: in pure Pd samples, fcc truncated octahedra were by far dominant; by increasing the Au content, icosahedral nanoparticles were observed more and more frequently, eventually becoming the most abundant geometric shape at 25% Au composition (see ).
Figure 15. Evolution of the percentage of icosahedral structures (%Icosahedra) in different AuPd nanoparticle samples grown in the gas phase, as a function of their chemical composition (% Au). Each curve refers to a different growth condition (see Ref [Citation31]. for more details). Adapted with permission from [Citation31]. Copyright 2021 American Chemical Society.
![Figure 15. Evolution of the percentage of icosahedral structures (%Icosahedra) in different AuPd nanoparticle samples grown in the gas phase, as a function of their chemical composition (% Au). Each curve refers to a different growth condition (see Ref [Citation31]. for more details). Adapted with permission from [Citation31]. Copyright 2021 American Chemical Society.](/cms/asset/93427a1a-1ad7-4dbb-b2d3-dbd0d51dfab3/tapx_a_2127330_f0015_oc.jpg)
The fcc-to-icosahedron shape transformation suggested by the experimental data was confirmed by theoretical calculations, in which the authors performed global optimization searches by using the atomistic SMATB interaction model, for AuPd nanoalloys of sizes 150, 200, 250 and 300 atoms, and of different compositions in the Pd-rich region. In pure Pd clusters, the fcc arrangement is the most stable for all sizes; at increasing Au content, the energy difference between the icosahedral and the fcc motif decreases, and becomes negative at some critical Au concentration. The critical percentage at which the stability reversal takes place depends on the nanoalloy size: fewer Au atoms are needed at sizes 150 and 300, which are close to the magic sizes for the Mackay icosahedron (147 and 309 atoms). Free energy calculations performed within the harmonic superposition approximation (HSA) at 300 and 600 K showed that entropic contributions tend to further stabilize icosahedra for increasing temperature. The higher stability of AuPd icosahedral nanoparticles compared to fcc ones at Pd3Au composition has been previously reported by Zhu et al. [Citation126].
As in Ref [Citation49], the driving force for the fcc-to-icosahedron shape transformation is proved to be the relaxation of local stress in the icosahedral structure, achieved by the incorporation of a pure nanoparticle of some impurities with rather different atomic size. However, at variance with Ref [Citation49], Au impurities are larger than Pd atoms, and preferentially occupy surface sites (as found both in the computationally optimized nanoparticles and in the experimentally observed ones). In this case, the stress component released by a large-size impurity is the intra-layer tensile stress on the surface of the icosahedron. On the other hand, in fcc nanoparticles surface sites are subjected to compressive stress, which further increases due to the substitution with atoms of larger radius. In summary, Au impurities differently affect the surface pressure of Pd matrices of icosahedral and fcc structure, being beneficial in the first case and disadvantageous in the latter; the energy gain due to the replacement is considerably larger in the icosahedron, which therefore becomes energetically favourable against the fcc when a sufficient number of impurities is introduced.
6. Conclusions
In this Review, we discussed what atomic-level strain is and its crucial interplay with structural and functional properties of nanoalloys.
In Section 2, we presented the possible origins of strain in nanoparticles and nanoalloys and we pointed out the strongly non-homogeneous and anisotropic character of this quantity. We analysed how strain is affected by the shape of a nanoparticle by comparing the strain distribution in crystalline nanoparticles such as the truncated octahedron, with that in the noncrystalline icosahedron. We demonstrated that in the former strain distribution is mostly due to the coordination-number/bond-length correlation at the surface, whereas in the latter purely geometric effects are dominant. Finally, we discussed how the chemical ordering of a nanoalloy influences its strain distribution. Particularly we show that in core-shell nanoalloys with significant size mismatch between the two metallic species, surface strain can change from positive to close to zero, and then to strongly negative by varying the dimension of the core, with major consequences on the nanoparticle stability and on its properties.
In Section 3, we analysed how atomic-level strain can be experimentally measured, and we reviewed a selection of relevant results achieved on strain measurement in nanoparticles. Particularly we presented that aberration corrected high-resolution transmission electron microscopy can be used for analysing strain distributions in nanoalloys. Various approaches can be used to obtain qualitative or quantitative sub-angstrom resolution strain maps. This latter can be reached by introducing computational methods that allow to improve the signal-to-noise ratio and to perform an accurate determination of the atomic positions. An outstanding recent study [Citation33] demonstrates how 3D strain distributions can be calculated with a sub-angstrom resolution, on 3D reconstructions of the nanoparticles.
In Section 4, we discussed how strain in nanoparticles and nanoalloys represent an important tool to manipulate and engineering their functional properties. By changing the distances between atoms, and the superposition between orbitals centered on different atoms, strain affects the catalytic, magnetic and optical properties of nanoparticles and nanoalloys.
Finally, in Section 5, we deeply analysed the atomic-level stress arising from atomic-level strain, and we discussed how it can induce structural transformations at the nanoscale. Particularly, we showed that strain can induce large atomic stress within the nanoparticles, which can affect the stability of specific configurations. If the structure becomes unstable, transformations towards structures with smaller atomic stress are likely to take place. Such transformation can affect both the chemical ordering and the geometric shape of the nanoalloy. We discussed how transformations in the chemical ordering pattern of nanoalloys (both phase-separating and intermixing) can be ascribed to the relaxation of atomic stress at the interface between the two metals. Finally, we presented the peculiar case of core-shell nanoalloys with large size mismatch between the two metallic species, showing the different kinds of rearrangements (in the surface or in the overall shape) that such particles can undergo to reduce to some extent their initial strain.
Besides the intensive research done, many are the perspectives of the field of strain engineering in metal nanoalloys.
So far, the 2D experimental characterization of strain in nanoparticles focused on the study of monometallic and bimetallic nanoparticles, while the 3D mapping was applied, to the best of our knowledge, only on monometallic nanoparticles. However, the possibility of performing 3D quantification of strain distribution on nanoalloys would represent a significant and necessary step towards a deeper understanding of various strain- and stress-related phenomena, with interesting potentiality in various fields of application.
For instance, a deeper understanding of how the d-band shifts in the case of bimetallic and multimetallic nanoalloys would also represent a promising starting point towards the developments of nanoalloys with outstanding catalytic functionalities, which could be used as building blocks for developing new strain engineered materials.
Further studies on the shape-relaxation phenomena can be done to better understand the origin and potentiality of this phenomenon also in the challenging context of a multimetallic nanoalloy.
Aknowledgments
DN and CR acknowledge support from the PRIN 2017 project UTFROM of the Italian MIUR and from the Progetto di Eccellenza of the Physics Department of the University of Genoa. The authors acknowledge networking support from the IRN Nanoalloys of CNRS. The authors gratefully acknowledge Riccardo Ferrando for useful discussions.
Disclosure statement
No potential conflict of interest was reported by the author(s).
Correction Statement
This article has been corrected with minor changes. These changes do not impact the academic content of the article.
References
- Yang S, Liu F, Chao W, et al. Tuning surface properties of low dimensional materials via strain engineering. Small. 2016;12:4028–43.
- Mavrikakis M, Hammer B, Nørskov JK. Effect of strain on the reactivity of metal surfaces. Phys Rev Lett. 1998;81:2819.
- Pingel TN, Jørgensen M, Yankovich AB, et al. Influence of atomic site-specific strain on catalytic activity of supported nanoparticles. Nat Commun. 2018;9:1–9.
- Hou T, Zhang S, Chen Y, et al. Hydrogen production from ethanol reforming: catalysts and reaction mechanism. Renew Sust Energ Rev. 2015;44:132–148.
- Mazumder V, Lee Y, Sun S. Recent development of active nanoparticle catalysts for fuel cell reactions. Adv Funct Mater. 2010;20:1224–1231.
- Walsh MJ, Yoshida K, Kuwabara A, et al. On the structural origin of the catalytic properties of inherently strained ultrasmall decahedral gold nanoparticles. Nano Lett. 2012;12:2027–2031.
- Wu J, Li P, Pan Y-T, et al. Surface lattice-engineered bimetallic nanoparticles and their catalytic properties. Chem Soc Rev. 2012;41:8066–8074.
- Cai X, Wang F, Wang R, et al. Synergism of surface strain and interfacial polarization on Pd@Au core–shell cocatalysts for highly efficient photocatalytic CO2 reduction over TiO2. J Mater Chem A. 2020;8:7350–7359.
- Daio T, Staykov A, Guo L, et al. Lattice strain mapping of platinum nanoparticles on carbon and SnO2 supports. Sci Rep. 2015;5:1–10.
- Zhang X, Lu G. Computational design of core/shell nanoparticles for oxygen reduction reactions. J Phys Chem Lett. 2014;5:292–297.
- Gauthier Y, Schmid M, Padovani S, et al. Adsorption sites and ligand effect for CO on an alloy surface: a direct view. Phys Rev Lett. 2001;87:36103.
- Bai S, Wang C, Deng M, et al. Surface polarization matters: enhancing the hydrogen-evolution reaction by shrinking pt shells in Pt–Pd–graphene stack structures. Angew Chem. 2014;126:12316–12320.
- Dhara S, Imakita K, Giri PK, et al. Strain dependence of the nonlinear optical properties of strained Si nanoparticles. Opt Lett. 2014;39:3833–3836.
- Qian X, Park HS. The influence of mechanical strain on the optical properties of spherical gold nanoparticles. J Mech Phys Solids. 2010;58:330–345.
- Cai W, Hofmeister H, Dubiel M. Importance of lattice contraction in surface plasmon resonance shift for free and embedded silver particles. Eur Phys J D. 2001;13:245–253.
- Lermé J, Pellarin M, Cottancin E, et al. Influence of lattice contraction on the optical properties and the electron dynamics in silver clusters. Eur Phys J D. 2001 11;17:213–220.
- Qian X, Park HS. Strain effects on the SERS enhancements for spherical silver nanoparticles. Nanotechnology. 2010;21:365704.
- Dhara S, Giri P. Size dependent anisotropic strain and optical properties of strained Si nanocrystals. J Nanosci Nanotechnol. 2011;11:9215–9221.
- Ameer FS, Varahagiri S, Benza DW, et al. Tuning localized surface plasmon resonance wavelengths of silver nanoparticles by mechanical deformation. J Phys Chem C. 2016;120:20886–20895.
- Smith AM, Mohs AM, Nie S. Tuning the optical and electronic properties of colloidal nanocrystals by lattice strain. Nat Nanotechnol. 2009;4:56–63.
- Satar NSA, Aziz AW, Yaakob MK, et al. Experimental and first-principles investigations of lattice strain effect on electronic and optical properties of biotemplated BiFeO3 nanoparticles. J Phys Chem C. 2016;120:26012–26020.
- Shih P-H, Wu SY. Magnetic anisotropic energy gap and strain effect in Au nanoparticles. Nanoscale Res Lett. 2009 9;5:25–30.
- Singh S, Khare N. Defects/strain influenced magnetic properties and inverse of surface spin canting effect in single domain CoFe2O4 nanoparticles. Appl Surf Sci. 2016;364:783–788.
- Singh S, Khare N. Effect of intrinsic strain on the optical bandgap and magnetic properties of single domain CoFe2O4 nanoparticles. Appl Phys A. 2018;124: 1–7.
- Ojha VH, Mohan Kant K. Investigation of structural and magnetic properties of strained CoFe2O4 nanoparticles. J Phys Chem Solids. 2021;148:109655.
- Manna S, Kim JW, Lubarda MV. Characterization of strain and its effects on ferromagnetic nickel nanocubes. AIP Adv. 2017;7:125025.
- Eklund C-J, Fennie CJ, Rabe KM. Strain-induced ferroelectricity in orthorhombic CaTiO3 from first principles. Phys Rev B. 2009;79:220101.
- Zeches RJ, Rossell MD, Zhang JX, et al. A strain-driven morphotropic phase boundary in BiFeO3. Science. 2009;326:977–980.
- Sun Y, Wang C, Chu L, et al. Ni-doping effect on the magnetic transition and correlated lattice contraction in antiperovskite Mn3ZnN compounds. Solid State Commun. 2012;152:446–449.
- Zhou XH, Huang Y, Chen XS, et al. Effects of uniaxial strain on magnetic interactions in Co-doped ZnO nanowires: first-principles calculations. Solid State Commun. 2012;152:19–23.
- Nelli D, Roncaglia C, Ferrando R, et al. Shape changes in AuPd alloy nanoparticles controlled by anisotropic surface stress relaxation. J Phys Chem Lett. 2021;12:4609–4615.
- Panizon E, Ferrando R. Strain-induced restructuring of the surface in core@shell nanoalloys. Nanoscale. 2016;8:15911–15919.
- Kim BH, Heo J, Kim S, et al. Critical differences in 3D atomic structure of individual ligand-protected nanocrystals in solution. Science. 2020;368:60–67.
- Goris B, De Beenhouwer J, De Backer A, et al. Measuring lattice strain in three dimensions through electron microscopy. Nano Lett. 2015;15:6996–7001.
- Reboul CF, Heo J, Machello C, et al. SINGLE: atomic-resolution structure identification of nanocrystals by graphene liquid cell EM. Sci Adv. 2021;7:eabe6679.
- Yang Y, Chen C-C, Scott MC, et al. Deciphering chemical order/disorder and material properties at the single-atom level. Nature. 2017;542:75–79.
- Bals S, Goris B, Liz-Marzán LM, et al. Three-dimensional characterization of noble-metal nanoparticles and their assemblies by electron tomography. Angew Chem. 2014;53:10600–10610.
- Goris B, De Backer A, Van Aert S, et al. Three-dimensional elemental mapping at the atomic scale in bimetallic nanocrystals. Nano Lett. 2013;13:4236–4241.
- Mukherjee D, Gamler JTL, Skrabalak SE, et al. Lattice strain measurement of core@ shell electrocatalysts with 4D scanning transmission electron microscopy nanobeam electron diffraction. ACS Catal. 2020;10:5529–5541.
- Settem M, Kanjarla AK. On the nature of the structural transitions between anti-Mackay stacking, chiral stacking and their thermal stability in AgCu nanoalloys. Comput Mater Sci. 2020;184:109822.
- Butt H-J, Graf K, Kappl M. Physics and chemistry of interfaces. Hoboken, New Jersey: John Wiley & Sons; 2013.
- Ferrando R. Structure and properties of nanoalloys. Vol. 10, Amsterdam, The Netherlands: Frontiers of Nanoscience; 2016. p. 1–337. Elsevier Science.
- Cyrot-Lackmann F, Ducastelle F. Binding energies of transition-metal atoms adsorbed on a transition metal. Phys Rev B. 1971;4:2406–2412.
- Gupta RP. Lattice relaxation at a metal surface. Phys Rev B. 1981;23:6265.
- Rosato V, Guillopé M, Legrand B. Thermodynamical and structural properties of f.c.c. transition metals using a simple tight-binding model. Phil Mag A. 1989;59:321.
- Bochicchio D, Ferrando R. Size-dependent transition to high-symmetry chiral structures in AgCu, AgCo, AgNi, and AuNi nanoalloys. Nano Lett. 2010;10:4211–4216.
- Palomares-Baez J-P, Panizon E, Ferrando R. Nanoscale effects on phase separation. Nano Lett. 2017;17:5394–5401.
- Laasonen K, Panizon E, Bochicchio D, et al. Competition between icosahedral motifs in AgCu, AgNi, and AgCo nanoalloys: a combined atomistic-DFT study. J Phys Chem C. 2013;117:26405–26413.
- Panizon E, Bochicchio D, Rossi G, et al. Tuning the structure of nanoparticles by small concentrations of impurities. Chem Mater. 2014;26:3354–3356.
- Pittaway F, Paz-Borbón LO, Johnston RL, et al. Theoretical studies of palladium-gold nanoclusters: pd-Au clusters with up to 50 atoms. J Phys Chem C. 2009;113:9141–9152.
- Smoluchowski R. Anisotropy of the electronic work function of metals. Phys Rev. 1941;60:661–674.
- Pauling L. Atomic radii and interatomic distances in metals. J Am Chem Soc. 1947;69:542–553.
- Finnis MW, Heine V. Theory of lattice contraction at aluminium surfaces. J Phys F. 1974;4:L37–L41.
- Feibelman PJ. Relaxation of hcp(0001) surfaces: a chemical view. Phys Rev B. 1996;53:13740–13746.
- Kara A, Rahman TS. Vibrational properties of metallic nanocrystals. Phys Rev Lett. 1998;81:1453–1456.
- Sun CQ, Tay BK, Zeng XT, et al. Bond-order bond-length bond-strength (bond-OLS) correlation mechanism for the shape-and-size dependence of a nanosolid. J Phys. 2002;14:7781–7795.
- Sun CQ. Surface and nanosolid core-level shift: impact of atomic coordination-number imperfection. Phys Rev B. 2004;69:45105.
- Qi W, Huang B, Wang M. Bond-length and -energy variation of small gold nanoparticles. J Comput Theor Nanosci. 2009;6:635–639.
- Zhang X, Kuo J-L, Gu M, et al. Local structure relaxation, quantum trap depression, and valence charge polarization induced by the shorter-and-stronger bonds between under-coordinated atoms in gold nanostructures. Nanoscale. 2010;2:412–417.
- Sun CQ. Dominance of broken bonds and nonbonding electrons at the nanoscale. Nanoscale. 2010;2:1930–1961.
- Ahmadi S, Zhang X, Gong Y, et al. Skin-resolved local bond contraction, core electron entrapment, and valence charge polarization of Ag and Cu nanoclusters. Phys Chem Chem Phys. 2014;16:8940–8948.
- Huang WJ, Sun R, Tao J, et al. Coordination-dependent surface atomic contraction in nanocrystals revealed by coherent diffraction. Nat Mater. 2008;7:308–313.
- Wales DJ. Energy Landscapes. Cambridge, England: Cambridge University Press; 2003.
- Ferrando R, Jellinek J, Johnston RL. Nanoalloys: from theory to applications of alloy clusters and nanoparticles. Chem Rev. 2008;108:845–910.
- Barrett CS. Structure of materials. New York: McGraw-Hill; 1952.
- Denton AR, Ashcroft NW. Vegard’s law. Phys Rev A. 1991;43:3161–3164.
- Peng Z, Yang H. Ag–Pt alloy nanoparticles with the compositions in the miscibility gap. J Solid State Chem. 2008;181:1546–1551.
- Suzuki S, Suzuki T, Tomita Y, et al. Compositional control of AuPt nanoparticles synthesized in ionic liquids by the sputter deposition technique. CrystEngComm. 2012;14:4922–4926.
- Leppert L, Kümmel S. The electronic structure of gold-platinum nanoparticles: collecting clues for why they are special. J Phys Chem C. 2011;115:6694–6702.
- Liu C, Klemmer TJ, Shukla N, et al. Oxidation of FePt nanoparticles. J Magn Magn Mater. 2003;266:96–101.
- Strasser P, Koh S, Anniyev T, et al. Lattice-strain control of the activity in dealloyed core–shell fuel cell catalysts. Nat Chem. 2010;2:454–460.
- Montes de Oca MG, Kumarakuru H, Cherns D, et al. Hydrogen adsorption at strained Pd nanoshells. J Phys Chem C. 2011;115:10489–10496.
- Kumarakuru H, Cherns D, Montes de Oca MG, et al. TEM studies of stress relaxation in catalytic Au-Pd core-shell nanoparticles. J Phys. 2012 July;371:12025.
- Gan L, Yu R, Luo J, et al. Lattice strain distributions in individual dealloyed Pt–Fe catalyst nanoparticles. J Phys Chem Lett. 2012;3:934–938.
- Gan L, Heggen M, Rudi S, et al. Core–shell compositional fine structures of dealloyed PtxNi1–x nanoparticles and their impact on oxygen reduction catalysis. Nano Lett. 2012;12:5423–5430.
- Bu L, Zhang N, Guo S, et al. Biaxially strained PtPb/Pt core/shell nanoplate boosts oxygen reduction catalysis. Science. 2016;354:1410–1414.
- Wang L, Gao W, Liu Z, et al. Core–shell nanostructured cobalt–platinum electrocatalysts with enhanced durability. ACS Catal. 2018;8:35–42.
- Ellaby T, Varambhia A, Luo X, et al. Strain effects in core–shell PtCo nanoparticles: a comparison of experimental observations and computational modelling. Phys Chem Chem Phys. 2020;22:24784–24795.
- Andreazza P, Pierron-Bohnes V, Tournus F, et al. Structure and order in cobalt/platinum-type nanoalloys: from thin films to supported clusters. Surf Sci Rep. 2015;70:188–258.
- Andreazza P, Lemoine A, Coati A, et al. From metastability to equilibrium during the sequential growth of Co–Ag supported clusters: a real-time investigation. Nanoscale. 2021;13:6096–6104.
- Garcia-Gutierrez D, Gutierrez-Wing C, Miki-Yoshida M, et al. HAADF study of Au-Pt core-shell bimetallic nanoparticles. Appl Phys A. 2004;79:481–487.
- Liu C-P, Twesten RD, Gibson JM. High-angle annular dark-field imaging of self-assembled Ge islands on Si(001). Ultramicroscopy. 2001;87:79–88.
- Perovic DD, Rossouw CJ, Howie A. Imaging elastic strains in high-angle annular dark field scanning transmission electron microscopy. Ultramicroscopy. 1993;52:353–359.
- Galindo PL, Kret S, Sanchez AM, et al. The peak pairs algorithm for strain mapping from HRTEM images. Ultramicroscopy. 2007;107:1186–1193.
- Urban KW, Jia C-L, Houben L, et al. Negative spherical aberration ultrahigh-resolution imaging in corrected transmission electron microscopy. Philos Trans R Soc A Math Phys Eng Sci. 2009;367:3735–3753.
- Hÿtch MJ, Snoeck E, Kilaas R. Quantitative measurement of displacement and strain fields from HREM micrographs. Ultramicroscopy. 1998;74:131–146.
- Falvo MR, Clary GJ, Taylor RM, et al. Bending and buckling of carbon nanotubes under large strain. Nature. 1997;389:582–584.
- Li C, Wang C, Zhang F, et al. External strain effect on the electronic and mechanical properties of the superconductor Nb2InC. J Phys Chem Solids. 2015;78:28–34.
- Li Z, Kinloch IA, Young RJ, et al. Deformation of wrinkled graphene. Acs Nano. 2015;9:3917–3925.
- Baran JD, Molinari M, Kulwongwit N, et al. Tuning thermoelectric properties of misfit layered cobaltites by chemically induced strain. J Phys Chem C. 2015;119:21818–21827.
- Xia MG, Zhang SL. Modulation of specific heat in graphene by uniaxial strain. Eur Phys J B. 2011;84:385–390.
- Kulkarni AJ, Zhou M, Sarasamak K, et al. Novel phase transformation in ZnO nanowires under tensile loading. Phys Rev Lett. 2006;97:105502.
- Haeni JH, Irvin P, Chang W, et al. Room-temperature ferroelectricity in strained SrTiO3. Nature. 2004;430:758–761.
- Antonakos A, Liarokapis E, Aydogdu GH, et al. Strain induced phase separation on La0.5Ca0.5MnO3 thin films. J Magn Magn Mater. 2011;323:620–630.
- Marín L, Rodríguez LA, Magén C, et al. Observation of the strain induced magnetic phase segregation in manganite thin films. Nano Lett. 2015;15:492–497.
- Rudkevich E, Liu F, Savage DE, et al. Hydrogen induced Si surface segregation on Ge-covered Si(001). Phys Rev Lett. 1998;81:3467.
- Doennig D, Pentcheva R. Control of orbital reconstruction in (LaAlO3)M/(SrTiO3)N(001) quantum wells by strain and confinement. Sci Rep. 2015;5:1–6.
- Stamenkovic VR, Mun BS, Arenz M, et al. Trends in electrocatalysis on extended and nanoscale Pt-bimetallic alloy surfaces. Nat Mater. 2007;6:241–247.
- Vasileff A, Xu C, Jiao Y, et al. Surface and interface engineering in copper-based bimetallic materials for selective CO2 electroreduction. Chem. 2018;4:1809–1831.
- Greeley J, Stephens IEL, Bondarenko AS, et al. Alloys of platinum and early transition metals as oxygen reduction electrocatalysts. Nat Chem. 2009;1:552–556.
- Ling T, Yan D-Y, Wang H, et al. Activating cobalt (ii) oxide nanorods for efficient electrocatalysis by strain engineering. Nat Commun. 2017;8:1–7.
- Wang H, Xu S, Tsai C, et al. Direct and continuous strain control of catalysts with tunable battery electrode materials. Science. 2016;354:1031–1036.
- Voiry D, Yamaguchi H, Li J, et al. Enhanced catalytic activity in strained chemically exfoliated WS2 nanosheets for hydrogen evolution. Nat Mater. 2013;12:850–855.
- Kim J-S, Kim H-K, Kim S-H, et al. Catalytically active Au layers grown on Pd nanoparticles for direct synthesis of H2O2: lattice strain and charge-transfer perspective analyses. ACS Nano. 2019;13:4761–4770.
- Brankovic SR, Wang JX, Adžić RR. Metal monolayer deposition by replacement of metal adlayers on electrode surfaces. Surf Sci. 2001;474:L173–L179.
- Bok J, Lee SY, Lee B-H, et al. Designing atomically dispersed Au on tensile-strained Pd for efficient CO2 electroreduction to formate. J Am Chem Soc. 2021;143:5386–5395.
- Ashcroft NW, Mermin ND. Solid state physics. Philadelphia, United States: Saunders College Publishing; 1976.
- Heisenberg W. Zur theorie des ferromagnetismus. Zeitschrift für Physik. 1928 Sep;49:619–636.
- Dirac PAM, Fowler RH. Quantum mechanics of many-electron systems. Proceedings of the Royal Society of London. Series A, Containing Papers of a Mathematical and Physical Character, London, England, 123:714–733, 1929.
- Bochicchio D, Ferrando R. Structure and thermal stability of AgCu chiral nanoparticles. Eur Phys J D. 2012;66:115.
- Bochicchio D, Negro F, Ferrando R. Competition between structural motifs in gold–platinum nanoalloys. Comput Theory Chem. 2013;1021:177.
- Bochicchio D, Ferrando R. Morphological instability of core-shell metallic nanoparticles. Phys Rev B. 2013;87:165435.
- Ferrando R. Symmetry breaking and morphological instabilities in core-shell metallic nanoparticles. J Phys Condens Matter. 2015;27:13003.
- Pirart J, Front A, Rapetti D, et al. Reversed size-dependent stabilization of ordered nanophases. Nat Commun. 2019;10:1–7.
- Settem M, Srivastav AK, Kanjarla AK. Understanding the strain-dependent structure of Cu nanocrystals in Ag–Cu nanoalloys. Phys Chem Chem Phys. 2021;23:26165–26177.
- Front A, Mottet C. Stress effect on segregation and ordering in Pt–Ag nanoalloys. J Phys. 2021;33:154006.
- Settem M, Kumar P, Adlakha I, et al. Surface reconstruction in core@shell nanoalloys: interplay between size and strain. Acta Materialia. 2022;234:118038.
- Vitek V, Egami T. Atomic level stresses in solids and liquids. Phys Status Solidi B. 1987;144:145–156.
- Baletto F, Mottet C, Ferrando R. Growth of three-shell onionlike bimetallic nanoparticles. Phys Rev Lett. 2003;90:135504.
- Harris IA, Kidwell RS, Northby JA. Structure of charged argon clusters formed in a free jet expansion. Phys Rev Lett. 1984;53:2390.
- Rossi G, Schiappelli G, Ferrando R. Formation pathways and energetic stability of icosahedral AgshellCocore nanoclusters. J Comput Theor Nanosci. 2009;6:841.
- Settem M, Kanjarla AK. Role of core-shell energetics on anti-Mackay, chiral stacking in AgCu nanoalloys and thermally induced transition to chiral stacking. Sci Rep. 2020;10:3296.
- Baletto F, Mottet C, Ferrando R. Growth simulations of silver shells on copper and palladium nanoclusters. Phys Rev B. 2002;66:155420.
- Delfour L, Creuze J, Legrand B. Exotic behavior of the outer shell of bimetallic nanoalloys. Phys Rev Lett. 2009;103:205701.
- Nash A, Nash P. The Ni-Pd (nickel-palladium) system. Bulletin Alloy Phase Diagrams. 1984;5:446–450.
- Zhu B, Guesmi H, Creuze J, et al. Crossover among structural motifs in Pd–Au nanoalloys. Phys Chem Chem Phys. 2015;17:28129–28136.