
ABSTRACT
There is a growing awareness among city leaders and policy-makers of the impact of the urban environment on health outcomes and inequalities. Increasingly, practitioners in built environment city departments, such as housing, planning, transport and regeneration, seek new tools and guidance to understand how their respective policies and decisions can support the creation of healthier cities. This paper presents the development of a global index to help city leaders and practitioners understand their role in delivering health outcomes through urban environment policies and programmes. The Building Research Establishment’s international Healthy Cities Index (BRE HCI) contains 10 environment categories and 58 indicators, supported by a causal pathways framework. This was achieved through an iterative process including: stakeholder engagement, evaluating research evidence, selecting indicators and identifying data sources. We tested the index and causal pathways approach on two case study cities: Dubai and London. We found that they contributed to: raising awareness of the links between the environment and health; identifying shared responsibilities and the need to work across departmental silos; and uncovering the competing demands faced by some departments (and private sector stakeholders) as they seek to deliver health promoting environments alongside other objectives.
Introduction
A growing number of built environment policy-makers and professionals have recognised the important influence of the urban environment on health, and have sought to integrate health as an objective into their work (Allender et al. Citation2009, Sallis, Bull, et al. Citation2016). For instance, the far-reaching consequences of how we plan and design urban environments led New York planners to conclude that urban planning policies and programmes could ‘shape 80% of any community’s health’ through their influence on socioeconomic and environmental factors (Regional Plan Association Citation2016, p. 11). Urban planners, architects and other built environment professionals face a number of challenges when seeking to address health objectives through urban policy and development, as recently described in this journal by Grant et al. (Citation2017). Deprived communities within cities are disproportionately exposed to unhealthy environments, such as poor housing and pollution, and they suffer a greater burden of disease as a result (World Health Organization and United Nations Human Settlements Programme Citation2010). The World Health Organization (WHO) and others have suggested that indicators are one tool which can inform urban policy-makers about the environment’s impact on health, including health inequalities (Corburn and Cohen Citation2012, Prasad et al. Citation2014, Citation2016, Lowe et al. Citation2015, Rothenberg et al. Citation2015). When indicators are compiled and shared internationally, usually through an index, they provide a picture of how cities perform against one another which can raise awareness of urban issues, shape debates and dialogue, and help cities identify strategic priorities (Clark et al. Citation2015, Klopp and Petretta Citation2017). Yet, up to now, urban health indicator tools have rarely compared cities internationally. This paper describes the process and results of developing the Building Research Establishment’s international Healthy Cities Index (BRE HCI) and presents initial feedback on the Index and an associated ‘BRE Causal Pathways Framework’ from city officials in Dubai and London.
In this paper we use the term ‘urban health indicators’ (UHIs) to refer to ‘summary measures about the physical urban environment’s contribution to human health and wellbeing’ (Pineo et al. Citation2017a, p. 2), although UHIs may also measure wider factors in other circumstances. Indicators with this purpose may also relate to environmental health, liveability, quality of life or urban health equity, with the last of these specifically focused on intra-city differentials (for relevant definitions of ‘liveability’ and ‘quality of life’ see Badland et al. (Citation2014) and Fahy and Ó Cinnéide (Citation2006) respectively). One of the earliest examples of urban health indicators was the WHO Healthy Cities Indicators, created to inform city profiles for participating WHO Healthy Cities in the early 1990s (Doyle et al. Citation1996). There are now many other examples including international tools such as the WHO Urban Health Equity Assessment and Response Tool (Urban HEART), state-wide projects like Community Indicators Victoria and city-scale systems like the San Francisco Indicators Project (Bhatia Citation2014, Lowe et al. Citation2015, Prasad et al. Citation2015). A recent systematic review found 145 urban health indicator tools (compilations of UHIs), comprising 8006 indicators, from 28 different countries (Pineo et al. Citation2017b, Citation2017c). This review found that UHI tools are increasingly measuring data at the neighbourhood and lower scale and presenting this information via digital interactive maps (ibid). These advances may be particularly helpful to urban policy- and decision-makers who seek to understand variations within cities.
There are many potential uses of UHIs by city officials, politicians and community members. Indicators can be used to gather evidence about the nature of a place and its impact on health which can then inform the development, monitoring and adjustment of urban policies (Corburn and Cohen Citation2012). Other uses of UHI tools include: comparing performance against peers (locally, nationally and internationally); supporting funding bids and/or decisions; and involving the community in agreeing policy priorities (Pineo et al. Citation2017b). Although there are many proposed benefits of indicators, there is a lack of research on the actual use of indicators in urban planning policy and decision-making; with most of the indicator literature focused on their development and validation (Wong Citation2006, Pineo et al. Citation2017b). There are also a number of potential challenges or pitfalls associated with the use of indicators, particularly those which compare cities through an index. For example, inter-city indices may: hide intra-city inequalities; compare cities with very different contexts and challenges (health, environmental, political, etc.) leading to inappropriate rankings and responses by local policy-makers; lead high performers to become complacent; or discourage low performers.
There are ongoing tensions in the academic literature about the mechanisms by which indicators and indices inform urban policy which relate to their development, interpretation and application. The process of involving stakeholders in negotiating and agreeing local indicators is seen as one way to encourage community dialogue and participation in urban governance, with some arguing that this is the ultimate benefit of indicators (Innes and Booher Citation2000, Rydin et al. Citation2003). To that end, Rydin and colleagues (Citation2003) argued that indicators are ‘socially constructed’ and not ‘technical policy tools’ (p.583). Others provide the counterargument, that it is exactly their rational and positivist status which has ‘elevated indicators to a darling position in the policy world’ (Wong Citation2006, p. 3). This tension between the characterisation of indicators as ‘social constructs’ or ‘rational tools’ gets to the heart of the varying views on the nature of scientific evidence and its role in policy-making more generally (see Ingold and Monaghan Citation2016). Perhaps one of the greatest challenges for indicators is that they occupy a vague position between scientific robustness and political motivation. Klopp and Petretta (Citation2017) highlight the wide range of ‘competing’ indicator frameworks which ‘serve different purposes and agendas’, lack consensus on methodology, and ‘are embedded in politics’ (p.95). Even the most rigorous approaches to indicator development are likely to suffer from challenges of data availability and quality, creating potential problems for interpretation and application (ibid).
Notwithstanding these ongoing debates on how indicator systems influence policy, previous research provides multiple examples where urban health indicators have informed built environment policy and decision-making, with varying degrees of stakeholder involvement (Farhang et al. Citation2008, Corburn and Cohen Citation2012, Lowe et al. Citation2015). Furthermore, new urban health indicators continue to be published with the suggestion that they can promote better city planning for health and wellbeing objectives (for example Giles-Corti et al. Citation2016). Any proposals for new indicators should weigh up the benefits of developing new metrics against the cost of duplicating existing research efforts, whilst considering the importance of local applicability and governance (Pineo et al. Citation2017b). In this paper we reflect on the development, interpretation and purpose of the BRE Healthy Cities Index within the context of this wider debate on the role of indicator frameworks in urban governance.
This paper explains the motivation, methods, and results of the development of the BRE Healthy Cities Index.Footnote1 We also provide context from the wider indicator literature that informed our approach and discuss feedback that we received during the development and initial piloting of the Index. Recognising the challenges associated with producing an index and describing the limitations and compromises inherent in such efforts, in the Discussion section we reflect on the impact of these methodological factors on interpretation and local application. We contend that there is a role for an international index to raise awareness and inform city leaders and practitioners about the urban environment impact on health and wellbeing.
Background to the BRE Healthy Cities Index
In recognition of the growth of global urban populations and associated challenges for city leaders and policy-makers, the BRE TrustFootnote2 funded a thematic Future Cities research programme from 2012-2015. One of the projects funded within the programme was the background research and development of the BRE Healthy Cities Index (HCI).
The principle motivation for the BRE HCI stemmed from the understanding that improving urban health cannot be achieved by the health sector alone and built environment professionals have an important role to play (Kickbusch and Gleicher Citation2013, Grant et al. Citation2017). There is clear evidence that where we live can both positively and negatively impact our health and wellbeing. The potential impacts are magnified in cities, where high density living can create walkable and sociable communities but it can also result in overcrowding and exposure to pollution (World Health Organization Citation2016). The cost of unhealthy urban environments is paid by health and social services, insurance companies, and society as a whole (Pineo Citation2016). Conversely, healthy cities stand to make significant savings across services, boost local productivity and contribute to wider sustainable development objectives (ibid).
The purpose of the BRE HCI is to provoke thought and conversation across different city departments which eventually leads to action through policy and decision-making. The Index aims to achieve this by providing a simple picture of how global cities are performing relative to one another in terms of the urban environment’s impact on health and wellbeing. Through the Index and associated materials, we also aim to communicate the interconnectedness of urban environment features and related health impacts (such as the interplay between transport, buildings, and air quality on respiratory diseases) which interact and change over time, constituting a complex system. A key aim is to translate this complexity into simple actionable messages, as far as possible, for city leaders and built environment professionals. We do not intend this international Index to be a decision-support tool for local policy-making on its own; rather we hope it will raise awareness amongst key city officials and politicians to initiate more detailed local data gathering and policy development.
Methods
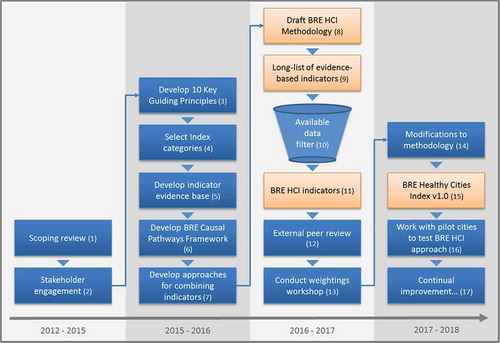
This section details the process undertaken to develop the BRE HCI, describing the methods to select indicators and combine them to produce comparable category scores. summarises the Index development process from early scoping in 2012 through to piloting the approach in 2017. In reality, this process was more iterative and non-linear than this diagram relays. The boxes in are numbered to create a visual road map which is cross-referenced throughout the Methods section to help orientate the reader.
Figure 1. Summary of the development of the BRE Healthy Cities Index 2012 – 2018 (note numbers in brackets are referred to in the main text to orient the reader).
Scoping review
At the outset of the research project we undertook a broad scoping review of publications from international health organisations, research institutions and industry bodies (, box 1) which covered:
global health trends and links to the urban environment
the nature and impact of health inequalities within cities
the context of global indices (examples and purpose)
good practice for developing and using urban health indicators and indices.
Publications were sourced online and through bibliographic databases (e.g. Web of Science and PubMed) and key topics were summarised in an internal BRE report. This broad review informed the selection of 10 key guiding principles for the index development (, box 3) and the scope of the issues to measure within the index (, box 4). This early scoping work was also informed by discussions with stakeholders in built environment and public health organisations (, box 2). A second more detailed literature review (, box 5) of specific urban environment exposures and associated health outcomes was undertaken to underpin the selection of specific indicators (see below).
Developing indicators which are conceptually sound, measurable by existing data and meaningful for policy-makers is a complex task. We found that good practice for indicator development requires that indicators are (Briggs Citation1999, Innes and Booher Citation2000, Balsas Citation2004, Greenwood Citation2008, Pencheon Citation2008, Lowe et al. Citation2015):
succinct
evidence-based
developed in collaboration with end users
related to economic measures of policy impacts
credible and compelling
produced independently from the organisations which they measure
directly related to policy goals
presented simply and visually
measurable and quantifiable
accompanied with detail about their validity.
There are many challenges in achieving these goals, particularly for an international index. Lawrence (Citation2008) stated that indicators need ‘to meet two conflicting objectives: a comprehensive account of all the relevant issues, and the communication of information in a concise way to different users’ (p.320). While Briggs (Citation1999) noted that many of the criteria of good indicators are ‘to some extent mutually incompatible: that is one reason why indicators are difficult to design’ (p.3). These challenges became particularly clear when searching for available data to measure the indicators supported by our evidence base (discussed below).
To manage these challenges we developed 10 key guiding principles (). These were selected from topics which were repeatedly raised as important across the indicator development and urban health literature and stakeholder engagement [, box 2]. For example, BRE staff presented at the 2014 WHO International Healthy Cities Conference and gathered feedback from delegates. Delegates emphasised the need for evidence-based indicators and making use of existing data collection systems (both topics are widely discussed in the urban health indicator literature). The 10 key guiding principles recognise that there are inherent difficulties, and even contradictions, in developing validated indicators which meet the needs of multiple users. We followed these principles as closely as possible when developing the BRE HCI and we view them as a framework which we can return to as the Index may need to change over time. For example we may need to modify indicators if data sources are no longer produced. BRE also commissioned external peer review (by the co-authors of this paper) of the draft Index, methodology and evidence base to assess and improve the overall approach (, box 12).
Table 1. Ten key principles to guide development of the BRE Healthy Cities Index.
Table 2. Ten categories in the BRE Healthy Cities Index.
Table 3. Excerpt from the Housing & Buildings category evidence base for the BRE Healthy Cities Index (note H2 and HP3 are identifiers for indicators within this category, described more explicitly in ).
Table 4. Categories (10) and indicators (58) in the BRE Healthy Cities Index (note an asterisk denotes indicators for which we have identified data and the obelisk symbol denotes indicators also reported in BS ISO 37120).
Table 5. BRE Healthy Cities Index Housing & Buildings category indicator data (standardised and un-standardised) and final category scores (note -/+ in brackets indicates whether the indicator is positively or negatively correlated with health and wellbeing outcomes).
Identifying categories
The process for identifying appropriate urban health indicators began with selecting broad topic areas which became our Index categories (also called domains in other indices). The selection of categories (, box 4) was informed by our scoping review and existing reviews of urban health indicators which outline commonly measured topics (Badland et al. Citation2014, Rothenberg et al. Citation2015, Prasad et al. Citation2016). Based on our guiding principles, the criteria for selecting categories were:
be highly influenced by built environment professionals (thus we excluded quality of education or health care services, for example)
have a demonstrated link between the urban environment and health/wellbeing
be relevant globally
include topics which are measureable with open dataFootnote3.
As a result of the last point, the final categories () were developed iteratively to ensure that we could find data for indicators within each category.
Selecting indicators
Once we had determined a broad set of categories for the BRE HCI we performed a literature review covering each of these topic areas, which was summarised in an evidence base document (, box 5) and informed the selection of indicators. This literature review identified specific urban environment exposures and associated health impacts (both positive and negative) in each category. According to our principles, indicators needed to have a strong conceptual basis (for the link between exposures and outcomes) and be supported by peer-reviewed scientific evidence about their association with health and wellbeing outcomes. There are a number of weaknesses with the existing scientific evidence base about the urban environment and health which we needed to manage when selecting indicators.
Although the evidence base linking the urban environment to health outcomes has improved significantly in the last two decades, many uncertainties remain (Galea and Vlahov Citation2005) which are seen as holding back policy-makers (Sarkar et al. Citation2015, Grant et al. Citation2017) and create challenges for selecting indicators. There have been technological advances with Geographic Information Systems (GIS) and individual activity measures which have increased understanding of the health impacts of specific built environment characteristics (e.g. Sallis, Cerin, et al. Citation2016). However, research methods and study designs and sizes have not been sufficient to support strong causal associations between many attributes in the built environment and their health outcomes (Sarkar et al. Citation2015). Furthermore, the range of factors which interact within the urban environment to impact health are recognised as forming a complex system (Northridge et al. Citation2003, Galea and Vlahov Citation2005, Rydin et al. Citation2012) and epidemiological and public health research methods are not well-equipped to unpick this complexity (Rutter et al. Citation2017). Notwithstanding weaknesses in the evidence base and challenges due to the complexity of urban health, researchers such as Grant et al. (Citation2017) and Rydin et al. (Citation2012) have argued that built environment policy-makers and practitioners should not hold back on planning and designing healthy cities using the best-available evidence. We have taken a similar approach to the selection of indicators.
In developing our evidence base to select indicators, we used evidence from international systematic reviews wherever possible rather than individual studies. This helped to manage the weaknesses in the evidence described above. We searched a bibliographic database, PubMed, and Google for existing systematic reviews or expert evidence reviews. Search terms related to each category, health and reviews (e.g. food environment AND health AND review). We also searched citations for additional sources of reviews. The evidence base was summarised for each category within the Index ( provides an example) following a similar approach to that taken by Briggs (Citation1999) called ‘Indicator Profiles’ (p. 6). We selected our ‘long list’ of 58 indicators (, box 9) on the basis of the following factors, which we reported in our evidence base:
evidence for association between exposure and outcome
examples of similar indicators from other indicator frameworks
potential for available data (as a pragmatic approach despite its inherent shortcomings)
global applicability of the evidence and the indicator (recognising that some indicators are more relevant in particular countries than others).
We developed specific indicators using quantifiable information from the evidence. Systematic reviews often reported results in a way that was amenable to creating an indicator, for example by reporting set distances from high traffic roads at which health effects were detected in local residents. Examples of other indicator frameworks that we reviewed include the proposed monitoring indicators for the Sustainable Development Goals (Leadership Council of the Sustainable Development Solutions Network Citation2014) and related indicators, such as those proposed by Dora et al. (Citation2015).
– Excerpt from the Housing & Buildings category evidence base for the BRE Healthy Cities Index (note H2 and HP3 are identifiers for indicators within this category, described more explicitly in )
Sourcing data to measure indicators
The evidence gathering process resulted in the identification of a ‘long list’ of potential indicators for which it was not yet clear whether data may be available internationally (, box 9). The next step was to search through international open data sources (e.g. the World Bank and UN Habitat’s Global Urban Observatory). Such data sources are limited with regard to the built environment and many only contain national metrics. Other limitations include: lack of clarity on what is measured (e.g. the definition of green space), data being outdated, and inconsistency on the spatial scale that is measured (e.g. city regions or other administrative designations), known as the Modifiable Areal Unit Problem (Badland et al. Citation2014). The World Council on City Data (WCCD) is a potential source for a significant number of indicators for several reasons: data were collected following the process and indicators outlined in BS ISO 37120:2014 (The British Standards Institution Citation2014); the indicators follow good practice principles and many match our evidence base; and data are provided for a number of international cities. The selection of indicators became an iterative process because data were not available for all of the desired indicators. Therefore, the final list of indicators in the BRE Healthy Cities Index is a compromise between the evidence base and data availability. We retained the ‘long list’ of 58 evidence-informed indicators for future use or to apply with individual cities where more data may be available. For the global index, we determined that a shorter set of indicators would be sufficient to raise awareness of urban health challenges (see ).
Data availability also largely drove the selection of cities to include in the BRE HCI. We wanted a range of global cities with different social and environmental characteristics to enable sharing and learning across those cities. However, given the very different health challenges and stages of development across these diverse cities it was neither feasible nor appropriate to place them in a ranking (see Discussion).
Development of the BRE Causal Pathways Framework
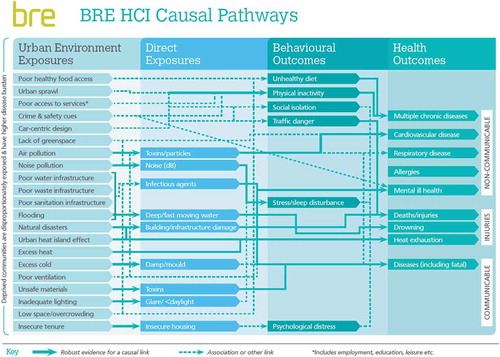
We developed a visual communication tool, the BRE Causal Pathways Framework (), to explain the relation between urban environment exposures and health outcomes using the evidence base that we compiled to select indicators. The format for this Framework was informed by similar models representing environmental exposures and health outcomes (Northridge et al. Citation2003, Rydin et al. Citation2012, Badland et al. Citation2014). Causal relations within the Framework are shown by a solid line, while associations are depicted using dotted lines. We determined that a link was causal on the basis of the findings in the original source of evidence (usually a systematic review). Similarly to the underpinning evidence base for the BRE HCI, this Framework will require periodic updates to take account of emerging evidence. The diagram shows that all of the exposures have a link to health inequalities with deprived communities being disproportionately exposed to poor urban environments. The exposures are broadly organised with strategic spatial planning issues at the top, moving down to progressively more detailed building design issues at the bottom. We grouped the health outcomes according to the classifications used by the Global Burden of Diseases study, separating non-communicable diseases from communicable diseases and injuries (Wang et al. Citation2016). shows the full version of the Framework. Given the complexity of this diagram, we have also produced simplified versions to use in discussions with city stakeholders which show exposures for a single category and relate these to the indicators in the BRE HCI. These simplified diagrams make it easier to follow the links between exposures and outcomes.
Figure 2. BRE Causal Pathways Framework (copyright BRE, reproduced with permission).
Combining indicators and categories
Transforming indicator measures so that they can be combined and compared (called standardising, normalising or scaling) can create a number of statistical issues which may distort initial values, for example resulting in some differences appearing greater than they actually are in the original data (Rothenberg et al. Citation2015). To create comparable category scores, we have combined indicators within each category using an approach to standardisation analogous to that used by the United Nations Development Program’s Human Development Index and many other indices (ibid). Further information on the combination of indicator values is detailed in Appendix 1.
There is a significant and growing literature on the strengths and weaknesses of index (also known as ‘composite indicator’) weighting methods (Saisana and Tarantola Citation2002, Saltelli et al. Citation2004, Lawrence Citation2008, Grant and Barton Citation2013, Rothenberg et al. Citation2015). It is considered good practice to make the computing and weighting methodology transparent (Saisana and Tarantola Citation2002, Nardo et al. Citation2008). The identification of urban health as a complex system and the need to apply a systems approach to the Index informed our early thinking for the BRE HCI weighting system. We present here two weighting options we considered and the rationale for these; however, the final decision was to reject weightings and the generation of a composite indicator.
The two weighting system options that were developed and tested through peer review included a Complexity Rating and a Robustness Rating. The former sought to represent the complexity of the urban health system through a rating composed of seven characteristics of complex systems (see Appendix 1). Lawrence (Citation2008) emphasised the importance of complexity and a systems approach in relation to environmental health indicators:
‘The health status of populations in specific urban areas is not only the result of many material and non-physical constituents but also the interrelations between them. …systemic approaches ought to be applied to understand both the constituents and the interrelations among all of them. It is recommended that indicators be used not only to identify these constituent parts but also to promote an understanding of the interrelations between them’ (p.302).
Each category within the BRE HCI would have a Complexity Rating which reflected how complex the category (or sub-system) is in relation to its impact on health and wellbeing. The rationale is that a more complex sub-system will have more states and more ways to exert influence on the whole system and/or neighbouring sub-systems and should therefore be weighted more heavily. Categories (or sub-systems) which are rated highly in the Complexity Rating would exhibit many characteristics of complex systems (see Appendix 1 for detailed methods). The workshop participants (see Acknowledgements) raised several limitations of this approach:
there is insufficient evidence from epidemiological studies to rate each complexity characteristic; however uncertainty does not mean lack of importance
there is a range of evidence within a sub-system and a general lack of evidence about impacts in low and middle income countries (LMICs)
the boundaries for each sub-system are difficult to define and therefore rate
the scoring process resulted in roughly equal complexity weights for each category, potentially highlighting limitations with the method
local contextual factors are more appropriate and would not be represented in this global approach.
Fundamentally, the participants did not all agree that a more complex sub-system (or category) should necessarily be weighted more heavily in the Index. Some participants thought that the built environment could create health impacts in ways that were not complex, but were still important. The Complexity Rating method was deemed inappropriate as a weighting system for the BRE HCI.
The proposed Robustness Rating approach involved weighting categories on the basis of the strength of evidence linking each category to health impacts. However, this was limited by weaknesses in the epidemiological evidence base for many environmental health impacts (as previously discussed). A lack of robust evidence for a causal link or association does not mean that a particular topic is not important; researchers may not have developed sufficient methods to investigate suspected links. For example, there is contradictory evidence about the association between food access and obesity in high income countries such as the USA and Canada (Gamba et al. Citation2014, Cobb et al. Citation2015); yet researchers point more to the methodological limitations of the studies than the expectation that food access may be unimportant (Penney et al. Citation2015). There is also a much more widely developed evidence base in high income countries (HICs), compared to LMICs, potentially obscuring the importance of particular environmental health issues in those countries (Prasad et al. Citation2016). As a result of the weaknesses of the overall evidence base, it was not feasible to create a Robustness Rating which accurately reflected the importance of each category.
Given the limitations of the various approaches evaluated, developed and tested, a final decision was taken to equally weight the categories should BRE ever require a composite indicator. The advantages of being able to compare cities with a single score were considered during the process of research and development, but this approach was subsequently rejected for the BRE HCI for the abovementioned reasons. Also, the academic peer reviewers strongly opposed such comparison and ranking partly because of the inappropriateness of comparing cities with vastly different health and environment contexts. Yet, comparisons are still meaningful and helpful, for example within one category across cities within a similar context.
Results
The first iteration of the BRE HCI consists of a set of 58 evidence-informed indicators in 10 categories (), with open data covering 28 of these indicators across 20 global cities (not all cities report data for all 28 indicators). The indicators are not combined into a single composite indicator (or ranked), although category scores are calculated. We have presented results for one category in the Index (). Individual indicators may be subject to change in the first or subsequent versions published by BRE. Through the ‘long-list’ of evidence-informed indicators and our 10 guiding principles we have built in a degree of flexibility allowing the Index to grow or change over time. The BRE Causal Pathways Framework and the BRE HCI website (under development) are also key parts of the Index because they help explain the link between environmental exposures and health outcomes, with the website providing case study examples of built environment policies and design measures to improve urban health.
– Categories (10) and indicators (58) in the BRE Healthy Cities Index (note an asterisk denotes indicators for which we have identified data and the obelisk symbol denotes indicators also reported in BS ISO 37120).
Category score: Housing & Buildings
shows the results for the Housing & Buildings category including standardised and un-standardised data and the final category scores where they could be calculated (for each city, missing data from any of the indicators mean that a category score is not calculated)Footnote4. Cities are listed alphabetically.
- BRE Healthy Cities Index Housing & Buildings category indicator data (standardised and un-standardised) and final category scores (note -/+ in brackets indicates whether the indicator is positively or negatively correlated with health and wellbeing outcomes)
Application of the BRE HCI approach: case studies
The BRE HCI and associated materials were applied in two cities to gather feedback. Dubai partly funded the development of the Index and acted as our first city pilot. Southwark Council in London is developing monitoring indicators for planning policies related to health and wellbeing and considered the BRE HCI indicators as part of this process.
Stakeholder engagement in Dubai
Feedback from Dubai was gathered in a stakeholder workshop on January 23, 2017 at Dubai Land Department’s offices. This workshop aimed to introduce the BRE HCI and explore the context for collaboration across city departments to achieve a healthy and sustainable city. There were nine participants from across city government departments (including urban planning, utilities, transport) and private sector partners (such as local developers). We presented general urban health challenges with an emphasis on local priorities and links to the built environment (for example air quality and heart disease), the BRE Causal Pathways Framework, and BRE HCI indicators. Between presentations we facilitated conversations about urban health in Dubai and the role of the stakeholders present.
As facilitators, we noted a range of knowledge amongst participants regarding the urban environment impact on health, with some stakeholders having considerable experience in designing and planning healthy urban environments in Dubai. The BRE Causal Pathways Framework sparked discussion amongst participants, particularly regarding which organisations (public and/or private) were responsible for particular urban environment exposures. Many of the represented departments had some ‘ownership’ over multiple exposures, however their respective influence was limited in certain areas. Participants raised a number of other challenges for urban health policy and delivery, summarised as:
striking a balance between development that is viewed as ‘healthy’ and what the market is willing to fund
coordination across different sectors, for example traffic and public realm
the long time lag between urban planning and actual changes in the built environment (with further delay before health impacts are measurable)
acknowledgement of overlapping responsibilities across departments and respective budgets (and performance management metrics) not always aligning to deliver health priorities
the need for education and awareness raising across professionals and with the community.
A number of strengths were discussed that may help shift these challenges, such as:
a move toward more sustainable construction practices and use of renewable energy
local developers look to international examples of best practice in design
social entrepreneurship is being encouraged, such as local food markets and food growing
the United Arab Emirates (UAE) publishes a number of open data sets to help with gauging priority areas and progress.
Most of the points above would result in positive health impacts. For example sustainable construction and efforts to reduce climate change through renewable energy would have multiple health benefits (Allen et al. Citation2015, Watts et al. Citation2015). The publication of open data in the UAE creates opportunities to inform local data analysis within cities, supporting the identification of local priorities related to the urban environment and health.
We sought feedback on the BRE HCI by asking the participants: ‘what is the greatest contribution of the BRE Healthy Cities Index?’ Participants responded that the Index was a tool to:
engage city leaders, such as mayors, whose leadership is required to make progress on such cross-cutting objectives
promote innovation about the built environment and health
raise awareness about the specific links between urban environments and health
set priorities or inform strategies within cities
demonstrate the diverse departments and organisations which are required to act.
Finally, participants commented on the benefits of the analytical and rational approach provided by the Index. One participant said that policy-makers want to see evidence backed up by numbers and facts, not just general principles.
The challenges raised by stakeholders in Dubai for integrating health into built environment policy and practice are reflected in the academic and practitioner literature and are representative of many cities globally. For example, quantifying the economic value of healthy buildings and neighbourhoods has been attempted by built environment organisations internationally (Lassar et al. Citation2014, World Green Building Council Citation2016) and in some contexts uncertainty over the costs and benefits are seen as a key barrier to introducing healthier design (Pineo Citation2016). The reported challenge of overlapping responsibilities across departments and the lack of alignment between departmental responsibilities and health priorities hints at the importance of applying a systems approach to urban health challenges. As identified by Rydin et al. (Citation2012), stakeholders need to understand the complex interconnections between different parts of the urban health system and which levers for change would be most effective over time. The strengths identified by local stakeholders show that there is already action being taken to overcome some of these challenges, driven by the private sector, civil society and government. Initial feedback identified that the BRE HCI could help local stakeholders: understand the importance of their respective sectors for health; communicate the need for cross-sector collaboration and buy-in from political representatives; and set priorities in relation to policy and development decisions.
Monitoring project in London
The application of the BRE HCI approach in Southwark Council (a London borough with a population of approximately 310,000 people) focused on the use of specific indicators and the BRE Causal Pathways Framework. In 2016, Southwark and Lambeth Councils received funding from Guy’s and St. Thomas’s Charity to investigate local issues and opportunities related to health and place in two of their largest regeneration areas. Part of this ongoing project involves the identification of planning policies to promote health and wellbeing and associated monitoring indicators focusing on the Old Kent Road Opportunity Area and associated Area Action Plan (AAP) (Pineo et al. Citation2018). One of the authors (HP) undertook a part-time secondment to Southwark Council to support this stage in the project. A workshop was held at the Council on June 20, 2017 to discuss potential monitoring indicators, including those from the BRE HCI.
The indicators workshop was attended by 14 officers from across planning, public health, regeneration, commissioning, and transport. Background information was presented about urban health indicators, including the BRE Causal Pathways Framework. Participants were given a handout containing policies from the Old Kent Road AAP and associated potential indicators.
Participants spontaneously used the BRE Causal Pathways Framework as a way to frame the discussion. For example, one participant from the planning department asked if we could have a conversation working from the ‘Health Outcomes’ side of the Framework working back to the ‘Urban Environment Exposures’. This prompted the public health representatives to discuss key health challenges in the area, primarily non-communicable chronic diseases. The discussion then centred around improving opportunities for physical activity and healthy eating through transport, urban design and planning policies. Following the wider group discussion, participants worked in small groups to discuss the potential indicators and policy measures in more detail.
Reflecting on this workshop, we observe that the group discussions resulted in participants balancing diverse opinions and professional orientations to negotiate what should be measured through indicators and how this related to local circumstances. Some groups identified tensions between health objectives and other goals. Representatives from the planning department had the opportunity to explain the competing demands which are inherent in planning policy and decision-making in the UK context. For example, affordable housing is recognised as a key planning priority which is agreed through negotiations with developers on a case-by-case basis. The provision of affordable housing is balanced with other health-relevant design measures or amenities such as green space and children’s play areas. Planners must work with developers to negotiate the best outcome for local people within the economic limits of each development. Weighing up the importance of these individual decisions and their impact on health was a key part of the discussion that related directly to the choice of indicators and how the success of policies should be measured over time.
Discussion
We have reported the methods, results and initial feedback of the BRE Healthy Cities Index and related materials. This project is the culmination of several years of research at BRE, but the Index is new, and is likely to evolve over time. To the best of our knowledge it is the first global index to focus on the impact of urban physical environments on health and wellbeing (there are international indices measuring related concepts of quality of life and liveability). There are many constraints when developing an index with this purpose, given the range of health and environment challenges between low, middle and high income countries. We have attempted to balance these tensions whilst still producing a rigorous index which can inform city leaders and policy-makers.
Lessons for Index Development
During the process of creating and piloting the BRE HCI we have observed a number of lessons for index development, including: the challenge of addressing complexity in urban health; the value of engaging stakeholders; the contested nature of composite indicators and weighting methods; the appropriateness of international comparisons of urban health; and difficulty accessing appropriate open data across global cities.
Addressing complexity
We observed complexity as a defining feature of urban health discussed throughout the literature. The characteristics of complex urban health systems (and their sub-systems) affect how they are studied by epidemiologists, how they can be measured by indicators and how policy-makers can develop appropriate interventions. McCarney and McGahan (Citation2015) also note the complexity of urban governance for health systems, brought on by the evolution of cities and our changing interpretation of urban health. While many observe the importance of representing and/or addressing complexity through indicators (e.g. Lawrence Citation2008) and policy interventions (e.g. Rydin et al. Citation2012), there are few examples of how this can be done in practice. Our attempt to weight the categories in the Index through a Complexity Rating was driven by a desire to use the Index as a way to communicate and represent interconnections and relations within the urban health system. As a result of the limitations discussed in the Methods section (and Appendix 1) we concluded that this approach was not appropriate for the BRE HCI. Nevertheless, the mechanisms by which an index should address complexity through weighting or the combination of indicators, and whether this would make any difference in its interpretation by city leaders and officials, remain open to debate. Our case studies demonstrate that introduction of the BRE Causal Pathways Framework and the BRE HCI indicators helped to stimulate discussions about complexity characteristics such as interconnections, unintended consequences, delays and policy resistance. Complexity is a core issue for decision-makers to consider and further investigation may help to elucidate how indicator frameworks can communicate complexity characteristics and implications for policy-making.
Stakeholder engagement
There was great value in working with stakeholders from public health and built environment across academe, city government and the private sector in the development and piloting of the Index. The peer review process and weightings workshop allowed BRE to engage the academic community in the detail of the methodology and resulted in modifications which strengthened the Index. The involvement of officials from city government and the private sector in London and Dubai also helped us understand which elements of the Index would be most helpful at achieving the aim of raising awareness of urban environment and health challenges. There was a clear consensus from the stakeholders involved in this process that the BRE Causal Pathways Framework is a valuable tool to frame discussions.
The problem of the composite indicator
There are fundamental conceptual disagreements amongst experts about how weighting systems should be created (Nardo et al. Citation2008, Rothenberg et al. Citation2015). Some argue that a composite indicator has ‘no meaning’ (Innes and Booher Citation2000, p. 176), whilst experts at the Composite Indicator Research Group recognise that the ‘temptation of stakeholders and practitioners to summarize complex and sometime elusive processes (e.g. sustainability or a single-market policy) into a single figure to bench-mark country performance for policy consumption seems likewise irresistible’ (Saisana et al. Citation2005, p. 308). Even the application of equal weighting across categories does not sidestep the debate because this implies that all categories have an equal impact on health and wellbeing which is unlikely. Partly as a result of these challenges (and those described above) we have avoided the creation of a composite indicator.
International comparisons
The initial desire to rank cities, as occurs in most international indices, was a topic of great discussion during the Index development. Media regularly report on the findings of international rankings such as the Arcadis Sustainable Cities Index and the Mercer Quality of Living Survey (Lopez et al. Citation2017, Morrison and Collier Citation2017). Such articles focus on positioning in the rankings, prompting attention from politicians who see their cities as competing for investment and talent on a global scale. However, the academic peer reviewers were strongly opposed to ranking cities. The rationale for not ranking cities was based on: the inappropriateness of comparing cities with different health and environment contexts; limitations with the available data (e.g. from different years or spatial scales); weaknesses in the evidence base for some exposures, particularly in relation to low and middle income countries; lack of an appropriate method to combine and weight categories or indicators; and the potential for unsuitable policy responses as a result of such comparisons. We concluded that despite the potential advantages of producing a composite indicator and ranking this measure (see Saisana and Tarantola Citation2002), the BRE HCI would be more valuable as a tool to compare category scores or individual indicators.
Access to data
It was very difficult to identify open data sources which presented data about the urban environment at a city scale, and contained multiple international cities. Despite extensive hype about ‘big data’ and the ‘smart city’ movement (Townsend Citation2013), these have not yet resulted in a critical mass of high quality urban open data. The available data contain many limitations (discussed in the Methods section). There are also restrictions about how data can be used and these are not always clearly stated. Relying on third-party data means that some indicators in the BRE Healthy Cities Index may need to change over time. We have developed the evidence base and guiding principles to support the creation of new indicators as needed (which will need to be updated periodically to reflect new evidence).
Limitations and further research
There are a number of limitations to an international index which measures urban health. First, although the BRE Causal Pathway Framework and some indicators represent and measure health inequalities, aggregated data at the city-scale masks the underlying variation within cities regarding environmental exposures and health outcomes. Understanding neighbourhood variation and the scale of deprivation is important to inform funding decisions and regeneration policies to reduce inequalities. At present there is a lack of data at this scale to enable such work; however the number of indicator tools that measure data at the neighbourhood level has increased (Pineo et al. Citation2017b), suggesting that this may be possible in the future. Similarly, a global index comparing indicators in HICs and LMICs comes at the expense of an index focused on highly similar countries which would more clearly demonstrate differentiation between the represented cities. Furthermore, cities in a global index are measured against some indicators which are largely irrelevant (such as access to utilities in HICs) or are lacking appropriate indicators (such as exposure to open sewage in LMICs) for their context. Third, the data limitations constrain what can be measured and could reduce the overall impact and utility of the BRE HCI. A main area for further data development relates to food access. This is an important policy area, albeit one which shifts considerably (between obesity and malnutrition) depending on a country’s economic status and also within a country’s population. Fourth, the wide ranging intended audiences for this Index, coupled with the data restrictions, have resulted in very high-level indicators which do not always tie to specific built environment interventions. This raises the need for further indicator application and interpretation in specific cities. Finally, we question whether an international index promotes a hierarchy of policy solutions based on the indicators measured. As noted previously, the indicators are a reflection of the evidence base and data availability and do not necessarily represent the most important environmental exposures. We were unable to obtain comparable international data for many of the Food Access and Resilience indicators, however those may be very important topics for urban health. Additionally, the most important exposures would vary appreciably based on local circumstances.
There are many opportunities for further research to improve this Index, and urban health indicators more widely, particularly through the continued development of neighbourhood-scale data. The emergence of city data repositories creates a local source of information that built environment professionals can use to establish baseline information and monitor policy impact over time. General feedback during the workshops with city officials demonstrated that further guidance is needed to inform urban designers, planners and others about the very specific design measures or policies which can promote health (taking into account the competing pressures they have to consider). Much of the current guidance advocates general principles (such as active design) but falls short of providing practitioners with the required details to change their current practice (see Allender et al. Citation2009). Perhaps of greatest importance is the need for additional research about the complex interconnections between the urban environment and health; although this need not be a precursor to applying best practice principles now.
Value of the BRE HCI
The overall value of this Index is through raising awareness of the multiple urban environment exposures which lead to health impacts, resulting in local activities to address this challenge. There are several other benefits which we identified in discussions with stakeholders and city officials. City leaders may be prompted to consider the roles and responsibilities of different departments and question whether enough is being done to tackle complex urban health challenges. The BRE Causal Pathways Framework creates a simple starting point for discussion about local challenges, policy interventions, and monitoring mechanisms. It also prompts frank discussions about the competing demands faced by some stakeholders as they seek to deliver health promoting environments alongside other objectives and it stimulates discussion about some of the complexities of addressing urban health challenges. The rigorous approach we took in researching and reporting the links between health and the environment was appreciated by city stakeholders and was perceived as a strength of the Index. Furthermore the Index and case study examples presented in Dubai were seen as promoting innovative practices in healthy urban planning across global cities.
The BRE HCI indicators also provide a useful starting point toward a standard set of urban health indicators which could be used globally. As summarised by Pineo et al. (Citation2017b), there is ongoing debate about the appropriateness of standardising urban health indicators and the value of new UHI tools. We believe that the BRE HCI provides a set of evidence-informed metrics which could ultimately reduce the amount of heterogeneity in UHI tools, particularly regarding indicators related to the built environment. By using existing metrics and datasets for many of the BRE HCI indicators we have built on previous research efforts and increased opportunities for global comparisons and benchmarking. A standardised set of indicators will be even more valuable if it includes a broader range of topics than the BRE HCI (beyond the built environment) such as quality of local health care systems and allow for some degree of local adaptability and selection (as argued by Pineo et al. (Citation2017b)).
Conclusion
The piloting of the BRE Healthy Cities Index and BRE Causal Pathways Framework has demonstrated that indicators and associated materials can inform city government practitioners and frame discussions about urban health challenges and potential policy solutions. We have shown through our case studies that practitioners are moving forward with the best available knowledge; using indicators in the process of urban governance and seeking to develop policies and programmes to improve urban health. With the emergence of new open city data at multiple scales and innovative epidemiological research methods our knowledge of how to assess and improve the urban environment impact on health is likely to improve significantly in the coming years, enabling further development to the BRE HCI.
Acknowledgements
The authors would like to acknowledge Dubai Land Department and Southwark Council for their kind permission to publish findings from working with those cities. We would also like to thank the academic experts who were commissioned to attend the weighting workshop in London on January 27, 2017. Their candid feedback was instrumental in determining the final approach for the BRE Healthy Cities Index. Participants included: Dr Jo Barnes, Senior Research Fellow: Air Quality Management Resource Centre, University of the West of England (UWE); Prof Steven Cummins, Professor of Population Health, London School of Hygiene and Tropical Medicine (LSHTM); Dr Danielle Sinnett, Senior Research Fellow, FET - Architecture and the Built Environment, UWE; Dr Marcella Ucci, Senior Lecturer, Bartlett School Environment, Energy & Resources, University College London; Dr Melvyn Hillsdon, Associate Professor Sport and Health Sciences, University of Exeter; Dr Charlotte Clark, Reader in Environmental & Mental Health Epidemiology, Queen Mary University of London; Prof Sir Andy Haines, Professor of Public Health & Primary Care, LSHTM; Dr Russell Jones, Public Health Programme Manager, Glasgow Centre for Population Health; Dr Harry Rutter, Senior Clinical Research Fellow, LSHTM; and Dr Wolf-Peter Schmidt, Assistant Professor in Epidemiology, LSHTM.
Disclosure statement
HP is a full-time employee of the Building Research Establishment Ltd. and her job responsibilities included the development of the BRE HCI and BRE Causal Pathways Framework, including all of the research described in this article. The Index, Framework and background research remain the intellectual property of BRE. HP is a part-time PhD student at University College London and one of her supervisors, NZ, was commissioned by BRE as a peer-reviewer for this project. HP is married to one of the co-authors, RA, and he was not paid for his contributions to this research. Excluding RA, all of the other co-authors were paid by BRE to review the BRE HCI. In addition, NZ and EC were paid to help organise and facilitate the Complexity Rating workshop. HR was also commissioned to participate in the weighting workshop as an expert presenting the transport category.
Additional information
Funding
Notes on contributors
Helen Pineo
Helen Pineo is Associate Director – Cities at BRE and a chartered urban planner with experience in policy development and urban design for health and sustainability objectives. She is a part-time PhD researcher at University College London (UCL) investigating the use of urban health indicator tools by urban planning policy and decision-makers. Helen is an editorial advisor for the Cities & Health journal.
Nici Zimmermann
Nici Zimmermann is Lecturer in System Dynamics at the Institute for Environmental Design and Engineering at UCL. Seeking counterintuitive and innovative solutions for important problems, she researches topics related to the built environment, interdisciplinarity, system dynamics modelling, processes of change and decision-making.
Ellie Cosgrave
Ellie Cosgrave is Lecturer in Urban Innovation and Policy and Deputy Director of the City Leadership Lab in the Department of Science, Technology Engineering (STEaPP) at UCL. Her work explores the ways in which engineering and technology can better contribute to wellbeing in cities.
Robert W. Aldridge
Robert W Aldridge is an NIHR Academic Clinical Lecturer at the Institute of Health Informatics at UCL. He qualified in medicine from UCL in 2007, gained an MSc in Epidemiology at The London School of Hygiene and Tropical Medicine in 2010 and completed his PhD at UCL in 2015. Prior to studying medicine, he studied Mechanical Engineering at The University of Nottingham.
Michele Acuto
Michele Acuto is Professor of Diplomacy & Urban Theory, and Director of the UCL City Leadership Lab, in the Department of Science, Technology and Engineering (STEaPP) at UCL, where he also serves as co-chair of UCL’s Grand Challenge of Sustainable Cities. Michele is also a Senior Fellow of the Chicago Council on Global Affairs, advises WHO on city diplomacy, and is currently co-chairing the UCL-Nature Sustainability Expert Panel on the role of science in the future of cities.
Harry Rutter
Harry Rutter is senior clinical research fellow at the London School of Hygiene and Tropical Medicine, senior strategic adviser to Public Health England, and an adjunct professor of public health at University College Cork and the Western Norway University of Applied Sciences. He has a particular interest in complex adaptive systems approaches to public health evidence and policy, with a particular focus on obesity; evaluation of public health interventions; and the relations between transport, sustainability, built environment and health.
Notes
1. The authors include an employee of the BRE (HP) who led the research activities and a number of independent academic researchers who provided advice and peer review which shaped the project (NZ, EC, RA, MA, HR). Throughout the paper we will refer to the authors as ‘we’ with further information on specific contributions and interests in the Disclosure Statement.
2. The BRE Trust is a charitable organisation which uses profits gifted to it from the BRE Group to support research and education programmes in the built environment. The Trust provides financial support for a Chair and postgraduate students at six BRE University Centres of Excellence. It also commissions and supports research through the BRE group of companies and the wider construction industry. More information is available at www.bre.co.uk/bretrust.
3. According to the Open Data Institute ‘open data is data that anyone can access, use and share. For data to be considered “open”, it must be published in an accessible format, with a licence that permits anyone to access, use and share it’ (Open Data Institute Citation2015).
4. Data for all of the Index categories will be published by the BRE on the BRE HCI website (not yet published at time of submission) alongside case studies and further information (see https://bregroup.com/).
5. According to the Open Data Institute ‘open data is data that anyone can access, use and share. For data to be considered “open”, it must be published in an accessible format, with a licence that permits anyone to access, use and share it’ (Open Data Institute Citation2015).
Related Research Data
References
- Acevedo-Garcia, D., et al., 2004. Does Housing Mobility Policy Improve Health? Housing Policy Debate, 15 (1), 49–98.
- Allen, J.G., et al., 2015. Green Buildings and Health. Current Environmental Health Reports, 2 (3), 250–258.
- Allender, S., et al., 2009. ‘Tell Us Something We Don’t Already Know or Do!’: The Response of Planning and Transport Professionals to Public Health Guidance on the Built Environment and Physical Activity. Journal of Public Health Policy, 30 (1), 102–116.
- Badland, H., et al., 2014. Urban liveability: Emerging lessons from Australia for exploring the potential for indicators to measure the social determinants of health. Social Science & Medicine, 111, 64–73.
- Balsas, C.J.L., 2004. Measuring the livability of an urban centre: an exploratory study of key performance indicators. Planning Practice & Research, 19 (1), 101–110.
- Bhatia, R., 2014. Case Study: San Francisco’s Use Of Neighborhood Indicators To Encourage Healthy Urban Development. Health Affairs, 33 (11), 1914–22.
- Braubach, M., Jacobs, D., and Ormandy, D., 2011. Environmental burden of disease associated with inadequate housing: a method guide to the quantification of health effects of selected housing risks in the WHO European region. Copenhagen: World Health Organization, Regional Office for Europe.
- Briggs, D.J., 1999. Environmental health indicators: framework and methodologies. Geneva: World Health Organisation.
- Clark, G., Moonen, T., and Couturier, J., The Business of Cities 2015.
- Cobb, L.K., et al., 2015. The relationship of the local food environment with obesity: A systematic review of methods, study quality, and results. Obesity, 23 (7), 1331–1344.
- Corburn, J. and Cohen, A.K., 2012. Why We Need Urban Health Equity Indicators: Integrating Science, Policy, and Community. PLOS Med, 9 (8), e1001285.
- Dora, C., et al., 2015. Indicators linking health and sustainability in the post-2015 development agenda. The Lancet, 385 (9965), 380–391.
- Doyle, Y., et al., 1996. Healthy Cities Indicators: Analysis of Data from Cities Across Europe. Copenhagen: World Health Organization Regional Office for Europe.
- Fahy, F. and Ó Cinnéide, M., 2006. Community-based quality of life indicators for urban areas as derived in Galway City, Ireland. In: The Sustainable City IV: Urban Regeneration and Sustainability. Presented at the 4th International Conference on Urban Regeneration and Sustainability, Tallin; Estonia: WIT Transactions on Ecology and the Environment, 691–702.
- Farhang, L., et al., 2008. Creating Tools for Healthy Development: Case Study of San Franciscoʼs Eastern Neighborhoods Community Health Impact Assessment. Journal of Public Health Management and Practice, 14 (3), 255–265.
- Galea, S. and Vlahov, D., 2005. Urban Health: Evidence, Challenges, and Directions. Annual Review of Public Health, 26 (1), 341–365.
- Gamba, R.J., et al., 2014. Measuring the Food Environment and its Effects on Obesity in the United States: A Systematic Review of Methods and Results. Journal of Community Health, 40 (3), 464–475.
- Gibson, M., et al., 2011. Housing and health inequalities: A synthesis of systematic reviews of interventions aimed at different pathways linking housing and health. Health & Place, 17 (1), 175–184.
- Giles-Corti, B., et al., 2016. City planning and population health: a global challenge. The Lancet, 388 (10062), 2912–2924.
- Grant, M. and Barton, H., 2013. No weighting for healthy sustainable local planning: evaluation of a participatory appraisal tool for rationality and inclusivity. Journal of Environmental Planning and Management, 56 (9), 1267–1289.
- Grant, M., et al., 2017. Cities and health: an evolving global conversation. Cities & Health, 1 (1), 1–9.
- Greenwood, T., 2008. Bridging the divide between community indicators and government performance measurement. National Civic Review, 97 (1), 55–59.
- Ingold, J. and Monaghan, M., 2016. Evidence translation: an exploration of policy makers’ use of evidence. Policy & Politics, 44 (2), 171–190.
- Innes, J.E. and Booher, D.E., 2000. Indicators for Sustainable Communities: A Strategy Building on Complexity Theory and Distributed Intelligence. Planning Theory & Practice, 1 (2), 173–186.
- Kickbusch, I. and Gleicher, D., 2013. Governance for health in the 21st century. Copenhagen: World Health Organization, Regional Office for Europe.
- Klopp, J.M. and Petretta, D.L., 2017. The urban sustainable development goal: Indicators, complexity and the politics of measuring cities. Cities, 63, 92–97.
- Lassar, T.J., et al., 2014. Building for Wellness: The Business Case. Washington DC: Urban Land Institute.
- Lawrence, R.J., 2008. Urban Environmental Health Indicators: Appraisal and Policy Directives. Reviews on Environmental Health, 23 (4), 299–325.
- Leadership Council of the Sustainable Development Solutions Network, 2014. Indicators and a monitoring framework for Sustainable Development Goals: Launching a data revolution for the SDGs (revised working draft). Paris; New York; New Delhi.
- Lopez, A.L., Santamarina, D., and Nowakowski, K., 2017. The World’s Top Cities for People and the Planet. National Geographic Online, 28 Mar.
- Lowe, M., et al., 2015. Planning Healthy, Liveable and Sustainable Cities: How Can Indicators Inform Policy? Urban Policy and Research, 33 (2), 131–144.
- Marmot Review Team, 2011. The health impacts of cold homes and fuel poverty. London: Friends of the Earth & the Marmot Review Team.
- McCarney, P.L. and McGahan, A.M., 2015. The Case for Comprehensive, Integrated, and Standardized Measures of Health in Cities. In: R. Ahn, T.F. Burke, and A.M. McGahan, eds. Innovating for Healthy Urbanization. New York: Springer US, 307–320.
- Morrison, S. and Collier, H., 2017. London slips down quality of life list due to toxic air and traffic. Evening Standard, 14 Mar.
- Nardo, M., et al., 2008. Handbook on Constructing Composite Indicators: Methodology and User Guide. Paris: OECD publishing.
- Nicol, S., Roys, M., and Garrett, H., 2015. The Cost of Poor Housing to the NHS. Watford: Building Research Establishment.
- Northridge, D.M.E., Sclar, D.E.D., and Biswas, M.P., 2003. Sorting out the connections between the built environment and health: A conceptual framework for navigating pathways and planning healthy cities. Journal of Urban Health, 80 (4), 556–568.
- Open Data Institute, 2015. Open data means business: UK innovation across sectors and regions. London: Open Data Institute.
- Organisation for Economic Co-operation and Development, 2016. OECD Better Life Index [online]. Available from: http://www.oecdbetterlifeindex.org/#/11111111111 [Accessed 22 Jul 2016].
- Pencheon, D., 2008. The Good Indicators Guide: Understanding how to use and choose indicators. Coventry: NHS Institute for Innovation and Improvement.
- Penney, T.L., et al., 2015. Local food environment interventions to improve healthy food choice in adults: a systematic review and realist synthesis protocol. BMJ Open, 5 (4), 1–6.
- Pineo, H., 2016. The Value of Healthy Places – for Developers, Occupants and Society. Town & Country Planning, 85 (11), 477–480.
- Pineo, H., et al., 2017a. Characteristics and use of urban health indicator tools by municipal built environment policy and decision-makers: a systematic review protocol. Systematic Reviews, 6, 2.
- Pineo, H., et al., 2017b. Urban health indicator tools of the physical environment: a systematic review. Journal of Urban Health, 1–34. doi: 10.1007/s11524-018-0228-8.
- Pineo, H., et al., 2017c. Census, characteristics, and taxonomy of urban health indicator tools: a systematic review. The Lancet, 390, S70.
- Pineo, H., et al., 2018. Translating community perceptions of health and place into local planning policy and monitoring frameworks. Salus. Available at: http://www.salus.global/journal/view/article/translating-community-perceptions-of-health-and-place-into-local-planning-policy-and-monitoring-frameworks-1
- Prasad, A., et al., 2014. Communicating for Action: Tackling Health Inequity in Urban Areas. In: C.C. Okigbo, ed. Strategic Urban Health Communication. Springer New York, 115–129.
- Prasad, A., et al., 2016. Metrics in Urban Health: Current Developments and Future Prospects. Annual Review of Public Health, 37 (1), 113–133.
- Prasad, A., et al., 2015. Prioritizing action on health inequities in cities: An evaluation of Urban Health Equity Assessment and Response Tool (Urban HEART) in 15 cities from Asia and Africa. Social Science & Medicine, 145, 237–242.
- Regional Plan Association, 2016. State of the Region’s Health: How the New York Metropolitan Region’s Urban Systems Influence Health. New York: Regional Plan Association, Robert Wood Johnson Foundation.
- Rothenberg, R., et al., 2015. Urban health indicators and indices—current status. BMC Public Health, 15 (1), 1–14.
- Rutter, H., et al., 2017. The need for a complex systems model of evidence for public health. Lancet, 390 (10112), 2602–2604.
- Rydin, Y., et al., 2012. Shaping cities for health: complexity and the planning of urban environments in the 21st century. The Lancet, 379 (9831), 2079–2108.
- Rydin, Y., Holman, N., and Wolff, E., 2003. Local Sustainability Indicators. Local Environment, 8 (6), 581–589.
- Saisana, M., Saltelli, A., and Tarantola, S., 2005. Uncertainty and sensitivity analysis techniques as tools for the quality assessment of composite indicators. Journal of the Royal Statistical Society: Series A (Statistics in Society), 168 (2), 307–323.
- Saisana, M. and Tarantola, S., 2002. State-of-the-Art Report on Current Methodologies and Practices for Composite Indicator Development. Ispra: European Commission–Joint Research Centre, No. Report EUR 20408 EN.
- Sallis, J.F., et al., 2016. Use of science to guide city planning policy and practice: how to achieve healthy and sustainable future cities. The Lancet, 388 (10062), 2936–2947.
- Sallis, J.F., et al., 2016. Physical activity in relation to urban environments in 14 cities worldwide: a cross-sectional study. The Lancet, 387 (10034), 2207–2217.
- Saltelli, A., et al., 2004. Composite Indicators – The Controversy And The Way Forward. In: Statistics, Knowledge and Policy. Presented at the OECD World Forum on Key Indicators, Palermo: OECD.
- Sarkar, C., Webster, C., and Gallacher, J., 2015. UK Biobank Urban Morphometric Platform (UKBUMP) – a nationwide resource for evidence-based healthy city planning and public health interventions. Annals of GIS, 21 (2), 135–148.
- The British Standards Institution, 2014. BS ISO 37120:2014 Sustainable development of communities - Indicators for city services and quality of life. 1st ed. London: BSI Standards Limited.
- Townsend, A.M., 2013. Smart Cities: Big Data, Civic Hackers, and the Quest for a New Utopia. New York: W. W. Norton & Company.
- Wang, H., et al., 2016. Global, regional, and national life expectancy, all-cause mortality, and cause-specific mortality for 249 causes of death, 1980–2015: a systematic analysis for the Global Burden of Disease Study 2015. The Lancet, 388 (10053), 1459–1544.
- Watts, N., et al., 2015. Health and climate change: policy responses to protect public health. The Lancet, 386 (10006), 1861–1914.
- Wong, C., 2006. Indicators for urban and regional planning: the interplay of policy and methods. Abingdon: Routledge.
- World Green Building Council, 2016. Building the Business Case: Health, Wellbeing and Productivity in Green Offices. Toronto: World Green Building Council.
- World Health Organization, 2016. Global report on urban health: equitable, healthier cities for sustainable development. Geneva: World Health Organization.
- World Health Organization and United Nations Human Settlements Programme, eds., 2010. Hidden cities: unmasking and overcoming health inequities in urban settings. Kobe, Japan: World Health Organization; UN-HABITAT.
References
- Glouberman, S., Gemar, M., Campsie, P., Miller, G., Armstrong, J., Newman, C., Siotis, A., and Groff, P., 2006. A Framework for Improving Health in Cities: A Discussion Paper. Journal of Urban Health, 83 (2), 325–338.
- Luke, D.A. and Stamatakis, K.A., 2012. Systems Science Methods in Public Health: Dynamics, Networks, and Agents. Annual Review of Public Health, 33 (1), 357–376.
- Sterman, J., 2000. Business dynamics: systems thinking and modeling for a complex world. Boston: Irwin/McGraw-Hill.
Appendix 1: Additional details regarding combining indicators and categories
Combining Indicators
Each indicator value is standardised between 0 and 100 for each city using Equation 1.
Where:
Istandardised = Indicator value for a city used in index after standardisation
Iunstandardised = Initial indicator for a city before standardisation
Imax =Maximum value of indicator across all cities in HCI
Imin=Minimum value of indicator across all cities in HCI
Equation 1 Standardisation of positively correlated indicators
All of the current indicators in the BRE HCI are exposure-based rather than effect-based. An exposure-based indicator measures the environmental exposure for which a known health impact has been established (ibid). For example, the Index measures particulates of air pollution (exposure) rather than an associated health impact such as respiratory disease (effect). Most of the BRE HCI indicators include metrics which promote health and wellbeing (positively correlated) such as percentage of land area with green space (Equation 1). Some exposures measured in the HCI are linked with poor health outcomes (negatively correlated) such as air pollution and living in slums (Equation 2).
Equation 2 Standardisation of negatively correlated indicators.
Combining categories – details on the Complexity Rating method
We developed a process for creating the Complexity Rating using a modified Delphi method approach in which experts voted in a workshop environment in two rounds. Ten experts were paid to participate in this half-day workshop (see Acknowledgements). Each participant presented information on the complexity characteristics for a BRE HCI category based on their specialisms. The experts were given an advance briefing note with presentation instructions, including information about the seven characteristics of complexity we selected (in ). We chose these characteristics on the basis of their appropriateness for the urban health system and the focus on physical and natural environment elements within the sub-systems. Each 10-minute presentation was directly followed by a round of voting by all participants (including the presenting expert). For each category, participants voted on the seven characteristics of complexity on a scale from one to seven based on the evidence presented. After all ten categories were presented and scored, facilitators computed the average scores. The round one scores were then presented and each person was invited to give a brief response, followed by a facilitated group discussion. A final round of voting allowed participants to change their scores on the basis of the consensus scores. A de-briefing session at the end was used to gather comments, as were written feedback sheets.
In the feedback forms and discussion we also acknowledged potential limitations regarding the objectivity and previous knowledge of the expert participants. We observed varying levels of knowledge about complexity theory and the characteristics of complex systems which may have affected experts’ presentations and scoring. The tight timings of this half-day workshop may have constrained the amount of information conveyed in each presentation, affecting the ratings.
Table 1 Seven characteristics of complex systems used in proposed Complexity Rating