
 ?Mathematical formulae have been encoded as MathML and are displayed in this HTML version using MathJax in order to improve their display. Uncheck the box to turn MathJax off. This feature requires Javascript. Click on a formula to zoom.
ABSTRACT
The transportation sector accounts for approximately 23% of the total energy-related carbon dioxide (CO2) emissions worldwide and 33% in the USA. At the same time, physical inactivity contributes to adverse health through non-communicable diseases. If policies can increase active transport (walking and cycling) and reduce car use, they could benefit human health and environmental health but the relative impact of different approaches has been under researched. This study estimated change in all-cause mortality and CO2 emissions in greater Nashville, Tennessee (USA) for two scenarios: (a) the propensity to walk and cycle a trip of a given distance increases directly to the same levels as seen in England, and (b) walking and cycling trips increase and travel distance decrease indirectly as a result of a more compact urban form. If the propensity to walk and cycle in Nashville were equal with England, about 339 deaths and about 36 ktCO2e (1%) of transportation-related CO2 emissions could be avoided per year. The compact urban form scenario could avoid 170 deaths and 370 ktCO2e (10%) of transportation-related CO2 emissions. In Nashville, both increasing the propensity to use active transport and more compact urban form would have notable public health gains, but a more compact form would have a much bigger effect on emissions.
Introduction
Globally CO2 emissions from the transport sector account approximately 23% of the total CO2 emissions (Sims et al. Citation2014). In the US the transportation sector accounted for 26% of the total nationwide CO2 emissions (1.9 GtCO2e versus 6.9 GtCO2e) in 2014. From all the transport-related emissions, personal passenger vehicles accounted for 61% of the sector’s greenhouse gas (GHG) emissions (US Environmental Protection Agency Citation2016). One of the strategies to decrease transport sector related GHG emissions is to increase active transport (walking and cycling) (Creutzig Citation2016, Ahmad et al. Citation2017, Ahmad and Creutzig Citation2019).
Moreover, active transport can reduce physical inactivity-related health burden (Mueller et al. Citation2015, Doorley et al. Citation2015). The World Health Organization (WHO) has estimated that globally about 3.2 million deaths each year are attributable to insufficient physical activity (WHO Citation2009). In US 32.4% of the population is inactive reporting no moderate or vigorous intensity physical activity lasting at least 10 minutes on a typical day (Carlson et al. Citation2009). Hence, US cities have high potential to reduce greenhouse gas emissions and improve public health through transport system.
Individual trips are largely driven by the economic opportunities and needs of an individual to travel for work, school, grocery shop, hobbies, etc., but the mode choices and distance travelled depend upon individual and structural issues, including urban form. The role of densification on trip mode choices or distance travelled is well documented (Limtanakool et al. Citation2006, Ahmad and de Oliveira Citation2016), but few studies have estimated the health and environmental benefits of density-induced active transport (except e.g. Stevenson et al. Citation2016).
This study compares two approaches, density-induced active transport against increased propensity to use active transport. From the spatial planning perspective, this distinction is important. The former approach requires reconfiguration of the urban form, whereas the latter approach requires transport planning centric interventions, likely to include a mixture of walking and cycling infrastructure and behavioural measures. In strategic term, reconfiguration of the existing environment is a more long-term strategy, whereas transport centric interventions can be realised more quickly.
Despite the potential co-benefits between active transport-related physical activity and CO2 emission reductions, only a few quantitative modelling studies have examined the health and climate benefits of active transport-related scenarios in the same study area (Woodcock et al. Citation2009, Creutzig et al. Citation2012, Stevenson et al. Citation2016, Tainio et al. Citation2017). These studies find that mode shift from motorised to non-motorised transport results in large health benefits, and combining policy packages (e.g. active transport and lower-emission motor vehicles) rather than single policy option, provide synergies in achieving goals. Most of the scenario-based studies have considered mode shift scenarios, but only Stevenson et al. have estimated urban form scenarios. Stevenson et al. find that a compact city scenario resulted in significant health gains, between 420 and 826 disability-adjusted life years (DALYs) per 100 000 population.
Building from these studies, we developed scenarios for an aspiring city (Nashville) comparing two approaches. Approach one is a direct increase in the propensity to walk or cycle (that is increasing the willingness to walk or cycle a trip of a given distance) potentially from an improvement in walking and cycling infrastructure. Approach two is an increase in urban density indirectly reducing travel distances and increasing the likelihood of walking and cycling. These scenarios are in tune with the current aspiration of Nashville, where ‘smart growth’ policies are placed to achieve urban densification, and a quarter of respondents in the Nashville regional attitudinal survey has identified compact-form induced walking and bicycle-friendly infrastructures as one of their top priorities (Nashville Area MPO Citation2014). Our scenarios quantify the impact on two issues simultaneously – high transport emissions and high prevalence of inactivity – and feed to relevant policies and programs in Nashville (Meehan and Whitfield Citation2017).
Methods
Overview of the study area and key input dataset
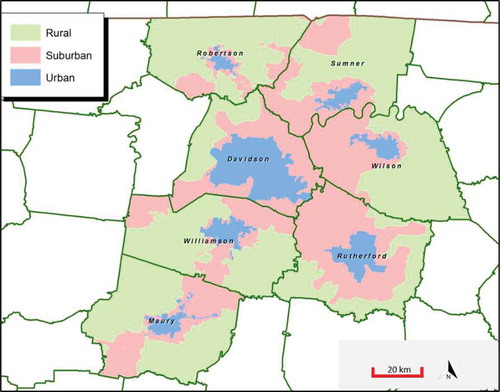
The greater Nashville region, our study area, consists of seven counties – Davidson, Maury, Robertson, Rutherford, Sumner, Wilson, and Williamson (see for the geography of urbanisation) – administered by the Nashville Area Metropolitan Planning Organization (MPO). These counties had a residential population of 1.63 million in 2015 (1.2 million are aged 15–74), expected to reach 2.17 million by 2035. Our study area, together with seven small counties with population 0.2 million, forms the Nashville–Davidson–Murfreesboro–Franklin, TN Metropolitan Statistical Area (MSA), the 36th largest MSA in the United States. The population-weighted density of the greater Nashville region was 663 person/sqmi, the highest in Davidson 1326 person/sqmi and the lowest in Williamson 232 person/sqmi (for detail refer to SI section-I, and and ). Nashville’s age-adjusted prevalence of physical inactivity and obesity is 26.8% and 32.2%, respectively, which are close to the middle of the 500 US cities (CDC Citation2016).
Figure 1. Nashville Urbancity, Tennessee, United States, 2012. Source: Westat Citation2013.
This study uses background travel data from the Middle Tennessee Transportation and Health Study (MTTHS), a large cross-sectional, population-based survey of households living in the seven counties in the greater Nashville region in 2012 (Nashville Area MPO. Citation2012). The MTTHS was designed to provide a comprehensive household travel survey of demographic, household, basic health and travel characteristics, including a one-day travel diary of all members of the household age 5 years or older. In this diary, ‘trips’ are defined as travel from place A to B (e.g. home to work) using a single, dominant mode of travel. We use the term ‘trips’ in line with the single-mode MTTHS definition throughout this paper. Modelling is based on the individual total trips, after summing all trips made by the individual, and accordingly, co-benefits of individual’s multi-modal trips (i.e. walk to transit) are computed.
Scenarios: English propensity and compact urban form
To illustrate the potential benefits of increasing active transport, we developed two scenarios for active transport in Nashville: English propensity, and compact urban form. With the English propensity scenario, we want to demonstrate co-benefits of increasing the likelihood of someone using active transport in Nashville to that of England. England was chosen, rather than the Netherlands or Switzerland (Götschi et al. Citation2015) as representing a realistic increase in the propensity to walk and cycle for Nashville. Both Nashville and England have a car-centric travel culture, and broadly similar income levels. Thus, travel choices observed in England could indicate a realistic vision for Nashville. The use of data from high walking (Switzerland) or cycling (the Netherlands or Copenhagen) would create unrealistically optimistic scenarios for Nashville. On the other hand comparison with London or New York would be unrealistic, since these much larger cities have extensive public transport systems.
The English propensity scenario represents the result of policies where walking and cycling become more popular for a trip of a given distance e.g. due to changes in infrastructure and/or travel culture. Nashville travel pattern is equated to the English propensities to walk and cycle for trips of different distances, deriving the English propensities from the UK National Travel Survey 2008–2014 (). For example, 35.5% of the trips of distance <1 mile were walked in Nashville as compared to 77.5% of the trips <1 mile in England. We therefore randomly re-assigned 42% of all current Nashville non-walking trips <1 mile to walking, such that the total walking mode share for <1 mile trips in Nashville equalised that in England. We did it for walking for all other distance bands below 11 miles (over 11 miles the mode share 185 of walking and cycling is close to zero), and repeated this for cycling. This generated a scenario in which Nashville residents continued to make the same trips from A to B, but adopted the active transport mode share of England for each distance band. Individuals’ speed of walking and cycling in Nashville is used to calculate total time spent on walking and cycling trips. The observed speed of cycling by age and gender was similar in Nashville and England (Tainio et al. Citation2017) (see Fig. S1).
Figure 2. English propensity scenarios where Nashville active transport mode share (dotted line, Nashville Area MPO. Citation2012) shift to England level (solid line, 2008–14), age 15–74.
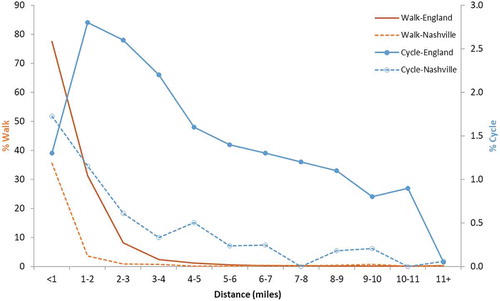
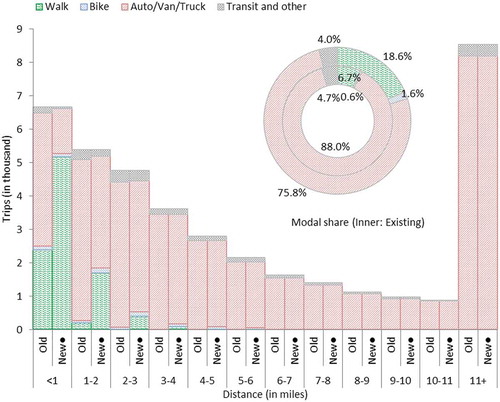
Figure 3. Trips by distance and modes, and mode share in Nashville (old is existing situation, whereas new is English propensity scenario), 2012, age 15–74.
In the compact urban form scenario, we have doubled density (an increase by 100%) from 663 persons per square mile to 1326 persons per square mile, equivalent to the densest county in the study area, Davidson (also see and for overviewing relative urban form). This scenario represents a long-term policy option that would aim to increase the density of the study area. While modelling the impact of densification on travelling at an individual level, we controlled for gender and age. Densification enables compact urban growth, combining higher densities, mixed land use, and urban design quality with more active and transit-oriented development (Rode Citation2018). Several studies have shown that built environment variables are significantly associated with active transport-induced health gains. For instance, Witten et al. (Citation2012) demonstrated a strong association between dwelling density and objectively measured physical activity.
Figure 4. Sprawled Nashville versus compact Leicester (a representative city in England) maps reproduced at the same scale, 2016 data. Nashville has population just over twice, but over 13 times built-up area compare to Leicester. Data source: Built 2016 comes from European Commission’s Global Human Settlement (Corbane et al. Citation2018). Population, built-up area, and density data for comparison between Nashville and Leicester come from Demographia (Citation2019). Notes: Values in this figure are slightly different from the main text because of different data sources and measures, for instance, here density refers to built-up density, whereas in main text refers to gross density.
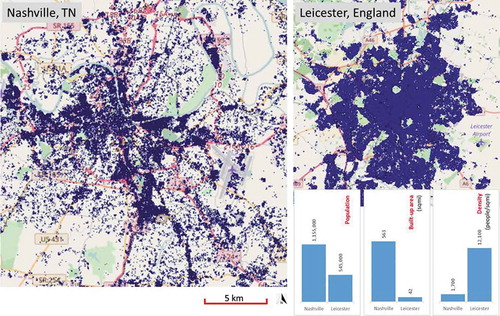
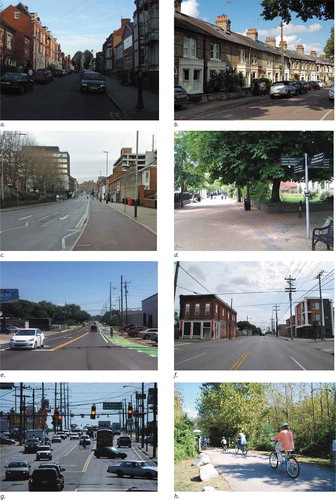
Figure 5. England’s more compact built environment (a, b, c, and d). Nashville’s more sprawled built environment (e, f, g, and h).
a: Tichborne Street, Leicester, Leicestershire, England. b: Terrace/row houses from Cambridge are common in urban England. c: Cycle path on Welford Road, Leicester, Leicestershire, England. An example of emerging best practice. d: New Walk, Leicester, Leicestershire, England. Good walking environment but cycling is prohibited. e: Buffered two-way cycle track along 51st Ave in the Nations neighborhood of west Nashville, Tennessee, USA. f: Chestnut Street and Third Avenue South in Nashville's Chestnut Hill neighborhood, Tennessee, USA. g: Traffic congestion in a typical Nashville corridor, with poor infrastructure for walking and biking, Tennessee, USA. h: Family bike in the Shelby Bottoms Greenway of East Nashville, Tennessee, USA.
Image sources: (a) https://upload.wikimedia.org/wikipedia/commons/8/8f/Tichbourne.JPG, (b) James Woodcock, (c) Mat Fascione from https://www.geograph.org.uk/photo/5633212, (d) https://www.cyclestreets.net/photos/space/108950/#&gid=1&pid=30732, (e) Nashville Civic Design Center, 2018, (f) Nashville Civic Design Center, 2013, (g) Nashville Civic Design Center, 2011, and (h) Nashville Civic Design Center, 2012
To estimate association between compact form and travel choices, we used differences in study area urban density to derive local estimates. Logistic regression was used to model the impact of county-level density on the odds of a) walking and b) cycling across seven counties in our dataset, adjusting for age and gender (table S2). We then applied these to estimate changes in the walking and cycling mode share, finding that a doubling of density increased the walking mode share from 7% to 11% and the cycling mode share from 0.6% to 0.9% (box S1). We also used linear regression to model the impact of county-level density on the average trip distance for walking, cycling and motorised transport, again adjusting for age and gender (table S1). We found that a doubling of density increased the average distance of a walking trip by 8% (from 3.3 to 3.5 miles), increased the average distance of a cycling trip by 26% (from 2.1 to 2.6 miles), and decreased the distance of a motorised travel trip by 6.3% (from 33 to 31 miles). Mainstream transport literature supports these findings; perhaps dense environment provides richer urban environment so people are more willing to walk or cycle and roads are likely to be more congested, so car travel is slower (Cervero and Kockelman Citation1997, Ahmad and de Oliveira Citation2016).
Calculation of health benefits
The health benefits of physical activity are estimated based on individual-level walking and cycling time ( and ). The intensity of physical activity is measured with the metabolic equivalent of task (MET). One MET is the ratio of work metabolic rate to a standard resting metabolic rate of 1 kcal/kg/hour, where MET values range from 0.9 (sleeping), 2–8 (walking), 4–16 (cycling) to 23 (fast running) (Ainsworth et al. Citation2011). For this study, we have used a MET value of 4.0 for walking and 6.8 for cycling, as used in Kelly et al. (Citation2014) and in the WHO Health economic assessment tool (HEAT) for walking and for cycling (Kahlmeier et al. Citation2017).
The health effects of increased active transport were estimated for adults, aged 15–74, using a comparative risk assessment framework. We chose all-cause mortality as our outcome, given that this has stronger evidence for walking and cycling in the epidemiological literature than cause-specific mortality and morbidity.
We estimate how changes in walking and cycling would affect the risk of all-cause mortality using Kelly et al.’s (Citation2014) systematic review and meta-analyses of the association between walking and cycling related physical activity and all-cause mortality. In Kelly et al. the relative risks (RRs) for walking and cycling were adjusted for all other physical activities. The RR was 0.90 and 0.87 for 11.25 METh/week change in walking and cycling, respectively (Kelly et al. Citation2014). These RRs are based on power transformation of 0.5, which represent the non-linear nature of dose–response function; i.e. there are decreasing additional benefits from higher levels of physical activity. For walking the individual level RRs were calculated with the equations (personal information from P Kelly):
where RR walk-baseline is the baseline relative risk for all-cause mortality in Nashville; RR walk(Kelly) is the relative risk for walking in Kelly et al., i.e. 0.90; and METh walk-baseline is the baseline MET hours of walking in Nashville, i.e. the duration of walking per week (seven-day) in hours multiplied by MET of 4.0 for walking. Avoidable mortality due to the change in walking was calculated as follows:
Number of deaths avoided, age 15-74=background all-cause mortality × PAF
Equivalent calculations were done for cycling, and then both added to find total deaths avoidable from the active transport.
For individuals age 15–74, we estimated the all-cause mortality rate to be 490 per 100,000 individuals (table S3). These values are based on Nashville population from the U.S. Census Bureau (Citation2015) and adjusted US-based mortality data from the Global Burden of Disease Study (Citation2016) for the greater Nashville region.
Calculation of GHG emissions
English propensity scenario: The changes in GHG emissions were estimated from the mean distance of each distance bracket (<1, 1–2 …), multiplied by the number of motorised trips switched to walking and cycling, and then multiplied by a weighted average of motorised transport emissions in Nashville (see table S4). After calculating emission reductions from mode shift to cycling and walking separately, emissions are summed by distance up to 11 miles to get total emissions (Eq.3).
where i distance bracket, and j = active transport mode (1 = walking and 2 = cycling). EF stands for the Emission Factor.
Compact urban form scenario: Based on the model, we found that a 100% increase in density decreases the distance of a motorised transport trip by 6.3% (table S1). Carbon saving is calculated by multiplying average daily per capita baseline emissions by reduced vehicle miles travel (1 − 0.063) = 0.936 in Eq.4. To scale up at Nashville level, we have multiplied by Nashville 15–74-year populations, 1.2 million. While converting values from daily to annual, we have multiplied by 239, assuming 4 weeks of annual holidays of 5 working days of 52 weeks [(52w − 4w) × 5d].
Results
At present in Nashville, the mean weekly time spent on walking and cycling are 21 minutes and 3 minutes per person, respectively (Nashville Area MPO. Citation2012). The probability of a trip being walked or cycled decreases sharply with distance, and motor vehicle travel dominates at all distances, even for trips shorter than one mile ( and ).
Health benefits
presents mobility pattern change in Nashville as a result of opting for the English propensity scenario (Nashville Area MPO. Citation2012). As a result, annual all-cause mortality, age 15–74, reduces by 339 deaths (273 deaths avoided due to increased walking and 66 deaths avoided due to increased cycling). The larger number of deaths avoided due to walking reflects the considerably larger number of walking trips added relative to cycling trips ().
Table 1. Number of trips added per day by distance in English propensity scenario in the Nashville Travel Survey, age 15–74. (N = 11,114 individuals).
presents mobility pattern change in Nashville as a result of increase in compact urban form, where density is doubled from the existing level of 663 person/sqmi to 1326 person/sqmi. This results in annual all-cause mortality reduction by 170 deaths (149 deaths due to increased walking and 21 due to increased cycling). Most of these deaths, age 15–74, are avoided due to the increase in the active transport mode share, as opposed to the increase in the average length of trips that are walked and cycled (). See SI for relevant mode shift and distance calculations.
Table 2. Change in daily active transport (mode shift and distance) and annual premature deaths postponed in compact urban form scenario (double the density from current one) in Nashville, TN, 2012.
Environmental benefits
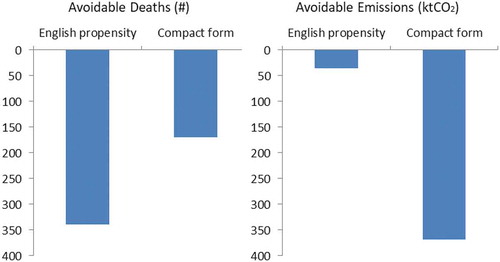
presents GHG emissions reduction for both scenarios. Annual per capita emissions from household travel are 2800 kgCO2e in the greater Nashville region in 2012 (box S3). Thus, Nashville’s annual personal transport emissions were approximately 3738 ktCO2e in 2012.
Table 3. Annual emissions reduction in Nashville, 2012.
In English propensity scenario, mode shift into active transport saves 29.2 kgCO2e per capita (21.7 from walking, 7.5 from cycling) emissions. In absolute term, emissions saving could be about 36 ktCO2e (1% of personal transport emissions).
In the compact urban form scenario, in which densification affects all trips and not just the trips <11 miles as in English propensity scenario, 227 kgCO2e per capita emissions are saved (10% of the personal transport emissions).
Figure 6. Nashville’s annual avoidable deaths and avoidable emissions in comparison to English propensity and compact urban form, 2012.
Discussion
Principal findings
Our study indicates that both increasing the willingness to walk and cycle and changing urban form could provide significant health benefits in Nashville, with larger health gains in the English propensity scenario, when active modes become more common, compared to the compact urban form scenario (339 vs 170 deaths avoided). However, increasing propensity to walk and cycle would have a much smaller impact on greenhouse gas emissions compared to the urban form scenario (36 ktCO2e, ~1% of the personal transport emissions vs 369 ktCO2e, ~10% of the personal transport emissions, ).
Strengths and limitations of the study
The strengths of this study are twofold. First, our scenario is based on the estimates of health and environmental benefits at disaggregated data using a much larger individual-level dataset than is available for most city regions. This allows us to model changes in individual trip level data, which provides more realistic results than the models based on linear and population-level data. Second, our comparison is novel and realistic. The propensity approach takes the real behaviour of a population in another highly motorised society (Lovelace et al. Citation2017, Woodcock et al. Citation2018). Similarly, compact urban form scenario modelled trip distance and mode choice against Nashville’s existing density, after controlling gender and age, in corroboration with meta-analysis. Both scenarios are locally contextualised, thus high probability of operationalisation.
As with all modelling studies our study makes many assumptions and simplifications. One limitation is that the model assumes that the health co-benefits occur in a single accounting year, whereas the changes in physical activity and MET hours are time invariant. A second simplification is that we assume equal behaviour change across the whole of the age group 15–74 opting for active transport. Our study limits its calculation of health impacts to those due to changes in physical activity, without accounting for other pathways such as pollution exposure and traffic crashes (Litman Citation2013). We believe this is justified as several studies have indicated that health gains from active transport based physical activity substantially exceed the negative effects of fatalities and injuries, and air pollution exposure (De Hartog et al. Citation2010, Woodcock et al. Citation2014, Mueller et al. Citation2015, Tainio et al. Citation2016).
While the choice of an English propensity comparator is credible other comparators could have been chosen and this could have affected the health and environmental gains, e.g. a higher cycling comparator would have resulted in greater carbon savings as cycling can replace longer trips than walking.
Comparison to previous studies
To the best of our knowledge, only Stevenson et al. (Citation2016) have estimated reduced carbon emission and health benefits of comparable compact urban form scenarios and their methods were notably different. The comparative study of health benefits of compact cities in six cities, including one city from the USA (Boston), showed significant health gains from urban compact form. presents comparative health and environmental gains between Boston and Nashville, including underlying assumptions. Our study finds health gains 776 DALYs per 100,000 populations (number of premature deaths were converted to DALYs by assuming that one death contributes 55.9 DALYs for age bracket 15-74, based on Global Burden of Disease year 2015 results for the USA). In Boston, Stevenson et al. scenario found +55.7% changes in travel-related METs per week and −11.8% in transport-related particulate emissions. Whereas, in Nashville, change in travel-related METs per week was +54% and transport-related GHG (not particulate) emissions change was −8.15%. Departing from Stevenson et al.’s assumptions, we doubled density and then directly modelled the consequent changes in distance and modal shift using local data, whereas Stevenson et al. estimated changes in transport mode choice in each city based on weighted average associations with urban design (density, distance, and diversity), as derived from a meta-analysis. Our estimates are within the uncertainty range of Stevenson et al. after local calibration.
Table 4. Comparison of Nashville’s compact urban form scenario results with Boston (Stevenson et al. Citation2016).
Related to English propensity scenario, Whitfield et al. (Citation2017) developed three hypothetical scenarios in greater Nashville that modelled stepwise increase in walking and bicycling, and one that modelled reductions in car travel using the Integrated Transport and Health Impact Model (ITHIM), utilising local, state, and federal data sources. Across the range of scenarios, they suggested that 24–123 deaths per year could be postponed in the region. These estimates are lower than our estimates, mainly on account of different underlying scenarios.
In the Impacts of Cycling Tool Woodcock et al. (Citation2018) found that increasing the propensity to cycle (noncyclists becoming as likely to cycle as existing cyclists) could reduce CO2 emissions from passenger car transport by around 9% rising to 13% if the increase was mainly from electric-assist bikes. These figures can be seen as a context-specific estimate of what a maximal cycling propensity scenario could achieve.
Furthermore, we have not explored more complicated interactions in the data or in our scenarios between urban form and propensity, e.g. taking our propensity estimates from low-density settings with higher propensity or modelling the interaction of a combined scenario.
Policy implications
Nashville’s co-benefits estimate as a result of opting active transport equivalent to England should help in city to city policy learning, as Marsden et al. (Citation2011) have argued in cities approach of policy learning, using a study of 30 policies in Northern Europe and North America, mainly in the transport field.
Our scenarios should be seen as policy goals rather than directly applicable policies. For example, the English built environment differs substantially from the USA/Tennessee context, and doubling density would take time. Thus, this study does not explore which specific measures are required to realise the sketched scenarios. Plausible measures include a combination of road pricing, bike and pedestrian infrastructure, and compact land-use planning (Bongardt et al. Citation2013). Pricing car travel appears to an important measure, as evidenced from both modelling and empirical studies (Gordon Citation1997, Creutzig Citation2014, Creutzig et al. Citation2015, Borck and Brueckner Citation2017) and can in the short term directly affect propensity and in the longer term increase support for higher density and shorter trips. It is likely that policy changes to increase propensity to walk and cycle could occur more rapidly than to substantially increase density, though in practice the interaction is not fully understood. From a population health perspective, our findings should be encouraging that important gains could be realised from increasing active transport even in a sprawled city, with nearly 60% of the additional active travel trips coming being walk trips of less than 1 mile.
From a city planning perspective, our findings suggest that densification can play a major role in addressing two contemporary urban challenges, environmental health and human health and contribute to achieving Sustainable Development Goals, notably Goal 3: Good health and well-being, and Goal 11: Sustainable cities and communities. Thus, sprawled cities with low active travel rates should consider adopting both approaches. Increasing propensity through improved infrastructure and travel planning could bring greater quick wins, while increasing densification will bring longer term synergistic environmental and health benefits.
Unanswered questions
This study has not considered effects of traffic injuries and air pollution exposure as results of the proposed scenarios. The time scales and political strategies of implementing the desired changes also warrant further attention. Further research could also model scenarios using data from more settings and testing the interaction of a combined scenario.
Conclusions
Changes in transport can significantly contribute to reducing mortality and transport-related carbon emissions. This study provided estimates of how mode shift through changing propensity and as a result of densification, could positively influence the overall health and environmental gains in a high-income city. However, these gains vary significantly from one scenario to another. We showed substantial avoidance of all-cause mortality in shifting short-motorised trips into active transport modes. This finding emphasises the importance of creating a walking and cycling-friendly built environment planning at the neighbourhood level. However, if climate mitigation is included as a relevant goal, then the longer term challenge of a more compact urban form design is also a priority.
Supplemental Material
Download MS Word (46.2 KB)Acknowledgments
Authors acknowledge feedbacks received at the Cities and Climate Conference, 2017, Potsdam (Germany). Thanks to Leslie Meehan, Rochelle Carpenter, and Geoffrey Whitfield for data and feedback and Brian McCabe for writing advise on earlier versions of this paper. Thanks to Mike Thompson Nashville Civic Design Center for Nashville’s images ().
Disclosure statement
No potential conflict of interest was reported by the authors.
Supplementary material
Supplemental data for this article can be accessed here
Additional information
Funding
Notes on contributors
Sohail Ahmad
Dr Sohail Ahmad is a Research Fellow in GCRF Centre for Sustainable, Healthy and Learning Cities and Neighbourhoods (SHLC). Ahmad investigates low-carbon urban development options and socio-spatial exclusion issues in built environments and housing in south Asian cities. These empirical studies have extensively employed (spatial) econometrics analyses using Stata and R on large datasets. Prior to joining SHLC, he was an Alexander von Humboldt Research Fellow at the Mercator Research Institute on Global Commons and Climate Change, Berlin with join affiliation to the Technische Universität Berlin
Anna Goodman
Dr Anna Goodman works in transport and health topics, with a particular focus on sustainable travel. She is particularly interested in how secondary analysis of routine datasets can be use to evaluate existing interventions and model the impacts of potential interventions. Anna is based at the London School of Hygiene and Tropical Medicine
Felix Creutzig
Professor Felix Creutzig is head of the Land Use, Infrastructures and Transport working group and Chair of Sustainability Economics at Technische Universität Berlin. He was lead author of the IPCC’s Fifth Assessment Report and lead analyst of the Global Energy Assessment. His research focuses on (a) conceptualizing, quantifying and assessing mitigation potential for GHG emissions in cities world-wide, (b) building models of sustainable urban form and transport, (c) land rents as a complement for financing sustainable infrastructures, (d) analyzing the role of capital stocks and infrastructures for climate change mitigation, and (e) land use-mediated uncertainty in integrated assessments
James Woodcock
Dr James Woodcock is a European Research Council (ERC) Consolidator Grant holder. He leads a programme of work on transport and health modelling at the University of Cambridge, and has published extensively in both leading health and transport journals. Key achievements include the ITHIM suite of tools, the Propensity to Cycle Tool, and WHO HEAT tool.
Marko Tainio
Dr Marko Tainio studies transport, environment and health. He is using modelling methods, especially Health Impact Assessment, to estimate environment and health effects of urban transport policies. Marko has recently joined in the Sustainable Urban Programme in Finnish Environment Institute (SYKE), Finland, as Principal Researcher
Related Research Data
References
- Ahmad, S. and Creutzig, F., 2019. Spatially contextualized analysis of energy use for commuting in India. Environmental research letters, 14, 045007. doi:10.1088/1748-9326/ab011f
- Ahmad, S. and de Oliveira, J.A.P., 2016. Determinants of urban mobility in India: lessons for promoting sustainable and inclusive urban transportation in developing countries. Transport Policy, 50, 106–114. doi:10.1016/j.tranpol.2016.04.014
- Ahmad, S., Pachauri, S., and Creutzig, F., 2017. Synergies and trade-offs between energy-efficient urbanization and health. Environmental Research Letters, 12, 114017. doi:10.1088/1748-9326/aa9281
- Ainsworth, B.E., et al., 2011. 2011 compendium of physical activities: a second update of codes and MET values. Medicine and science in sports and exercise, 43, 1575–1581. doi:10.1249/MSS.0b013e31821ece12
- Bongardt, D., et al., 2013. Low-carbon land transport: policy handbook. Oxon: Routledge.
- Borck, R. and Brueckner, J.K., 2017. Optimal energy taxation in cities. Journal of the association of environmental and resource economists, 5, 481–516. doi:10.1086/695614
- Carlson, S.A., et al., 2009. Differences in physical activity prevalence and trends from 3 US surveillance systems: NHIS, NHANES, and BRFSS. Journal of physical activity and health, 6, S18–S27.
- CDC. 2016. 500 cities project: Local data for better health. https://nccd.cdc.gov/500_Cities/rdPage.aspx?rdReport=DPH_500_Cities.InteractiveMap&islCategories=HLTHOUT&islMeasures=ARTHRITIS&islStates=47&rdRnd=60615.
- Cervero, R. and Kockelman, K., 1997. Travel demand and the 3Ds: density, diversity, and design. Transportation research part D: Transport and environment, 2, 199–219. doi:10.1016/S1361-9209(97)00009-6
- Corbane, C., Florczyk, A., Pesaresi, M., Politis, P., and Syrris, V., 2018. GHS built-up grid, derived from Landsat, multitemporal (1975-1990-2000-2014), R2018A. European Commission, Joint Research Centre (JRC). doi:10.2905/jrc-ghsl-10007 PID: http://data.europa.eu/89h/jrc-ghsl-10007
- Creutzig, F., 2014. How fuel prices determine public transport infrastructure, modal shares and urban form. Urban climate, 10 (Part 1), 63–76. doi:10.1016/j.uclim.2014.09.003
- Creutzig, F., et al., 2015. Global typology of urban energy use and potentials for an urbanization mitigation wedge. Proceedings of the national academy of sciences, 112, 6283–6288. doi:10.1073/pnas.1315545112
- Creutzig, F., 2016. Evolving narratives of low-carbon futures in transportation. Transport reviews, 36, 341–360. doi:10.1080/01441647.2015.1079277
- Creutzig, F., Mühlhoff, R., and Julia, R., 2012. Decarbonizing urban transport in European cities: four cases show possibly high co-benefits. Environmental research letters, 7, 044042. doi:10.1088/1748-9326/7/4/044042
- De Hartog, J., et al., 2010. Do the health benefits of cycling outweigh the risks? Environmental health perspectives, 118, 1109. doi:10.1289/ehp.0901747
- Demographia, 2019. Demographia World Urban Areas (Built Up Urban Areas or World Agglomerations), 15th Annual Edition. 1–125. http://demographia.com/db-worldua.pdf.
- Doorley, R., Pakrashi, V., and Ghosh, B., 2015. Quantifying the health impacts of active travel: assessment of methodologies. Transport reviews, 35, 559–582. doi:10.1080/01441647.2015.1037378
- Global Burden of Disease Study, 2016. Global Burden of Disease Study 2015 (GBD 2015) Risk Factor Results 1990-2015. Seattle, United States: Institute for Health Metrics and Evaluation (IHME).
- Gordon, I., 1997. Densities, urban form and travel behaviour. Town and country planning, 66, 239–241.
- Götschi, T., et al., 2015. Contrasts in active transport behaviour across four countries: how do they translate into public health benefits?. Preventive Medicine, 74, 42–48. doi:10.1016/j.ypmed.2015.02.009
- Kahlmeier, S., et al., 2017. Health economic assessment tool (HEAT) for walking and for cycling. Methods and user guide on physical activity, air pollution, injuries and carbon impact assessments (2017). In: WHO regional office for Europe. Denmark: World Health Organization, 48.
- Kelly, P., et al., 2014. Systematic review and meta-analysis of reduction in all-cause mortality from walking and cycling and shape of dose response relationship. International journal of behavioral nutrition and physical activity, 11, 132. doi:10.1186/s12966-014-0132-x
- Limtanakool, N., Dijst, M., and Schwanen, T., 2006. The influence of socioeconomic characteristics, land use and travel time considerations on mode choice for medium- and longer-distance trips. Journal of transport geography, 14, 327–341. doi:10.1016/j.jtrangeo.2005.06.004
- Litman, T., 2013. Transportation and public health. Annual review of public health, 34, 217–233. doi:10.1146/annurev-publhealth-031912-114502
- Lovelace, R., et al., 2017. The propensity to cycle tool: an open source online system for sustainable transport planning. Journal of transport and land use, 10, 505–528.
- Marsden, G., et al., 2011. How do cities approach policy innovation and policy learning? A study of 30 policies in Northern Europe and North America. Transport policy, 18, 501–512. doi:10.1016/j.tranpol.2010.10.006
- Meehan, L.A. and Whitfield, G.P., 2017. Integrating health and transportation in Nashville, Tennessee, USA: From policy to projects. Journal of transport & health, 4, 325–333. doi:10.1016/j.jth.2017.01.002
- Mueller, N., et al., 2015. Health impact assessment of active transportation: a systematic review. Preventive Medicine, 76, 103–114. doi:10.1016/j.ypmed.2015.04.010
- Nashville Area MPO., 2012, Middle Tennessee Transportation and Health Study [Data file]. ed., Westat. Nashville, TN: Nashville Area MPO.
- Nashville Area, MPO., 2014. 2014 Regional Attitudinal Survey, Final Survey Report. ETC Institute and Resource Systems Group, Inc. http://www.nashvillempo.org/docs/2040RTP/Nash2014_final%20report_1-6-15.pdf
- Rode, P., 2018. Governing compact cities: How to connect planning, design and transport. Edward Elgar Publishing.
- Sims, R., et al., 2014. Transport. In: O. Edenhofer, et al., eds. Climate change 2014: Mitigation of climate change. Contribution of working group iii to the fifth assessment report of the intergovernmental panel on climate change. Cambridge University Press.
- Stevenson, M., et al., 2016. Land use, transport, and population health: estimating the health benefits of compact cities. The Lancet, 388, 2925–2935. doi:10.1016/S0140-6736(16)30067-8
- Tainio, M., et al., 2016. Can air pollution negate the health benefits of cycling and walking? Preventive medicine, 87, 233–236. doi:10.1016/j.ypmed.2016.02.002
- Tainio, M., et al., 2017. Mortality, greenhouse gas emissions and consumer cost impacts of combined diet and physical activity scenarios: a health impact assessment study. BMJ open, 7. doi:10.1136/bmjopen-2016-014199
- US Census Bureau, 2015. Annual estimates of the resident population for selected age groups by sex for the United States, States, Counties and Puerto Rico Commonwealth and Municipios. ed. Population Division U.S. Census Bureau. https://factfinder.census.gov/faces/tableservices/jsf/pages/productview.xhtml?src=bkmk
- US Environmental Protection Agency, 2016. Inventory of U.S. Greenhouse Gas Emissions and Sinks: 1990–2014. Washington DC: US Environmental Policy Agency.
- Westat, 2013. Middle Tennessee transportation and health study. Nashville, Tennessee: Nashville Area MPO, 290.
- Whitfield, G.P., et al., 2017. The integrated transport and health impact modeling tool in Nashville, Tennessee, USA: implementation steps and lessons learned. Journal of transport & health, 5, 172–181. doi:10.1016/j.jth.2016.06.009
- WHO, 2009. Global health risks: Mortality and burden of disease attributable to selected major risks. Geneva: World Health Organization.
- Witten, K., et al., 2012. Neighborhood built environment and transport and leisure physical activity: findings using objective exposure and outcome measures in New Zealand. Environmental Health Perspectives, 120, 971. doi:10.1289/ehp.1104584
- Woodcock, J., et al., 2009. Public health benefits of strategies to reduce greenhouse-gas emissions: urban land transport. The Lancet, 374, 1930–1943. doi:10.1016/S0140-6736(09)61714-1
- Woodcock, J., et al., 2014. Health effects of the London bicycle sharing system: health impact modelling study. BMJ: British Medical Journal, 348, g425.
- Woodcock, J., et al., 2018. Development of the Impacts of Cycling Tool (ICT): a modelling study and web tool for evaluating health and environmental impacts of cycling uptake. PLoS medicine, 15, e1002622. doi:10.1371/journal.pmed.1002593