
ABSTRACT
Evidence supports the multi-functional nature of urban green space, and so economic evaluations should have a broad lens in order to capture their full impact. Given the evidence for a range of health, wellbeing, social and environmental benefits of such interventions, we modelled the potential social return on investment of a new urban greenway intervention in Belfast, Northern Ireland. Areas that the greenway was purported to impact upon included: land and property values; flood alleviation; tourism; labour employment and productivity; quality of place; climate change; and, health. The most recent and applicable evidence pre-development of the greenway for each area was summarised to obtain an ‘effect estimate’; this was then applied to available data for the greenway area and the impact estimated and monetised using various methods. To calculate the Benefit Cost Ratio all seven monetary benefits were summed, for both a worst case and best case scenario, and divided by the total investment cost. The Benefit Cost Ratio ranged from 2.88 to 5.81 (i.e. for every £1.00 invested in the greenway, there would be £2.00–6.00 returned). This is one of the first studies to conduct a social return on investment of a new urban greenway estimating the potential benefits.
Introduction
There is a compelling body of evidence demonstrating the benefits of urban green space for health, including physical (e.g. reduced weight, lower coronary heart disease), psychological (e.g. reduced stress indicators such as lower concentrations of cortisol, lower pulse rate and blood pressure, improved mental wellbeing), social health (e.g. increased social cohesion) benefits (Kuo Citation2015, Gascon et al. Citation2016, WHO, Citation2016, Citation2017a, Citation2017b, Frumkin et al. Citation2017, Twohig-Bennett and Jones Citation2018). Initiatives to enhance the quantity and quality of green spaces in towns and cities have gained momentum, as seen in the rapid growth of pocket parks, green roofs, green walls, greening of vacant lots, and disused railways developed into urban trails and greenways. A parallel growth in the biophilic cities movement has highlighted the benefits of daily contact with nature for health and wellbeing (Beatley and Newman Citation2013).
As 70% of the world’s population is expected to live in cities by 2050 (an approximate population of 10 billion people), our urban ecosystems need to be reimagined to ensure, above all, they are sustainable and can support a higher quality of life for their growing populations (United Nations General Assembly Citation2016, UN Sustainable Development Goals). Various political frameworks underscore the need for green spaces in our cities. For example, the New Urban Agenda (United Nations General Assembly Citation2016) calls for an increase in safe, inclusive, accessible, high quality green public spaces. Similarly, the 2030 Agenda for Sustainable Development (United Nations Citation2015) pledges to ‘provide universal access to safe, inclusive and accessible, green and public spaces, in particular, for women and children, older persons and persons with disabilities’. However, in an increasingly urbanised world, our green spaces are under threat and facing extensive competition, especially from housing and transport demands. We know that economic arguments are important in making the case for political support for investments. Although the evidence base for the health benefits of urban green space is strong, the effectiveness of urban green space interventions and their economic justification are much less well researched and understood (Hunter et al. Citation2019).
A recent evidence review of the effectiveness of urban green space interventions provides some support for certain approaches, particularly for park-based interventions that are coupled with social programmes to encourage usage (Hunter et al. Citation2019). Various interventions were able to demonstrate positive environmental outcomes (e.g. increased biodiversity), social outcomes (e.g. reduction in crime; improvements in perception of safety), and improved wellbeing (e.g. reduction in stress) (Hunter et al. Citation2019). The authors argued that the full potential of urban green space interventions has not been realised because most previous evaluations have adopted a uni-dimensional focus on health or environmental outcomes, leading to under-evaluation of the purported range of outcomes and subsequently, the economic impact. Evidence supports the multi-functional nature of urban green space, and so evaluations, including economic evaluations, should have a broader lens than previously used, incorporating health, wellbeing, social, environmental and economic outcomes. Indeed, it could be argued that all of these can be thought of as economic outcomes, and that because of market failure are not taken into consideration when the value of urban green space is being assessed and decisions around resource allocation are being made, known as ‘externalities’. To that end, urban green spaces might be thought of as public goods that only government or philanthropy can provide.
Further, in the evidence review on urban green space interventions, only four studies were identified that investigated their economic impact (Hunter et al. Citation2019). All four studies (Cohen et al. Citation2012, Citation2013, Citation2014, Bird et al. Citation2014) concluded that such interventions were cost-effective. Cohen et al assessed the cost effectiveness of park-based interventions (Cohen et al. Citation2012, Citation2013, Citation2014) based on physical activity levels of users of the new park infrastructure using Metabolic Equivalent of Task (MET)-hours/year. For example, Cohen et al. (Citation2012) calculated the cost-effectiveness based on the changes observed in the intervention parks over time, yielding a net gain of 1909 METS-hours/year in the 12 parks or 159 METS-hours/year per park. On average, a person gains one MET-hour per 15 minutes of moderate-vigorous intensity physical activity (i.e. a brisk walk or run for 15 minutes). A meta-analysis indicated an association between METS gained and reduction in chronic disease risk (Arem et al. Citation2015). For example, compared with adults reporting no leisure time physical activity, the meta-analysis observed a 20% lower mortality risk among those undertaking less than the recommended minimum of 7.5 METS per week (HR, 0.80 [95% CI, 0.78–0.82]), a 31% lower risk at 1 to 2 times the recommended minimum (HR, 0.69 [95% CI, 0.67–0.70]), and a 37% lower risk at 2 to 3 times the minimum (HR, 0.63 [95% CI, 0.62–0.65]). Significant Benefit Cost Ratios (in a range of >4-1) were identified by Bird et al. (Citation2014) based on increased walking and cycling levels after investing in 84 new or improved urban trails around the UK. The study used the Health Economic Assessment Tool (HEAT) for modelling the economic value of health benefits attributable to walking and cycling infrastructure (WHO Citation2014). However, beyond this we have not been able to identify economic evaluations for other urban green space interventions, such as for urban greenways or the greening of vacant lots.
This current study offers an economic evaluation of the potential social return on investment of a new urban greenway (Connswater Community Greenway) developed in Belfast, Northern Ireland. Briefly, this involved the provision of a 9 km linear greenway including 16 km of new or improved walking and cycling trails. We have previously undertaken a Cost Utility Analysis on the projected cost-effectiveness of the new urban greenway (Dallat et al. Citation2014). In line with the National Institute for Health and Care Excellence (NICE) Health Technology Assessment guidelines, we conducted the analysis from a health-care payer perspective with outcomes measured in Disability-Adjusted Life Years (DALYs) (NICE Citation2008). Using a macro-simulation model, the study estimated the potential reduction in burden of cardiovascular diseases, type 2 diabetes mellitus and cancer that might be anticipated if the local population became more physically active due to the new urban greenway. Results showed that if as little as 2% of the inactive (i.e. not meeting UK government guidance for physical activity levels) local population were to become active (i.e. meeting UK government guidance for physical activity levels), then the savings in healthcare would offset the costs of the walkways, trails, bridges and lighting, over a 40-year period. This equated to a total of 184 new cases of chronic diseases and 17 deaths being prevented. All three hypothetical scenarios (i.e. 2%, 5% and 10%) were estimated to be cost-effective, ranging from £4,469/DALY to £18,411/DALY, which is well below the UK cost-effectiveness threshold (Woods et al. Citation2016). Although direct health gains were predicted to be small for any individual, summed over an entire population these are substantial. Whilst we were able to conclude that the new urban greenway should be cost-effective if small increases in physical activity were achieved, we were not able to capture the wider benefits of the greenway beyond health.
Longo et al. (Citation2015) also undertook an economic modelling study investigating the monetary value of walking following infrastructure changes due to the new urban greenway. Using data from a household survey of local residents (n = 1209) collected prior to development of the greenway, a contingent valuation study modelled the economic benefits of walking and how walking behaviour might be affected by neighbourhood improvements. Using compensating variation, the study found that a policy to increase walkability and perceptions of access to shops and amenities, could lead to an increase in walking of approximately 36 minutes per person per week. The monetary value was £13.65 per person per week. However, the study found that such policies are likely to reach only around 12% of the inactive population (i.e. those most in need), and argued that additional interventions would be needed (i.e. those offering more than physical changes to the built environment but which also improved aesthetics or increased connectivity to amenities).
Nevertheless, it is apparent that due to the complex nature of public health interventions, particularly built environment interventions, traditional techniques of cost-effectiveness analysis are not always well-suited to evaluate public health interventions (Weatherly et al. Citation2009, NICE Citation2012b). Instead, there is a need to consider a full range of outcome measures, going beyond Quality Adjusted Life Year (QALYs)/DALYs; stakeholders’ views should be taken into account and the potential impacts on health inequalities should be addressed. Hence, a number of alternative methods have been suggested with two main schools of thought now emerging (Edwards et al. Citation2013). One is to in effect ‘stretch’ the current NICE reference case and include alternative outcome measures such as life-years gained or cases averted and/or employ the capability approach which considers the distribution of capability across society. This would allow for the inclusion of equity considerations in economic analyses. The other school of thought is to abandon the QALY and move to more welfarist based approaches including social return on investment analyses. This is where all benefits of an intervention, including social and environmental, are identified, monetised and weighed against the expected costs. Costs and benefits where possible are based on market prices as these are usually the best reflection of their opportunity cost. If the benefits out-weigh the costs, the intervention is considered good value for money.
Therefore, we modelled the potential social return on investment of the new urban greenway intervention to estimate the potential impact, and to fulfil two purposes. The first of these is to address some of the limitations of our Cost Utility Analysis and attempt to better capture its broader value. The second purpose is to make a contribution to the debate regarding the most appropriate economic evaluation method for public health interventions such as urban green space interventions. Based on findings from the recent evidence review on urban green space interventions, it is clear that a focus only on health outcomes would discount other benefits such as biodiversity, tourism, and housing prices, and therefore under-value the economic case for investment.
Methods
Context: The Urban Greenway
The Connswater Community Greenway was a £35 million investment in a major urban rejuvenation project which began in 2010, and construction was completed in 2016 (http://www.communitygreenway.co.uk). The greenway was funded by the Big Lottery Living Landmarks Award, obtained by a voluntary organisation, the Eastside Partnership. Its main elements include: a 9 km linear greenway with 16 km of new and/or improved foot and cycle paths; 5 km remediated water courses; 23 new or improved bridges/crossings; £11 million flood alleviation measures to protect approximately 1,700 homes from future flooding; six heritage and tourism trails; two new children’s playgrounds; two community gardens; two multi-use games areas; a civic square with facade and public art works; improvements to four major parks (13 hectares) along the Greenway route; connection to an existing Greenway (Comber Greenway) providing 30kms in total of traffic free routes for walking or cycling and the provision of a wildlife corridor through planting of various trees, plants, shrubs and hedging along the Greenway route. The area in which the greenway is situated included some of the most deprived areas in Northern Ireland, including seven electoral wards regarded as within the 25% most deprived wards in the country. The greenway spans over 29 electoral wards in total with a total of approximately 110,600 people living on or along the proposed greenway. This includes 59% female, 51% economically active with age ranges including (7% 16–24 years; 36% 25–44 years; 30% 45–64 years; 27% 65+ years). displays the Connswater Community Greenway and PARC study sampling area.
Figure 1. The Connswater Community Greenway and PARC study sampling area. Legend: Buffers indicate a 5, 10 and 15 minute walk from the Connswater Community Greenway. Reproduced from Tully et al. (Citation2013). Physical activity and the rejuvenation of Connswater (PARC study). Protocol for a natural experiment investigating the impact of urban regeneration on public health. BMC Public Health 13; 774.
Methodological framework
As highlighted above, few studies have attempted to aggregate a comprehensive range of benefits from a health, wellbeing, social and environmental perspective. Such aggregation must overcome risks of double counting and inconsistency in component valuations. Therefore, no agreed-upon methodology currently exists to value the economic benefit of parks, greenways or green infrastructure, and the science of green space economics is still in its infancy (Savills et al. Citation2005, Northwest Regional Development Agency Citation2008, Harnik and Welle Citation2009, Saraev Citation2012, Genecon Citation2012).
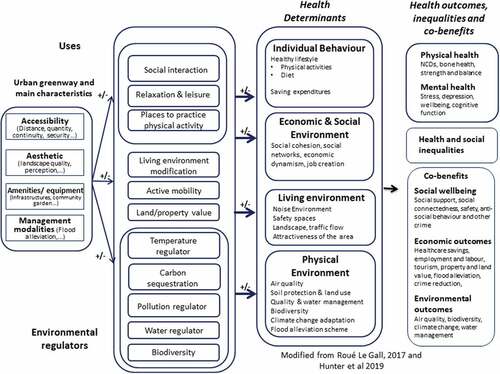
We identified, through previous literature and discussions with the Connswater Community Greenway Management Committee, seven key areas that the greenway was aiming to impact upon, including health, for which there should be sufficient literature evidence and baseline data to quantify and value each area. The seven key areas include: (1) land and property values; (2) labour employment and productivity; (3) flood alleviation; (4) climate change; (5) health; (6) tourism; (7) quality of place (e.g. environmental aesthetics, provision of amenities). presents a conceptual model detailing the intervention and its consequences in terms of economic evaluation. Briefly, we hypothesise that the greenway provides an amenity to those who wish to be physically active, increases worker productivity, provides job opportunities, reduces anti-social behaviour and crime, increases tourism through external visitors to the area, reduces the risk of flooding, mitigates climate risk through change in travel mode from car to walking/cycling etc. The monetary value of these are compared with the cost of generating these benefits – the monetary value of the alternative use of resources – and the two are compared as the present value of a net monetary benefit, or return on investment – a ratio of the present value of cumulative benefits to the present value of the cumulative costs.
Figure 2. Conceptual model representing the intervention and its consequences in terms of economic evaluation and associated co-benefits.
This section takes the following format to detail the methodology: (1) the most recent and applicable evidence, based on reviews of the literature, pre-development of the greenway for each key area was summarised to obtain an ‘effect estimate’. The literature reviews span several disciplines and so multiple perspectives have been considered; (2) this was then applied, where possible, to the most recently available data for the greenway area; (3) the impact was estimated and monetised using various methods. Briefly, to value the impact on property values, the additional direct income to the Northern Ireland economy was calculated through increased property tax (rates) based on the assumption that value would accrue in a given year, once deadweight, attribution and displacement issues have been taken into consideration. The impacts of flood alleviation works, climate change and health was estimated by modelling the environmental and health care cost savings to the local economy. For labour employment and productivity, cost savings were estimated through reduced absenteeism rates for three major employers situated along the greenway route. To value tourism, previously determined Willingness-to-Pay (WTP) estimates for urban park visits within Northern Ireland were used to predict future number of ‘external’ visits to the greenway. Finally, to value the impact of the greenway on ‘quality of place’, the cost savings to the Northern Ireland economy were estimated through reduced crime.
After the first year, we assumed each monetary benefit was maintained over 40 years in line with the expected lifetime of the greenway and we discounted all future costs by 3.5% to calculate their Net Present Value (NPV). This discount rate is in line with both the NICE Health Technology Assessment (National Institute for Health and Care Excellence (NICE) Citation2008) and the HM Treasury Green Book (HM Treasury Citation2013) guidelines for economic appraisal. Finally, all monetary outcomes were summed to obtain the total monetary benefit of the greenway and subtracted from the total cost of the greenway (£35 m) to calculate the net monetary benefit. We have used a discount rate of 3.5% which, up until 2012, was the suggested discount rate for public health interventions from NICE (NICE Citation2012a). We are aware that a discount rate of 1.5% has now been suggested; not without criticism (O’Mahony and Paulden Citation2014). However, we have included the 3.5% discount rate as it serves as an underestimate of the value of benefits and thus the social return on investment. Further, given the scarcity of appropriate and relevant data, we have not modelled the impact of displacement, attribution and drop-off, resulting in somewhat conservative assumptions.
Results (including model assumptions for each element)
Element 1: land and property values
An extensive body of evidence demonstrates the positive impact of green infrastructure on nearby property prices. This effect was first described by Crompton (Citation2001) as the ‘Proximate Principle’ where the capitalization of parkland is absorbed within the value of nearby properties. In order to quantify this effect, the majority of recent studies have availed of Geographic Information Systems (GIS) data combined with the Hedonic pricing method. This is a revealed preference method where the item to be valued is decomposed into its constituent parts and using regression analysis, the contributory value of each of its parts is calculated. Supplementary File 1 (page 1–2) summarises the most relevant evidence, including from the US and UK on greenways, parks and green space, in order to obtain an ‘effect estimate’ or range of effect estimates, for the percentage increase in the average property price in east Belfast due to the construction of the greenway. All studies used a Hedonic pricing method unless otherwise stated.
The 9 km linear greenway and the parks along the course of the greenway are hypothesised to have the most direct effect on nearby property prices. Whilst the parks underwent considerable enhancements, including improved access as part of the greenway project, they are not a new feature and so it is difficult to predict how much their enhancements alone will directly impact on nearby property prices. In contrast, the three river courses that the greenway traverses underwent significant re-development, including flood alleviation measures with the removal of rubbish in the river, improving water quality, and major landscaping to improve biodiversity. Previous to this, houses in the area tended to face away from the river, which, given its state of disrepair, was not considered an asset to any property. In addition, approximately 30.6 acres of new land was procured by Belfast City Council (local authority), as part of the greenway project, to allow for the greenway development (approx. 8% of the total area of the greenway (379 acres)). Therefore, considering the evidence for the effect of greenways and trails on property prices in Supplementary File 1 and in particular, the findings by the UK National Ecosystem assessment for new green space, we estimated conservatively that a property adjacent to the greenway would increase the value by approximately 2%, 5% or 10%.
Summary of model assumptions
Data to calculate the net economic benefit of increased property prices included: (i) number of properties impacted upon by the greenway; (ii) the average house price for the area; and, (iii) the rates or property tax for the area.
(i) Number of properties impacted: Using GIS data, we calculated the number of properties which lie within 50 m (2,241 properties), 450 m (18,736 properties) and 800 m (29,231 properties), respectively, of the greenway.
(ii) Average house price for the area: The Northern Ireland housing market, like in the Republic of Ireland, had just suffered from a crash with house prices peaking in 2007 and then falling, in some cases to 50% or less of their original value. Therefore, to calculate the ‘average’ house price for the area (east Belfast) we conducted a short assessment of the market. Supplementary File 1/ shows the average house price for Northern Ireland, Belfast and east Belfast, from 2007 to 2014 (representing a 7-year period prior to development of the greenway), using data from the Northern Ireland House Price Index report archive (http://www.rpp.ulster.ac.uk/housing-archive.php.) We used the average house price to earnings ratio to provide an indicator of the extent to which people are willing to get on the property ladder. Therefore, the average house price was divided by the average salary. The long term average was approximately 3.5. In 2007, the average Northern Ireland house price to earnings ratio was 11.2, with the property crash following from 2008. Currently, the ratio for Northern Ireland is approximately 5.8.
We assumed that if the average house price to earnings ratio should be approximately 3.5 for the housing market to remain stable, then 3.5 times the average earnings should give an indication of what the average ‘affordable’ Northern Ireland house price should be (Supplementary File 1/ – green line). Average Northern Ireland earnings were obtained from the Northern Ireland Annual Survey of Hours and Earnings (Department of Enterprise Trade and Development, Northern Ireland Citation2013). Clearly the difference between the actual average house prices and what the overall market suggested as affordable, in 2007, were very different. However, it has been speculated that there is a trend that suggests that people are spending a greater proportion of household incomes on property and so economists have argued that the average house price to earnings ratio for today may in fact be closer to 5 (Supplementary File 1/ – light blue line). This finding, as well as the fact that average house prices rose steadily in 2014 with a reported increase in sales, lead experts in housing to suggest that the Northern Ireland market had ‘bottomed-out’ and was showing slow signs of recovery (Ulster University Citation2014).
Therefore, we calculated the average house price for east Belfast using data for the 6-years pre-development of the greenway (2009 to 2014). In addition, since the properties along the greenway are mainly terraced and semi-detached, we calculated the average house price for terraced and semi-detached houses combined and excluded the prices for apartments and detached homes. In summary, using data from the Northern Ireland House Price Index quarterly reports, the average house price for terraced and semi-detached properties combined in east Belfast from 2009 to 2014, was £135,398.
(iii) Residential rates for the area: Using the rates calculator for 2014/15 used by Belfast City Council (http://www.dfpni.gov.uk/lps/index/property_rating/rates-calculator.htm), we calculated the annual rates for the average residential property in east Belfast at present and for three hypothetical scenarios where house prices increased by 2, 5 or 10%, as a result of the greenway and deduced the increased rates paid per property per scenario (Supplementary File 1/).
Table 1. Summary of all Connswater Community Greenway monetary benefits in order of descending magnitude.
Total monetary value
For each scenario, by multiplying the additional rates to pay per property by the number of properties within each ‘adjacency’ specified distance, it was possible to deduce the net economic benefit of property price increases, to the Northern Ireland economy, after one year and over the life time of the greenway (Supplementary File 1/). Results showed that for properties within 50 m of the new greenway, the value of additional rates if there was as little as a 2% increase in property prices, was projected to be almost £43,000, which equates to a discounted value of £970,857 over the 40-year management and maintenance period of the greenway.
Table 2. The Benefit Cost Ratios for worst and best case scenarios for various discount rates and lifetimes of the greenway.
Element 2: labour market employment and productivity
There is a general consensus within the literature that green infrastructure, through improving the aesthetics of an area, can attract inward investment and stimulate economic growth. However, there is little consensus as to how to value this impact in isolation from other factors and how to deal with the issue of displacement (Saraev Citation2012). Displacement is where investment attracted to a ‘greener’ area is likely to have been displaced from elsewhere and therefore the new green infrastructure may not add any net benefit to the economy. We have captured at least one aspect of economic growth and discuss two others which are hypothesised to be a direct result of the greenway and have a positive impact on the Northern Ireland economy. These included: (i) improved labour productivity within east Belfast; (ii) work placements for the unemployed during the construction of the greenway; and, (iii) four newly created jobs on the greenway.
Labour productivity
Better quality green space has been shown to increase employee productivity, reduce stress and sickness and lower absenteeism rates (Genecon Citation2012) due to improved aesthetics of the working environment and the enhanced opportunities for exercise leading to improved physical activity levels and better overall employee health. Enhancing employee health and wellbeing is an area of great economic interest for both the UK government and UK employers since approximately 175 million days per year are lost due to sickness (Black Citation2008). A UK government report estimated that lost productivity costs in excess of £60 billion per year and, when including the costs of sickness absence, this cost totals over £70 billion per year (Black Citation2008). Also, the costs of health-related productivity losses which do not lead to absence are estimated at £30 billion per year.
Summary of model assumptions
In order to estimate the monetary value of improved labour productivity it is necessary to know the quantified impact of a green infrastructure investment on labour productivity and company profit. As yet, the evidence for both is lacking. However, it is possible from the literature to predict the reduction in short-term absenteeism from work which may result from improved physical activity levels. The average employee absence in the UK is 6.8 days with 95% due to short-term sick leave (CBI Citation2004). The WHO demonstrated that workplace physical activity interventions which include 30 minutes of physical activity per day reduce short-term sick leave by between 6 and 32% (Proper and van Mechelen Citation2008). Therefore, for every employee along the greenway who achieves 30 minutes of physical activity each day, five days a week, their employer should benefit from at least 0.4 days gross salary cost per year (i.e. 6% of 95% of 6.8 days), assuming the increment can be achieved and can be attributed to the greenway.
There are three large workplaces (aeronautical manufacturer, bakery and health centre) located along the greenway route whose employees will benefit from direct access to the greenway. We captured data on the number of employees, their associated annual gross salary costs and baseline absenteeism rates for each workplace. Using the Northern Ireland Annual Hours and Earnings survey (Department of Enterprise Trade and Development, Northern Ireland Citation2013) we obtained the median full time weekly earnings by occupation for 2013. We used the weekly earnings for professional occupations, skilled trade occupations and process, plant and machine operatives to represent the weekly earnings for employees from the three large workplaces (Supplementary File 1/Table 3).
Total monetary value
By multiplying the number of employees by their median daily salary by 0.4 days, we obtained the total monetary value of reduced sickness leave for each workplace for one year. This came to a total of £125,374.57 (Supplementary File 1/Table 3). This was then modelled over the 40-year management and maintenance timeline for the greenway to give a total monetary value of reduced sickness absence as £2,833,352.91 (3.5%, 40 years). We believe this to be a conservative estimate as we have not included the further positive financial implications for employers from the impact of increased physical activity as a result of the greenway in preventing long-term disability and absenteeism. Given that there are many more employers in the area, this is assumed to be an underestimate.
Work placements
Some of the employment benefits as a result of the greenway can be considered independent of the issue of displacement. There were two separate contractors involved in the construction of the greenway. Both companies were contractually obliged to agree to a number of social clauses where each contractor provided 52 and 64 placement weeks, respectively, for those who are currently unemployed and involved with the Department for Economy (DfE) Steps to Work (StW) scheme. Also, 5% of the workforce of each contractor and first tier subcontractors (with 20 or more employees) had to be formally recognised paid apprenticeships and each contractor provided a total of 40 person weeks of employment opportunities for students on a University or College of Further and Higher Education construction related course. Obviously, placements like these greatly enhance the future employability potential of those involved and had the contractors worked elsewhere, where the social clauses were not in place, this benefit may not have been realised.
Each contractor employed a total of 35 contractor/subcontractor employees each working on the greenway. Someone on the ‘Steps to Work’ scheme earns an additional £15.38 per week whilst maintaining their benefits. On average an apprentice or student working in construction earns approx. £12,000 per year and assuming there are 52 weeks in any given year this equates to approx. £231 per week. Therefore, if we assume that both contractors uphold the social clauses then the additional monetary amount of the social clauses should be £56,300.08 (Supplementary File 1/Table 4). This is the additional amount received and not their benefits which are transfer payments and cannot be included as added productivity.
Direct employment on the greenway
On completion of the greenway, the local authority has agreed to employ two additional full-time wardens to supervise the area and the Eastside Partnership has secured funding for two full-time educational officers. The educational officers’ salary will fall between £29,236 and £31,754 and the wardens between £19,621 and £21,519 giving an average of £30,395 per year per educational officer and £20,570 per year per warden, totalling £101,930 in additional salaries per year. Assuming their jobs will be sustained for as long as the Greenway is in existence, the total monetary value of the additional salaries will be £2,303,526.64 (3.5%, 40 years). However, we decided not to include the value of the work placements or the newly created greenway jobs. Whilst salaries have been used previously as a way to measure the value of new employment, we felt they were not a suitable financial proxy in this instance. For the work placements, students were paid by the contractors who were in turn paid out of the initial £35 million investment. Therefore, the work placements could be viewed as part of the cost of the greenway as well as a benefit. Similarly, the four newly created jobs will be paid for by the Northern Ireland government and so again could be considered a cost rather than a benefit of the project. The ‘real’ value of the work placements is the employability potential of the students created and the actual monetary benefit of the new jobs created is the additional money these employees will now spend within the Northern Ireland economy. These outcomes are very difficult to estimate and subsequently value in monetary terms.
Total monetary value
The total value of improved labour productivity due to the greenway is £2,833,352.91.
Element 3: flood alleviation
Flood alleviation formed a major component of the greenway project as the area is prone to flooding, to the extent that many of the homes along the rivers are unable to obtain insurance. In June 2007, 48.3 mm of rain fell in east Belfast in 1 hour and over 400 properties were flooded as rivers and drainage systems over flowed and the following year, in August 2008, 100 properties were flooded. Following these floods, the Northern Ireland Rivers Agency conducted an assessment of the area and found that the standard of protection for the east Belfast area was below the recommended level for urbanised areas and the existing open channel and culverts did not have sufficient capacity. Consequently, they commissioned an engineering company to help a business case for the east Belfast Flood Alleviation Scheme. They developed a hydraulic model to explore potential flood risk management options to meet a design standard that provided protection against a 1% Annual Exceedance Probability (AEP) of a fluvial event (a 1 in 100 chance of fluvial flooding in any given year) or a 0.5% AEP of a tidal event (a 1 in 200 chance of tidal flooding in any given year) (further details are provided in Supplementary File 1, page 7).
Results from hydraulic modelling found that the preferred flood alleviation option for the greenway area compared to a ‘do nothing’ scenario involved installing 7 new culverts, 4.1 km of flood walls, 1.2 km of flood embankments and 715 meters of river diversion works along the greenway. These works are estimated to prevent 1,741 properties along the greenway route from future flooding with a total value of damages avoided of £54.7 M. These analyses were run over 100 years, using a variable discount rate of 2.5–3.5%. To bring these analyses in line with the rest of this report, where benefits are projected over 40 years and discounted by 3.5%, we first calculated the average annual damages (AAD) (£1,947,405.37) avoided by dividing the sum of the total benefits (£54.7 m) by the summation of the compounded discount factors (29.863) and applying the Retail Price Index (RPI) to inflate costs to present day. We then projected the AAD over 40 years and discounted by 3.5% to derive a monetary benefit in line with the other elements modelled in this study. It is important to note that the flood alleviation scheme would not have taken place had it not been for the greenway investment; therefore, we have attributed the benefit to the greenway as the work would not have been undertaken otherwise.
Total monetary value
The total monetary benefit of the flood alleviation measures, installed as part of the greenway project, through avoided flood damages is £42,062,211 (3.5%, 40 years).
Element 4: climate change
Urban green infrastructure can offer many environmental benefits through temperature regulation, carbon sequestration and storage (Hunter et al. Citation2019). For example, green infrastructure can help reduce the urban island heat effect where buildings and streets absorb, store and radiate solar energy through shading and evapo-transpiration. The main purpose of the greenway was to rejuvenate and enhance derelict land and create a 9 km linear park for leisure and recreation. Therefore, whilst 12.4 hectares of new land has been procured for the greenway, no new green space has been created (i.e. all land which has been or will be used for the greenway was previously not built upon). However, the newly procured and existing land will be significantly enhanced with a number of plants, hedges, shrubs and trees planted along the greenway route which should increase its impact on climate change but again, it is likely this impact will be minimal and difficult to value.
However, we hypothesise that the greenway will have a measurable impact on climate change through increasing levels of active travel which should reduce car use in the surrounding areas and consequently congestion. On completion of the greenway, residents of east Belfast will have access to over 16 km of cycle and walkways, facilitating short utilitarian journeys by bicycle or foot, and consequently decrease car use. NICE (Citation2012c) recommended that short car trips should be replaced by walking and cycling, particularly for commuting purposes. A summary of the available evidence is provided in the Supplementary File (page 8).
Summary of model assumptions
In line with the percentage change in car trips found in the Sustainable Travel Towns (−9%) and Smart Travel (−12%) studies (Cobiac et al. Citation2009, Sloman et al. Citation2010), we used the more conservative estimate of 11% of car trips of approximately 2 kms in the Connswater and surrounding area being converted to active travel trips, as a result of the greenway, from the 2001 London area travel survey. From the Northern Ireland Annual Traffic Census (Northern Ireland Roads Service, Citation2011), two main census points lay within the Connswater area along two main roads. These roads are busy commuting routes into Belfast from the east of the city. As a result of the greenway, these roads should be the most impacted upon if levels of active travel increase. The Annual Average Daily Traffic (ADDT) count is the total volume of vehicle traffic in a year divided by 365 days. From the Northern Ireland Annual Traffic Census we found the ADDT for each of these roads for all vehicles and for cars alone (Supplementary File 1/Table 5). For the two roads combined, 37,156 car trips are made daily.
Total monetary value
Assuming 11% of car trips are converted to active travel trips, would mean approximately 4,087 less car trips would be taken each day along these main commuting roads. The marginal car costs associated with congestion and greenhouse gases is calculated as £0.134/km (Department for Transport Citation2010). Assuming each of the 4,087 daily trips are approximately 2km in length then the total cost savings of avoided pollution would be approx. £1,095/day or £399,806/year and over the life time of the greenway, £9,035,257 (3.5%, 40 years).
Element 5: health
We have previously undertaken a Cost Utility Analysis to estimate cost savings to the National Health Service (NHS) and deaths prevented from increased physical activity levels due to the greenway (Dallat et al. Citation2014). A positive association between access to green space, trails, parks and physical activity has consistently been found in the literature (Giles-Corti et al. Citation2005, Fitzhugh et al. Citation2010, West and Shores Citation2011, Starnes et al. Citation2011, Lee and Maheswaran Citation2011). However, the exact magnitude of the effect of various built environment attributes on physical activity levels has been less well investigated except for the quantified effect of ‘walkability’ (i.e. how friendly an area is to walking) (Saelens et al. Citation2003, Sallis et al. Citation2009, Van Dyck et al. Citation2010, Sundquist et al. Citation2011). For example, those living in a high walkable neighbourhood perform up to 10 minutes more of moderate vigorous physical activity (MVPA)/day than those living in low walkable neighbourhoods (Sallis et al. Citation2004), and more walkable neighbourhoods are associated with lower BMI and other health benefits (Loo et al. Citation2017).
Summary of model assumptions
We refer the reader to the introduction section, supplementary File 1/Tables 6 and 7, and Dallat et al. (Citation2014) for further details.
Total monetary value
We calculated the total cost savings through diseases prevented for each scenario over 40 years by multiplying the number of incident cases prevented each year, for each disease, by its respective ‘cost per prevalent case per disease’ and summing over all diseases to obtain the total disease cost savings using the PREVENT model (Dallat et al. Citation2014). In summary, if 2%, 5% or 10% of ‘inactive’ Greenway residents at baseline become ‘active’ as a result of the greenway, the NHS could save £211,811, £481,179 and £946,088, respectively (3.5%, 40 years).
We then calculated the value to society of the deaths prevented by multiplying the total number of deaths each year, for each disease, by the value of a statistical life (£1,742,988), as used by the Department for Transport (National Statistics Citation2013). For scenarios A, B and C, the value to society of the estimated deaths prevented amounts to £11,725,212, £27,750,552 and £51,164,083, respectively (3.5%, 40 years).
Combining both the healthcare cost savings and the societal value of deaths prevented for scenarios A, B and C gives total cost savings of £11,937,023, £28,231,731 and £52,110,171, respectively (3.5%, 40 years). As we have modelled healthcare savings, we have not included the value of improved quality of life and so this is likely an underestimate.
Element 6: tourism
It is anticipated that the greenway will become one of Northern Ireland’s stand-alone tourist attractions and attract a wide range of visitors to the area. Tourism and heritage trails were developed along the greenway route. A new tourist centre was built, funded from additional funds outside the primary £35 m investment. In addition, the Titanic Visitor Centre, currently the number one tourist attraction in Northern Ireland, has direct access to the greenway via a recently constructed bridge.
Summary of model assumptions
The greenway benefits realisation plan estimated that the total number of greenway visits will increase by 30% by 2017 and 50% by 2018. Intercept surveys were conducted in February 2011 in four key user areas along the greenway. Route users were interviewed over four 12 hour periods and manual count data was also collected. The results from these surveys provide usage statistics for the greenway at baseline (Supplementary File 1/Table 8). In 2011, all four greenway areas were used predominately by local residents for leisure and active travel purposes.
We assessed the value of the greenway in terms of providing active travel opportunities and opportunities for recreation for the local residents above, through the anticipated pollution and health care cost savings, respectively. Therefore, in order to isolate the tourism impact of the greenway we first removed all postcodes for east Belfast (i.e. BT4, BT5 and BT6) from survey datasets to derive only ‘external’ visits. Second, we removed all journeys for active travel purposes. Only 2.7% of all users were from outside the local area and described using the greenway area for leisure and recreation. At baseline therefore, the greenway attracted very few ‘external’ visitors. We assumed that the baseline number of ‘external’ visits would increase in proportion to the predicted increase in users, from the greenway benefits realisation plan. Therefore, the greenway should experience an additional 12,904 ‘external’ visits by 2017 and 21,507 by 2018 (Supplementary File 1/Table 9).
Total monetary value
A meta-analysis was conducted to predict per-visit values for different environmental sites using data from 40,000+ households (in GB only). The reported costs-per-visit ranged from £1.54 for grasslands to £5.36 for greenbelt and urban fringe farmlands (Sen et al. Citation2014). To estimate the value of these additional ‘external’ visits to the greenway we used previously derived non-market WTP estimates for visits to urban parks in Northern Ireland (Hutchinson et al. Citation1995, Citation2001). For small urban parks similar in size to the greenway (Somerset, Hillsborough, Crawfordsburn, Belvoir) mean WTP estimates per visit ranged from £0.60 to £1.14. We assumed the additional external visits achieved by 2018 would be maintained and therefore projected the 2018 monetary value over the rest of the lifetime of the Greenway. We found the net economic value of increased external visits ranged from £270,135 to £496,700 (3.5%, 40 years).
Element 7: quality of place
‘Quality of place’ can be conceptualised in a number of ways (Saraev Citation2012). Improved green space can offer visual amenity benefits and various studies have assessed people’s WTP for a view according to various landscape types (Genecon Citation2012). Educational benefits have been linked to green infrastructure (Northwest Regional Development Agency Citation2008). Children, who play in natural environments versus those who play in traditional style playgrounds, demonstrate more advanced coordination and balance. Parks and open spaces can increase trust (Mason Citation2010). Open green spaces close to housing act like a continuation of the home environment and can be shared by local residents for recreation and leisure (Woolley et al. Citation2004). This can bring local communities together, foster social ties and generate community cohesion. In addition, the regeneration of poor quality public space and lighting, have both been linked with reduced crime and improved perception of safety in an area (Woolley et al. Citation2004). This then encourages greater use of green spaces leading to increased natural surveillance with further improvements in crime and safety.
We consider that the visual amenity value of the greenway has been reflected in the increase in property prices valued. Therefore, we valued ‘quality of place’ through the potential benefit from improved safety and reduced crime through regeneration of the area and lighting. The length of the greenway has lighting installed enabling access seven days a week and 24 hours per day. In addition, two full-time wardens will be employed to patrol the area. Therefore, we valued the ‘quality of place’ benefit of the greenway in terms of the expected cost savings to the Northern Ireland economy through anticipated reductions in crime, mainly due to the installation of lighting, by following a similar method used in an earlier publication (Painter and Farrington Citation2001). However, it is important to note that this may result in displacement of crime to other areas rather than an overall reduction in crime, indeed some evidence suggests that green space can increase crime (Bogar and Beyer Citation2015, Kimpton et al. Citation2017).
Summary of model assumptions
We estimated lighting along the greenway would decrease property crime (excluding violent crimes) by 21% overall (based on data from a meta-analysis by Welsh and Farrington Citation2008) within the 29 wards spanning the greenway. Crime statistics for all 29 wards within the greenway were obtained from the Northern Ireland Neighbourhood Information Service (NINIS) (Supplementary File 1/Table 10). Ward level was the smallest area level crime statistics could be obtained for and 2012 was the most recently available year of data at the pre-development stage. In brief, crime was found to be concentrated within a few of the more deprived wards with anti-social behaviour being the most commonly committed crime. It should be noted that this data is based on self-reported crime, which is an underestimate of actual crime.
The unit costs of crime in England and Wales, against individuals and households, were available from the Economics and Resource Analysis Research, Development and Statistics Home Office (£ 2003 prices) (Economics and Resource Analysis Research. Development and Statistics Home Office Citation2005). Since the equivalent costs are currently not available for Northern Ireland we used these costs instead. The average cost for each crime includes the costs in anticipation of crime (defensive expenditure and insurance administration), the costs as a consequence of crime (the physical and emotional impact on victims, value of property stolen, property damaged or destroyed, property recovered, victim services, lost output, health services) and the costs in response to crime (criminal justice system). The average cost for burglary is £3,268, theft £844, and criminal damage £866. Currently no unit costs are available for anti-social behaviour or drug offences as these can be difficult to value. Costs for violent crimes are available but, as mentioned earlier, we decided not to include violent crime in the analysis due to a lack of evidence from the literature. Using the RPI these costs inflate to: burglary £4,508.86, theft £1,164.47 and criminal damage £1,194.82, for 2014. A summary of the evidence base is provided in Supplementary File 1 (page 14).
Total monetary value
By multiplying the total number of burglaries, thefts and criminal damages by their respective costs we found the total cost of these crimes was £7,086,888. Assuming these crimes decreased by 21% as a result of the greenway and its associated lighting, the potential cost savings to the Northern Ireland economy would be approximately £1,488,246 in the first year. Over the lifetime of the greenway this amounts to £33,633,036.77 (3.5%, 40 years). No attempt was made to allow for a possible distance-decay effect since no evidence from the literature exists to suggest what the size of this effect might be.
Combined monetary benefits for all elements
To calculate the Benefit Cost Ratio of the greenway we summed all seven monetary benefits, for both a worst case and best case scenario, and divided by the total investment cost of the greenway (£35 m). We found the Benefit Cost Ratio of the greenway to be positive and range from 2.88 (£100,741,873/£35,000,000) to 5.81 (£203,495,306/£35,000,000) (). The flood alleviation scheme was a unique aspect of the greenway. It is likely other urban renewal projects will not have this component and so we explored removing this element from the analyses. Removing the cost of the flood alleviation scheme (£11,695,970) and its monetary benefit (£42,062,211) caused the Benefit Cost Ratio to remain positive but increase in range from 2.52 to 6.93.
The Internal Rate of Return is a way to measure and compare the profitability of investments. It is the discount rate at which the NPV of the costs of an investment equal the NPV of the benefits (i.e. it is the discount rate at which the investment breaks even). If the Internal Rate of Return of a project is greater than the minimum required rate of return (i.e. the cost of capital), then generally the project is considered a good investment. We calculated the Internal Rate of Return to be 13% and 29% for the worst and best case scenario, respectively.
Sensitivity analyses
presents the results from the sensitivity analyses showing the Benefit Cost Ratios for worst and best case scenarios for various discount rates and lifetimes of the greenway. We found the Benefit Cost Ratio to be positive and range from 2.28 to 4.55 when the discount rate was set at 5%. Similarly, the Benefit Cost Ratio was positive, and ranged from 1.01 to 1.87 when the lifetime of the greenway was estimated at 10 years.
Discussion
Previous research has highlighted significant gaps in the evidence regarding the economic impact of green space interventions (Hunter et al. Citation2019). Health economists have been calling for new methods for identifying spill-over effects when multiple inter-sectoral outcomes are anticipated from natural experiments (Deidda et al. Citation2019), such as green space interventions. While we have not solved some of the enduring methodological challenges in this field (see later), to the best of our knowledge, this is one of the first studies to model the social return on investment of a new urban greenway.
Considering best and worst case scenarios, the Benefit Cost Ratio of the project ranged from 2.88 to 5.81 and so even the lower bound offers a very favourable return on investment. In other words, for every £1.00 invested in the greenway, there would be approximately £2.00–6.00 returned. When the discount rate and life time of the greenway were varied as part of sensitivity analyses, the Benefit Cost Ratio remained positive and after approximately ten years the greenway should pay for itself. We found that the anticipated increase in property values due to the greenway would likely generate the greatest potential monetary benefit through increased rate payments (£1 m – £63 m). The second and third largest monetary benefits would be attributable to health care (£12 m – £52 m) and avoided flood cost savings (£42 m) and the fourth due to cost savings from averted crime (£33 m). These top four monetary benefits far outweighed any of the other benefits.
The accuracy of these results depends greatly on the accuracy of the data, the underpinning evidence base and assumptions made. Savings from health care and avoided flood costs were each derived from previously validated modelling methods and extensive literature evidence, while real data were available to estimate the increase in property values. However, in the context of hedonic property values there are many confounding factors that were not accounted for in our analysis, nor were individual characteristics of the greenway or nearby property values when applying estimates from previous research. For example, recent research has shown that the impact of active transport infrastructure has heterogeneous effects on nearby properties, with effects being negative in some instances (Connolly et al. Citation2019). Further, to value the improvement in ‘quality of place’ through avoided crime, evidence was available from only one meta-analysis of 13 studies. In addition, crime statistics were obtainable at ward level as this was the smallest area level at which they could be obtained. Pope and Pope (Citation2012) suggest that property values are impacted through reductions in crime and so we may have double counted values. Also, we were unable to allow for a distance-decay effect as little literature exists to suggest what this might be. Also, although anti-social behaviour was the predominant crime in each of the wards we did not include it, as there is currently little evidence on its monetary value. We were also unable to confidently include other elements such as the impact of volunteering and increased biodiversity. Numerous volunteering opportunities will be available which enables local people to gain work experience and improve their employability potential. However, we were unable to predict the number of future volunteers and therefore their future added value and so this benefit was not included. We did attempt to model the social value of biodiversity by applying WTP estimates from previous studies. However, we did not include this estimation in the final cost-benefit calculation due to the high likelihood of double-counting. We surmised that the value of biodiversity was not independent of the value of increased property prices. Indeed, others have argued that it is not necessary to put a monetary value on biodiversity (Spangenberg and Settele Citation2010). Finally, we did not include mental health, mental wellbeing or the value of health-related quality of life in our modelling of the health impact. We therefore regard the health impact as a likely underestimate. However, others may argue that the estimated health impact is overstated due to sorting mechanisms potentially muting the health effects. For example, positive health effects will be mitigated if individuals with preferences for recreation and active transportation amenities are sorting into areas near the greenway. Similar issues may also impact on labour market estimates. Future analyses should consider residential location choice when examining the welfare impacts of such interventions (Klaiber and Phaneuf Citation2010, Kuminoff et al. Citation2013), exploring if populations have changed or measuring housing turnover along the greenway. Whilst the values of the remaining monetary benefits were much less, with limited impact on the overall Benefit Cost Ratio result, we had to use a number of assumptions in their calculation. To value the impact of the greenway on climate change, using evidence from some previous examples in the literature, we assumed 11% of daily car trips, along two main roads in east Belfast, would be converted into active travel modes. To value the impact of improved labour productivity, we first assumed that all employees from three main workplaces along the greenway route would each perform an additional 30 minutes of physical activity, five days per week. This then allowed us to assume, based on evidence from the WHO, that they would consequently reduce their short-term sickness leave by 6%. For tourism, we assumed that the number of visitors to the greenway would increase by 30% by 2017 and 50% by 2018 in line with the Connswater Community Greenway benefits realisation plan. Arguably some of these assumptions could lead to overestimation of the Benefit Cost Ratio. Equally there were a number of inevitable benefits of the greenway which we were unable to value and include in the Benefit Cost Ratio calculation. These include the potential economic investment which should be attracted to the greenway area, the educational value of the greenway for local schools and colleges, and the value of community engagement activities along the Greenway route.
To derive the monetary benefit of the greenway, we aimed to measure the net benefit to the Northern Ireland economy of the greenway alone. However, other economic factors should be considered when interpreting these results. For example, as described earlier, the Northern Ireland housing market has shown signs of recovery and so it is likely that some of the increase in property values might occur due to the recovering housing market, rather than a direct influence by the greenway alone. This effect is known as deadweight. Also, the anticipated crime prevented through lighting of the greenway might be ‘displaced’ elsewhere and therefore not result in any net economic benefit to the economy. However, it is difficult to predict how much deadweight or displacement will occur and what impact they will have on these results. As noted in our methodology section and throughout, given the scarcity of appropriate and relevant data, we have not modelled the impact of displacement, attribution and drop-off, given the scarcity of appropriate and relevant data which has resulted in conservative assumptions. Further, we have applied a discount rate of 3.5% which also serves as an underestimate of the value of benefits and thus the return on investment. Give the lengthy timeframe when the impact of public health interventions such as the Greenway may be realised (Hunter et al. Citation2019), we will conduct a future return on investment analysis when the Greenway has been in situ for at least 2 years, modelling actual change, and will include in sensitivity analyses discount rates from 1.5%-3.5%. Future analyses will also include broader health benefits such as health-related quality of life associated with reduced morbidity and mental wellbeing. As acknowledged throughout the manuscript, this is a fruitful area for methodological innovation. We have been transparent in our reporting, detailing our assumptions and making best estimates.
Reflection on the methodology
Examples of individual elements from this analysis can be found within the literature but few studies have attempted to combine all the monetary benefits of green space interventions. Indeed, in the review by Weatherly et al. (Citation2009), less than a third of studies attempted to adopt a societal perspective, but this was largely through the consideration of the productivity impacts of QALY gains, rather than a cross sectoral social return on investment. This study therefore provides one of the first attempts to calculate the total monetary benefit of a green space intervention. It also provides a worked example with which to critique and improve upon to advance the methods in this field.
In contrast to a standardised Cost Utility Analysis, this method allowed for all the potential benefits of the greenway, not just health, to be captured. By valuing outcomes in monetary terms and calculating a Benefit Cost Ratio, the magnitude of benefit of the study could be conveyed and potentially used to leverage funding from bodies outside the health care sector.
However, this approach presented some methodological difficulties. We had to employ a number of heterogeneous non-validated methods to measure and value different benefits of the greenway and, as already discussed, there were some uncertainties surrounding the data and assumptions used in the analysis. Where possible we have used the most conservative effect estimates and we were able to check the effect of varying the discount rate and the lifetime of the greenway through one-way sensitivity analyses. However, we were unable to assess the level of uncertainty in the data and methods used. This would require finding an appropriate method to assess and aggregate the uncertainties underlying the component parts of the Benefit Cost Ratio. Recently a framework for extended inventory analysis of the impact of multi-sector investments for public health has been proposed but the authors did not formally set out how uncertainties in production and/or consumption functions across sectors could be aggregated (Walker et al. Citation2019). Some of the same group had previously highlighted that another challenging aspect of such endeavours is the difficulty in identifying shadow prices and opportunity costs across sectors and how they might be aggregated (Claxton et al. Citation2007).
We do not pretend that our analysis has solved many of the enduring challenges identified by Walker et al. (Citation2019) for those striving for a societal perspective on public health evaluations. They themselves admitted that ‘to define social value using an explicit social welfare function defined across individuals and dimensions requires that the full set of dimensions and the methods for aggregation be defined ex ante. For this to be useful for decision makers, each would have to agree that the function is appropriate and that they will follow its implications for policy’. Nevertheless, by providing information on the impacts on different dimensions and sectors, and presenting results based on a range of valuations, we can help to inform deliberations between decision makers responsible for different sectors.
This analysis does not explicitly deal with the issue of equity. Recently, two groups have offered frameworks to more formally address the methods for assessing the economic case for public health interventions that might reduce inequalities, but in each case the frameworks were focussed on health outcomes and QALYs and the authors admitted that a limitation was the usual absence of evidence on the differential effects of interventions on different groups (McAuley et al. Citation2016, Griffin et al. Citation2019). Beneficiary analysis, where the likely distributive effects of proposals is discussed, has recently been suggested as a practical way forward to address equity and this approach could readily embrace a more formal and inclusive approach to economic model building (Bots and van Daalen Citation2008, Bach et al. Citation2017). Our finding, by highlighting all the benefits of the greenway, could be used by key stakeholders to lead such a discussion. In general, the greenway lies within a disadvantaged area and should impact most on the more disadvantaged but some previous urban renewal projects, over time, have resulted in gentrification, a potential unwanted side-effect of the greenway (Atkinson Citation2002).
This study depicts the greenway as a linear ‘cause and effect’ intervention which is unrealistic. This uncomplicated, unidirectional snapshot of the greenway fails to represent all the underlying processes of change likely to occur (Hirsch et al. Citation2007). For example, the greenway may result in unintended consequences, such as displaced activity and gentrification, that are difficult to predict and therefore could not be accounted for in the current model. In fact, the greenway is a ‘complex’ intervention aimed at changing the properties of a complex ‘system’ (i.e. the greenway population consisting of residents, employees, commuters, tourists, school pupils etc). A ‘system’, put simply, is a collection of parts that interact together and function as a whole (Foster-Fishman and Behrens Citation2007). To better understand how and what changes the greenway will create, we could have performed such an evaluation from a ‘systems’ perspective (Shiell et al. Citation2008). This may have revealed indirect downstream wellbeing effects not captured in this analysis, such as changing social norms in terms of food purchasing behaviour, children’s play behaviour, and building social capital within the community and local schools, all of which will have life course effects. Further, the notion that dropoff is inevitable is open to question as the greenway may contribute to a virtuous cycle of changing lifestyle behaviours, ongoing investment in housing, tourism, property values etc.
Conclusion
This social return on investment analysis demonstrates that the greenway is a worthwhile economic investment. It should pay for itself between two to six times, over the life time of the greenway (i.e. for every £1 invested there is an expected £2.00-£6.00 return). It should be noted however that some of the data, underpinning evidence and assumptions used were uncertain and economic issues such as displacement and deadweight could not be accounted for. In contrast to traditional methods of Cost Effectiveness Analysis, social return on investment analyses allow for a wider range of outcomes to be captured and produce an easily understood outcome measure. However, they also present extra methodological difficulties. In particular, there is currently no appropriate method with which to assess and aggregate the uncertainties underlying the component parts of the Benefit Cost Ratio. Finally, future evaluations should aim to consider similar ‘complex’ interventions aimed at causing systems level change from a ‘systems’ perspective so as not to miss important indirect downstream wellbeing systems effects.
Supplemental Material
Download MS Word (53.5 KB)Acknowledgements
This study is published on behalf of the PARC Study team who include (as well as those listed; in alphabetical order): Dr Deepti Adlakha (QUB); Dr Chris Cardwell (QUB); Prof Margaret Cupples (QUB); Prof Michael Donnelly (QUB); Mr Mick Donnelly (ARUP); Prof Geraint Ellis (QUB); Dr Aisling Gough (QUB); Prof George Hutchinson (QUB); Dr Therese Kearney (QUB); Prof Alberto Longo (QUB); Prof Lindsay Prior (QUB); Dr Helen McAneney (QUB); Mr Michael Stevenson (QUB).
Disclosure statement
The authors declare that they have no conflicts of interest
Supplementary materials
Supplemental data for this article can be accessed here.
Additional information
Funding
Notes on contributors
Ruth F. Hunter
Ruth F. Hunter is a Reader (Associate Professor) in Public Health at the Centre for Public Health at Queen’s University Belfast. Her research has focused on the built environment, urban health and non-communicable disease (NCD) prevention. She has particular expertise in urban green space interventions, natural experiment evaluations, and complexity science methods including systems thinking, agent-based modelling, and social and stakeholder network analysis.
Mary A.T. Dallat
Mary A.T. Dallat is a Public Health Speciality Registrar currently based at the Public Health Agency in Northern Ireland. At the start of her public health training she undertook a PhD which was primarily focused on applying traditional techniques of health economic analysis to evaluate public health interventions, particularly physical activity interventions.
Mark A. Tully
Mark A. Tully a Professor of Public Health and Director of the Institute of Mental Health Sciences at Ulster University. He is also the Director of the Northern Ireland Public Health Research Network. His research focuses on addressing population levels of physical inactivity and sedentary behaviour, which are major causes of poor physical and mental wellbeing. His research includes interventions targeting older adults and socio-economically disadvantaged communities, using a wide range of methodological approaches.
Leonie Heron
Leonie Heron is a PhD student at the Centre for Public Health, Queen's University Belfast. Her PhD focuses on the health economics of physical inactivity and sedentary behaviour, including the economic evaluation of interventions. Her background is in human biology (BSc) and epidemiology (MSc) and she is the communications lead on the ISPAH Early Career Network committee.
Ciaran O’Neill
Ciaran O’Neill is Professor of Health Economics at Queen’s University Belfast and Adjunct Professor of Health Economics at the National University of Ireland, Galway. His research interests include the analysis of health care disparities, policy and technology evaluation, and the measurement and analysis of health preferences. He is a teacher and researcher with over 30 years experience in the field of health and has taught and supervised students at all levels of their university education.
Frank Kee
Frank Kee is a Professor of Public Health Medicine and clinical epidemiologist who directs the Centre for Public Health at Queen’s University Belfast. He has also worked with the NHS public health service as a consultant for 30 years and has served on numerous UKRI and NIHR public health scientific advisory panels.
References
- Arem, H., et al., 2015. Leisure time physical activity and mortality: a detailed pooled analysis of the dose-response relationship. JAMA internal medicine, 175 (6), 959–967. doi:10.1001/jamainternmed.2015.0533.
- Atkinson, R. Does gentrification help or harm urban neighbourhoods?: an assessment of the evidence-base in the context of the new urban agenda (CNR paper 5); 2002; Urban Studies.
- Bach, M., et al., 2017. Participatory epidemiology: the contribution of participatory research to epidemiology. Emerging themes in epidemiology, 14, 2. doi:10.1186/s12982-017-0056-4
- Beatley, T. and Newman, P., 2013. Biophilic cities are sustainable, resilient cities. Sustainability, 5, 3328–3345.
- Bird, E., et al. Health economic assessment of walking and cycling interventions in the physical environment: interim findings from the iConnect study. In: South West Public Health Scientific Conference, Weston-Super-Mare, UK, 5 February 2014. Available from: http://eprints.uwe.ac.uk/23015
- Black, C., 2008. Working for a healthier tomorrow. London: The Stationery Office (TSO).
- Bogar, S. and Beyer, K.M., 2015. Green space, violence, and crime: A systematic review. Trauma, violence & abuse, 1, 12. doi:10.1177/1524838015576412
- Bots, P.W.G. and van Daalen, E., 2008. Participatory model construction and model use in natural resource management: A framework for reflection. Systemic Practice and Action Research, 21, 389–407. doi:10.1007/s11213-008-9108-6
- Claxton, K.P., Sculpher, M.J., and Culyer, A.J. Mark versus Luke? Appropriate methods for the evaluation of public health interventions. Centre for Health Economics Research Paper 31 200, University of York. 2007.
- Cobiac, L.J., Vos, T., and Barendregt, J.J., 2009. Cost-effectiveness of interventions to promote physical activity: a modelling study. PLoS medicine, 6 (7), e1000110. doi:10.1371/journal.pmed.1000110.
- Cohen, D.A., et al., 2012. Impact and cost-effectiveness of family Fitness Zones: a natural experiment in urban public parks. Health & place, 18, 39–45.
- Cohen, D.A., et al., 2013. Physical activity in parks: A randomized controlled trial using community engagement. American journal of preventive medicine, 45, 590–597.
- Cohen, D.A., et al., 2014. The potential for pocket parks to increase physical activity. American journal of health promotion: AJHP, 28, S19–26.
- Confederation of British Industry (CBI), 2004. The lost billions: 2003 CBI absence and labour turnover survey. London: CBI Publications.
- Connolly, C., et al., 2019. Capitalization of interconnected active transportation infrastructure. Landscape and urban planning, 182, 67. doi:10.1016/j.landurbplan.2018.09.010
- Crompton, J.L., 2001. Perceptions of how the presence of greenway trails affects the value of proximate properties. Journal of park and recreation administration, 19 (3), 114–132.
- Dallat, M.A., et al., 2014. Urban greenways have the potential to increase physical activity levels cost-effectively. European journal of public health, 24, 190–195. doi:10.1093/eurpub/ckt035
- Deidda, M., et al., 2019. A framework for conducting economic evaluations alongside natural experiments. Social science & medicine (1982), 220, 353–361.
- Department for Transport. Transport Analysis Guidance. 2010. Available at: www.dft.gov.uk/webtag/documents/expert/unit3.9.5.php#04
- Department of Enterprise Trade and Development, Northern Ireland. Northern Ireland Annual Survey of Hours and Earnings, 2013. Available at: https://www.nisra.gov.uk/sites/nisra.gov.uk/files/publications/NI-ASHE-2013-Bulletin.pdf
- Economics and Resource Analysis Research. Development and Statistics Home Office. The economic and social costs of crime against individuals and households 2003/04; 2005.
- Edwards, R.T., Charles, J.M., and Lloyd-Williams, H., 2013. Public health economics: a systematic review of guidance for the economic evaluation of public health interventions and discussion of key methodological issues. BMC public health, 13 (1), 1001. doi:10.1186/1471-2458-13-1001.
- Fitzhugh, E.C., Bassett, D.R., Jr, and Evans, M.F., 2010. Urban trails and physical activity: a natural experiment. American journal of preventive medicine, 39 (3), 259–262. doi:10.1016/j.amepre.2010.05.010.
- Foster-Fishman, P.G. and Behrens, T.R., 2007. Systems change reborn: rethinking our theories, methods, and efforts in human services reform and community-based change. American journal of community psychology, 39, 191–196. doi:10.1007/s10464-007-9104-5
- Frumkin, H., et al., 2017. Nature contact and human health: A research agenda. Environmental health perspectives, 125 (7), 075001. doi:10.1289/EHP1663.
- Gascon, M., et al., 2016. Residential green spaces and mortality: a systematic review. Environment international, 86, 60–67.
- Genecon, L.L.P. Building natural value for sustainable economic development: the green infrastructure valuation toolkit user guide (version 1.3); 2012. Available at: https://ecosystemsknowledge.net/green-infrastructure-valuation-toolkit-gi-val
- Giles-Corti, B., et al., 2005. Increasing walking: how important is distance to, attractiveness, and size of public open space? American journal of preventive medicine, 28 (2 Suppl 2), 169–176. doi:10.1016/j.amepre.2004.10.018.
- Griffin, S., et al., 2019. Evaluation of intervention impact on health inequality for resource allocation. Medical decision making: an international journal of the Society for Medical Decision Making, 39 (3), 171–182.
- Harnik, P. and Welle, B., 2009. Measuring the economic value of a city park system. Washington DC, US: The Trust for Public Land.
- Hirsch, G.B., Levine, R., and Miller, R.L., 2007. Using system dynamics modeling to understand the impact of social change initiatives. American journal of community psychology, 39, 239–253. doi:10.1007/s10464-007-9114-3
- HM Treasury, 2013. The Green Book: appraisal and Evaluation in Central Government. Available at: https://www.gov.uk/government/publications/the-green-book-appraisal-and-evaluation-in-central-governent last accessed 23 July 2019.
- Hunter, R.F., et al., 2019. Environmental, health, wellbeing, social and equity effects of urban green space interventions: A meta-narrative evidence synthesis. Environment international, 130, 104923. doi:10.1016/j.envint.2019.104923
- Hutchinson, G., et al., 2001. Parametric and non-parametric estimates of willingness to pay for forest recreation in Northern Ireland: A discrete choice contingent valuation study with follow-ups. Journal of agricultural economics, 52 (1), 104–122.
- Hutchinson, G., Davis, J., and Chilton, S., 1995. Theoretical and spatial limits to the value of rural environmental benefits: evidence from the Forestry Sector. Journal of rural studies, 11 (4), 397–404.
- Kimpton, A., Corcoran, J., and Wickes, R., 2017. Greenspace and crime: an analysis of greenspace types, neighboring composition, and the temporal dimensions of crime. The Journal of research in crime and delinquency, 54 (3), 303–337. doi:10.1177/0022427816666309.
- Klaiber, H.A. and Phaneuf, D.J., 2010. Valuing open space in a residential sorting model of the Twin Cities. Journal of environmental economics and management, 60 (2), 57–77. doi:10.1016/j.jeem.2010.05.002.
- Kuminoff, N.V., Smith, V.K., and Timmins, C., 2013. The new economics of equilibrium sorting and policy evaluation using housing markets. Journal of economic literature, 51 (4), 1007–1062. doi:10.1257/jel.51.4.1007.
- Kuo, F., 2015. How might contact with nature promote human health? Promising mechanisms and a possible central pathway. Frontiers of Psychology, 25, 1093.
- Lee, A.C.K. and Maheswaran, R., 2011. The health benefits of urban green spaces: a review of the evidence. Journal of public health, 33, 212–222. doi:10.1093/pubmed/fdq068
- Longo, A., et al., 2015. Demand response to improved walking infrastructure: A study into the economics of walking and health behaviour change. Social science & medicine (1982), 143, 107–116. doi:10.1016/j.socscimed.2015.08.033
- Loo, C.K., et al., 2017. Association between neighbourhood walkability and metabolic risk factors influenced by physical activity: a cross-sectional study of adults in Toronto, Canada. BMJ open, 7 (4), e013889. doi:10.1136/bmjopen-2016-013889.
- Mason, S.G., 2010. Can community design build trust? A comparative study of design factors in Boise, Idaho neighborhoods’. Cities, 27 (6), 456–465. doi:10.1016/J.CITIES.2010.07.003.
- McAuley, A., et al., 2016. Informing investment to reduce inequalities: A modelling approach. PloS one, 11 (8), e0159256. doi:10.1371/journal.pone.0159256.
- National Institute for Health and Care Excellence (NICE), 2008. Guide to the Methods of Technology Appraisal. London: NICE.
- National Institute for Health and Care Excellence (NICE). How should NICE assess future costs and health benefits?, 2012a. Available from: http://www.nice.org.uk/newsroom/features/HowShouldNICEAssessFutureCostsAndHealthBenefits.jsp.
- National Institute for Health and Care Excellence (NICE), 2012b. Methods for the development of NICE public health guidance. third ed. London: NICE. Available from: https://www.nice.org.uk/process/pmg4/chapter/introduction.
- National Institute for Health and Care Excellence (NICE), 2012c. Physical activity: walking and cycling. London: NICE. Available from: https://www.nice.org.uk/guidance/ph41/chapter/1-Recommendations.
- National Statistics. Reported road casualties Great Britain: annual report, 2013. https://www.gov.uk/government/statistics/reported-road-casualties-great-britain-annual-report-2013 (last accessed 24 July 2019).
- Northern Ireland Roads Service, 2011. Traffic and travel information 2011 incorporating annual traffic census and vehicle kilometres of travel. UK: Department for Infrastructure.
- Northwest Regional Development Agency, 2008. The economic benefits of green infrastructure – an assessment framework. UK: Northwest Development Agency.
- O’Mahony, J.F. and Paulden, M., 2014. NICE’s selective application of differential discounting: ambiguous, inconsistent, and unjustified. Value in Health, 17 (5), 493–496.
- Painter, K.A. and Farrington, D.P., 2001. The financial benefits of improved street lighting, based on crime reduction. Lighting research & technology (London, England: 2001), 33 (1), 3–10. doi:10.1177/136578280103300102.
- Pope, D.G. and Pope, J.C., 2012. Crime and property values: evidence from the 1990s crime drop. Regional science and urban economics, 42 (1–2), 177–188. doi:10.1016/j.regsciurbeco.2011.08.008.
- Proper, K. and van Mechelen, W., 2008. Effectiveness and economic impact of worksite interventions to promote physical activity and healthy diet. Geneva: WHO, 1–63.
- Roué Le Gall, A., et al. (2017) Causal pathway model between green spaces and health: levers for decision making. In: 14th ISUH conference on urban health, health equity: the new urban agenda and sustainable development goals, 25–29 September 2017 Coimbra, Portugal.
- Saelens, B.E., et al., 2003. Neighborhood-based differences in physical activity: an environment scale evaluation. American journal of public health, 93 (9), 1552–1558.
- Sallis, J.F., et al., 2004. Active transportation and physical activity: opportunities for collaboration on transportation and public health research. Transp Res Part A Policy Pract, 38 (4), 249–268. doi:10.1016/j.tra.2003.11.003.
- Sallis, J.F., et al., 2009. Neighborhood built environment and income: examining multiple health outcomes. Social science & medicine (1982), 68 (7), 1285–1293. doi:10.1016/j.socscimed.2009.01.017.
- Saraev, V., 2012. Economic benefits of greenspace. Edinburgh: Forestry Commission Research report.
- Savills, F., et al., 2015. Does money grow on trees?
- Sen, A., et al., 2014. Economic assessment of the recreational value of ecosystems: methodological development and national and local application. Environmental and Resource Economics, 57 (2), 233–249. doi:10.1007/s10640-013-9666-7.
- Shiell, A., Hawe, P., and Gold, L., 2008. Complex interventions or complex systems? Implications for health economic evaluation. BMJ, 336, 1281–1283.
- Sloman, L., et al., 2010. The effects of smarter choice programmes in the sustainable travel towns: summary Report. London: Department for Transport.
- Spangenberg, J.H. and Settele, J., 2010. Precisely incorrect? Monetising the value of ecosystem services. Ecological Complexity, 7 (3), 327–337. doi:10.1016/J.ECOCOM.2010.04.007.
- Starnes, H.A., et al., 2011. Trails and physical activity: a review. Journal of Physical Activity & Health, 8 (8), 1160–1174.
- Sundquist, K., et al., 2011. Neighborhood walkability, physical activity, and walking behavior: the Swedish Neighborhood and Physical Activity (SNAP) study. Social science & medicine (1982), 72 (8), 1266–1273. doi:10.1016/j.socscimed.2011.03.004.
- Tully, M.A., et al., 2013. Physical Activity and the Rejuvenation of Connswater (PARC Study): protocol for a natural experiment investigating the impact of urban regeneration on public health. BMC Public Health 13, 774. doi:10.1186/1471-2458-13-774.
- Twohig-Bennett, C. and Jones, A., 2018. The health benefits of the great outdoors: A systematic review and meta-analysis of greenspace exposure and health outcomes. Environmental research, 166, 628–637. doi:10.1016/j.envres.2018.06.030
- Ulster University. Quarterly house price index; 2014. https://www.ulster.ac.uk/__data/assets/pdf_file/0010/103033/q1-2014.pdf (last accessed 24 July 2019).
- UN Sustainable Development Goals. http://www.un.org/sustainabledevelopment/sustainable-development-goals/
- United Nations, 2015. Transforming our World: the 2030 Agenda for sustainable development A/RES/70/1. New York: UN.
- United Nations General Assembly, 2016. New Urban Agenda: quito declaration on sustainable cities and human settlements for all (71/256). New York, NY: United Nations.
- Van Dyck, D., et al., 2010. Neighborhood SES and walkability are related to physical activity behavior in Belgian adults. Preventive medicine, 50 (Suppl 1), S74–9. doi:10.1016/j.ypmed.2009.07.027.
- Walker, S., et al., 2019. Striving for a societal perspective: A framework for economic evaluations when costs and effects fall on multiple sectors and decision makers. Applied health economics and health policy, 17, 577–590. doi:10.1007/s40258-019-00481-8
- Weatherly, H., et al., 2009. Methods for assessing the cost-effectiveness of public health interventions: key challenges and recommendations. Health policy (Amsterdam, Netherlands), 93 (2–3), 85–92. doi:10.1016/j.healthpol.2009.07.012.
- Welsh, B. and Farrington, D., 2008. Effects of improved street lighting on crime. Campbell systematic reviews, 13. doi:10.4073/csr.2008.13.
- West, S.T. and Shores, K.A., 2011. The impacts of building a greenway on proximate resident’s physical activity. Journal of Physical Activity & Health, 8 (8), 1092–1097.
- WHO Regional Office for Europe, 2014. Health economic assessment tools (HEAT) for walking and for cycling. Methodology and user guide. Economic assessment of transport infrastructure and policies. 2014 Update. http://www.euro.who.int/en/health-topics/environment-and-health/Transport-and-health/publications/2014/health-economic-assessment-tools-heat-for-walking-and-for-cycling.-methodology-and-user-guide.-economic-assessment-of-transport-infrastructure-and-policies.-2014-update
- WHO Regional Office for Europe, 2016. Urban green spaces and health. WHO Regional Office for Europe. Denmark: Copenhagen.
- WHO Regional Office for Europe, 2017a. Urban green space interventions and health. WHO Regional Office for Europe. Denmark: Copenhagen.
- WHO Regional Office for Europe, 2017b. Action brief on urban green spaces. WHO Regional Office for Europe. Denmark: Copenhagen.
- Woods, B., et al., 2016. Country-level cost-effectiveness thresholds: initial estimates and the need for further research. Value in health: the journal of the International Society for Pharmacoeconomics and Outcomes Research, 19 (8), 929–935. doi:10.1016/j.jval.2016.02.017.
- Woolley, H., et al., 2004. The value of public space. London: Commission for Architecture and Built Environment (CABE).