
 ?Mathematical formulae have been encoded as MathML and are displayed in this HTML version using MathJax in order to improve their display. Uncheck the box to turn MathJax off. This feature requires Javascript. Click on a formula to zoom.
ABSTRACT
Improved housing has the potential to advance health and contribute to the Sustainable Development Goals. Research examining housing, health and energy use in low-income countries is limited; understanding these connections is vital to inform interventions for healthy sustainable human settlements. This paper investigates the low-income setting of Delhi, where rapid urbanisation, a varied climate, high pollution levels, and a wide variation in housing quality could result in significant energy use and health risks. Drawing on approaches from health and the built environment and existing data and literature, a characterisation of energy use and health risks for Delhi’s housing stock is completed. Four broad settlement types were used to classify Delhi housing and energy use calculations and health risk assessment were performed for each variant. Energy use is estimated to be nearly two times higher per household among planned housing compared with other settlement types. Health risks, however, are found to be largest within informal slum settlements, with important contributions from heat and particulate matter across all settlements. This paper highlights intervention priorities and outlines the need for extensive further research, particularly through data gathering, to establish evidence to accelerate achieving healthy, sustainable and equitable housing in Delhi.
Introduction
Better housing has the potential to improve health and well-being (Howden-Chapman et al. Citation2012), advance development, especially in low-income countries (Haines et al. Citation2013), and support environmental objectives, notably in relation to energy consumption (Haines et al. Citation2009). Housing interventions have been shown to improve physical and mental health (Thomson et al. Citation2001, Office of the Deputy Prime Minister Citation2006, Gibson et al. Citation2011, Howden-Chapman et al. Citation2011) and reduce health inequalities (Thomson et al. Citation2013). Energy efficiency in housing is vital for climate change mitigation objectives, with buildings currently accountable for 38% of total global energy usage and 25% of energy-related CO2 emissions; hence, energy efficiency in homes is crucial to reduce emissions (Wilkinson et al. Citation2007). Improved housing, therefore, has an important role in achieving the United Nations Sustainable Development Goals, particularly Goal 11: Make cities and human settlements inclusive, safe, resilient and sustainable, but also to achieve energy efficiency (Goal 7), combat climate change (Goal 13) and ensure health and well-being for all (Goal 3) (United Nations Development Programme Citation2015).
Research examining the connections between housing, health risks and energy use in housing has tended to focus on high-income countries with temperate climates that have adopted energy efficiency targets. Research has evaluated the health impacts of strategies and policies for energy efficiency in housing. In the UK, for example, the implementation of insulation in homes has been shown to offer protection against cold-related mortality (Wilkinson et al. Citation2007). However, energy efficiency interventions may also cause unintended adverse health impacts (Shrubsole et al. Citation2014), without due consideration (Davies and Oreszczyn Citation2012). For example, both modelling (Milner et al. Citation2014) and empirical measurements (Symonds et al. Citation2019) of UK housing indicate energy efficiency improvements are likely to be responsible for increases in indoor radon levels. The health benefits of housing interventions in low-income countries is considered much greater (Wilkinson et al. Citation2009), yet there is a little evidence on the links between energy, health, and housing in these developmental and climate contexts – more research is necessary to understand risks and priorities for interventions in these different settings. Housing quality in low-income countries can be extremely varied, and interventions are vital to achieve energy efficiency targets and health goals simultaneously.
This paper aims to investigate housing health risks and energy use in the context of a low-income country and identify where interventions are needed. The city of Delhi, India, was selected as a case study, as it provides an example of a rapidly urbanised city, with unprecedented levels of uncontrolled housing development, which may present significant challenges in providing sustainable and healthy living environments.
Background
India is projected to be the most populous country by 2050, predicted to be home to 20% of the world’s population with nearly 1.7 billion inhabitants, and with the urban proportion expected to grow from 31% to 52% during the next four decades (United Nations Citation2017). Pressures from this rapid growth, along with a disorganised approach to housing provision (Mahadeva Citation2006), can be seen through a shortage in housing and related infrastructure across Indian cities (Sivam and Karuppannan Citation2002). The population of the National Capital Territory (NCT) of Delhi has substantially increased over the last century from just under 1 million inhabitants in 1941 to over 16 million in 2011 (Government of India Citation2011). This growth has coincided with the development of unauthorised and informal settlements, where the slum population is reported to account for 47% of the housing stock (Government of National Capital Territory of Delhi Citation2008). These settlements suffer from poor quality housing, cramped spaces and a lack of basic services and infrastructure (Goli et al. Citation2011), with significant risks of infection and injury (Ezeh et al. Citation2017).
With this rapid growth, there are also energy challenges. In 2015, India was the fourth-largest energy consumer (after the United States, China and Russia), with energy consumption rates growing annually (U.S. Energy Information Adminstration Citation2018). International Energy Agency (IEA) Energy Balance Statistics for India state that the residential sector accounts for the largest proportion (38%) of the country’s energy use (International Energy Agency Citation2009). Although per capita energy consumption remains very low, future projections indicate increased electricity use and higher ownership of appliances as incomes increase (Reddy and Srinivas Citation2009), resulting in higher CO2 emissions (Rout Citation2011, van Ruijven et al. Citation2011). Within Delhi, the residential sector is responsible for 45% of electricity sales (Government of National Capital Territory of Delhi Citation2013). Consequently, this combination of increased appliance usage and housing growth could result in high future demands on energy consumption.
Environmental conditions in Delhi are extremely challenging. Delhi experiences a composite climate (Bureau of Indian Standards Citation2005), with a large seasonal variation between a cold winter (mean minimum temperatures below 10°C), dry and hot summer (highs up to 45°C) and a humid monsoon period (Indian Society of Heating Refrigerating and Air-Conditioning Engineers). Temperatures are predicted to increase by 3–4°C by 2100 due to a changing climate (Defra, Akhtar Citation2007, Singh and Dhiman Citation2012), with heat waves becoming more frequent, risking significant impact on energy consumption through air conditioning (A/C) use (Sivak Citation2009, Akpinar-Ferrand and Singh Citation2010) and heat-related mortality (Akhtar Citation2007). A humid monsoon season coincides with an outbreak of mosquitoes, with vector-borne disease epidemics becoming more likely (Dhiman et al. Citation2010). Outdoor air pollution levels are notoriously high due to generation from vehicles, industry, diesel generators, and brick kilns (Guttikunda and Goel Citation2013). Delhi’s mean annual concentrations of particulate matter PM2.5 (PM with an aerodynamic diameter ≤2.5 µm) regularly exceed 100 µg/m3 (Government of National Capital Territory of Delhi Citation2013), severely breaching World Health Organization (WHO) air quality guidelines of 10 µg/m3 (WHO Citation2006, Citation2010). Due to both anthropogenic (waste burning for heating) and meteorological conditions, PM2.5 winter levels are two to three times higher than summer and monsoon periods (Guttikunda and Gurjar Citation2012). Furthermore, the effects of rapid urbanisation have resulted in polluted water supplies (Ministry of Environment and Forests Power Government of India Citation2001), poor solid waste management (Talyan et al. Citation2008) as well as heightened noise pollution (Firdaus and Ahmad Citation2010). These external factors will have a substantial influence on indoor conditions, and hence household energy consumption and potential health impacts.
Objectives
Rapid urbanisation, significant informal housing provision, increased energy use in the domestic sector, along with a challenging external environment, suggests substantial sustainability and health risks across Delhi’s housing. There are, however, opportunities for interventions that could help meet energy and health goals simultaneously. This paper aims to make a broad assessment of health risks and energy use across Delhi’s housing to inform priorities for interventions that could improve health and sustainability. As such, this paper aims to answer the following questions:
What are the housing characteristics of Delhi’s housing stock?
What are the energy use characteristics and principle health risks, and how do these differ across the housing stock?
What are the priorities for housing interventions to advance health and sustainability goals?
An assessment of Delhi’s housing, of this scale and type, has never been completed. Such work is necessary for identifying the key risks and priorities across Delhi, this will help inform avenues for further research as well as pathways for interventions, which then can be utilised by planners, engineers and architects to enable a transition towards a healthy sustainable urban environment.
Methodology
The methodology developed was informed by the fields of public health and the built environment. The work draws on existing data sets and available evidence and applies broad assessments to understand current energy use and health risks across Delhi’s housing. An overview of the approach used is shown in .
Figure 1. Overview of the methodology
Stratification of Delhi’s housing stock
Housing stock models have been widely used in studies assessing city residential energy consumption and potential interventions, with the housing stock generally broken into distinct archetypes based on relevant housing surveys (Kavgic et al. Citation2010). Stratification of the housing stock is useful for both the development and assessment of policies and strategies that can improve health or reduce energy consumption in the given area. We aimed to develop a stratification method of Delhi housing to estimate current energy use and principle health hazards to develop and assess potential strategies.
For the case of Delhi, there is no comprehensive survey that details housing characteristics at the level needed to generate distinct archetypes. The India Housing Census (Government of India Citation2011) and Housing Condition National Sample Surveys (NSS) (N. S. S. O.-M. of S. & P. I. Government of India Citation2010a) provide basic details of common construction materials, floor areas, and the number of rooms per dwelling but do not provide detailed data on the built form, such as thermal properties, layouts, or ventilation provision necessary to generate a set of archetypes. The annual Delhi Economic Survey provides a breakdown of dwellings by settlement type in Delhi (Government of National Capital Territory of Delhi Citation2008) (). These settlements follow three modes of development: informal, organic and formal, which have different planning jurisdictions. Formal housing areas are planned by governing development authorities or private agencies; these have formal legal sanction prior to development and should comply with building regulations (Sivam Citation2003). Informal housing is composed of unauthorised colonies, built illegally on private land, and slum settlements, both of which lack legal tenure (Sivam Citation2003). Organic settlements consist of old urban housing and traditional rural villages, which have evolved over time (Ishtiyaq and Kumar Citation2011).
Table 1. Settlement types in Delhi, from (Government of National Capital Territory of Delhi Citation2008)
The modes of development have a significant influence on the built form and infrastructure characteristics and are connected with different income groups. These distinct modes of development were used as a basis to stratify Delhi housing stock into four settlement types as followed:
High-income planned housing – these are developed by private agencies or the Delhi Development Authority (DDA), and often takes the form of plotted housing and multi-storey flats that comply with building standards and have infrastructure provision (Sivam Citation2003, UN Habitat).
Villages (including both rural and urban villages) – these have become part of Delhi with urbanisation (Ishtiyaq and Kumar Citation2011). These are more traditional in style – commonly open-fronted housing with 3–4 storeys, closely packed on narrow streets, and with little natural lighting (Kumar Soni Citation2011). They lack planned services, are suffering from overcrowding and dilapidation (Ishtiyaq and Kumar Citation2011), and tend to be occupied by mid- to low-income groups (UN Habitat).
Unauthorised colonies (of which 13% are now regularised and given formal land rights), which are built illegally on agricultural land; information about these housing types is sparse. Infrastructure is provided through regularisation.
Slum or locally known as jhuggi jhopdi (JJ) cluster settlements. These are home to the urban poor and are self-built, simple structures without land tenure, which undergo incremental growth with time (Sivam Citation2003). They are small and tightly cramped dwellings with floor areas no larger than 20 m2 (Ahmad and Choi Citation2011), suffering from a lack of services, inadequate ventilation, and poor thermal comfort (Mitchell Citation2010).
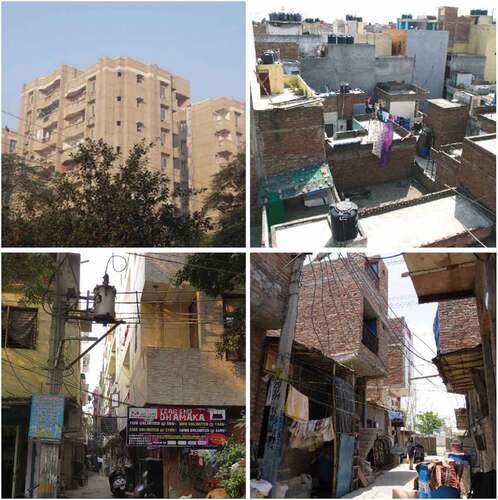
Example photographs of the four categories of settlement types are shown in . The various data sets were then linked to the settlements types, by household income, to develop a broad description of the housing in each category. This was cross-checked through field visits and personal correspondence with experts in housing in Delhi.
Figure 2. Examples of category 1: planned housing (top left), category 2: urban/rural villages (top right), category 3: unauthorised housing (bottom left), and category 4: JJ Clusters (bottom right)
Construction and energy use characteristics of settlement types
Dwelling construction materials and energy uses were linked to settlement types via several different sources. Here, we review the available data sources across the settlement types.
Construction characteristics
The Census and NSS show that in the case of all settlement types, the majority of housing is constructed with burnt brick (N. S. S. O.-M. of S. & P. I. Government of India Citation2010a, Government of India Citation2011). In the higher income group concrete accounts for 97% of all roofing material (N. S. S. O.-M. of S. & P. I. Government of India Citation2010a). Details of the material composition used in planned dwellings were based on studies from Kumar & Suman (Citation2013), Ramesh et al. (Citation2010), as well as the IT Toolkit EnEff ResBuild India (TERI and Fraunhofer Institute for Building Physics). Little information is available about composition in the unauthorised and urban village settlements and therefore we assume they are similar to the planned dwellings. The material used in the JJ settlements is likely to be much more varied. For example, concrete accounts for less than 50% of roof material in the lowest income group, with metal sheets, stone, canvas, or timber as other predominant materials (N. S. S. O.-M. of S. & P. I. Government of India Citation2010a).
Energy use and appliances
Both the Census and Housing Condition NSS surveys detail access to electricity and the use of primary cooking fuels. All settlements are likely to use Liquid Petroleum Gas (LPG) as the predominant cooking fuel (Government of India Citation2011). The majority of households have access to ceiling fans (TERI Citation2007) (N. S. S. O.-M. of S. & P. I. Government of India Citation2010b) and the penetration of appliances such as TVs and fridges are similar across settlement types. 99% of houses in Delhi have electricity for lighting (N. S. S. O.-M. of S. & P. I. Government of India Citation2010a). However, the use of A/C or air coolers is skewed towards high-income settlements, most likely planned dwellings. Ownership of A/C or coolers increases with the monthly per capita expenditure (MPCE) class from 26% of households in the lowest decile to 77% in the highest (N. S. S. O.-M. of S. & P. I. Government of India Citation2010b). TERI reports higher ownership of A/C in higher housing tax bands with air coolers used predominately in mid-housing tax bands (TERI Citation2007). 48% of electricity sales in Delhi are domestic consumers (Government of National Capital Territory of Delhi Citation2013), and it is estimated that 50% of residential electricity use in summer months is due to a combination of ceiling fans, air coolers, and A/C (TERI Citation2007). The ownership of heating equipment is recorded to be low across all settlement types (TERI Citation2007).
The available data sources were mapped to the settlement types, these findings were confirmed by experts in the field with experience in the housing in Delhi. A summary of the characteristics of each settlement type can be found in .
Table 2. Typical properties of each settlement type
Assessment of household energy use
To assess typical energy consumption across the Delhi housing stock, we performed a simplified energy calculation to estimate energy use for each settlement types, supported by the data and housing characteristics gathered in the previous section. This method considers available data on the ownership of appliances (lighting, cooking, cooling and other end-use), average appliance power ratings, and time in use, and used assumptions on occupant behaviour based on available survey data. This simplified approach allows a broad estimation of energy use and CO2 per settlement type based on the currently available data. More detailed approaches, such as dynamic building energy simulations or the degree-day method, would require detailed data on building characteristics or a broader range of assumptions, which would require detailed surveying and measurements to perform at the stock level and was thus deemed beyond the scope of this exploratory work.
Total annual energy usage, , is taken to be the sum of the energy use of all appliances, based on the number of appliances of type
,
, the power rating of appliance
,
and the time of use of appliance
,
,:
CO2 emissions are then calculated by applying the appropriate carbon intensity coefficients for the fuels used and electricity generation. Energy use from cooking was taken to be the same across all settlement types, based on average LPG usage per month (D’Sa and Murthy Citation2004). Energy use for lighting and appliances was based on survey data assessing typical appliance use in residential dwellings in Delhi (TERI Citation2007). Hours of use of cooling appliances (fans, coolers and A/C in occupied bedroom and living rooms) was calculated to be the number of hours when the external temperature exceeded a threshold temperature. The threshold temperature was given by a thermal comfort study in composite climate in India (Indraganti Citation2011) and the external temperatures were taken from a typical weather file for Delhi (Indian Society of Heating Refrigerating and Air-Conditioning Engineers). Given the low ownership of heating appliances across all income groups, we did not consider this end-use type. Detailed inputs taken for appliance usage, power rating, and carbon intensity can be seen in . We carried out a sensitivity analysis for the planned settlement type to understand the impact of input variables on the output variable, described in Appendix A.
Table 3. Assumptions on energy use in dwellings
Assessment of housing health risks
To characterise the distribution of health risks across the settlement types, a risk assessment was completed. Risk assessment techniques are widely established (British Standards Institution Citation2010) and have previously been used to assess housing health hazards elsewhere (Jacobs Citation2011). These use expert judgement to assess hazards, and generally consist of three steps; hazard identification, risk analysis and risk evaluation. Although more sophisticated methods exist, such as exposure-response relationships to calculate the disease burden, expert judgement has been a common method due to the lack of data, a wide range of potential hazards and multiple health outcomes. Studies using exposure-response relationships tend to have a narrow or single focus, such as those that review health risks from indoor temperatures (Scovronick and Armstrong Citation2012). We draw on existing frameworks but adapt them to the level of available data for Delhi.
Hazard identification
Hazards identified for inclusion in the assessment are based on those included in the United Kingdom Housing Health Safety Rating System (HHSRS) (Sverdlik Citation2011), which is the most extensively developed assessment tool (Keall et al. Citation2010). As the context of Delhi significantly differs, we supplemented the UK HHSRS with additional hazards for particulate matter and vector-borne diseases which may be present in Delhi. The hazards assessed are listed in .
Table 4. Hazards assessed in the Delhi housing stock (from UK HHSRS apart from those marked * which were added for the Delhi stock)
Risk analysis methodology
A semi-quantitative method was used to characterise the principal health hazards. The method considers the likelihood of occurrence and expected harm from available literature and data sources, experience from field visits and consultation with local experts. A consequence/probability matrix was developed to rank the risks (). Such methods are commonly used as a screening tool when many hazards are identified or where data is limited and can provide guidance on which hazards require further detailed analysis or should be treated first (British Standards Institution Citation2010). The likelihood of occurrence and the expected harm for each hazard was assessed to be either low, moderate, high or severe (or 1 to 4). The simplified hazard consequence/probability matrix was then used to rank the risks, giving a final score that was calculated by multiplying the likelihood of occurrence and expected harm. For further clarification, a definition of terms, the rationale for judgement, and assessment categories used are included in Appendix B.
Table 5. Risk matrix used to assess each hazard based on the likelihood of occurrence and spread of harm
The likelihood of occurrence and expected harm for each hazard for each settlement type in Delhi was based on a review of the academic literature (Appendix C). In particular, this included literature and datasets on:
Environmental exposure risk; which includes evidence of outdoor environmental quality; indoor environmental quality; the level of infrastructure and services; and other related datasets;
Housing conditions/modifiers; which considered risks in relation to the identified settlement types drawing on evidence of housing quality;
Health evidence; which included relevant health data (recorded deaths in NCT of Delhi), EM-DAT data for India on mortality due to disasters (extreme heat and cold, fires, explosions, and collapse) and other relevant health studies.
Based on this evidence, all authors separately judged the likelihood of occurrence and expected harm as low, moderate, high or severe. These judgments were then compiled by taking the most common (mode) judgement (of the all the individual assessments) for the likelihood and expected harm, these were then used to calculate the final hazard rating. As the analysis method is largely subjective, combining the individual responses accounts for the variation between the authors’ ratings, this helps to improve the objectivity and rigour of the assessment. Mode, median, maximum and minimum hazard ratings results are provided in Appendix C for each hazard as a measure of the variability in ‘expert opinion’.
Results
Variation in household energy use and CO2 emissions
The highest energy use was estimated for the planned dwellings, mainly due to the high penetration of A/C (). Planned settlements dwellings were estimated to use between one half to a third more energy than dwellings from other settlement types. The lowest energy use is estimated in JJ clusters, where ownership of cooling appliances is low and space is limited. In planned housing cooling appliances were estimated to account for 44% of energy use, whereas in JJ cluster dwellings this is was found to account for less than 5% of energy use, with the majority of energy is used for cooking. This suggests that all energy needs are likely not be met in the JJ clusters, particular in regards to cooling.
Table 6. Annual energy use by end-use (and percentages) by settlement type
Estimated annual CO2 emissions (kg) per settlement type () are distributed similarly to energy consumption.
Figure 3. Estimated kg CO2 emissions per household by settlement type
The Economic Survey of Delhi estimates residential electricity sales for 2011–12 to total 10,861GWh (Government of National Capital Territory of Delhi Citation2013). By scaling up to stock level, based on the distribution of settlement types and methods outlined above, we estimate a total annual consumption of 11,512GWh, an overestimate of 5%. This discrepancy could be due to a combination of simplifications and assumptions for each settlement type, in particular, the likely penetration of cooling appliances; the likelihood that total electricity use is not fully recorded due to illegal connections in JJ clusters; the use of back-up generators during blackouts; and the fact that A/C units might not be used for all hours that external temperatures exceed the specified threshold. The results of the estimated electricity use (i.e. without cooking) can be compared to other studies evaluating energy use in housing in a composite climate of India (Chunekar et al., Ramesh et al. Citation2012a, Citation2012b, Citation2013, Global Buildings Performance Network (GBPN) Citation2014, Praseeda et al. Citation2016, Mastrucci and Rao Citation2017). We find that the spread of results is broadly in line with our estimates (). A sensitivity analysis of input parameters for the planned dwellings highlights power rating of A/C (R2 = 0.49) and hours of use (R2 = 0.33) are the most significant parameters for annual electricity use.
Figure 4. Comparison of electrical energy use estimates with other studies in literature in composite climate
Variation in housing health risks
The estimated hazard rankings for the different settlement types in Delhi can be seen below (). The scientific literature and datasets which were used by the authors to estimate the hazard risks and likelihoods are detailed in Appendix B. The final rankings were generated by taking the mode response for both likelihood of occurrence and the expected harm from the individual assessments. The completed risk analysis can now be used to prioritise which hazards require action first.
Table 7. Estimated household health hazard risks final rating (SO,H), with red denoting highest risk hazards and green lowest risk hazards (with modal responses of Low, Medium, High and Severe for the likelihood of occurrence, O, and expected harm, H, noted in subscript)
Particulate matter, heat and cold hazards were assessed to be the largest risks across all four categories of settlement, while vector-borne disease and water supply were also estimated to present significant risks to those in low-income JJ cluster settlements. Structural collapse, fire, overcrowding and, damp and mould hazards were estimated to be moderate risks across all settlements. JJ clusters were estimated to be the most ‘at risk’ settlement type, followed by urban villages and then unauthorised colonies. Planned settlements are likely to have high-quality dwellings and better access to services and infrastructure, hence providing the lowest risk environments. This variation in health risks across the settlement types presents is likely to cause a disproportional health burden on the low-income groups in Delhi.
Discussion
This paper set out to provide an assessment of energy use and health risks across Delhi’s housing stock. The stock was divided into different settlement types, with data from a range of sources reviewed to estimate energy use characteristics and health risks across the settlement types.
Priorities across settlement types
Our assessments indicate significant variation in energy use and health risks between the distinct settlement types found in Delhi. Planned dwellings were estimated to have a much greater consumption of energy in comparison to other settlement types, driven primarily by A/C usage. Taking an average occupancy of 5 across all settlement types gives 1170, 648, 642 and 471kWh/per person for planned, urban village, unauthorised and JJ cluster dwellings respectively, which illustrates that occupants in planned dwellings use almost use twice as much energy person compared to occupants from other settlement types. In urban/rural villages and unauthorised colonies, energy consumption was relatively low and poor indoor environmental conditions were the largest concern. Interventions should aim to improve indoor conditions but not significantly increase energy use. In the informal JJ clusters, strategies should focus on reducing a multitude of health hazards and improving dwelling quality as well as access to infrastructure, services and appliances. Given that the majority of energy use was from cooling appliances and household appliance (TVs and fridges), interventions should focus on energy efficiency for these appliances as well as passive cooling alternatives.
Largest risks to health were found to be hygrothermal conditions (temperature and humidity) and air quality in all settlement types, hazards which could be reduced through better housing design and interventions to modify dwelling performance. Although housing quality has a significant impact on health risks, these are compounded further by levels of household income. For example; in the formally planned dwellings, the high penetration of A/C is likely to reduce exposure to high temperatures but then results in costly energy use, whereas in JJ clusters the poor dwellings and limited access to cooling appliances heighten health risks. This results in a huge disparity in energy use between settlement types, and thus the socio-economic development potential of populations living in those settlements. The strategies in each settlement will differ significantly and interventions will need to appropriately reflect the socio-economic status of each settlement type.
Opportunities to intervene in the planned dwellings are likely to be less restricted compared with the other settlement types, where interventions are limited by the crowded surroundings, dwelling size and financial capacity of the households. Policies will need to reflect current development mechanisms. In urban villages, strategies should focus on maintaining the quality of dwellings, as current regulations that do not restrict development have led to space partitioning and the reduction in ventilation and natural lighting. Interventions in unauthorised colonies can be incorporated in directives as unauthorised colonies become further regularised. In JJ clusters, interventions must be low cost (or heavily subsidised), easy to implement and employ local skills and resources. In general, policies could include incentivised payback periods from energy savings, such as those used in high-income countries, subsidises for materials and efficient appliances, improved housing guidelines and specialised support for homeowners, architects, designers, planners, and the DDA who are a major provider of new housing.
Limitations and implications for future research
This paper represents an initial investigation into the energy use and health risks in housing for the case of Delhi, where there is little previous work or supporting data. Data limitations restrict the level of assessment detail and the accuracy of the results. While it was possible to aggregate the housing stock into four broad categories and describe general characteristics, it is not possible to breakdown the housing further into a set of archetypes and describe in detail their features, which would aid a more accurate estimate of energy use and health hazards. Similarly, energy use data, such as details of occupancy behaviour and appliance use, is restricted to only a couple of studies with limited scope. Additional data collection on housing characteristics in each settlement type is needed and surveys capturing appliance ownership, use and occupancy would provide a more accurate description of energy use across households. Our estimates at a stock level ignore any variation in appliance ownership; for example, we assume 100% penetration of air conditioning across the planned settlements, which is likely to be an oversimplification. It is recommended that national and state-wide surveys, such as the NSS, collect further data on household geometry, the composition of construction materials (beyond material type), and details on ventilation provision and detailed household energy use. This would enable the development of archetypes to establish a stock model that is representative of the housing in Delhi. Without this information, it is only possible to develop broad conclusions. Dukkipati et al. (Citation2014) also recommend more appropriately designed surveys to increase data availability on energy use in India (Dukkipati et al. Citation2014).
Our modelled energy results were broadly in line with previous studies. However, these studies often take idealised or simulated cases, which may not reflect actual use. For example, Ramesh et al. (Citation2012a, Citation2013) assume heating below 18°C and cooling above 25°C, which is not in line thresholds from thermal comfort studies (Ramesh et al. Citation2012a, Citation2013) and Mastrucci and Rao (Citation2017) consider the energy required for ‘decent’ living to meet comfort needs (Mastrucci and Rao Citation2017). Studies with measured data do not clearly define appliance ownership or their usage, thus making it difficult to compare directly (Praseeda et al. Citation2016). Comparing the energy end-use in the planned dwelling with studies that include space cooling suggest similar trends with the highest energy use from cooling appliances, however, these studies do not consider other appliances such as TV and fridges (Mastrucci and Rao Citation2017) or do not provide adequate details of what other appliances were considered so direct comparisons are not possible (Ramesh et al. Citation2012a, Citation2013). More work is needed to assess actual energy use and interventions that help to protect for health across all housing groups to develop a better understanding of energy consumption and develop appropriate interventions. Furthermore, typically studies report metrics of energy use per unit floor area, which is useful highlighting efficiency in building performance but this is not appropriate for dwellings with vast differences in energy uses and floor area, and may provide misleading results.Footnote1 New metrics that demonstrate the disparities in energy use between households, look beyond building performance and highlight energy use gaps in regards to health risks are vital to pinpoint where interventions should be targeted.
The methods used to assess the energy and health hazards across the settlement types are based on the best available data and expert opinion. Energy use estimates currently do not consider building performance, and variations in occupant behaviour and patterns, this would require in-depth data collection to develop these on a stock level. More sophisticated methods, such as building physics modelling, could provide better predictions of energy consumption as well as indoor environmental quality (hygrothermal conditions and exposure to pollutants). Health impact models could provide estimates of morbidity and mortality based on exposure-response functions. The level of data required for such methods is currently unavailable and significant further research is needed to gather this information. More work in this area is crucial to support effective policy to improve health and sustainability across housing stock in Delhi. Some consideration of the sensitivity and uncertainty in the applied methods is provided. The assessment of health hazards is carried out individually by the authors (variation of the response is provided in Appendix C) and then combined for the formulation of a final ranking, which helps to improve the objectivity of the analysis. A sensitivity analysis for energy use was performed for the planned archetype to assess the most influential parameter. This helped to identify where further detailed data is required as well as evaluate the variability of the overall results, however, further detailed surveying is required to provide the bounds of the parameters and to provide realistic estimates of the uncertainties.
Further data gathering work, the employment of more sophisticated methods and sensitivity analysis to assess variability in results will help to provide a more accurate assessment of health and energy in Delhi housing. However, this paper offers a starting point to focus on further research and helps identify missing data gaps. This assessment is vital in paving the way for more research and detailed investigation of the connections between housing, health and energy. Similar work could be carried out for other locations, as a first step, to raise the agenda of housing as potential means to improve health and sustainable and support progress towards the SDGs.
Conclusions
We developed a framework for the assessment of housing energy use and health risks in low-income settings. The framework employed existing data sets and literature to assess the health risks and energy use across Delhi’s housing stock. The framework included the characterisation of the housing stock into archetypes, in this case, by settlement type, and then the assessment of these archetypes in regards to energy use and health risks, drawing on methods from the Built Environment and Public Health.
Despite limitations in data availability, our results show that energy use is nearly two times higher per occupant in planned dwellings compared to non-planned dwellings, as a result of higher ownership of A/C units. Health risks varied considerably across settlement types as a result of variations in the quality of housing, and the ability of occupants to modify their indoor environment. JJ clusters are most likely to be at a higher risk from a wide range of adverse health impacts compared to other settlement types. The greatest health risks, across all settlement types, were assessed to be from exposure to particulate matter, heat, and cold. We highlight the vital need for more data on this topic to enhance understanding of household energy use and health risks, which will help provide a more accurate understanding as well as support further research evaluating interventions.
This work forms a critical first step and can be used to develop guidelines for improving housing, helping to support pathways to an equitable, healthy, sustainable city. Further research should now be carried out to assess levels of exposure to the identified hazards and understand detailed energy use behaviour, as well as to assess intervention performance and trade-offs before implementation. The approach developed could be applied to other locations in India, South Asia and beyond to understand key priorities and interventions strategies that differ with varying housing and environmental risks.
Acknowledgments
Expert advice on Delhi housing was received from: Dr Renu Khosla and Siddharth Pandey, from the Centre for Urban and Regional Excellence, India; Swati Janu from microHomeSolutions, Delhi, and Anuj Komar Suni from the School of Planning and Architecture, Delhi.
The authors involved in this work were supported by multiple funding sources. We would like to acknowledge funding from the Engineering and Physical Sciences Research Council (EPSRC) for a Doctoral Training Grant (DTG), the European Union Seventh Framework Programme FP7/2007-2013 under grant agreement no. 265325 (“PURGE”), the UCL Chadwick Trust and the Wellcome Trust funded ‘Complex Urban Systems for Sustainability and Health’ (CUSSH) project - grant reference number 209387/Z/17/Z
Disclosure statement
No potential conflict of interest was reported by the authors.
Additional information
Funding
Notes on contributors
Jonathon Taylor
The authors that have contributed to this manuscript are part of a long-term collaboration (15 years+) between University College London (built environment) and the London School of Hygiene and Tropical Medicine (epidemiology), which has sought to understand the complex relationship between the built environment and human well-being. Through such collaborative research, we have developed a highly productive, multi-skilled team which has sought innovation and stakeholder participation in responding to the world’s urban health challenges. This collaboration has helped to articulate the multiple underpinning connections and opportunities for healthy sustainable development.
Notes
1. For example, if we assume average floor areas of 80, 40, 60 and 12 m2 for planned, urban village, unauthorised and JJ cluster dwellings respectively the annual energy use per unit area become 73, 81, 54, and 196kWh/m2. This suggests that the JJ clusters are least efficient, however, due to the very small floor area, this is a misleading result.
References
- Ahmad, S. and Choi, M.J., 2011. The context of uncontrolled urban settlements in Delhi. Asien: The German journal on contemporary Asia, 118, 75–90.
- Akhtar, R., 2007. Climate change and health and heat wave mortality in India. Global journal of environmental research, 57 (11), 51–57.
- Akpinar-Ferrand, E. and Singh, A., 2010. Modeling increased demand of energy for air conditioners and consequent CO2 emissions to minimize health risks due to climate change in India. Environmental science & policy, 13 (8), 702–712. doi:10.1016/j.envsci.2010.09.009.
- British StandardsInstitution, 2010. ISO 31010:2009 risk management: risk assessment techniques, London.
- Bureau of IndianStandards, 2005. National building code of India.
- Carbon Trust, 2011. Conversion factors.
- Chunekar, A., Varshney, S., and Dixit, S., 2016. Residential electricity consumption in India: what do we know? Prune.
- Mamta, G., Mahur, A.K., and Verma, K.D., 2012. Indoor radon levels in some dwellings surrounding the National Thermal Power Corporations (NTPCs), India. Advances in applied science research, 3 (3), 1262-1265. http://www.pelagiaresearchlibrary.com/advances-in-applied-science/vol3-iss3/AASR-2012-3-3-1262-1265.pdf.
- D’Sa, A. and Murthy, K.V.N., 2004. Report on the use of LPG as a domestic cooking fuel option in India, Bangalore.
- Das, P., et al., 2014. Using probabilistic sampling-based sensitivity analyses for indoor air quality modelling. Building and environment, August 78, 171–182. doi:10.1016/j.buildenv.2014.04.017.
- Davies, M. and Oreszczyn, T., 2012. The unintended consequences of decarbonising the built environment: A UK case study. Energy and buildings, March 46, 80–85. doi:10.1016/j.enbuild.2011.10.043.
- Defra, 2006. Climate change scenarios for India.
- Department For Communities and Local Government, 2006. Housing health and safety rating system.
- Dhiman, R.C., et al., 2010. Climate change and threat of vector-borne diseases in India: are we prepared? Parasitology research, March 106 (4), 763–773. doi:10.1007/s00436-010-1767-4.
- Dili, A.S., Naseer, M.A., and Varghese, T.Z., 2010. Thermal comfort study of Kerala traditional residential buildings based on questionnaire survey among occupants of traditional and modern buildings. Energy and buildings, November 42 (11), 2139–2150. doi:10.1016/j.enbuild.2010.07.004.
- Dukkipati, S., Iyer, R.K., and Sreenivas, A., 2014. An assessment of energy data management in India, Prune
- Ezeh, A., et al., 2017. The history, geography, and sociology of slums and the health problems of people who live in slums. The lancet, 389 (10068) Elsevier Ltd, 547–558. doi:10.1016/S0140-6736(16)31650-6.
- Firdaus, G. and Ahmad, A., 2010. Noise pollution and human health: a case study of Municipal Corporation of Delhi. Indoor and built environment, October 19 (6), 648–656. doi:10.1177/1420326X10370532.
- Gibson, M., et al., 2011. Housing and health inequalities: A synthesis of systematic reviews of interventions aimed at different pathways linking housing and health. Health & place, 17 (1), 175–184. doi:10.1016/j.healthplace.2010.09.011.
- Global Buildings Performance Network (GBPN), 2014. Residential buildings in India: energy use projections and savings potentials
- Goli, S., Arokiasamy, P., and Chattopadhayay, A., 2011. Living and health conditions of selected cities in India: setting priorities for the National Urban Health Mission. Cities, October 28 (5), 461–469. doi:10.1016/j.cities.2011.05.006.
- Government of India, 2011. Census of India 2011, Delhi
- Government of National Capital Territory of Delhi, 2008. Delhi Economic Survey, Delhi
- Government of National Capital Territory of Delhi, 2009. NSS 65th - housing conditions in Delhi
- Government of National Capital Territory of Delhi, 2012. Annual report on registration of births and deaths in Delhi.
- Government of National Capital Territory of Delhi, 2013. Delhi economic survey.
- Guha-Sapir, D., Below, R., and Hoyois, P., EM-DAT: international disaster database. Available from: www.emdat.be [Accessed 6 Nov 2015].
- Guttikunda, S.K. and Goel, R., 2013. Health impacts of particulate pollution in a megacity—Delhi, India. Environmental Development, December 6, 8–20. doi:10.1016/j.envdev.2012.12.002.
- Guttikunda, S.K. and Gurjar, B.R., 2012. Role of meteorology in seasonality of air pollution in megacity Delhi, India. Environmental monitoring and assessment, 184 (5), 3199–3211. doi:10.1007/s10661-011-2182-8.
- Haines, A., et al., 2009. Public health benefits of strategies to reduce greenhouse-gas emissions: overview and implications for policy makers. The lancet, December 374 (9707), 2104–2114. doi:10.1016/S0140-6736(09)61759-1.
- Haines, A., et al., 2013. Promoting health and advancing development through improved housing in low-income settings. Journal of urban health, 90 (5), 810–831.
- Hegde, L.S., 2010. Indoor air temperatures and energy use: A comparative field study of vernacular, conventional, and alternative-technology construction in India. Management of environmental quality, 19, 51–71. doi:10.1002/tqem.20262
- Howden-Chapman, P., et al., 2011. Improving health and energy efficiency through community-based housing interventions. International journal of public health, 56 (6), 583–588. doi:10.1007/s00038-011-0287-z.
- Howden-Chapman, P., et al., 2012. Health, well-being and housing. In: International encyclopedia of housing and home. Elsevier, 344–354. doi:10.1016/B978-0-08-047163-1.00021-7
- IEA, 2007. World Energy Outlook 2007: China and India Insights
- Indian Society of Heating Refrigerating and Air-Conditioning Engineers, 2005. New Delhi 421820: TM2 weather file.
- Indraganti, M., 2011. Thermal comfort in apartments in India: adaptive use of environmental controls and hindrances. Renewable energy, April 36 (4), 1182–1189. doi:10.1016/j.renene.2010.10.002.
- International Energy Agency, 2009. Energy balance For India - key statistics.
- Ishtiyaq, M. and Kumar, S., 2010. Distribution of Slums in the NCT of Delhi. The institute of town planners, India, 7 (3), 20–33.
- Ishtiyaq, M. and Kumar, S., 2011. Typology of informal settlements and distribution of slums in the NCT, Delhi. Journal of contemporary Indian studies: space and society, 1, 37–46.
- Jacobs, D.E., 2011. Housing-related health hazards: assessment and remediation, pp. 76–94.
- Kavgic, M., et al., 2010. A review of bottom-up building stock models for energy consumption in the residential sector. Building and environment, July. 45 (7), 1683–1697. doi:10.1016/j.buildenv.2010.01.021.
- Keall, M., et al., 2010. Assessing housing quality and its impact on health, safety and sustainability. Journal of epidemiology and community health, 64 (9), 765–771. doi:10.1136/jech.2009.100701.
- Khillare, P.S., Pandey, R., and Balachandran, S., 2004. Characterisation of indoor PM10 in residential areas of Delhi. Indoor and built environment, April 13 (2), 139–147. doi:10.1177/1420326X04041053.
- Kumar, A. and Suman, B.M., 2013. Experimental evaluation of insulation materials for walls and roofs and their impact on indoor thermal comfort under composite climate. Building and environment, October 59, 635–643. doi:10.1016/j.buildenv.2012.09.023.
- Kumar, P., 2001. Characterisation of indoor respirable dust in a locality of Delhi, India. Indoor and built environment, 10 (2), March 95–102. doi:10.1177/1420326X0101000205.
- Kumar, R., et al., 2015. Indoor air pollution and asthma in children at Delhi, India. Pneumonologia i alergologia polska, 83 (4), 275–282. doi:10.5603/PiAP.2015.0047.
- Kumar, S., 1998. India’s heat wave and rains result in massive death toll. The lancet, June. 351 (9119), 1869. doi:10.1016/S0140-6736(05)78823-1.
- Kumar Soni, A., 2011. Quality of life in an urban village.
- Lawrence, A.J., Masih, A., and Taneja, A., 2005. Indoor/outdoor relationships of carbon monoxide and oxides of nitrogen in domestic homes with roadside, urban and rural locations in a central Indian region. Indoor air, April 15 (2), 76–82. doi:10.1111/j.1600-0668.2004.00311.x.
- Li, Y., et al., 2007. Role of ventilation in airborne transmission of infectious agents in the built environment - a multidisciplinary systematic review. Indoor air, March 17 (1), 2–18. doi:10.1111/j.1600-0668.2006.00445.x.
- Mahadeva, M., 2006. Reforms in housing sector in India: impact on housing development and housing amenities. Habitat international, September 30 (3), 412–433. doi:10.1016/j.habitatint.2004.11.002.
- Massey, D., et al., 2009. Indoor/outdoor relationship of fine particles less than 2.5μm (PM2.5) in residential homes locations in central Indian region. Building and environment, October 44 (10), 2037–2045. doi:10.1016/j.buildenv.2009.02.010.
- Mastrucci, A. and Rao, N.D., 2017. Decent housing in the developing world: reducing life-cycle energy requirements. Energy and buildings, 152, 629–642. doi:10.1016/j.enbuild.2017.07.072
- McMichael, A.J., et al., 2008. International study of temperature, heat and urban mortality: the ‘ISOTHURM’ project. International journal of epidemiology, October 37 (5), 1121–1131. doi:10.1093/ije/dyn086.
- Milner, J., et al., 2014. Home energy efficiency and radon related risk of lung cancer: modelling study. BMJ, January 348, 1–12. doi:10.1136/bmj.f7493.
- Ministry of Environment and Forests Power Government of India, 2001.Delhi Urban Environment and Infrastructure Improvement Project (DUEII) - Delhi 21.
- Mitchell, M., 2010. Learning from Delhi; Dispersed initiatives in changing urban landscapes. Abingdon: Routledge.
- N. S. S. O.-M. of S. & P. I. Government of India, 2010a. Housing condition and amenities in India 2008-09- NSS 65th round.
- N. S. S. O.-M. of S. & P. I. Government of India, 2010b. Household consumption of various goods and services in India 2009-10- NSS 66th.
- Natarajan, R., et al., 2008. Use of vegetable oil as fuel to improve the efficiency of cooking stove. Renewable energy, November 33 (11), 2423–2427. doi:10.1016/j.renene.2008.01.022.
- Nix, E., et al., 2014. Modelling the disparities in energy consumption, indoor temperature, and PM2.5 exposure across Delhi’s housing stock. In: BSO14: Building simulation and optimization. London.
- Office of the Deputy Prime Minister, 2006. Housing Health and Safety Rating System (HHSRS): operating Guidance. London: Office of the Deputy Prime Minister.
- Pant, P., et al., 2015. Characterization of ambient PM2.5 at a pollution hotspot in New Delhi, India and inference of sources. Atmospheric environment, 109, 178–189. doi:10.1016/j.atmosenv.2015.02.074
- Praseeda, K.I., Reddy, B.V.V., and Mani, M., 2016. Embodied and operational energy of urban residential buildings in India. Energy and buildings, 110, 211–219. doi:10.1016/j.enbuild.2015.09.072
- Ramesh, T., Prakash, R., and Kumar Shukla, K., 2013. Life cycle energy analysis of a multifamily residential house: a case study in Indian context. Open journal of energy efficiency, 2 (1), 34–41. doi:10.4236/ojee.2013.21006.
- Ramesh, T., Prakash, R., and Shukla, K.K., 2010. Life cycle energy analysis of buildings: an overview. Energy and buildings, October 42 (10), 1592–1600. doi:10.1016/j.enbuild.2010.05.007.
- Ramesh, T., Prakash, R., and Shukla, K.K., 2012a. Life cycle approach in evaluating energy performance of residential buildings in Indian context. Energy and buildings, November 54, 259–265. doi:10.1016/j.enbuild.2012.07.016.
- Ramesh, T., Prakash, R., and Shukla, K.K., 2012b. Life cycle energy analysis of a residential building with different envelopes and climates in Indian context. Applied energy, January 89 (1), 193–202. doi:10.1016/j.apenergy.2011.05.054.
- Rani, M., Bonu, S., and Jha, P., 2003. Tobacco use in India: prevalence and predictors of smoking and chewing in a national cross sectional household survey. Tobacco control BMJ, December 12 (4), 4e– 4. doi:10.1136/tc.12.4.e4.
- Reddy, B.S. and Srinivas, T., 2009. Energy use in Indian household sector – an actor-oriented approach. Energy, August 34 (8), 992–1002. doi:10.1016/j.energy.2009.01.004.
- Rout, U.K., 2011. Prospects of India’s energy and emissions for a long time frame. Energy policy, September 39 (9), 5647–5663. doi:10.1016/j.enpol.2011.04.026.
- Scovronick, N. and Armstrong, B., 2012. The impact of housing type on temperature-related mortality in South Africa, 1996–2015. Environmental research, February 113, 46–51. doi:10.1016/j.envres.2012.01.004.
- Sharma, R., et al., 2011. Association between indoor fungi in Delhi homes and sensitization in children with respiratory allergy. Medical mycology: official publication of the international society for human and animal mycology, 50 (3), 281–290. doi:10.3109/13693786.2011.606850.
- Shrubsole, C., et al., 2014. 100 Unintended consequences of policies to improve the energy efficiency of the UK housing stock. Indoor and built environment, March 23 (3), 340–352. doi:10.1177/1420326X14524586.
- Singh, M.K., Mahapatra, S., and Atreya, S.K., 2010. Thermal performance study and evaluation of comfort temperatures in vernacular buildings of North-East India. Building and environment, February 45 (2), 320–329. doi:10.1016/j.buildenv.2009.06.009.
- Singh, P.K. and Dhiman, R.C., 2012. Climate change and human health: indian context. Journal of vector borne diseases, June 49 (2), 55–60.
- Sivak, M., 2009. Potential energy demand for cooling in the 50 largest metropolitan areas of the world: implications for developing countries. Energy policy, 37 (4), 1382–1384. doi:10.1016/j.enpol.2008.11.031.
- Sivam, A., 2003. Housing supply in Delhi. Cities, April 20 (2), 135–141. doi:10.1016/S0264-2751(02)00121-X.
- Sivam, A. and Karuppannan, S., 2002. Role of state and market in housing delivery for low-income groups in India. Journal of housing and the built environment, 17, 69–88. doi:10.1023/A:1014831817503
- Slezakova, K., et al., 2009. Influence of tobacco smoke on carcinogenic PAH composition in indoor PM10 and PM2.5. Atmospheric environment, December 43 (40), 6376–6382. doi:10.1016/j.atmosenv.2009.09.015.
- Smith, K.R., 2000. National burden of disease in India from indoor air pollution. Proceedings of the national academy of sciences of the United States of America, November 97 (24), 13286–13293. doi:10.1073/pnas.97.24.13286.
- Srivastava, A. and Majumdar, D., 2010. Emission inventory of evaporative emissions of VOCs in four metro cities in India. Environmental monitoring and assessment, 160 (1–4), 315–322. doi:10.1007/s10661-008-0697-4.
- Sverdlik, A., 2011. Ill-health and poverty: a literature review on health in informal settlements. Environment and urbanization, April 23 (1), 123–155. doi:10.1177/0956247811398604.
- Symonds, P., et al., 2019. Home energy efficiency and radon: an observational study. Indoor air, September 29 (5), 854–864. doi:10.1111/ina.12575.
- Talyan, V., Dahiya, R.P., and Sreekrishnan, T.R., 2008. State of municipal solid waste management in Delhi, the capital of India. Waste management, January 28 (7), 1276–1287. doi:10.1016/j.wasman.2007.05.017.
- TERI, 2007. Managing Power Demand, A case study of the residential sector in Delhi.
- TERI and Fraunhofer Institute for Building Physics, 2012. EnEff: resBuild India. Toolkit for energy efficient residential buildings in India.
- Thomson, H., Petticrew, M., and Morrison, D., 2001. Health effects of housing improvement: systematic review of intervention studies. BMJ, 323, 187–190. doi:10.1136/bmj.323.7306.187
- Thomson, H., et al., 2013. Housing improvements for health and associated socio-economic outcomes. Cochrane database of systematic reviews. John Wiley and Sons Ltd. doi:10.1002/14651858.CD008657.pub2.
- U.S. Energy Information Adminstration, 2018. India energy overview.
- UN Habitat, 2004. National trends in housing-production practices volume 1: India. 2004, ISBNE 92-1-131501.
- United Nations, 2017. World urbanisation prospects.
- United Nations Development Programme, 2015. Sustainable development goals.
- van Ruijven, B.J., et al., 2011. Model projections for household energy use in India. Energy policy, December 39 (12), 7747–7761. doi:10.1016/j.enpol.2011.09.021.
- WHO, 2006. Air quality guidelines, global update 2005.
- WHO, 2010. Selected pollutants.
- Wilkinson, P., et al., 2009. Public health benefits of strategies to reduce greenhouse-gas emissions: household energy. The lancet, 374 (9705), 1917–1929. doi:10.1016/S0140-6736(09)61713-X.
- Wilkinson, P., et al., 2007. Energy, energy efficiency, and the built environment. The lancet, September 370 (9593), 1175–1187. doi:10.1016/S0140-6736(07)61255-0.
Appendices
Appendix A.
Sensitivity analysis of energy use variables for the planned settlement archetype
A sensitivity analysis was conducted to understand the impact of input variables on energy use. This was carried out for the planned settlement archetype, which is most likely to use air conditioning. The input variables for power rating and hours of appliance use for each end-use were assumed to follow a normal distribution described by the mean and standard deviation. The mean for each variable was taken as the reported value in the literature, as described earlier in the paper. To account for the variation of each input, the standard deviation was calculated for each appliance from a range of ±20% the mean value. This was selected to account for a potentially wide variation in hours of use and appliance power ratings. Data is not currently available to describe the variation more accurately. The values used to describe each variable are presented in .
The probability distribution functions of each input variable were then used to generate a random sample to replicate the input variations expected. A sample size of 500 was used as this was deemed large enough so that sample mean does not change by more than 2%, as similar to carried out elsewhere (Das et al. Citation2014). This was done by generating a random number and then using the inverse cumulative distribution function to convert the generated random values into the domain of the input variables. The calculation for energy use was then completed for each permutation of the sample inputs.
To assess the effect of each parameter on the output, correlation-based and regression-based methods were used to measure the strength of the relationship between input and output variables. Pearson’s Product Moment Correlation Coefficient was used to measure the strength of linear correlation between each input and output variable. R2 coefficients were also calculated to assess the proportion of the variance that is predictable from the input variable. The coefficients for each variable are provided in .
Table A1. Sensitivity analysis input distribution and coefficients for energy use variables
Appendix B.
The following terms and descriptions were used by the authors to complete the health hazard risk analysis.
Definitions of terms:
Occurrence: This is an event or period of time exposing an individual to a hazard.
Likelihood: The probability of an occurrence that could cause harm and for this work it is to be assessed as the probability of an occurrence over a typical year.
Harm: An adverse physical or mental effect on the health of a person, both permanent and temporary.
Expected harm: The expected possible harm outcome, which could result from an occurrence.
Judging the likelihood of occurrence and expected harm:
For each given hazard the Likelihood of occurrence is assessed in regards to;
the average likelihood of the hazard exposure (outdoor conditions, expected indoor conditions etc.)
the housing conditions/modifiers which may increase or reduce the likelihood of occurrence
and the Expected harm is assessed in regards to;
the expected health effect (as described in the UKHHSRS) and health evidence for Delhi/India
the housing/settlement type conditions/modifiers or population demographics in given settlement type with may increase or mitigate the severity of the outcomes
Assessment categories:
Likelihood of occurrence is categorized as:
Low: chance of occurrence is low and not expected to occur over an annual period
Moderate: chance of occurrence is likely and expected to occur at least once during an annual period
High: chance occurrence is highly likely and expected to occur more than once or over several days during an annual period
Severe: chance occurrence is extremely likely and expected to occur for the majority of the annual period
Expected harm is categorized as:
Low: no or limited harm to health expected (such as broken finger; slight concussion; moderate cuts to face or body; regular coughs or colds)
Moderate: moderate harm to health expected (such as: hypertension; sleep disturbance; allergy; gastro-enteritis; diarrhoea; vomiting …)
High: high harm to health expected (such as: asthma, respiratory diseases, lead poisoning, loss of hand or foot, serious burns …)
Severe: severe harm to health expected (such as: death, lung cancer, permanent paralysis, permanent loss of consciousness; 80% burn injuries …)
Appendix C
details the evidence used to generate the estimated likelihood of occurrence and spread of harm based on an assessment of exposure risk, housing modifiers/conditions and available health evidence. The ratings based on the metric developed in section 2.3.1 are also included. The mode (Mo), median (Md), maximum (Mx) and minimum (Mn) values from the individual responses are detailed here for each entry as a measure of the variability in ‘expert opinion’.
Table C1. Exposure risk, housing modifiers/conditions and available health evidence used to estimate the likelihood of harm and expected harm