
 ?Mathematical formulae have been encoded as MathML and are displayed in this HTML version using MathJax in order to improve their display. Uncheck the box to turn MathJax off. This feature requires Javascript. Click on a formula to zoom.
ABSTRACT
Cities are socio-spatially patterned, yet few researchers have explored the association between walkability and house prices by neighbourhood socioeconomic disadvantage, highlighting issues about housing affordability, equity, and liveability. We aimed to determine whether walkability and house prices differed by neighbourhood socioeconomic disadvantage. To test this, we used linear regression models of house prices stratified by quintiles of neighbourhood socioeconomic disadvantage at the suburb level in metropolitan Melbourne, Australia on walkability and its components (street connectivity, dwelling density, and destination access), and public transit access. Walkability was positively associated with house prices. In the stratified regressions, destination accessibility was associated with higher house prices whilst having poor access to transit was negatively associated with house prices. The association between walkability and house prices was weakest for the most disadvantaged areas, suggesting that houses in these areas were more affordable due, in part, to a lack of amenity. Future planning could redress the relationship between walkability and house prices by making new areas walkable. Increasing densities in outer suburban areas would improve destination and transit access, and in established areas, inclusionary zoning policies could help ensure accessibility to social and affordable housing in amenity-rich areas redressing built environment inequities.
Introduction
Cities that are healthy, equitable and liveable are a global priority (United Nations Citation2016). Liveable cities are underpinned by walkable neighbourhoods (Hooper et al. Citation2015, Watts et al. Citation2015) that provide local access to public transit, public open spaces, employment, food, affordable housing, and social infrastructure (e.g. schools, healthcare, art galleries, museums) (Lowe et al. Citation2013, Badland et al. Citation2014, Davern et al. Citation2017). Walkable neighbourhoods are also characterized by a combination of urban form features including population density, street connectivity, and access to destinations or land use mix features. These features encourage healthy lifestyles that are associated with both improved health and cardiometabolic risk factors (Chandrabose et al. Citation2019) because they encourage physical activity through walking, cycling and active transit use (Sinnett and Williams Citation2020) while discouraging driving (Boulange et al. Citation2017).
City planning and design support active transit provision, accessibility, and use. Hence city planning is key for mitigating city-wide problems relating to transit provision and destination accessibility that can cause road congestion, forced car ownership, and inequities in local accessibility that can impact the cost of living (Currie and Senbergs Citation2007, Coulombel Citation2018). Consequently, liveable cities and walkable neighbourhoods are not only healthier, but can address concerns relating to inequity, sustainability, the environment, resilience, health and climate change through the way cities are planned and built for people (Pearce et al. Citation2007, Citation2010, Citation2011, United Nations Citation2016, Badland and Pearce Citation2019). Global agendas such as the United Nation’s Sustainable Development Goals, the UN-HABITAT’s New Urban Agenda (UN Habitat Citation2016, United Nations Citation2016), New Urbanism (Plaut and Boarnet Citation2003, Frank et al. Citation2005), and other approaches such as Complete Streets (Banerjee and Loukaitou-Sideris Citation2011, Hui et al. Citation2018, Jordan and Ivey Citation2021, National Complete Streets Coalition Citation2022), Healthy Streets (Plowden Citation2020, Healthy Streets Citation2022), Smart Growth (Daniels Citation2001, Song Citation2005) and SmartRoads (Delbosc et al. Citation2018) also advocate for the use of planning and infrastructure to support the delivery of healthy, liveable cities.
The features of liveable cities and walkable neighbourhoods also create the conditions for good health in places where people live, learn, work and play that are aligned with the Social Determinants of Health (WHO Commission on Social Determinants of Health and World Health Organization Citation2008). However, empirical studies have identified spatial disparities and inequitable distribution of the features of walkable neighbourhoods both within and between cities impacting housing affordability, health and economic outcomes and contributing to deprivation amplification in already disadvantaged communities (Macintyre Citation2007, Bartholomew and Ewing Citation2011, Pearce et al. Citation2011, Talen and Koschinsky Citation2013, Kenyon and Pearce Citation2019, Lowe et al. Citation2020, Sallis et al. Citation2020).
Inequity in the quality of built environments has also been identified through social and environmental justice movements (Sarokin and Schulkin Citation1994). The social justice movement relates to the civil rights movement of marginalized people seeking to be treated equally (Reisch Citation2002), whilst the environmental justice movement seeks to address the disproportionate co-location of polluting industries that harm health in vulnerable communities often defined by race, class or indigeneity (Maantay Citation2002, Middleton Citation2003, Mohai et al. Citation2009, Schlosberg and Carruthers Citation2010, Chakraborty et al. Citation2011, EOEEA Citation2022). Both movements support the right to a healthy environment (Pearce et al. Citation2010, Citation2011, Rosales et al. Citation2012), however more recently, environmental justice has been understood to be an urban issue within the remit of governments and policymakers to address (EOEEA Citation2022, US Environmental Protection Agency Citation2022).
In general, housing in amenity-rich walkable neighbourhoods command price premiums whilst houses located further away from established amenity rich areas are more affordable (Tu and Eppli Citation1999, Song and Knaap Citation2003, Citation2004, Matthews and Turnbull Citation2007, Bartholomew and Ewing Citation2011, Li et al. Citation2015, Kim and Bae Citation2020). However, as explained by Bartholomew and Ewing (Citation2011), these relationships are complex and there is not always consensus in the literature on the magnitude or direction of house prices in relation to individual built environment features related to walkability (Bartholomew and Ewing Citation2011). For example, access to transit increases accessibility and can lead to house price premiums with one study reporting price premiums between 6.4% and 45% (Cervero Citation2004). On the other hand, some studies find price discounts depending on the type of transit and property type in the analyses (e.g. commercial, residential and type of residential) (Bowes and Ihlanfeldt Citation2001, Bartholomew and Ewing Citation2011, Duncan Citation2011).
This lack of consensus highlights issues not only related to the social determinants of health and social and environmental justice but to housing affordability and equity that relate to the question of ‘Liveable for whom’? (Badland and Pearce Citation2019).
Hedonic pricing models are often used to measure the relationship between the built environment and house prices, since many aspects of the built environment cannot be easily traded in an open marketplace and therefore cannot be directly modelled using market prices. However, the hedonic pricing literature exploring the value of the built environment and specifically walkability, has largely ignored the role of socio-economic spatial patterning and stratification, relying instead on income or race to determine differing residential market segments (Nelson Citation1992, Song and Knaap Citation2003, Dong Citation2015, Bohman and Nilsson Citation2016, Forouhar and Hasankhani Citation2018, Bohman Citation2021). Thus, it is unclear whether house price premiums relating to the built environment and walkability are consistent or differ between advantaged and disadvantaged areas.
In testing the spatial aspect of the relationship between the built environment and house prices we hypothesised that price premiums and relationships commonly associated with walkable environments are also present in disadvantaged areas. With this approach we aimed to determine whether the spatial relationships that are associated with house prices affect housing affordability and by doing so, we seek to determine the extent to which this exacerbates housing unaffordability and inequities by excluding disadvantaged people from living in walkable neighbourhoods.
In the next section we review relevant literature on the spatial distribution of urban walkability and its relationship to health and hedonic pricing models respectively. A description of the data and modelling approach is then presented, followed by results, discussion and conclusions.
Literature review
Inequitable access to walkable neighbourhoods and relationship with health inequities
Inequitable access to walkable neighbourhoods may increase social gradients in health outcomes where physical inactivity, obesity, diabetes, and other non-communicable diseases are more prevalent in less walkable environments (Turrell et al. Citation2013, Badland and Pearce Citation2019). Evidence also suggests that living in low walkable areas can lead to deprivation amplification whereby poor access to key destinations exacerbates individual-level socio-economic disadvantage (Macintyre Citation2007). Indeed, a recent review argues that poor access to walkable neighbourhoods represents a triple jeopardy problem creating social, environmental and health disparities (Badland and Pearce Citation2019).
Yet despite policy and planning rhetoric about the need to build amenity rich walkable areas through initiatives such as 20-minute neighbourhoods (City of Portland Citation2009, Capasso Da Silva et al. Citation2020, Department of Environment, Land, Water and Planning, Victoria State Governmen Citation2019) or the 30-minute city (which also includes access to employment) (NSW Government Citation2018, Levinson Citation2019), walkability within cities is not ubiquitously nor equitably distributed (Arundel et al. Citation2017, Lowe et al. Citation2020). Similar to the international context (Fan et al. Citation2018, Sallis et al. Citation2020), many walkable neighbourhoods in Australia tend to be located in the inner city and more established areas, while affordable housing is built on the urban fringe, typically located in low walkable neighbourhoods with poor access to amenity and public transit (Arundel et al. Citation2017, Gunn et al. Citation2020). Even though research undertaken in multiple cities finds that many of the benefits of walkability and its features can be generalized across countries (Sallis et al. Citation2020), walkability within cities is context-specific and may vary by neighbourhood disadvantage. For example, Australian and New Zealand studies show that some disadvantaged neighbourhoods are highly walkable with greater access to transit and local destinations (Pearce et al. Citation2007, Turrell et al. Citation2013). Furthermore, research in the US finds that both advantaged and disadvantaged areas can be walkable (King and Clarke Citation2015) for a variety of reasons. For example, in the US, many inner-city areas once housed the working class whilst affluent households were able to reside in spacious middle and outer city areas (Carpenter and Peponis Citation2010, Ehrenhalt Citation2012). Further contributions to inner-city disadvantage in the US occurred through the White Flight, with white people relocating to the suburbs to avoid desegregated schools, leaving black and minority people behind (Zhang Citation2011, Gilderbloom et al. Citation2015). Although the reasons for relocation are complex and argued by some as an attempt to flee poverty (Jego and Roehner Citation2006), the spatial relationship between socio-economic status and walkability has shifted over time for other reasons including: changing preferences towards established and amenity-rich areas; a shift away from manufacturing to knowledge-based jobs requiring face-to-face interaction (Wilson Citation2015, Morisson and Bevilacqua Citation2019); and, gentrification (Shaw Citation2008). Gentrification is the process whereby wealthy people move to desirable locations improving area-based amenity and causing increases in rent and subsequently displacing disadvantaged people (Shaw Citation2008, Ehrenhalt Citation2012). Hence, the understanding of what is affordable and ‘Liveable for whom?’ in relation to walkability within a city remains unclear.
Hedonic pricing models
Overview
One way of valuing environmental features such as walkability is to use hedonic pricing models. These models adopt a revealed preference approach using traded house prices as the key outcome to value environmental features that are difficult to evaluate because they are not commonly traded in an open marketplace (Lancaster Citation1966, Rosen Citation1974, Bartholomew and Ewing Citation2011). Hedonic pricing models are regressions that use independent variables to account for structural, locational, and environmental features related to houses and the environments where they are located.
Hedonic pricing models have been used extensively to value aspects of urban form that create walkable, liveable, and sustainable communities. Studies have included: walkability using walk score (Pivo and Fisher Citation2011, Rauterkus and Miller Citation2011, Li et al. Citation2015); urban design features using space syntax (Matthews and Turnbull Citation2007, Xiao et al. Citation2016); new urbanism principles (Tu and Eppli Citation1999, Plaut and Boarnet Citation2003, Song and Knaap Citation2003, Citation2004, Krause and Bitter Citation2012, Sohn et al. Citation2012); transit accessibility and transit orientated design (McDonald and Osuji Citation1995, Ryan Citation1999, Cervero and Duncan Citation2002, McMillen and McDonald Citation2004, Hess and Almeida Citation2007, Duncan Citation2011, Chatman et al. Citation2012, Kay et al. Citation2014, Bohman and Nilsson Citation2016, Higgins and Kanaroglou Citation2016, Forouhar and Hasankhani Citation2018, Filippova and Sheng Citation2020, Bohman Citation2021) and parks, open spaces and trees (Luttik Citation2000, Payton et al. Citation2008, Sander et al. Citation2010, McCord et al. Citation2014, Pandit et al. Citation2014, Tapsuwan and Polyakov Citation2016, Donovan et al. Citation2019). Hedonic modelling has also been used to value broad urban planning issues including relationships with landfills and toxic waste sites (Michaels and Smith Citation1990, Kohlhase Citation1991, Thayer et al. Citation1992, Arimah and Adinnu Citation1995); road and aircraft noise (Nelson Citation1982, Citation2008, Cohen and Coughlin Citation2008, Wen et al. Citation2020) and the urban growth boundary (Knaap Citation1985, Phillips and Goodstein Citation2000, Jun Citation2006, Cho et al. Citation2008, Grout et al. Citation2011, Mathur Citation2019). However, none of these studies consider area-level socio-economic disadvantage explicitly. In the sections below we review the literature most closely related to the features of walkability relevant for this study.
Using hedonic models to value walkability using Walk ScoreTM and Space Syntax
Many researchers have explored the association of individual walkability components on house prices (Li and Brown Citation1980, Song and Knaap Citation2003, Matthews and Turnbull Citation2007, Choi et al. Citation2021), although some have recognized the synergy of using composite indices to explore the value of walkability (Pivo and Fisher Citation2011, Rauterkus and Miller Citation2011, Li et al. Citation2015). Walk ScoreTM, provides a convenient measure of street connectivity and access to destinations rated using a point system based on distance in Google maps (Pivo and Fisher Citation2011). Using national US property data for commercial buildings including offices, apartments, retail, and industrial properties, Pivo and Fisher (Citation2011), found a positive relationship and price premium of between 1 and 9% between the walkability of an area as measured by Walk ScoreTM and commercial buildings (offices, apartments and retail properties) but not for industrial buildings. In a similar study using data from Jefferson County, Alabama, US, Rauterkus and Miller (Citation2011) stratified their sample of residential houses into two groups according to Walk ScoreTM. Using Ordinary Least Squares (OLS) regressions they found that walkable areas with Walk ScoresTM of 24 and above were positively associated with house prices, whilst the least walkable areas were negatively associated. This suggested that house buyers were prepared to pay a premium for walkable areas (Rauterkus and Miller Citation2011). Similar findings were observed by Li et al. (Citation2015), in a study in Austin, Texas, US (Li et al. Citation2015). Using Cliff-Ord Spatial Regressions that correct for spatial autocorrelation, they investigated the relationship between single-family house prices and the Street Smart Walk ScoreTM that includes a measure for street connectivity. They found a positive price premium associated with the walkability of an area that was not present in car-dependent locations where the Street Smart Walk ScoreTM was low. In a more recent study undertaken using data from Calgary, Canada, Choi et al. (Citation2021) classified houses as being located in very walkable areas if their WalkScoreTM was greater than 70. Their analysis explored the interaction between transit accessibility and walkability and found that areas that are both walkable with good access to transit led to house price premiums (Choi et al. Citation2021).
Studies in the US (Matthews and Turnbull Citation2007) and China (Xiao et al. Citation2016), have valued house prices based on street connectivity using Space Syntax. Both studies found that street connectivity was positively associated with house prices in general. However, Matthews and Turnbull’s (2007) study in two different areas (one with gridded streets, and the other with a curvilinear street pattern) in King County, Washington in the US also found a negative association. They argued that opposing coefficient signs on their space syntax measures were representative of differing market segments. For the more established case study area with a gridded street pattern, street connectivity and access to retail was positively associated with house prices. However, in the case study area with a curvilinear street pattern, house prices were negatively associated with street connectivity. The authors reasoned that residents valued the extra space and privacy afforded to them through the curvilinear structure of the streets (Matthews and Turnbull Citation2007).
Using hedonic models to value New Urbanism
New Urbanism is an environmental movement that promotes walkable neighbourhoods. In New Urbanist neighbourhoods there are higher densities, a greater mix of land uses, more public open space, well-connected streets and walkable street networks with access to local employment (Tu and Eppli Citation1999). Studies seeking to value New Urbanism have typically hypothesised that communities built on New Urbanism principles will have higher property values (Kim and Bae Citation2020) with several publications supporting this contention (Tu and Eppli Citation1999, Citation2001, Plaut and Boarnet Citation2003, Sohn et al. Citation2012). Briefly, several analyses have used binary indicators to differentiate New Urbanist neighbourhoods from other types of conventional developments in the US and Israel (Tu and Eppli Citation1999, Citation2001, Plaut and Boarnet Citation2003). Song and Knaap (Citation2003) also found support for this hypothesis using data from Washington County, US. However, they extended previous research by using specific measures of the built environment. These included street connectivity, land use mix, population and housing density and accessibility measured as distance to buses, park, commercial areas and light rail transit and measures of walkability defined as the proportion of houses within a quarter miles distance of commercial uses. They found a price premium of 16% for houses located in New Urbanist neighbourhoods (Song and Knaap Citation2003). Song and Knaap (Citation2004) using the same dataset, explored in greater detail how types of mixed land uses were associated with house prices. Their findings indicate that areas with access to parks and more open space commanded a price premium. Furthermore, houses with access to local shops had an even greater price premium if shops were located within a walkable distance (Song and Knaap Citation2004).
Using house prices to value access to transit
Accessible transit is a social determinant of health (WHO Commission on Social Determinants of Health and World Health Organization Citation2008) and a key component of an equitable and walkable neighbourhood. Transit provides access to employment, education and essential services, and by bridging the distance to key destinations, transit access increases the value of land (Bartholomew and Ewing Citation2011, Pendall et al. Citation2016). Several studies have used hedonic pricing models to measure the value of access to transit with varying results (Bartholomew and Ewing Citation2011, Higgins and Kanaroglou Citation2016). Some authors support the hypothesis that there is a price premium associated with transit access (Nelson Citation1982, Citation1999, Nelson and McCleskey Citation1990, Hess and Almeida Citation2007, Higgins and Kanaroglou Citation2016, Filippova and Sheng Citation2020), conversely, others find a discount associated with close proximity of transit and transit-oriented development (Landis et al. Citation1994, Bowes and Ihlanfeldt Citation2001). Other more nuanced findings show that a discount in house prices is typical for single-use residential areas, whereas for mixed use and high-density areas with proximate transit, there are price premiums (Atkinson-Palombo Citation2010) although authors report that higher density areas can lead to price discounts at the neighbourhood level due to a disamenity effect (Bohman and Nilsson Citation2016). Furthermore, one author found price premiums in lower-income neighbourhoods and discounts in higher-income neighbourhoods when evaluating access to heavy rail in the US (Nelson Citation1992). In their review, Bartholomew and Ewing (Citation2011) suggest that price premiums may also vary according to distance from central areas, suggesting the presence of spatial and contextual relationships (Bartholomew and Ewing Citation2011).
More recent studies point to a relationship across residential market segments commonly differentiated using income. In varying contexts, several authors find support for price premiums in low-income neighbourhoods around transit. Using data from Tehran, Iran, Forouhar and Hasankhani (Citation2018) found price premiums for residential properties located close to transit in low-income neighbourhoods. Additional findings from this work suggest that amenity improvements including new shops and services, as opposed to unplanned commercialization, resulted in price premiums around transit stations. A study by Bohman and Nilsson (Citation2016) found support for price premiums in low-income neighbourhoods using data from nine different areas in the US. A more recent study by Bohman (Citation2021) using data from Malmö, Sweden also highlights the relationship between different market segments based on income: low-income areas around transit were found to have greater price premiums compared to higher-income areas around transit stations indicating a higher level of value attributable to transit for low-income residents living in these areas.
These studies also highlight that context matters. The combination of differing residential market segments, different built environments with varying levels of amenity (including transit) and their spatial distribution across urban environments can impact house prices in varying ways as discussed throughout this literature review (Bartholomew and Ewing Citation2011, Duncan Citation2011). However, income is not a complete measure of disadvantage and these studies are limited because of their exclusive focus on areas surrounding transit.
Key research gaps and motivation
Despite insights gained on the spatial relationship between house prices and the built environment as reviewed in the previous sections, the extent to which walkable areas are found in disadvantaged areas and whether housing in these areas command a higher price, is yet to be examined. This is a significant gap in the literature consistent with Badland and Pearce’s question about ‘Liveable for whom?,’ which questions whether liveable neighbourhoods are equitably distributed (Badland and Pearce Citation2019).
In Australia, area-based socio-economic disadvantage is measured using the Socio-Economic Indexes for Areas (SEIFA), which assesses the relative socio-economic advantage and disadvantage of areas, by ranking them by socio-economic characteristics of residents along with some aspects of their environment (ABS Citation2011). Other studies internationally have instead used area-level measures based on race or income (Li and Brown Citation1980, Song and Knaap Citation2003, Dong Citation2015, Bohman and Nilsson Citation2016, Forouhar and Hasankhani Citation2018, Bohman Citation2021).
The research here uses a large city-wide dataset and detailed built environment data relating to each home location in contrast with previous studies which typically use smaller datasets (Tu and Eppli Citation1999, Citation2001, Song and Knaap Citation2004, Pivo and Fisher Citation2011, Rauterkus and Miller Citation2011, Kim and Bae Citation2020), that are constrained to either specific case study areas (Tu and Eppli Citation1999, Plaut and Boarnet Citation2003, Matthews and Turnbull Citation2007, Forouhar and Hasankhani Citation2018, Bohman Citation2021) or to segments of one city (Song and Knaap Citation2003, Citation2004, Xiao et al. Citation2016) with the built environment data measured with administrative boundaries (Song and Knaap Citation2003, Matthews and Turnbull Citation2007) which may not represent the built environment or walkability adequately (Brownson et al. Citation2009, Clark and Scott Citation2014).
The aim of this paper is to determine whether relationships between walkability and house prices differ by neighbourhood socioeconomic disadvantage using a city-wide dataset from Greater Melbourne, Australia and location specific house prices and walkability measures.
Method
Datasets and sample
Housing data
Housing data provided by the Australian Property Monitors (APM) were made available through the Australian Urban Research Infrastructure Network (AURIN) workbench (Sinnott et al. Citation2015). The APM housing data includes individual sales records for residential properties. The data used in this study contained 116,776 single-family homes sold between January 2014 and June 2015 within Greater Melbourne, the coastal capital of the south-eastern Australian state of Victoria with an area of approximately 10,000 km2 and a population of about 4.53 million people in 2014–2015 (ABS Citation2016, Citation2021). The APM housing data included information about housing location (e.g. property longitude and latitude) and housing characteristics such as number of bedrooms, number of bathrooms, number of car spaces and whether properties have a garage, pool, air-conditioning, and a separate dining room as presented in the Supplementary Material.
Built environment data
Built environment data were derived from the location data generated by previous liveability research (Arundel et al. Citation2017, Higgs et al. Citation2019) in which built environment measures including a continuous index of walkability, dwelling density, a daily living destination score and distance to frequent public transit stops were calculated using 2018 Geocoded National Address File data points (GNAF) (PSMA Citation2018) as proxies for residential location. This dataset contained 1,740,161 GNAF data points across Greater Melbourne.
Analytic sample
The housing characteristics data were then joined to the built environment data using Near Analysis, ArcGIS v10.6.1 using the longitude and latitudes recorded for the 116,776 single-family homes in the APM dataset joined with the GNAF data points for Greater Melbourne. A series of procedures were taken to clean up the data: first, 1,311 records with no price information were removed. Second, 8,299 records were deleted due to missing longitude and latitude values for these properties. Third, 1,080 property records with the sale price higher than $2,975,000 (the 99 percentile of the sample) or lower than $63,000 (the 1 percentile of the sample) were excluded as outliers (Dong Citation2015, Li et al. Citation2015). Finally, 1,312 property records to which the distance from property location to the closest GNAF data point was higher than 100 m were also eliminated to improve the accuracy in matching residential houses to their built environments. The final sample included 104,778 property records.
Measurements
Outcome measure
House prices ranged from $63,000 to $2,975,000 and was the outcome measure. In previous studies of housing value (Song and Knaap Citation2004, Li et al. Citation2015), house price has been measured as a log-transformed variable. However, in this study, we used raw price values scaled by 1000. There were two reasons for this: first, we had a large sample size, which justifies the assumption of non-normally distributed dependent variable in linear regressions (Lumley et al. Citation2002). Second, using the scaled raw house price values assisted with the interpretation of the results.
Structural characteristics of houses
Housing features used in the analysis included number of bedrooms, bathrooms, and car parks, whether the property had a study, separate dining room, family room, sunroom, rumpus, heating, air-conditioning, ensuite, garage, or pool. Additional binary indicators measuring time in quarters commencing from the first quarter of 2014 until the second quarter of 2015 were included to account for any cycles or trends in house prices (Song and Knaap Citation2003, Dong Citation2015, Li et al. Citation2015). Descriptive statistics for house features are contained in the Supplementary Material.
Neighbourhood disadvantage
The Australian Bureau of Statistics (ABS) Index of Relative Socioeconomic Disadvantage (IRSD) was used to measure area-level socio-economic characteristics (ABS Citation2011). The IRSD score uses 17 variables to reflect area level socio-economic disadvantage. Included variables are: education, occupation, income, unemployment, household structure, and household tenure, among others (ABS Citation2011). IRSD scores from 2011 were first obtained at suburb level from the ABS website, and they were joined to the APM housing data based on suburb name (e.g. the same IRSD score was allocated to properties within same suburb). The derived IRSD scores were then grouped into quintiles, with Q5 denoting the least disadvantaged areas and Q1 denoting the most disadvantaged areas.
Built environment measures
Built environment measures were adopted from a previously conducted liveability study (Arundel et al. Citation2017, Higgs et al. Citation2019). A continuous index of walkability, street connectivity, dwelling density, daily living score and distance to frequent transit stops were used as built environment measures in this analysis. . presents variable definitions as well as brief explanations about their calculation. Further descriptions are detailed in Higgs et al. (Citation2019).
Table 1. Built environment variables description and calculation methods.
Data analysis
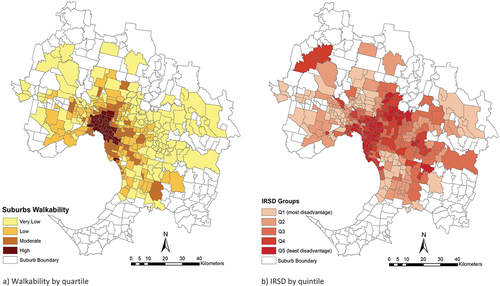
Descriptive statistics were estimated for the full dataset across the Greater Melbourne area and Pearson correlations and Variance Inflation Factors were estimated between all the built environment and house price variables. The descriptive statistics were then estimated using stratification according to the five quintiles of disadvantage of Q1 – Q5, where Q1 represents the most disadvantaged and Q5 represents the least disadvantaged areas of the Greater Melbourne area. Maps of walkability and the IRSD quintiles were produced to show the spatial relationship between walkability and socio-economic disadvantage.
Three sets of multiple linear regression models were estimated. The first regression, M1, used the composite walkability index (Frank et al. Citation2005). This index has been extensively used throughout the built environment literature and is a commonly used predictor of walking behaviour (Chandrabose et al. Citation2019, Higgs et al. Citation2019). However, a shortcoming of using composite indexes is that they may obscure relationships with the underlying built environment variables from which they are composed. To overcome this, model M2 uses the components of the walkability index of dwelling density, street connectivity and the daily living score as defined in . The final model, M3, included distance to frequent public transit stops in addition to the components of the walkability index since access to public transit is an important component of both the walkability and liveability of an area (Bartholomew and Ewing Citation2011, Higgs et al. Citation2019). Models M1-M3 were separately specified for each of the IRSD quintiles and were estimated with robust standard errors to accommodate heteroscedasticity that is commonly found in pricing data. Prior to estimating the stratified regressions, we tested for differences in disadvantage by walkability by including an interaction term between our composite walkability index and our quintiles of disadvantage in our M1 model and using a Likelihood-Ratio (LR) test with model M1.
To understand the association between walkability and house prices by disadvantage, we used the M1 model results estimated for each IRSD quintile to calculate a value for a typical house, defined using the most common characteristics of houses in Greater Melbourne. We then estimated quartiles of walkability across Melbourne by disadvantage to understand the range of values that walkability can add to the price of a typical house in each quintile. This analysis aims to determine whether walkability adds a price premium or discount according to levels of walkability by disadvantage. In doing this we aim to provide information on the relationship between walkability and housing affordability across the quintiles of disadvantage.
Results
Descriptive results and mapping
Pearson correlations and Variance Inflation Factors are presented in the Supplementary Material and indicated that multicollinearity was not present in the dataset. . presents descriptive statistics showing the house price and walkability features of Melbourne overall, and by disadvantage. For the house price data, there was a clear increasing trend and inverse relationship with disadvantage: house prices were $428,000 (SD: 144,800) in Q1 on average increasing to an average of $1,039,700 (SD: 580,000) in Q5. Similarly, walkability, dwelling density, and the daily living score all generally increased in magnitude as disadvantage decreased.
Table 2. Built environment characteristics of the Greater Melbourne area stratified by quintiles of socio-economic disadvantage.
Average distances to frequent transit stops were shorter in less disadvantaged areas, however, the relationship was not linear: distances to frequent transit stops were longer and more variable as disadvantage increased.
shows the spatial distribution of walkability (Panel A) and disadvantage (Panel B) across the Greater Melbourne area by suburb. As illustrated, walkability was higher in the central, more established areas of the city. Some socio-economically advantaged areas follow the train lines toward the south eastern section of the city (Giles-Corti et al. Citation2014). Area-level disadvantage varied across the city, but as can be seen in the maps, the more established walkable inner-city areas tended to have lower disadvantage.
Figure 1. Walkability and socio-economic disadvantage across the Greater Melbourne area.
Hedonic regression models
The results of our LR test for differences in walkability by quintiles of disadvantage are presented in the Supplementary Material. The LR test result was significant and indicated the need to stratify the regressions by disadvantage. . presents the association between walkability (M1), its components (i.e. dwelling density, street connectivity and daily living score) (M2) and distance to frequent public transit (M3) and house prices, stratified by quintiles of disadvantage. The full set of coefficient estimates for these models including house characteristics and seasonal dummies are provided in the Supplementary Material, with all estimated coefficients found to be consistent across models for each stratum in terms of their directions and significance.
Table 3. Linear regression model results stratified by quintiles of socio-economic disadvantage1.
The M1 models consistently showed that walkability is positively and significantly associated with house prices regardless of the level of disadvantage. However, in the most socio-economically disadvantaged Q1 areas, the association with walkability was considerably smaller compared with Q4 areas which had the largest association with walkability. Holding all else constant, this finding suggests that house prices in the most disadvantaged areas will increase by approximately $11,420 for each unit increase in walkability; compared with $37,910 for Q4 disadvantaged areas.
Residences located near daily living destinations had the greatest association with house prices in most areas of the city. The models showed that the daily living score was positively and significantly associated with house prices except in Q2 areas, where the daily living score was not significant. House prices can be expected to increase by $157,350 for every additional daily living destination present in the least disadvantaged Q5 areas, compared to $32,130 for houses in the most disadvantaged Q1 areas.
For the five stratified M2 and M3 models, higher dwelling density was consistently found to be positively and significantly associated with house prices. It had the greatest association in Q1, followed by Q4, with lower values in Q2 and Q3, and the lowest values in Q5.
Street connectivity was generally significant albeit relatively small in magnitude when compared to the average price of a house. The association between street connectivity and house prices varied by disadvantage with negative associations in Q1 and Q3; but positive ones in Q2, Q4 and Q5.
In the M3 models, distance to frequent transit stops had a significantly negative association with house prices across all models by disadvantage. This suggests a reduction in house prices the further they are away from frequent public transit. The relatively small association between distance to frequent transit stops and house prices for the most disadvantaged Q1 areas suggests that access to public transit does not appear to have a large association with house prices in these areas.
The value of walkability
. presents results for the price premium or discount associated with quartiles of walkability stratified by area level disadvantage. The table shows that the value of walkability differed for each quintile of disadvantage. For example, in the most disadvantaged Q1 areas, the composite walkability index ranged from −1.67 to 1.11 from very low to high walkable areas, whereas the range was −0.77 to 6.58 for the least disadvantaged Q5 areas.
Table 4. Walkability premium/discount and percentage of change in price.
The last column in ., presents the premium or discount for each quartile of walkability by disadvantage. In relative terms, in the least walkable areas (i.e. in the lowest quartile), there was a consistent price discount for housing. For Q5 this discount was negligible at 1.19%, however for the remaining strata, the percentage discount ranged from approximately 5.00% (in Q1, Q3, Q4) to 11.42% (Q2). As can be seen, the largest price premiums occurred in the most walkable areas (i.e. the highest quartile). The price premium in Q1 for highly walkable areas was only 3.07%. However, for the three middle quintiles, Q2-Q4, the price premiums were highest between approximately 17.00% (Q2, Q3) and 20.25% (Q4), while for Q5 the price premium was 9.13%.
Discussion
This study examined the association between walkability and house prices and whether it differed by area-level neighbourhood socio-economic disadvantage.
We found an inverse relationship between house prices and disadvantage, walkability, and its components of dwelling density, street connectivity and daily living destinations, which all increased as disadvantage decreased. Relationships with transit accessibility were more complex and did not have a clear trend, however, generally there was a negative association between distance to transit and house prices. Consistent with our previous research of Australian capital cities (Arundel et al. Citation2017, Lowe et al. Citation2020), we found spatial patterning in walkability across the metropolitan Melbourne area, with older, more established areas generally in the highest quartile of walkability. We also confirmed that outer metropolitan areas were generally more disadvantaged compared with inner city areas. The patterning of disadvantage did not spatially correlate with walkability. This is because there are areas within metropolitan Melbourne that are walkable yet disadvantaged and vice versa.
Consistent with studies on house prices in neighbourhoods established using New Urbanist principles, our models showed a consistently positive association between walkability and house prices. Highly walkable areas in Melbourne located in the least disadvantaged areas commanded price premiums of up to 20%, whereas in the most disadvantaged areas with low walkability there was a price discount of less than 5%. In their analysis stratified by levels of walkability, Rauterkus and Miller (Citation2011) found that more walkable areas had positive associations with house prices, while less walkable and more car dependent areas had negative associations with house prices. Furthermore, the study by Choi et al. (Citation2021) found that areas that are both walkable with good access to transit were also positively associated with house prices. Our results support these findings overall, however, the association between house prices and walkability varies by area-level disadvantage in metropolitan Melbourne: walkability had a smaller association in more disadvantaged communities, which are typically located on the urban fringe and are less walkable with fewer destinations and poorer access to transit (Currie and Senbergs Citation2007, Saberi et al. Citation2017, Smith et al. Citation2021).
By estimating hedonic pricing models using the components of walkability, we uncovered more nuanced results than found in previous studies. Importantly, we found that the largest association on house prices came from access to local destinations. For the least disadvantaged areas, the daily living score increased the price of houses by as much as $157,350 for each additional local destination present, while in the most disadvantaged areas it was $32,130. Destinations provide the impetus for making trips by active transit (Boulange et al. Citation2017) and have been shown to be associated with physical and mental health (Davern et al. Citation2017, Gunn et al. Citation2017). A key finding of this study is that access to daily living destinations was the main driver for house price premiums. Findings from a study in King County, Washington also found a positive price premium associated with proximity to retail (Matthews and Turnbull Citation2007). In the Australian context, two thirds of residents of new housing developments would prefer to live near shops and services (Hooper et al. Citation2020), however, not all areas have equitable access (Davern et al. Citation2017, Gunn et al. Citation2017).
Dwelling density also had a consistently positive association with house prices albeit more modest in magnitude. In high-density areas, there tended to be more daily living destinations. US research has produced mixed findings on the association of density with house prices (Li and Brown Citation1980, Song and Knaap Citation2003, Matthews and Turnbull Citation2007). Li and Brown (Citation1980) did not find any significant results in the Boston metropolitan area, whilst Song and Knaap (Citation2003) found negative associations for their density variables suggestive of a disamenity affect or preference for lower density neighbourhoods in Portland, Oregon (Mingche and Brown Citation1980, Song and Knaap Citation2003). In contrast to this, Matthews and Turnbull (Citation2007) found both positive and negative associations between density and house prices relating to their two different case study areas in King County, Washington. For their older and more walkable study area, they found density had a positive association with house prices, while in the more car-oriented curvilinear study area they found a negative association with house prices.
Although street connectivity was found to be significantly associated with house prices, in this study, its magnitude was modest and variable across the stratum of neighbourhood disadvantage. For example, we found negative associations with house prices in more disadvantaged neighbourhoods, and positive associations in less disadvantaged neighbourhoods. Rauterkus and Miller (Citation2011) and Li et al. (Citation2015) also found inconsistent results for walkability and street connectivity (Rauterkus and Miller Citation2011, Li et al. Citation2015). Melbourne has a strong grid structure in the inner and middle suburbs (Gunn et al. Citation2017) and this may also contribute to the complexity of the findings for street connectivity when measured according to disadvantage. Matthews and Turnbull (Citation2007) also found complex relationships with street connectivity in their study of a walkable area and a car-oriented area in King County, Washington, US (Matthews and Turnbull Citation2007). They interpreted this as being representative of differing preferences where some home buyers have a preference for car-oriented areas over walkable ones (and vice-versa), leading to negative (positive) associations between walkability variables such as street connectivity and density and house prices (Matthews and Turnbull Citation2007).
Poor access to transit was negatively associated with house prices, and this association tended to be stronger in the least disadvantaged areas (Nelson Citation1992, Hess and Almeida Citation2007, Bartholomew and Ewing Citation2011). For disadvantaged areas, the association of transit access with house prices was weak. This result may be due to a general lack of transit access in the outer suburbs of metropolitan Melbourne (Lowe et al. Citation2020), home to more disadvantaged households. The reduction in house prices due to a lack of transit may make houses appear to be more affordable. However, some authors suggest that buyers fail to factor in transit costs into the cost of living when purchasing a new home (Smith et al. Citation2021). Our findings partially support this due to the weak negative association between distance to transit and house prices. The reduction in house prices in the most disadvantaged areas increases as distance to frequent public transit increases (Chatman and Voorhoeve Citation2010, Smart and Klein Citation2018, Smith et al. Citation2021). This implies that houses in these areas, typically located on the urban fringe, are more affordable since these areas do not have proximate access to transit (Gunn et al. Citation2020, Lowe et al. Citation2020).
Overall, our findings of a price premium for housing in higher density mixed use developments is consistent with findings of housing designed according to New Urbanism principles (Tu and Eppli Citation2001, Song and Knaap Citation2003, Citation2004, Kim and Bae Citation2020). However, a primary question of interest for this paper, was whether designing walkable neighbourhoods, which are consistently found to be health-promoting, have price premiums that potentially exclude more disadvantaged households. Hence, we examined the price of a typical house by disadvantage strata, and we examined whether walkability induced a price premium or discount. Importantly, the results showed a consistent discount for houses in the least walkable areas by disadvantage. In contrast to this, houses in the highest quartile of walkability by disadvantage exhibited a price premium albeit modest for the most disadvantaged strata, where the price differential due to walkability was relatively small. This suggests that in general, walkability does not have a large association with house prices in disadvantaged neighbourhoods. This is also supported by the general lack of walkability in these areas, as evidenced by the reduced range in the quartiles of walkability. As expected, the results showed a consistent discount for houses in the least walkable areas irrespective of socio-economic disadvantage strata.
Implications of results in terms of ‘Liveable for whom?’
Our results are similar to those from other authors who have found price premiums (discounts) in more (less) walkable areas (Pivo and Fisher Citation2011, Rauterkus and Miller Citation2011, Li et al. Citation2015), however these authors did not stratify their results by socio-economic disadvantage, a key innovation of the research here. We found the relationship between house prices and walkability by disadvantage persisted regardless of the level of disadvantage, however for the two most disadvantaged quintiles the price premiums were modest.
One anomaly was found for the association of the daily living score. Access to daily living destinations did not have a significant association with house prices for the second most disadvantaged areas, whereas for the least disadvantaged areas, this variable was found to have the largest significant association with house prices.
Melbourne and Sydney are known for their lack of housing affordability (Corozzi et al. Citation2020) and as demonstrated here, houses on the urban fringe in more disadvantaged areas cost less in relative terms than those in more advantaged, amenity rich, established areas. Housing affordability, employment and transit access as key Social Determinants of Health and components of liveability have an important role to play in redressing the socio-spatial inequity and the social gradient present in cities such as Melbourne (Arundel et al. Citation2017, Badland and Pearce Citation2019). However, we found that poor access to transit reduces house prices considerably across the city but only marginally in the most disadvantaged areas. This does not mean that access to transit is unimportant in disadvantaged areas. In the Australian context, it more likely suggests that it is not factored into the decision-making process for those seeking affordable houses, since house buyers do not typically factor in transit costs into the cost of living, as discussed in the previous section (Smith et al. Citation2021). Furthermore, our findings differ to those from other authors who have found positive price premiums in lower-income neighbourhoods surrounding transit (Bohman and Nilsson Citation2016, Forouhar and Hasankhani Citation2018, Bohman Citation2021), however these studies focused exclusively on the area surrounding transit and did not factor in transit frequency, as our measure does.
The consequence of the spatial inequity in access to transit and destinations exacerbates socio-spatial inequity and increases housing affordability stress placing financial pressures on those seeking affordable housing (Dodson and Sipe Citation2008). Indeed, some authors have argued for ubiquitous access to transit (Mees Citation2009), whilst others have found increased- and forced-car ownership and use, and longer commute times in areas with less transit and destination access externalizing transit costs onto individuals and households (Morris et al. Citation2002, Dodson and Sipe Citation2008, Currie et al. Citation2009, Delbosc and Currie Citation2011) leading to increased health, wellbeing and social capital disparities (Smith et al. Citation2021).
Another factor in the socio-spatial patterning of Melbourne whereby the most walkable areas are closer to the inner city, is gentrification. Inner city areas, once housed the working-class and are now experiencing gentrification with the displacement of low-income households to more affordable areas, often located further away from central, amenity-rich locations (Shaw Citation2008, Ehrenhalt Citation2012, Pegler et al. Citation2020). Whilst this process might improve older areas in need of refurbishment (Shaw Citation2008, O’Hanlon and Hamnett Citation2009) it comes at the expense of displacing more vulnerable people who would benefit the most from having access to high-quality amenity-rich environments with good access to transit. The displacement of more vulnerable people can also occur due to environmental improvements to parks and open spaces, and to the densification of neighbouring areas that often occurs with urban redevelopment. This is referred to as environmental gentrification (Immergluck Citation2009, Checker Citation2011, Quastel et al. Citation2012, Cole et al. Citation2017, Immergluck and Balan Citation2018, Maantay and Maroko Citation2018). Like gentrification, it is also a dynamic process, where changing environments and improved amenity can increase house prices displacing more vulnerable people (Cole et al. Citation2017). The process of gentrification exacerbates both the disparity between amenity-rich and amenity-poor environments and separates cities into rich and poor neighbourhoods adding to the social gradient and problems of double disadvantage, socio-spatial inequity and to environmental and social justice concerns. These concerns are inherently related to liveability and the social determinants of health whereby everyone has the right to live and work in a safe and healthy environment with equitable access to the features of a liveable environment (Macintyre Citation2007, Maantay and Maroko Citation2018, Badland and Pearce Citation2019, Binet et al. Citation2021).
Policy implications
In this research we found spatial variability in walkability by disadvantage which implies inequitable distribution of liveable environments in Melbourne. Furthermore, we found that houses in more walkable areas command a price premium, even if they are in disadvantaged areas. These two key findings highlight the need for a variety of policies for improving land uses and urban development to redress the distribution of liveability across all areas of a city to improve housing affordability especially for disadvantaged and vulnerable people (Whitehead Citation2007).
The gentrification process, as discussed in the previous section, highlights the importance of well-implemented inclusionary zoning policies (Lens and Monkkonen Citation2016), as a means to ensure that social and affordable housing is located in amenity-rich areas across cities (Jenny et al. Citation2011), rather than locating affordable housing in outer suburban areas, even if those areas are walkable. Urban renewal policies for retrofitting existing areas, could improve liveability where it is most needed.
Planning guidelines for new developments could set and improve on standards for density and accessibility to key destinations to ensure the development and equitable access to high quality liveable environments. Globally, the 15 to 20 minute neighbourhood (City of Portland Citation2009, Capasso Da Silva et al. Citation2020, Carlos et al. Citation2021, Graells-Garrido et al. Citation2021) are examples of policies designed to improve local amenity, and these are now being introduced in Australia (Greater Sydney Commission Citation2018, Department of Environment, Land, Water and Planning, Victoria State Governmen Citation2019). Policies that ensure the early and equitable delivery of transit and local social infrastructure are also critical to ensure accessibility especially in new urban areas. In these areas transit is typically sparse with lower service offerings and there is limited accessibility to social infrastructure destinations (Kroen et al. Citation2018, Gunn et al. Citation2020).
In focussing on housing affordability, some authors find that it is exacerbated by lack of income and may be due to disabilities and household complexities, where more vulnerable people struggle to cover the costs of housing, which are typically a larger portion of their income (Abelson Citation2009). This can be alleviated by increasing housing supply which has been shown to reduce housing costs and improve affordability. Furthermore, government levies and infrastructure contributions could be used to provide housing and critical infrastructure such as transit (Kroen and De Gruyter Citation2021, Squires et al. Citation2021). In addition to inclusionary zoning policies, it may also be necessary to provide and maintain housing subsidies through first-home owners grants and welfare payments which will also help vulnerable people manage housing costs (Marks and Sedgwick Citation2008, Abelson Citation2009).
Strengths and limitations
Few researchers have used stratification to explore the value of the built environment on house prices (Rauterkus and Miller Citation2011), and hence the use of stratification by socio-economic disadvantage is a key strength and novelty of this research. Furthermore, whilst many authors using hedonic pricing methods to produce estimates of either premiums or discounts, few have produced estimates according to the differing levels of socio-economic disadvantage and by the level of walkability within each strata of disadvantage. By doing this, our results provide more detail on house price premiums and discounts in relation to the key components of walkability contributing to the debate on housing affordability and walkability.
Despite these strengths some limitations remain. Several variables were used to control for the different structural features of the houses in our sample, however some analyses also include a variable for floor area, which was not present in our dataset. Whilst this can potentially lead to omitted variable bias, we reason that floor area was effectively measured in our models using other variables, such as number of bedrooms and bathrooms respectively, and whether additional rooms were present (e.g. presence of a rumpus room/sunroom/family room/separate study) and by property type. Nevertheless, in jurisdictions where these data are available, this would be one variable worthy of inclusion.
We conducted our analysis as a cross-sectional linear regression, however cities are continuously changing and growing through development and urban planning as demonstrated by other authors (Giles-Corti et al. Citation2013, Bentley et al. Citation2018). To account for the dynamic relationship between house prices and the built environment, we recommend that future research use longitudinal data and analyses which are capable of measuring changes in both the outcome and exposure variables (Caruana et al. Citation2015).
Although we undertook validity testing on the built environment data, these were developed using a variety of routinely collected spatial datasets which may not be accurate as mentioned elsewhere (Higgs et al. Citation2019, Gunn et al. Citation2020). Furthermore, although every attempt was made to match the different datasets as closely as possible, they may not exactly match the timing of house price sales in the APM dataset. This is a common limitation of spatial datasets and analyses. Finally, many authors have explored the relationship of transit accessibility with house prices in varying ways which may have implications for the results. Our analysis only used one version of a transit accessibility variable and other forms, such as inverse-distance, may be of value to more fully uncover the relationship between transit accessibility and house value which we leave for future work (Bartholomew and Ewing Citation2011).
Conclusion
This research demonstrated that the relationship between house prices and walkability persisted when stratifying by levels of socio-economic disadvantage. However, the strength of the relationship was found to differ between levels of disadvantage, with more modest associations found in more disadvantaged areas. In the most disadvantaged strata, destination access was found to have the largest association with house prices followed by transit access and dwelling density. The relationship with transit access requires further investigation in disadvantaged neighbourhoods since residents of these areas may benefit more than others from access to high quality public transit.
The provision of walkable and transit accessible environments was found to be inequitably distributed; and there was a price premium associated with living in areas with greater walkability and transit access. However, for people choosing a residential location, there was a trade-off between housing expenditure and the pressure placed on household budgets of unaccounted transit costs. The costs of accessing employment and key destinations are likely to be considerably higher for those living in urban fringe areas.
Future planning could redress such inequities by making all new suburbs walkable which would be facilitated by increasing densities in outer suburban areas. This would bring with it more destinations and improved transit accessibility. However, to address socio-spatial inequities, future higher density development in amenity-rich established areas should include well-implemented inclusionary zoning to ensure that social and affordable housing is also available in those areas to support lower socio-economic households and vulnerable people.
Supplemental Material
Download PDF (467.2 KB)Acknowledgements
The authors would like to thank the AURIN for providing the Australian Property Monitor data. The assistance of Andy Krause and Gideon Ashwanden in preparing these data for analysis is greatly appreciated. Spatial data have been provided by the Australian Urban Observatory (auo.org.au) and the Healthy Liveable Cities Lab, Centre for Urban Research, RMIT University with funding support provided through the NHMRC funded Australian Prevention Partnership Centre, NESP Clean Air and Urban Landscapes Hub and NHMRC funded Centre of Research Excellence in Healthy, Liveable Communities. We thank Carl Higgs for his role in developing the geospatial data.
Disclosure statement
No potential conflict of interest was reported by the author(s).
Supplementary material
Supplemental data for this article can be accessed online at https://doi.org/10.1080/23748834.2022.2072058
Additional information
Funding
Notes on contributors
Lucy D. Gunn
The authors of this publication are members of RMIT University’s Centre for Urban Research in the Healthy, Liveable Cities Lab. The Healthy, Liveable Cities Lab is a multidisciplinary team with expertise in geographical information systems analysis, agent based modelling and statistical analyses of big data related to urban and planning applications. The team aims to aims to transform cities through evidence.
Tayebeh Saghapour
The authors of this publication are members of RMIT University’s Centre for Urban Research in the Healthy, Liveable Cities Lab. The Healthy, Liveable Cities Lab is a multidisciplinary team with expertise in geographical information systems analysis, agent based modelling and statistical analyses of big data related to urban and planning applications. The team aims to aims to transform cities through evidence.
Billie Giles-Corti
The authors of this publication are members of RMIT University’s Centre for Urban Research in the Healthy, Liveable Cities Lab. The Healthy, Liveable Cities Lab is a multidisciplinary team with expertise in geographical information systems analysis, agent based modelling and statistical analyses of big data related to urban and planning applications. The team aims to aims to transform cities through evidence.
Gavin Turrell
The authors of this publication are members of RMIT University’s Centre for Urban Research in the Healthy, Liveable Cities Lab. The Healthy, Liveable Cities Lab is a multidisciplinary team with expertise in geographical information systems analysis, agent based modelling and statistical analyses of big data related to urban and planning applications. The team aims to aims to transform cities through evidence.
References
- Abelson, P., 2009. Affordable housing: concepts and policies. Economic papers (Economic society of Australia), 28 (1), 27–38. doi:10.1111/j.1759-3441.2009.00001.x
- ABS, 2011. 2033.0.55.001 - Census of population and housing: socio-economic indexes for areas (SEIFA). Australia: Australian Bureau of Statistics.
- ABS, 2016. 3218.0 - Regional population growth, 2014-15. Australia: Austrailan Bureau of Statistics.
- ABS, 2021. Data by region [online]. Available from https://dbr.abs.gov.au/
- Arimah, B.C. and Adinnu, F.I., 1995. Market segmentation and the impact of landfills on residential property values: empirical evidence from an African city. Netherlands journal of housing and the built environment, 10 (2), 157–171. doi:10.1007/BF02496533
- Arundel, J., et al., 2017. Creating liveable cities in Australia: mapping urban policy implementation and evidence-based national liveability indicators. Melbourne: Centre of Urban Research, RMIT University.
- Atkinson-Palombo, C., 2010. Comparing the capitalisation benefits of light-rail transit and overlay zoning for single-family houses and condos by neighbourhood type in metropolitan Phoenix, Arizona. Urban studies, 47 (11), 2409–2426. doi:10.1177/0042098009357963
- Badland, H., et al., 2014. Public transport access and availability in the RESIDE study: is it taking us where we want to go? Journal of transport & health, 1 (1), 45–49. doi:10.1016/j.jth.2013.10.001
- Badland, H. and Pearce, J., 2019. Liveable for whom? Prospects of urban liveability to address health inequities. Social science & medicine, 232, 94–105. doi:10.1016/j.socscimed.2019.05.001
- Banerjee, T. and Loukaitou-Sideris, A., eds., 2011. Companion to urban design. London: Routledge.
- Bartholomew, K. and Ewing, R., 2011. Hedonic price effects of pedestrian- and transit-oriented development. Journal of planning literature, 26 (1), 18–34. doi:10.1177/0885412210386540
- Bentley, R., et al., 2018. A longitudinal study examining changes in street connectivity, land use, and density of dwellings and walking for transport in Brisbane, Australia. Environmental health perspectives, 126 (5), 057003. doi:10.1289/EHP2080
- Binet, A., et al., 2021. ‘It feels like money’s just flying out the window’: financial security, stress and health in gentrifying neighborhoods. Cities & health, 1–16. doi:10.1080/23748834.2021.1885250
- Bohman, H. and Nilsson, D., 2016. The impact of regional commuter trains on property values: price segments and income. Journal of transport geography, 56, 102–109. doi:10.1016/j.jtrangeo.2016.09.003
- Bohman, H., 2021. Same, same but different? Neighbourhood effects of accessibility on housing prices. Transport policy, 107, 52–60. doi:10.1016/j.tranpol.2021.04.016
- Boulange, C., et al., 2017. Examining associations between urban design attributes and transport mode choice for walking, cycling, public transport and private motor vehicle trips. Journal of transport & health, 6, 155–166. doi:10.1016/j.jth.2017.07.007
- Bowes, D.R. and Ihlanfeldt, K.R., 2001. Identifying the impacts of rail transit stations on residential property values. Journal of urban economics, 50 (1), 1–25.
- Brownson, R.C., et al., 2009. Measuring the built environment for physical activity: state of the science. American journal of preventive medicine, 36 (4 Suppl), S99–123.e112. doi:10.1016/j.amepre.2009.01.005
- Capasso Da Silva, D., King, D.A., and Lemar, S., 2020. Accessibility in practice: 20-minute city as a sustainability planning goal. Sustainability, 12 (1), 129. doi:10.3390/su12010129
- Carlos, M., et al., 2021. Introducing the “15-Minute City”: sustainability, resilience and place identity in future post-pandemic cities. Smart Cities, 4 (1), 93. doi:10.3390/smartcities4010006
- Carpenter, A. and Peponis, J., 2010. Poverty and connectivity. The journal of space syntax, 1 (1), 108–120.
- Caruana, E.J., et al., 2015. Longitudinal studies. Journal of thoracic disease, 7 (11), E537–E540. doi:10.3978/j.issn.2072-1439.2015.10.63
- Cervero, R., 2004. Transit-oriented development in the United States: experiences, challenges, and prospects. vol. 102. Washington: Transportation Research Board.
- Cervero, R. and Duncan, M., 2002. Transit’s value-added effects: light and commuter rail services and commercial land values. Transportation research record, 1805 (1), 8. doi:10.3141/1805-02
- Chakraborty, J., Maantay, J.A., and Brender, J.D., 2011. Disproportionate proximity to environmental health hazards: methods, models, and measurement. American journal of public health, 101 (S1), S27–S36. doi:10.2105/AJPH.2010.300109
- Chandrabose, M., et al., 2019. Built environment and cardio‐metabolic health: systematic review and meta‐analysis of longitudinal studies. Obesity reviews, 20 (1), 41–54. doi:10.1111/obr.12759
- Chatman, D. and Voorhoeve, N., 2010. The transportation-credit mortgage: a post-mortem. Housing policy debate, 20 (3), 355–382. doi:10.1080/10511481003788786
- Chatman, D.G., Tulach, N.K., and Kyeongsu, K., 2012. Evaluating the economic impacts of light rail by measuring home appreciation: a first look at New Jersey’s River Line. Urban studies, 49 (3), 467. doi:10.1177/0042098011404933
- Checker, M., 2011. Wiped out by the “greenwave”: environmental gentrification and the paradoxical politics of urban sustainability. City & Society, 23 (2), 210–229. doi:10.1111/j.1548-744X.2011.01063.x
- Cho, S.-H., Chen, Z., and Yen, S.T., 2008. Urban growth boundary and housing prices: the case of Knox County, Tennessee. The review of regional studies, 38 (1), 29–44. doi:10.52324/001c.8252
- Choi, K., Park, H.J., and Dewald, J., 2021. The impact of mixes of transportation options on residential property values: synergistic effects of walkability. Cities, 111, 103080. doi:10.1016/j.cities.2020.103080
- City of Portland, B.O.P.A.S. 2009. Portland plan status report: 20 minute neighborhoods. Available from http://www.portlandonline.com/portlandplan/index.cfm?a=246917&c=46822 [Accessed 22 Dec 2020].
- Clark, A. and Scott, D., 2014. Understanding the impact of the modifiable areal unit problem on the relationship between active travel and the built environment. Urban studies, 51 (2), 284–299. doi:10.1177/0042098013489742
- Cohen, J.P. and Coughlin, C.C., 2008. Spatial hedonic models of airport noise, proximity, and housing prices. Journal of regional science, 48 (5), 859–878. doi:10.1111/j.1467-9787.2008.00569.x
- Cole, H.V., et al., 2017. Are green cities healthy and equitable? Unpacking the relationship between health, green space and gentrification. Journal of epidemiology and community health, 71 (11), 1118–1121. doi:10.1136/jech-2017-209201
- Corozzi, F., Cheshire, P., and Hilber, C., 2020. 16th annual demographia international housing affordability survey: rating middle-income housing affordability (2019: 3rd Quarter) [online]. Available from: http://demographia.com/dhi.pdf
- Coulombel, N., 2018. Why housing and transport costs should always be considered together: a monocentric analysis of prudential measures in housing access. Transport policy, 65, 89–105. doi:10.1016/j.tranpol.2017.04.011
- Currie, G. and Senbergs, Z., 2007. Exploring forced car ownership in metropolitan Melbourne. Paper presented at the Australasian Transport Research Forum.
- Currie, G., et al., 2009. Investigating links between transport disadvantage, social exclusion and well-being in Melbourne–updated results. Research in transportation Economics, 29 (1), 287–295. doi:10.1016/j.retrec.2010.07.036
- Daniels, T., 2001. Smart growth: a new American approach to regional planning. Planning practice and research, 16 (3–4), 271–279. doi:10.1080/02697450120107880
- Davern, M., et al., 2017. Using spatial measures to test a conceptual model of social infrastructure that supports health and wellbeing. Cities & health, 1 (2), 194–209. doi:10.1080/23748834.2018.1443620
- Delbosc, A. and Currie, G., 2011. Mobility vs. affordability as motivations for car-ownership choice in urban fringe, low-income Australia. In; K. Lucas, E. Blumenberg and R.Weinberger, eds. Auto motives: Understanding car use behaviours, 193–208. doi:10.1108/9780857242341-010
- Delbosc, A., et al., 2018. American complete streets and Australian smartRoads: what can we learn from each other? Transportation research record, 2672, 166–176. doi:10.1177/0361198118777379
- Department of Environment, Land, Water and Planning, Victoria State Government, 2019. 20-minute neighbourhoods: creating a more liveable Melbourne.
- Dodson, J. and Sipe, N., 2008. Shocking the suburbs: urban location, homeownership and oil vulnerability in the Australian city. Housing Studies, 23 (3), 377–401. doi:10.1080/02673030802015619
- Dong, H., 2015. Were home prices in new urbanist neighborhoods more resilient in the recent housing downturn? Journal of planning education & research, 35 (1), 5–18. doi:10.1177/0739456x14560769
- Donovan, G.H., Landry, S., and Winter, C., 2019. Urban trees, house price, and redevelopment pressure in Tampa, Florida. Urban forestry & urban greening, 38, 330–336. doi:10.1016/j.ufug.2019.01.014
- Duncan, M., 2011. The impact of transit-oriented development on housing prices in San Diego, CA. Urban studies, 48 (1), 101-127. doi:10.1177/0042098009359958
- Ehrenhalt, A., 2012. The great inversion and the future of the American city. New York: Vintage.
- EOEEA. 2022. Environmental justice communities in Massachusetts. Environmental Justice 2019. https://www.mass.gov/info-details/environmental-justice-populations-in-massachusetts
- Fan, P., et al., 2018. Walkability in urban landscapes: a comparative study of four large cities in China. Landscape ecology, 33 (2), 323–340. doi:10.1007/s10980-017-0602-z
- Filippova, O. and Sheng, M., 2020. Impact of bus rapid transit on residential property prices in Auckland, New Zealand. Journal of transport geography, 86, 102780. doi:10.1016/j.jtrangeo.2020.102780
- Forouhar, A. and Hasankhani, M., 2018. The effect of Tehran metro rail system on residential property values: a comparative analysis between high-income and low-income neighbourhoods. Urban studies, 55 (16), 3503–3524. doi:10.1177/0042098017753089
- Frank, L.D., et al., 2005. Linking objectively measured physical activity with objectively measured urban form: findings from SMARTRAQ. American journal of preventive medicine, 28 (2), 117–125. doi:10.1016/j.amepre.2004.11.001
- Gilderbloom, J.I., Riggs, W.W., and Meares, W.L., 2015. Does walkability matter? an examination of walkability’s impact on housing values, foreclosures and crime. Cities, 42, 13–24. doi:10.1016/j.cities.2014.08.001
- Giles-Corti, B., et al., 2013. The influence of urban design on neighbourhood walking following residential relocation: longitudinal results from the RESIDE study. Social science & medicine, 77, 20. doi:10.1016/j.socscimed.2012.10.016
- Giles-Corti, B., et al., 2014. How walkable is Melbourne? The development of a transport walkability index for metropolitan Melbourne. Place, Health and Liveability Research Program.
- Graells-Garrido, E., et al., 2021. A city of cities: measuring how 15-minutes urban accessibility shapes human mobility in Barcelona. PLoS ONE, 16 (5), e0250080. doi:10.1371/journal.pone.0250080
- Greater Sydney Commission, 2018. Greater Sydney region plan: a metropolis of three cities: connecting people. Sydney: Greater Sydney Commission.
- Grout, C.A., Jaeger, W.K., and Plantinga, A.J., 2011. Land-use regulations and property values in Portland, Oregon: a regression discontinuity design approach. Regional science and urban economics, 41 (2), 98–107. doi:10.1016/j.regsciurbeco.2010.09.002
- Gunn, L.D., et al., 2017. Designing healthy communities: creating evidence on metrics for built environment features associated with walkable neighbourhood activity centres. The international journal of behavioral nutrition and physical activity, 14 (1), 164. doi:10.1186/s12966-017-0621-9
- Gunn, L., et al., 2020. Early delivery of equitable and healthy transport options in new suburbs: policy, place and people. Journal of transport & health, 18, 1–15. doi:10.1016/j.jth.2020.100870
- Healthy Streets, 2022. https://www.healthystreets.com/what-is-healthy-streets
- Hess, D.B. and Almeida, T.M., 2007. Impact of proximity to light rail rapid transit on station-area property values in Buffalo, New York. Urban studies, 44 (5/6), 1041–1068. doi:10.1080/00420980701256005
- Higgins, C.D. and Kanaroglou, P.S., 2016. Forty years of modelling rapid transit’s land value uplift in North America: moving beyond the tip of the iceberg. Transport Reviews, 36 (5), 610–634. doi:10.1080/01441647.2016.1174748
- Higgs, C., et al., 2019. The Urban Liveability Index: developing a policy-relevant urban liveability composite measure and evaluating associations with transport mode choice. International journal of health geographics, 18(1), 14. doi:10.1186/s12942-019-0178-8
- Hooper, P., et al., 2015. The building blocks of a ‘Liveable Neighbourhood’: identifying the key performance indicators for walking of an operational planning policy in Perth, Western Australia. Health & place, 36, 173–183. doi:10.1016/j.healthplace.2015.10.005
- Hooper, P., et al., 2020. Living liveable? RESIDE’s evaluation of the “Liveable Neighborhoods” planning policy on the health supportive behaviors and wellbeing of residents in Perth, Western Australia. SSM-population health, 10, 100538. doi:10.1016/j.ssmph.2020.100538
- Hui, N., et al., 2018. Measuring the completeness of complete streets. Transport Reviews, 38(1), 73–95. doi:10.1080/01441647.2017.1299815
- Immergluck, D., 2009. Large redevelopment initiatives, housing values and gentrification: the case of the Atlanta Beltline. Urban studies, 46 (8), 1723–1745. doi:10.1177/0042098009105500
- Immergluck, D. and Balan, T., 2018. Sustainable for whom? Green urban development, environmental gentrification, and the Atlanta Beltline. Urban geography, 39 (4), 546–562. doi:10.1080/02723638.2017.1360041
- Jego, C. and Roehner, B.M., 2006. White flight or flight from poverty? Journal of economic interaction and coordination, 1 (1), 75–87. doi:10.1007/s11403-006-0004-9
- Jenny, S., Rachel, M., and Vicki, B., 2011. Silver bullet or trojan horse? the effects of inclusionary zoning on local housing markets in the United States. Urban Studies, 48 (2), 297–329. doi:10.1177/0042098009360683
- Jordan, S.W. and Ivey, S., 2021. Complete streets: promises and proof. Journal of urban planning and development, 147 (2), 04021011. doi:10.1061/(ASCE)UP.1943-5444.0000684
- Jun, M.-J., 2006. The effects of Portland’s urban growth boundary on housing prices. Journal of the American Planning Association, 72 (2), 239–243. doi:10.1080/01944360608976742
- Kay, A.I., Noland, R.B., and DiPetrillo, S., 2014. Residential property valuations near transit stations with transit-oriented development. Journal of transport geography, 39, 131–140. doi:10.1016/j.jtrangeo.2014.06.017
- Kenyon, A. and Pearce, J., 2019. The socio-spatial distribution of walkable environments in urban Scotland: a case study from Glasgow and Edinburgh. SSM-population health, 9, 100461. doi:10.1016/j.ssmph.2019.100461
- Kim, J. and Bae, C.-H.-C., 2020. Do home buyers value the New Urbanist neighborhood? the case of Issaquah Highlands, WA. Journal of urbanism: international research on placemaking and urban sustainability, 13 (3), 303–324.
- King, K.E. and Clarke, P.J., 2015. A disadvantaged advantage in walkability: findings from socioeconomic and geographical analysis of national built environment data in the United States. American journal of epidemiology, 181 (1), 17–25. doi:10.1093/aje/kwu310
- Knaap, G.J., 1985. The price effects of urban growth boundaries in metropolitan Portland, Oregon. Land economics, 61 (1), 26–35. doi:10.2307/3146137
- Kohlhase, J.E., 1991. The impact of toxic waste sites on housing values. Journal of urban economics, 30 (1), 1–26. doi:10.1016/0094-1190(91)90042-6
- Krause, A. and Bitter, C., 2012. Spatial econometrics, land values and sustainability: trends in real estate valuation research. Cities, 29 (Supplement 2), S19–S25. doi:10.1016/j.cities.2012.06.006
- Kroen, A., Taylor, E., and Goodman, R., 2018. Precinct structure planning in Melbourne’s growth areas: initial thoughts on processes and trade-offs. RMIT Briefing Paper. Melbourne: RMIT.
- Kroen, A. and De Gruyter, C., 2021. Development contributions for regional and state infrastructure–a case study of Melbourne, Australia. Urban policy and research, 39 (2), 157–174. doi:10.1080/08111146.2020.1816542
- Lancaster, K.J., 1966. A new approach to consumer theory. The journal of political economy, 74 (2), 132–157. doi:10.1086/259131
- Landis, J., Guhathakurta, S., and Zhang, M., 1994. Capitalization of transit investments into single-family home prices: a comparative analysis of five California rail transit systems. UC Berkeley: University of California Transportation Center. Available from: https://escholarship.org/uc/item/80f3p5n1.
- Lens, M.C. and Monkkonen, P., 2016. Do strict land use regulations make metropolitan areas more segregated by income? Journal of the American Planning Association, 82 (1), 6–21. doi:10.1080/01944363.2015.1111163
- Levinson, D.M., 2019. The 30-minute city: designing for access. Network Design Lab. Available from: https://ses.library.usyd.edu.au/handle/2123/21630.
- Li, M. and Brown, H.J., 1980. Micro-neighborhood externalities and hedonic housing prices. Land economics, 56 (2), 125–141. doi:10.2307/3145857
- Li, W., et al., 2015. Assessing benefits of neighborhood walkability to single-family property values. Journal of panning education & research, 35 (4), 471–488. doi:10.1177/0739456x15591055
- Lowe, M., et al. (2013). Liveable, healthy, sustainable: what are the key indicators for Melbourne neighbourhoods? Research Paper 1. https://socialequity.unimelb.edu.au/__data/assets/pdf_file/0006/1979574/Liveability-Indicators-report.pdf
- Lowe, M., et al., 2020. Liveability aspirations and realities: Implementation of urban policies designed to create healthy cities in Australia. Social science & medicine, 245, 112713. doi:10.1016/j.socscimed.2019.112713
- Lumley, T., et al., 2002. The importance of the normality assumption in large public health data sets. Annual review of public health, 23 (1), 151–169. doi:10.1146/annurev.publhealth.23.100901.140546
- Luttik, J., 2000. The value of trees, water and open space as reflected by house prices in the Netherlands. Landscape and urban planning, 48 (3–4), 161–167. doi:10.1016/S0169-2046(00)00039-6
- Maantay, J., 2002. Mapping environmental injustices: pitfalls and potential of geographic information systems in assessing environmental health and equity. Environmental health perspectives, 110 (suppl 2), 161–171. doi:10.1289/ehp.02110s2161
- Maantay, J.A. and Maroko, A.R., 2018. Brownfields to Greenfields: environmental justice versus environmental gentrification. International journal of environmental research and public health, 15 (10), 2233. doi:10.3390/ijerph15102233
- Macintyre, S., 2007. Deprivation amplification revisited; or, is it always true that poorer places have poorer access to resources for healthy diets and physical activity? The international journal of behavioral nutrition and physical activity, 4 (1), 32. doi:10.1186/1479-5868-4-32
- Marks, G.N. and Sedgwick, S.T., 2008. Is there a housing crisis? the incidence and persistence of housing stress 2001-2006. Australian Economic Review, 41 (2), 215–221. doi:10.1111/j.1467-8462.2008.00500.x
- Mathur, S., 2019. Impact of an urban growth boundary across the entire house price spectrum: the two-stage quantile spatial regression approach. Land use policy, 80, 88–94. doi:10.1016/j.landusepol.2018.09.011
- Matthews, J. and Turnbull, G., 2007. Neighborhood street layout and property value: the interaction of accessibility and land use mix. Journal of real estate finance & economics, 35 (2), 111–141. doi:10.1007/s11146-007-9035-9
- McCord, J., et al., 2014. Effect of public green space on residential property values in Belfast metropolitan area. Journal of financial management of property & construction, 19 (2), 117. doi:10.1108/JFMPC-04-2013-0008
- McDonald, J.F. and Osuji, C.I., 1995. The effect of anticipated transportation improvement on residential land values. Regional science & urban economics, 25 (3), 261. doi:10.1016/0166-0462(94)02085-U
- McMillen, D.P. and McDonald, J., 2004. Reaction of house prices to a new rapid transit line: Chicago’s midway line, 1983–1999. Real Estate Economics, 32 (3), 463–486. doi:10.1111/j.1080-8620.2004.00099.x
- Mees, P., 2009. Transport for suburbia: beyond the automobile age. Routledge.
- Michaels, R.G. and Smith, V.K., 1990. Market segmentation and valuing amenities with hedonic models: the case of hazardous waste sites. Journal of urban economics, 28 (2), 223–242. doi:10.1016/0094-1190(90)90052-O
- Middleton, J.D., 2003. Health, environmental and social justice. Local environment, 8(2), 155–165. doi:10.1080/1354983032000048479
- Mingche, M.L. and Brown, H.J., 1980. Micro-neighborhood externalities and hedonic housing prices. Land economics, 56 (2), 125–141. doi:10.2307/3145857
- Mohai, P., Pellow, D., and Roberts, J.T., 2009. Environmental justice. Annual review of environment and resources, 34, 405–430. DOI:10.1146/annurev-environ-082508-094348
- Morisson, A. and Bevilacqua, C., 2019. Balancing gentrification in the knowledge economy: the case of Chattanooga’s innovation district. Urban research & practice, 12(4), 472–492. doi:10.1080/17535069.2018.1472799
- Morris, J., Wang, F., and Berry, M., 2002. Planning for public transport in the future: challenges of a changing metropolitan Melbourne. Canberra: Australasian Transport Research Forum.
- National Complete Streets Coalition, 2022. National complete streets coalition. https://smartgrowthamerica.org/program/national-complete-streets-coalition/
- Nelson, A.C., 1992. Effects of elevated heavy-rail transit stations on house prices with respect to neighborhood income. Transportation research record, 1359, 127–132.
- Nelson, A.C., 1999. Transit stations and commercial property values: a case study with policy and land-use implications. Journal of public transportation, 2 (3), 4. 10.5038/2375-0901.2.3.4
- Nelson, A.C. and McCleskey, S.J., 1990. Improving the effects of elevated transit stations on neighborhoods. Transportation research record, 1266, 173–180.
- Nelson, J.P., 1982. Highway noise and property values: a survey of recent evidence. Journal of transport economics and policy, 16 (2), 117–138.
- Nelson, J.P., 2008. Hedonic property value studies of transportation noise: aircraft and road traffic. In: A. Baranzini, et al., eds. Hedonic methods in housing markets. New York, NY: Springer. Available from: https://doi.org/10.1007/978-0-387-76815-1_4.
- NSW Government, 2018. Greater Sydney region plan: a metropolis of three cities. Sydney NSW Government.
- O’-Hanlon, S. and Hamnett, C., 2009. Deindustrialisation, gentrification and the re-invention of the inner city: London and Melbourne, c. 1960–2008. Urban policy and research, 27 (3), 211–216. 10.1080/08111140903161894
- Open Street Map 2018 [online]. Available from: https://planet.osm.org/planet/2018/ [Accessed 1 July 2019].
- Pandit, R., Polyakov, M., and Sadler, R., 2014. Valuing public and private urban tree canopy cover. The Australian journal of agricultural and resource economics, 58 (3), 453–470. doi:10.1111/1467-8489.12037
- Payton, S., et al., 2008. Valuing the benefits of the urban forest: a spatial hedonic approach. Journal of environmental planning and management, 51 (6), 717–736. doi:10.1080/09640560802423509
- Pearce, J., et al., 2007. Are socially disadvantaged neighbourhoods deprived of health-related community resources? International journal of epidemiology, 36 (2), 348–355. doi:10.1093/ije/dyl267
- Pearce, J.R., et al., 2010. Environmental justice and health: the implications of the socio‐spatial distribution of multiple environmental deprivation for health inequalities in the United Kingdom. Transactions of the Institute of British Geographers, 35 (4), 522–539. doi:10.1111/j.1475-5661.2010.00399.x
- Pearce, J., et al., 2011. Environmental justice and health: a study of multiple environmental deprivation and geographical inequalities in health in New Zealand. Social science & medicine, 73 (3), 410–420. doi:10.1016/j.socscimed.2011.05.039
- Pegler, C., Li, H., and Pojani, D., 2020. Gentrification in Australia’s largest cities: a bird’s-eye view. Australian planner, 56 (3), 191–205. doi:10.1080/07293682.2020.1775666
- Pendall, R., et al., 2016. Driving to opportunity: understanding the links among transportation access, residential outcomes, and economic opportunity for housing voucher recipients. Urban Institute. Available from: https://policycommons.net/artifacts/632834/driving-to-opportunity/1614185/ on 16 May 2022. CID: 20.500.12592/v1701t.
- Phillips, J. and Goodstein, E., 2000. Growth management and housing prices: the case of Portland, Oregon. Contemporary economic policy, 18 (3), 334–344. doi:10.1111/j.1465-7287.2000.tb00030.x
- Pivo, G. and Fisher, J.D., 2011. The walkability premium in commercial real estate investments. Real Estate Economics, 39(2), 185–219. doi:10.1111/j.1540-6229.2010.00296.x, Summer2011
- Plaut, P. and Boarnet, M., 2003. New urbanism and the value of neighborhood design. Journal of architectural and planning research, 20 (3), 254–265.
- Plowden, B., 2020. Creating healthy streets for sustainable cities – delivering public health benefits through redesigning London’s streets. Cities & health, 4(2), 156–161. doi:10.1080/23748834.2019.1685852
- PSMA, 2018. GNAF: the geocoded national address file. Canberra: PSMA Australia Limited. Callpoint Spatial Pty Ltd.
- Quastel, N., Moos, M., and Lynch, N., 2012. Sustainability-as-density and the return of the social: the case of Vancouver, British Columbia. Urban geography, 33 (7), 1055–1084. doi:10.32.8.1208/0272-3638.33.7.1055
- Rauterkus, S.Y. and Miller, N., 2011. Residential land values and walkability. Journal of sustainable real estate, 3 (1), 23–43. doi:10.1080/10835547.2011.12091815
- Reisch, M., 2002. Defining social justice in a socially unjust world. Families in society, 83 (4), 343–354. doi:10.1606/1044-3894.17
- Rosales, C.B., et al., 2012. Social justice, health, and human rights education: challenges and opportunities in schools of public health. Public health reports (1974), 127 (1), 126–130. doi:10.1177/003335491212700117
- Rosen, S., 1974. Hedonic prices and implicit markets: product differentiation in pure competition. The journal of political economy, 82 (1), 34–55. doi:10.1086/260169
- Ryan, S., 1999. Property values and transportation facilities: finding the transportation-land use connection. Journal of planning literature, 13 (4), 412–427. doi:10.1177/08854129922092487
- Saberi, M., et al., 2017. Measuring housing and transportation affordability: a case study of Melbourne, Australia. Journal of transport geography, 65, 134–146. doi:10.1016/j.jtrangeo.2017.10.007
- Sallis, J.F., et al., 2020. Built environment, physical activity, and obesity: findings from the international physical activity and environment network (IPEN) adult study. Annual review of public health, 41 (1), 119–139. DOI:10.1146/annurev-publhealth-040218-043657
- Sander, H., Polasky, S., and Haight, R.G., 2010. The value of urban tree cover: a hedonic property price model in Ramsey and Dakota Counties, Minnesota, USA. Ecological Economics, 69 (8), 1646–1656.
- Sarokin, D.J. and Schulkin, J., 1994. Environmental justice: Co-evolution of environmental concerns and social justice. The environmentalist, 14 (2), 121–129. doi:10.1007/BF01901305
- Schlosberg, D. and Carruthers, D., 2010. Indigenous struggles, environmental justice, and community capabilities. Global environmental politics, 10 (4), 12–35. doi:10.1162/GLEP_a_00029
- Shaw, K., 2008. Gentrification: what it is, why it is, and what can be done about it. Geography Compass, 2 (5), 1697–1728. doi:10.1111/j.1749-8198.2008.00156.x
- Sinnett, D. and Williams, K., 2020. Urban form and walkable environments. In: A.J.D.N. Corinne Mulley, ed. Urban form and accessibility: social, economic, and environment impacts. Cambridge, MA: Elsevier, 141–156.
- Sinnott, R.O., et al., 2015. The Australia urban research gateway. Concurrency and computation: practice and experience, 27 (2), 358–375. doi:10.1002/cpe.3282
- Smart, M.J. and Klein, N.J., 2018. Complicating the story of location affordability. Housing policy debate, 28 (3), 393–410. doi:10.1080/10511482.2017.1371784
- Smith, J., et al., 2021. Understanding the lived experiences of housing and transport stress in the “affordable” outer ring: a case study of Melbourne, Australia. Urban policy and research, 39 (2), 191–207. doi:10.1080/08111146.2021.1898939
- Sohn, D.W., Moudon, A.V., and Lee, J., 2012. The economic value of walkable neighborhoods. Urban design international, 17 (2), 115–128. doi:10.1057/udi.2012.1
- Song, Y. and Knaap, G.-J., 2003. New urbanism and housing values: a disaggregate assessment. Journal of urban economics, 54, 218–238. doi:10.1016/s0094-1190(03)00059-7
- Song, Y. and Knaap, G.-J., 2004. Measuring the effects of mixed land uses on housing values. Regional science and urban economics, 34 (6), 663–680. doi:10.1016/j.regsciurbeco.2004.02.003
- Song, Y., 2005. Smart growth and urban development pattern: a comparative study. International regional science review, 28 (2), 239–265. doi:10.1177/0160017604273854
- Squires, G., Javed, A., and Trinh, H.H., 2021. Housing charges to fund bulk infrastructure: innovative or traditional? Regional studies, regional science, 8 (1), 65–84. doi:10.1080/21681376.2021.1882883
- Talen, E. and Koschinsky, J., 2013. The walkable neighborhood: a literature review. International journal of sustainable land use and urban planning, 1 (1). doi:10.24102/ijslup.v1i1.211
- Tapsuwan, S. and Polyakov, M., 2016. Correctly specifying environmental assets in spatial hedonic pricing models. Society & natural resources, 29 (2), 233–249. doi:10.1080/08941920.2015.1024808
- Thayer, M., Albers, H., and Rahmatian, M., 1992. The benefits of reducing exposure to waste disposal sites: a hedonic housing value approach. Journal of real estate research, 7 (3), 265–282. doi:10.1080/10835547.1992.12090680
- Tu, C.C. and Eppli, M.E., 1999. Valuing new urbanism: the case of Kentlands. Real estate economics, 27 (3), 425–451. doi:10.1111/1540-6229.00779
- Tu, C.C. and Eppli, M.J., 2001. An empirical examination of traditional neighborhood development. Real estate economics, 29 (3), 485. doi:10.1111/1080-8620.00019
- Turrell, G., et al., 2013. Can the built environment reduce health inequalities? A study of neighbourhood socioeconomic disadvantage and walking for transport. Health & place, 19, 89–98. doi:10.1016/j.healthplace.2012.10.008
- UN Habitat, 2016. Urbanization and development: emerging futures. World cities report. Nairobi.
- United Nations, 2016. Resolution adopted by the General Assembly on 23 December 2016: new urban agenda.
- US Environmental Protection Agency, 2022. Environmental justice. https://www.epa.gov/environmentaljustice/equitable-development-and-environmental-justice
- Watts, N., et al., 2015. Health and climate change: policy responses to protect public health. The lancet, 386 (10006), 1861–1914. doi:10.1016/S0140-6736(15)60854-6
- Wen, H., et al., 2020. An empirical study of the impact of vehicular traffic and floor level on property price. Habitat international, 97, 102132. doi:10.1016/j.habitatint.2020.102132
- Whitehead, C.M.E., 2007. Planning policies and affordable housing: England as a successful case study? Housing studies, 22(1), 25–44. doi:10.1080/02673030601024580
- WHO Commission on Social Determinants of Health and World Health Organization, 2008. Closing the gap in a generation: health equity through action on the social determinants of health: Commission on Social Determinants of Health final report. Geneva: World Health Organization.
- Wilson, E.K., 2015. Gentrification and urban public school reforms: the interest divergence dilemma. West Virginia law review, 118, 677.
- Xiao, Y., Webster, C., and Orford, S., 2016. Identifying house price effects of changes in urban street configuration: an empirical study in Nanjing, China. Urban studies, 53 (1), 112–131. doi:10.1177/0042098014560500
- Zhang, H., 2011. School desegregation and white flight revisited: a spatial analysis from a metropolitan perspective. Urban geography, 32 (8), 1208–1226. doi:10.32.8.1208/0272-3638.32.8.1208