
ABSTRACT
Research indicates benefits to psychophysiological wellbeing from walking in urban green space compared to other built settings. This study builds on research in older adults extending the protocol to healthy adults (n = 40, mean age = 42 years) exploring the impacts of walking in varying environmental conditions on psychophysiological outcomes (mood, working-memory and heart rate variability (HRV)). Participants undertook a short (20–30 minute) walk in both an urban green and gray setting, one week apart, with varying levels of air pollution and heat. Walking in the urban green setting increased positive mood and HRV (suggesting positive impact on physiological stress) and decreased self-reported stress and arousal. Thermal sensation in the urban green setting was lower compared to the urban gray setting. Our results build on evidence that there are potential beneficial effects of urban green settings with respect to heat and particulate matter (PM2.5). These results show psychophysiological benefits of short walks within urban green settings, during the pandemic, which has implications for public health and how we engage with our local environments for physical activity.
Introduction
The 2018 Physical Activity Guidelines for Americans (2nd Edition), recommends that for substantial health benefits, adults should undertake at least 150 minutes of moderate-intensity activity per week, with additional health benefits reached beyond 300 minutes (CDC Citation2018). However, the Center for Disease Control recently estimated that only 53.3% of adults nationally across the US, aged over 18, are meeting this basic requirement (CDC Citation2021). This figure is estimated to be even lower in Richmond, VA where the 2017 Community Health Assessment (Richmond City Health District Citation2017) highlighted some stark realities for the City, including only 31.1% of the City’s population meeting the 150 minute moderate-intensity physical activity guidelines (Leavitt Citation2008, CDC Citation2018). The report underscores the seriousness of the issue, with sedentary behavior resulting in a similar numbers of deaths per year as smoking. These findings contributed to a recommendation to improve levels of physical activity in the community as part of the Community Health Plan (CHP). Furthermore, the Community Health Assessment identified issues surrounding mental health, with 20.7% of Richmond residents reporting to having a depressive disorder (against 16.5% statewide) and 13.7% reporting poor mental health.
Urbanization generally has become a public health issue with the World Health Organization predicting that 68% of the world’s population will live in urban spaces by 2050 (United Nations Citation2018). Further consideration also needs to be made with regards to air quality and subsequent changes in air temperature that further urbanization can lead to and their effects on these local environments in which physical activity may take place, with recent research suggestion short term exposure to traffic exhaust can reduce health benefits of exercise in older people (Sinharay et al. Citation2018). Previous research from this group and others have analyzed neighborhood level and individually experienced temperature across urban settings and urban compared to rural areas (Kuras et al. Citation2015, Scott et al. Citation2017, Hoffman et al. Citation2020, Wang et al. Citation2021). There is then the need to identify beneficial spaces within a city in which to engage with physical activity that will also reap benefits for mental health.
One simple way of improving physical health is to engage in walking (Celis-Morales et al. Citation2017), which further delivers mental health benefits including improved cognitive health and reduced risk of depression and anxiety (Macpherson et al. Citation2017), suggesting that walking could play an important role in improving public health outcomes in Richmond and across the US. Walking in natural environments, including urban green space, has been shown to be beneficial for both psychosocial wellbeing (Bratman et al. Citation2015, Gidlow et al. Citation2016), cognitive, working memory performance (Berman et al. Citation2008, Citation2012), heart rate variability (Kondo et al. Citation2018, Twohig-Bennett and Jones Citation2018, Roe et al. Citation2019, Citation2020) and on brain activity (Aspinall et al. Citation2015, Chen et al. Citation2016, Tilley et al. Citation2017, Neale et al. Citation2020). The mechanism responsible for these beneficial effects may be elicited by the restorative properties of natural spaces (Kaplan and Kaplan Citation1989, Kaplan Citation1995, Citation2001) that reduce the demands placed on attentional capacities by busy environments (Mulckhuyse and Theeuwes Citation2010). The theory that underpins these mechanisms is Attention Restoration Theory (Kaplan and Kaplan Citation1989, Kaplan Citation1995, Citation2001) which posits that environments, particularly green and/or natural spaces, can facilitate the restoration of depleted cognitive resources. There are multiple components of this theory that suggest the mechanism for these effects comes from a combination of “being away”, “compatibility”, “coherence” and “fascination”, “being away” refers to either a physical or conceptual break from a stressor/task that promotes restoration; “compatibility” refers to the restorative space being one that aligns with personal preference or upbringing; “coherence” refers to the setting being simple and making sense to the beholder, not a space that is confusing or overwhelming and; “fascination” refers to stimuli within the space that is of interest to the individual and engages their attentional resources in a bottom-up manner. At the time of writing, there is no evidence that postulates a ratio of these components that produce optimal restoration, rather the theory suggests that these components are present in psychological restoration.
This theory is complemented by Stress Reduction Theory (Ulrich et al. Citation1991) that suggests that psychophysiological stress is reduced when exposed to green spaces post exposure to a stressor (Ulrich et al. Citation1991, Kondo et al. Citation2018). This theory is supported by evidence from brain activity measures, in response to green space exposure, that show increases in alpha activity, associated with relaxed states (Ulrich Citation1981, Neale et al. Citation2020), while exposure to virtual greenspace is associated with decreased galvanic skin conductance, a stress biomarker, when compared with a control setting (Knaust et al. Citation2021). Recent physiological research has focused on the role of green and outdoor spaces on heart rate variability (HRV), a stress and anxiety biomarker that demonstrates the beat-to-beat intervals of participant heart rate (Kondo et al. Citation2018). Studies have shown benefits on HRV from both passive (Elsadek et al. Citation2020) and active (walking) exposure (Hystad and Cusack Citation2019) to green spaces, an effect supported in a recent meta-analysis (Mygind et al. Citation2021) which demonstrated both seated and walking exposure to green spaces resulted in HRV benefits over that of control conditions. Both Stress Reduction Theory and Attention Restoration Theory demonstrate potential mechanisms for the restorative effects of nature, but there is a need for advancing research paradigms that blend cognitive, physiological and other psychological (e.g. self-reported measures of stress) outcomes.
Further to the mental and physiological benefits of walking in nature, recent research has suggested that “green mobility”, that is the increase of neighborhood greenness, can reduce the risk of obesity (Gailey et al. Citation2021). The environmental mediation – specifically, the reduction in the intensity of both heat and air pollution (particulate matter [PM2.5])–provided by urban green spaces has been well established elsewhere (Bowler Citation2010, Chen et al. Citation2019, Kruize et al. Citation2019), but little has been explored in regards to the psychosocial benefits that these environmental differences may confer to urban green space users.
Aims and rationale
This study replicates and advances a protocol established for capturing mobility, environmental interactions and health and wellbeing outcomes carried out in older adults in Richmond (Roe et al. Citation2020). The study showed beneficial effects of urban green space on mood and heart rate variability in a small sample of older adults (n = 11). The present study is conducted in Richmond, Virginia, a mid-Atlantic city, made up of various outdoor spatial typologies such as riverside walkways, pocket parks, industrial spaces and urban spaces high in vehicular traffic. The city’s urban design, an expression of urban planning decisions made decades in the past (Hoffman et al. Citation2020), has significant relationships with extreme heat disparity within the city (Shandas et al. Citation2019, Saverino et al. Citation2021) as well as air quality patterns (Eanes et al. Citation2020). While these issues underpin the rationale for the current study, they are typical of mid-large cities across America.
Our present study extends the protocol in a larger sample of healthy adults while including additional measures relating to working-memory, air temperature and thermal comfort. The aim of the study is to understand how walking in urban environments impacts real-time physiological data, attention and psychological mood and further explore relationships between this and real-time environmental data (temperature, air/noise pollution).
Building on our previous results, we formed the following hypotheses;
There will be a direct benefit to psychological wellbeing (as measured by mood outcomes) from walking in an urban green setting when compared with an urban gray setting.
There will be a direct benefit to physiological stress, as measured by heart rate variability form walking in the urban green setting when compared with the urban gray setting.
There will be improved working-memory performance post-walking in the urban green setting when compared to the urban gray setting.
Temperatures will be higher walking in the urban gray setting, resulting in lower levels of thermal comfort and higher levels of thermal sensation, when compared to the temperature and subsequent thermal comfort from walking in the urban green setting.
In addition to our hypotheses, we sought to understand if environmental characteristic variables (e.g. noise, temperature) can predict psychophysiological outcomes, in a mixed-effects regression model.
We tested the above hypotheses using the mechanism of a walk in two distinctly dichotomous environmental settings with different spatial and environmental characteristics: an urban gray walk in a busy, trafficked urban district versus an urban green walk in an adjacent but quieter residential district with front gardens, street trees and a pocket park. Using a walk as the outdoor exposure mechanism replicates our prior protocols in environment-health research (Roe and Aspinall Citation2011, Aspinall et al. Citation2015, Neale et al. Citation2017, Citation2020, Tilley et al. Citation2017, Roe et al. Citation2019, Citation2020).
Methods
Subjects
Participants were healthy adults (n = 40, M = 42 years old, SD = 17.6) living in Richmond, Virginia, recruited by purposive sampling methods to ensure they met the required inclusion criteria via the Science Museum of Virginia (SMV) social media and volunteer lists, but also restricted by COVID-19 protocols and restrictions at the time of testing. All participants were required to be able to walk, unassisted by another person, for at least 15 minutes. Ethical approval for the study was provided by the University of Virginia Institutional Review Board for Health Sciences Research (IRB-HSR; # 21839). Participants were paid a $10 Amazon voucher for completion of each experimental session ($20 total payment for those who completed both sessions).
Outcome measures
Measures of psychological and physical wellbeing
Mood
Mood measured using the short version of the University of Wales Institute of Science and Technology (UWIST) Mood Adjective Check List (MACL) which measures participants hedonic tone, stress and arousal (Matthews et al. Citation1990). The scale used requires participants to respond to 12 descriptive statements (e.g. “energetic” or “happy”) relating to how they feel at the present moment, which they respond to on a 4-point scale [definitely, slightly, slightly not, definitely not], with each point scored from 1 to 4. Each subcomponent (hedonic tone, stress and arousal) is measured across four descriptors and scores for each range from 4 to 16 with higher scores indicating higher hedonic tone (positive valence), stress or arousal.
Thermal sensation and comfort
Thermal Sensation and Comfort measured using two, single question, items (Zhang Citation2003). Thermal sensation data was collected on a 9-point scale [very cold to very hot] responding to the single item prompt “please rate your current overall thermal sensation”. Each point was scored from 1 to 9, with higher scores indicating hotter thermal sensation. Thermal comfort data was collected on a 6-point scale [very uncomfortable to very comfortable] in response to the prompt “please rate your current overall level of thermal comfort”. Each point was scored from 1 to 6 with higher scores indicating increased thermal comfort.
Working memory
Working memory
Working memory measured by the digit-backwards task, a common neuropsychological test (Blackburn and Benton Citation1957) that has been consistently used in measures of human intelligence (Wechsler Citation1958). Crucially for this study, the task has shown to be sensitive to changes from exposure to nature vs. urban spaces (Berman et al. Citation2008, Citation2012). The task presents participants with a sequence of digits, presented at a rate of one digit/second, of increasing sequence lengths of which participants must type the sequence in reverse order. In this study, participants were presented with two sequences of equal length, before continuing to the next two sequences of incremental length. Sequences begun at 2-digits in length and finished at 7-digits in length. A working memory score is the value of the longest sequence that participants correctly identify over two trials (ranging from 2 to 7).
Physiological measures
Real-time stress was captured during the walk using an android smart watch (Huawei Watch2) capturing heart rate (used to calculate heart rate variability) and walking speed. We used an in-house built app to collect 100 HZ Photoplethysmogram (PPG), 60 Hz accelerometer, 1 HZ sound amplitude, and 1/60 HZ GPS data (Boukhechba and Barnes Citation2020). The PPG signal used to estimate HRV was processed using bandpass filters to reduce motion artifacts, capturing beat-to-beat interval variability of heart rate and is the most robust and consistent measure of physiological stress in real-time outdoor data capture (Kondo et al. Citation2018). HRV was measured using Root Mean Square of Successive Differences (RMSSD) between normal heartbeats using 30 seconds time windows. Higher HRV values are associated with lower stress and vice versa.
Air pollution and other environmental factors
Real time air-quality measurements were collected during the walking sessions with handheld mobile devices. Air quality was measured by the AirBeam2 which detects particulate matter with a diameter equal to or smaller than 2.5 micron (PM2.5), held between 1 and 2 meters from the ground. The AirBeam2 is a low-cost air quality measurement device developed for community-based environmental assessment. While low-cost, California’s Air Quality Sensor Performance Evaluation Center finds that AirBeam2 sensors had good correlation with high performance sensors from both the field (R2 0.65-0.70) and laboratory studies (R2 > 0.87). PM2.5 readings were collected at least once per second as participants walked along their routes.
Light intensity, measured in lux (lumens per square meter), were also captured by the Huawei smartwatch, worn on participants’ wrists. Ambient noise levels, measured in decibels, A-weighted, (dBA), were collected by the AirCasting app using the onboard microphone on a BLUE Vivo XL3 smartphone, worn facing outward, between 1 and 2 meters from the ground.
Temperature
Temperature measurements were collected during the walks using an iButton (Maxim Integrated Citation2021) which was placed via crocodile clip on the participants shoes. The iButton records ambient air temperature every 60 seconds. Due to a data download error, we were only able to retrieve data for analysis from the 2nd study day (3rd September 2020). The particular route we used for the urban gray walk had significantly less urban greenery; however, participants were walking on asphalt in both conditions. We do acknowledge that there may be increased heat recorded near the ground due to reflection from asphalt, as measured by the iButton.
Study design and procedure
We employed a repeated-measures, cross over design, ensuring participants act as their own control. Of the 40 recruited participants, 30 completed both walking conditions; the remaining 10 attended a single session. Participants were randomly allocated to one of two possible walking conditions that would determine if they undertook the green or the gray route in their first or second session. Participant sessions were a week apart (Session 1: August 27th, 2020, Session 2: September 3rd, 2020) and matched for time of day so that participants experienced the walks in the same light and traffic conditions. Both testing days exhibited similar baseline meteorological conditions (Aug 27th: Max: 89.4F, Min 78.8F, windspeed: 3.0 mph average, partly cloudy; 3 September 2020: Max: 96.6F, Min 74.7F, windspeed: 2.0 mph average, scattered clouds), so seasonality was not dramatically different between testing days.
Participants arrived at SMV and shown to a personal table where they were instructed and assisted by the research team to put on their Watch2 and iButton as well as setting up their AirBeam2 sensor. Following this, participants completed a pre-walk assessment that included mood, cognition and thermal comfort measures on an individual tablet device. Participants then undertook their walk in groups of up to 10, following a researcher on their allocated route for their session. Participants were encouraged to take in their environment and limit social interactions with other members (in addition to maintaining social distancing). While participants walked in groups, they were encouraged to walk at their own pace, irrespective of others in the group. A researcher followed the group for safety and to ensure no participants got lost on the route. Upon returning to SMV, participants completed a post-walk assessment of mood, cognition and thermal comfort before returning their devices and concluding their experimental session.
As this data collection was undertaken during COVID-19 restrictions on public gatherings, social distancing, mask-wearing and frequent hand sanitizing was in effect for both the research team and the participants in line with the Commonwealth of Virginia guidelines at the time of data collection.
Walking routes
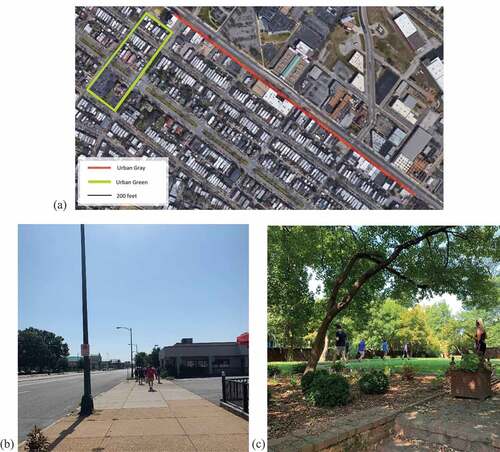
The two walk routes replicated those used in previous research by our team (Roe et al. Citation2020), selected on the basis of significantly different levels of green space and gray infrastructure. The urban gray walk comprised 89% gray infrastructure and 11% green infrastructure, compared to the urban green walk that comprised 59% gray and 41% green infrastructure.
The urban gray walk was characterized by a wide road system (4-lanes) with heavy traffic (including trucks and buses), a wide sidewalk with shops and restaurants fronting onto it, a flat gradient, and incorporated some minor pedestrian road crossings. It was linear in spatial composition (see below). The urban green walk was characterized by a narrower road system (two lanes), street trees, residential dwellings with setbacks and front gardens, and included a small park, some historic buildings, and some road crossings. The crossings include a section of Monument Avenue which, during 2020, was the site of various protests related to the Black Lives Matter movement. It was circular (no doubling back on the route) in spatial composition. Walks in both conditions were completed in 20–30 minutes on the study days.
Figure 1. (a) Walking route map for both urban gray and urban green walks. Examples of urban gray and urban green walks shown in panels (b) and (c), respectively.
Statistical analyses
Mood
Our first analysis of the MACL output looked to determine any differences in mood between participants pre-walk, checking that baseline mood is stable between sessions. We used paired t-tests to assess changes between pre-walk outcome measures (Hedonic Tone, Stress and Arousal) between walking sessions (e.g. pre-urban gray vs. pre-urban green).
For our second analysis, change scores (post-walk score minus pre-walk score) were computed for each of the MACL components and analyzed using independent samples t-tests on each of the three outcome measures (Hedonic Tone, Stress and Arousal). This would determine any significant difference between the impact of the route on mood, as determined by the magnitude of the change scores. Effect sizes were calculated using Cohen’s d, which is the mean difference divided by the pooled standard deviation of readings for each condition (Cohen Citation1988, Lakens Citation2013).
Thermal sensation and comfort
We undertook the same analysis procedure as in 2.5.1 for the thermal sensation and comfort outcomes; first, assessing baseline change between pre-walk measures of both thermal sensation and comfort to ensure baseline thermal comfort is stable between sessions; second, creating change scores to understand impact of the walking route.
Working memory
We undertook the same analysis procedure as in 2.5.1 for the working memory outcomes; first, assessing baseline working memory is stable between sessions, secondly, creating change scores to understand impact of the walking route on working memory outcomes.
Physiological outcomes
A linear mixed effects model was used to determine differences in HRV between urban gray and urban green conditions. Since data consist repeated physiological observations nested within individual participants, we use a multilevel modelling approach with random intercepts for participants. In addition, time passing from the start of a participant’s walk is included as a random slope to account for variation in HRV over time. The models were fit using full information maximum likelihood estimation, using Stata’s “mixed” command.
AirBeam2 emission comparisons
An independent samples t-test was used to compare PM2.5 readings between urban gray and urban green conditions. The t-test compares whether readings of particulate matter levels in the two environments are significantly different. As per 2.5.1, Cohen’s d was used to determine the overall effect size of this result.
Temperature
Timestamped temperature data was extracted from the iButtons for each walking session and data prior to walk start time was removed for subsequent analysis. In order to assess built environment effects on individually-experienced temperature, we compared recorded temperatures to those collected from the nearest weather station in Richmond (Station ID# KVARICHM255, Lat: 37.56Lon: −77.46 (https://www.wunderground.com/dashboard/pws/KVARICHM255). Weather Station (WS) temperature time resolution is every 5 minutes. Average temperature difference between individually experienced and weather station data during each walk was calculated and differences between urban gray and green walks were evaluated. Repeated measures mixed effects linear regression was employed to test differences in individually experienced temperatures on the urban gray versus urban green walks, accounting for time of day and temperatures recorded at the nearest weather station.
Multi-outcome analysis
In order to assess potential interconnections between environmental, physical and physiological data, we use a linear mixed effects model to examine interactions between urban condition (urban green and urban gray) and environmental measures (PM2.5, dB, and light). Since data consist repeated physiological observations nested within individual participants, we use a multilevel modelling approach with random intercepts for participants. The models were fit using full information maximum likelihood estimation.
Results
Demographics
Full participant demographics from the study participants are presented in , below. Participant demographics for each walking session can be found in the Supplementary Materials.
Table 1. Participant demographics.
Health variables
Degrees of freedom alter throughout the results due to missing/not collected data (see Supplementary Materials for full breakdown)
Mood
We found no statistically significant differences between baseline measures of hedonic tone (t(27) = 1.97, p = .06), stress (t(27) = .82, p = .42) or arousal (t(27) = 1.28, p = .211). We therefore proceeded to our second analysis to explore differences in mood post-walk between the green and gray walking conditions.
Paired t-tests compared each of the mood outcomes between walking locations. To this end, there were three pairs: (1) hedonic tone (gray vs. green change scores), (2) stress (gray vs. green change scores) and (3) arousal (gray vs. green change scores). We found statistically significant differences between each pair; hedonic tone (t(25) = −4.96 p < .001, d = 1.18), stress (t(25) = 2.67, p = .013, d = .61) and arousal (t(25) = −.64, p = .016, d = .58), all with medium to large effect sizes. We display the mean change scores to illustrate these differences in
Figure 2. Change scores by location and mood outcome. A bar above zero denotes positive change on hedonic tone and arousal, and below zero, a positive change on stress. Significant differences between outcomes (by route) are denoted by * (p < .05).
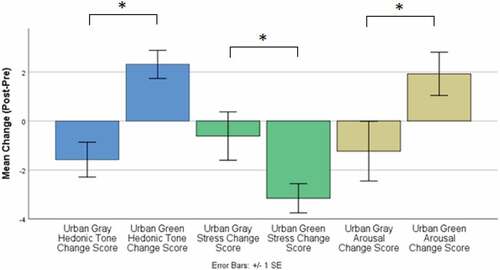
Firstly, the hedonic tone bars (blue) show that positive mood improved post-green walk but decreases post gray walk. Secondly, there was a significant difference in stress (green bars), with those walking in the green condition showing greater stress reduction. Finally, arousal (vigor) increased (beige bars) from walking in the urban green condition and decreased in the urban gray walk.
Thermal sensation and comfort
The initial analysis of subjective thermal sensation and comfort between baseline, pre-walk, assessments showed no significant difference between either the thermal sensation (t(27) = −.45, p = .66) or comfort (t(27) = 1.27, p = .22). This suggests subjective thermal response pre-walk was stable between the two walk sessions.
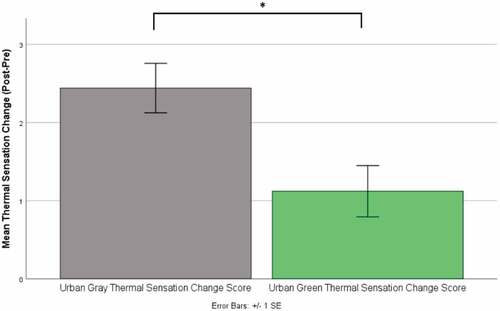
The second analysis used change scores to compare the impact of urban green vs. urban gray walks. There was a statistically significant difference between the change scores in thermal sensation between the two walking conditions (t(24) = 2.78, p = .01, d = .82). As shown below (), both walking conditions lead to a positive change in thermal sensation, indicating that both groups felt hotter post walk; but participants felt significantly hotter from the urban gray walk than the urban green walk. There was no statistically significant effect of walking condition on thermal comfort (t(27) = .63, p = .53, d = .19).
Figure 3. Change in thermal sensation between urban gray and urban green settings (positive value indicates hotter thermal sensation post walk). Significant differences between outcomes (by route) are denoted by * (p < .05).
Digit back
Backwards digit-span results
First, the initial t-test analysis on working memory between baseline, pre-walk, assessments showed no significant difference (t(28) = 1.71, p = .09), suggesting working memory was stable between the two walking sessions. Second, the paired t-test result on the change scores between urban green and urban gray impacts on working memory performance showed no statistically significant difference (t(26) = .208, p = .84, d = .06).
HRV
The results of the linear mixed model accounting for repeated measures within participants and time passage during the walk is reported as Model 1 in . The coefficient comparing HRV within the urban gray condition to the base condition of urban green is −0.757 (Z-score = −11.34, p < 0.001). Stata’s “margins” command estimates HRV in each condition keeping all other factors at their means, including the 95% confidence interval around each estimate, shown in . The standardized coefficient for the difference between urban gray and urban green is −0.071, suggesting a small increase in stress overall in the urban gray conditions compared to urban green.
Figure 4. Heart rate variability results between urban green and gray settings. Higher heart rate variability is an indicator of lower stress response.
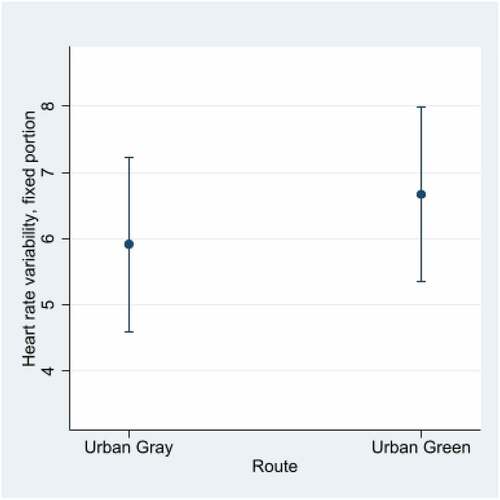
Table 2. Effects of route and environmental stressors on heart rate variability.
Environmental variables
Air quality (AirBeam2)
A t-test between the PM2.5 outcomes in both the urban gray (M = 11.56, SD = 8.33) and urban green (M = 8.58, SD = 4.16) condition showed a statistically significant difference between conditions (t(59,723) = −58.79, p < .001, d = .42), with a moderate effect size. The mean outcomes show that PM2.5 levels are higher in the urban gray condition in comparison to the urban green condition.
Temperature (iButton)
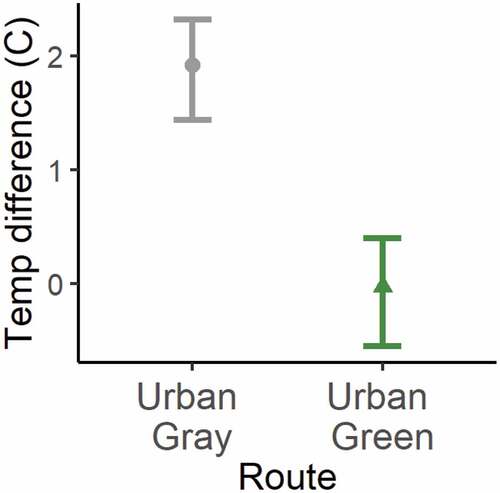
We analyzed n = 775 participant iButton temperature measurements; n = 364 (47%) in the urban gray condition and n = 411 (53%) in urban green condition. The temperatures recorded show high temperatures across the study sessions (urban gray and urban green) which are supported by similar values from the local weather station (WS) for the area. Average temperatures experienced during the urban gray walk were 36.6°C (SE = ±0.1) versus 34.2°C (SE =±0.3) during the urban green walk, compared to 33.0°C (SE = ±0.1) recorded at the nearest weather station to where the walks took place. Urban gray walkers experienced higher temperatures compared to temperatures recorded at the nearest weather station (average increase of 1.92 (SE = ± 0.25°C)), while urban green walkers experienced similar temperatures to those recorded at the nearest weather station (). In mixed effects linear regression, participant iButton temperatures on the urban green route on average are 1.77 (95%CI 0.94 to 2.59) °C lower compared with the participant iButton temperatures on the urban gray route, adjusting for time of day and ambient temperatures recorded at the nearest weather station.
Figure 5. Temperature difference (Celsius) from nearest weather station on urban gray and urban green walking conditions on 3 September 2020. The mean of temperature difference (Celsius) and their 95% confidence intervals are shown.
Synthesis of data
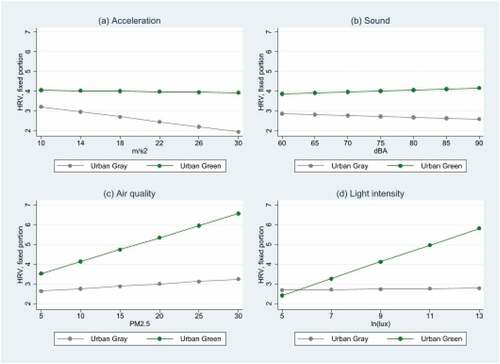
We examined the relationship between environmental, physical and physiological data collected while participants were walking. Model 2 in builds on the base model examining HRV across route conditions, adding fixed effects of PM2.5, light intensity (ln lux), acceleration (m/s2) and sound (dbA) as independent variables, shows significant interactions among walk condition (urban green vs. urban gray) and environmental data. The results show significant main and interaction effects for most environmental stressors, as well as acceleration. There is no significant main effect for acceleration, though the interaction between acceleration and urban condition is significant. illustrates the overall effects of: (a) acceleration, (b) noise, (c) air quality (PM2.5) and (d) light intensity on HRV in both the urban gray and urban green conditions. The results suggest that differences in HRV between gray and green conditions are accentuated under conditions of increased environmental exposure, where green environments may have a moderating effect.
Figure 6. Heart-rate variability: interactions among urban condition and environmental stressors. Higher RMSSD values indicate higher heart rate variability, an indicator of lower stress.
Discussion
This study builds on previous work (Roe et al. Citation2020) in Richmond (Virginia, USA) towards understanding the role of walking in varying urban environments on psychophysiological responses. We assessed participants’ psychological wellbeing, physiological stress, working memory and thermal sensation and comfort pre- and post-a short walk in urban green and gray spaces. We explored interactions between these health measures and real-time metrics of air quality, temperature and ambient sound.
Our results confirm Hypothesis 1 (Section 1.1) that posited direct improvement in psychological wellbeing, as measured by the MACL, in the urban green condition compared to the urban gray condition. We show statistically significant improvements across three mood outcome measures (MACL), with benefits to hedonic tone, stress and arousal from walking in the urban green condition when compared to the urban gray condition. Results indicate a negative impact of walking in an urban gray setting on mood (hedonic tone and arousal). However, in both urban conditions, stress decreased as a result of walking. This finding is aligned with prior research showing reductions in psychophysiological stress while walking in nature (Horiuchi Citation2013, Gidlow et al. Citation2016, Olafsdottir et al. Citation2020, Roe et al. Citation2020), further supporting the important role of urban green space in subjective stress regulation (Tyrväinen et al. Citation2014).
Our results show differences in physiological stress outcomes between conditions with increases in HRV (indicating greater resilience to stress) in the urban green versus urban gray condition, as per our hypotheses (Hypothesis 2). This replicates our previous finding in older adults (Roe et al. Citation2020) and additional evidence suggesting physiological benefits from walking and being present in urban green spaces (Gidlow et al. Citation2016, Kondo et al. Citation2018). However, the result presented in this work must be considered with caution, and be replicated across a spectrum of greenness intensities, due to the small effect size calculated for this overall effect. The mixed-effects regression model shows additional benefits of the urban green setting when compared to the urban gray setting, specifically buffering negative effects of sound (dB), air quality (PM2.5) and increased walking speed on HRV. Despite the relatively short exposure time, we see improvements in HRV in the urban green setting relative to the urban gray setting when accounting for the impact of air quality, walked speed and ambient sound. These findings are important as they suggest how important design of urban public space could be as a public health tool in improving both physiological and, as per our psychological mood results, psychological health and wellbeing.
Various studies have shown cognitive benefits of walking and/or exposure to nature (Berto Citation2005), including positive impacts on working memory (Berman et al. Citation2008, Citation2012). The results presented here however, did not support Hypothesis 3, which suggested a direct improvement in working memory performance post urban green setting. Further, the calculated effect size does not suggest that this was an issue related to sample size. There are multiple possible explanations for this; the first is the length of exposure. The participants in the present study completed their walks within a shorter period of time (20–30 minutes) when compared to the exposure in the Berman studies (50–55 minutes). Previous work has suggested that the presence and proximity of neighborhood green space may facilitate the maintenance of a long-term walking regime (Sugiyama et al. Citation2013). Second, the settings used previously include an arboretum (Berman et al. Citation2008, Citation2012), as opposed to our “urban” green setting, suggesting that the quality or intensity (as measured by tree canopy percentage, for example) of the green setting may play a pivotal role in modulating working memory performance. We explore participants walking in urban green space, but further work may wish to build on the emerging literature on differing “activity type” within nature (Coventry et al. Citation2019) and understand the impact ambient environmental factors, such as air quality, sound and temperature, play within these different urban green space activities.
Participants in the urban gray setting were significantly warmer than those in the urban green setting, as predicted by Hypothesis 4; a finding supported by the iButton data that showed increased experienced air temperature in the urban gray setting relative to the urban green setting and relative to weather station data. Despite the differences in subjective change in thermal sensation, as well as the real-time temperature data supporting this change, there was no significant difference on perceived thermal comfort, contrary to our prediction in Hypothesis 4. However, these walks were completed during high heat (average temperatures 34.2–36.6°C). Outdoor thermal comfort depends on both environmental and behavioral variables (Chen and Ng Citation2012), including seeking shade from the sun at extreme temperatures. Recent research has suggested that people in Beijing do not actively seek shade from sun and heat when temperatures range from 19.2°C to 29°C (Xue et al. Citation2021). In Richmond, city design has led to the unintended creation of urban heat islands (Shandas et al. Citation2019, Hoffman et al. Citation2020, Saverino et al. Citation2021) that contribute to the increased temperatures that could be mitigated through spatial mapping and tactical urban interventions (Tieskens et al. Citation2022), thus potentially improving wellbeing outcomes when exposed to these spaces. We show here that these increased temperatures are paired with increased levels of PM2.5 in urban gray settings, an air pollutant that is harmful, in high quantities, to health.
These results demonstrate how walking in urban green settings can benefit acute psychophysiological measures of health and wellbeing. The implications of this are important to understand from both a planning and public health perspective. For planners, we begin to show how features of the environment, such as light, sound and air quality, play an important role in predicting psychophysiological stress responses to space. In terms of public health, our results support the notion that walking has psychological (and physiological) health benefits in our sample of healthy adults, aligning with the CDC advise to the (US) population to maintain physical activity (CDC Citation2018). Our research, while not a sufficient proxy for mental health treatment, indicate multiple beneficial effects of undertaking frequent walks in local, urban green space, to maintain physical fitness and mental wellbeing. Moreover, our results reinforce interpretations of a growing awareness that green space is an urban privilege borne out of historical land use policies that were racially discriminatory in practice (Hoffman et al. Citation2020, Nardone et al. Citation2021), and underscore the need to broaden participation in research works seeking to understand the benefits of urban green space on underrepresented and marginalized communities. As we, hopefully, emerge from the worst of the restrictions brought about by the COVID-19 pandemic, it served as a reminder for the need to create and maintain quality open space for active living (CDC Citation2020).
Our results build on our previous research in older adults (Roe et al. Citation2020). However, replication of this study protocol during different seasons would be recommended in order to understand how this may impact the results. While we were able to hold climatic conditions constant for the purpose of this study, further research may wish to explore seasonal variations in this effect. Richmond is a four-season city, so assessments out of summer months would be interesting to understand a complete, annual, impact of its urban spaces on health and wellbeing. Research has shown PM2.5 to be susceptible to both diurnal and seasonal variation (Liu et al. Citation2015), so understanding if the benefits of urban green space hold throughout seasonal changes could be important with regards to public health recommendations.
While our sample size here was sufficient to detect statistical significance in both psychological and physiological changes between urban conditions, there is need to replicate these results – particularly the physiological. We were constrained by the days we could physically run this study due to COVID-19 protocols (summer 2020), including limited opening times, social distancing, and enhanced cleaning protocols, all of which impacted the number of participants we could recruit. A further consideration would be to explore if these results vary across the lifespan. Public space should be an equitable space for all (Jennings et al. Citation2017), so understanding differences within age groups or other socio-demographic factors (such as gender and ethnicity, where our sample is somewhat skewed) is important. Recent research has shown that socio-demographic factors influence the impact of urban green space on mental health outcomes in older adults (Lee and Lee Citation2019), as well as those who live nearer to green space having less reduction on leisure time activities during the COVID-19 restrictions (Yang et al. Citation2021).
Conclusion
This study provides further direct evidence towards the psychophysiological benefits of walking in urban green space, when compared to walking in urban gray space. Additionally, we show that this effect may be influenced by ambient environmental factors, including temperature, sound and air quality.
Supplemental Material
Download PDF (223.7 KB)Acknowledgements
The authors would like to thank Brian Kusiak for on-site support during data collection on study testing days, as well as for the photos used in .
Disclosure statement
No potential conflict of interest was reported by the author(s).
Supplementary material
Supplemental data for this article can be accessed online at https://doi.org/10.1080/23748834.2022.2123763
Additional information
Notes on contributors
C. Neale
C. Neale is a researcher and lecturer at the University of Huddersfield interested in understanding how urban and green environments can impact health and wellbeing in a range of participants, but with particular interest in older adults. His background is in cognitive neuroscience, and he continues to use various neuroimaging methods to assess brain activity in research populations.
J. Hoffman
J. Hoffman is the David and Jane Cohn Scientist at the Science Museum of Virginia and an Affiliate Faculty in the L. Douglas Wilder School of Government and Public Affairs and the Center for Environmental Studies at Virginia Commonwealth University. Jeremy specializes in Earth science communication, data-driven and community-based participatory science, and science center exhibit content development. Jeremy’s work has been highlighted on the Grist 50 and written about in the in various national and local news sources. Jeremy also authored a contribution to the Richmond Racial Equity Essays Project, which was republished in Greater Greater Washington.
D. Jefferson
D. Jefferson has spent his career in program management centered around youth development in both formal and informal settings. With an educational background in biology, Devin has developed and executed high-quality STEM programming with various community partners. His experience includes management and leadership roles with multiple Boys & Girls Clubs and science centers, as well as time as the community relations manager for a charter school in New York. Devin leads the Museum’s RVAir program, a community science initiative to study air quality, and is an authority on the process and importance of embedded citizen science efforts.
J. Gohlke
J. Gohlke is an Associate Professor of Environmental Health in the Department of Population Health Sciences in the Virginia-Maryland College of Veterinary Medicine at Virginia Tech. Her research interests include the human health implications of global environmental change and risk assessment after large scale environmental disasters, bioinformatic and alternative modelling techniques for understanding the molecular underpinnings of environmental effects on human health.
M. Boukhechba
M. Boukhechba is an assistant professor in the Engineering Systems and Environment Department and the co-director of the Sensing Systems for Health Lab. His primary research interests are in ubiquitous computing, data science, behavioral modelling and pervasive health technologies. In recent years, he has been developing novel ubiquitous sensing platforms to understand human behaviors in the wild. His research has been focused on designing new assessment and intervention methods for multiple health conditions such as depression, anxiety, cancer, infectious disease and traumatic brain injury.
A. Mondschein
A. Mondschein is an associate professor of urban and environmental planning at the University of Virginia School of Architecture. He studies transportation systems and travel behavior, seeking to foster equitable, sustainable accessibility in cities and regions. He addresses a rapidly changing terrain of transportation and information technologies, identifying means to assert social imperatives during a period of urban transformation. His research emphasizes the role of information and knowledge in fostering individual- and community-level capability and control over mobility.
S. Wang
S. Wang is a postdoctoral fellow in the Measurement and Regulatory Science (MaRS) Fellowship program. Her research focuses on designing, selecting, evaluating clinical outcome assessments (COAs), integrating COAs in clinical trials, and surveying outcomes and preferences in patient-centered drug research development. She received her PhD in Translational Biology, Medicine, and Health from Virginia Tech with a concentration in Health Implementation Sciences.
J. Roe
J. Roe is an environmental psychologist who explores how our interactions with the world shape our health, wellbeing and behaviors. She specializes in understanding how access to restorative environments in our cities create and sustain our health and wellbeing. Her research aims to advance social justice by tackling health and environmental inequities relating to the built environment. She directs the Center for Design and Health at the University of Virginia
References
- Aspinall, P., et al., 2015. The urban brain: analysing outdoor physical activity with mobile EEG. British journal of sports medicine, 49 (4), 272–276. doi:https://doi.org/10.1136/bjsports-2012-091877.
- Berman, M.G., et al., 2012. Interacting with nature improves cognition and affect for individuals with depression. Journal of affective disorders, 140 (3), 300–305. doi:10.1016/j.jad.2012.03.012.
- Berman, M.G., Jonides, J., and Kaplan, S., 2008. The cognitive benefits of interacting with nature. Psychological science, 19 (12), 1207–1212. doi:10.1111/j.1467-9280.2008.02225.x.
- Berto, R., 2005. Exposure to restorative environments helps restore attentional capacity. Journal of environmental psychology, 25 (3), 249–259. doi:10.1016/j.jenvp.2005.07.001.
- Blackburn, H.L. and Benton, A.L., 1957. Revised administration and scoring of the digit span test. Journal of consulting psychology, 21 (2), 139–143. doi:10.1037/h0047235.
- Boukhechba, M. and Barnes, L.E., 2020. Swear: sensing Using WEARables. Generalized human crowdsensing on smartwatches. In: T. Ahram and C. Falcão, eds. Advances in usability, user experience, wearable and assistive technology. Springer International Publishing, 510–516. doi:10.1007/978-3-030-51828-8_67.
- Bowler, D., 2010. The importance of nature for health: is there a specific benefit of contact with green space? Systematic Review - Collaboration for Environmental Evidence, No.40. https://www.cabdirect.org/cabdirect/abstract/20103229510
- Bratman, G.N., et al., 2015. Nature experience reduces rumination and subgenual prefrontal cortex activation. Proceedings of the National Academy of Sciences, 112 (28), 8567–8572. doi:10.1073/pnas.1510459112.
- CDC, 11 February 2000. Coronavirus Disease 2019 (COVID-19). Centers for Disease Control and Prevention. https://www.cdc.gov/coronavirus/2019-ncov/daily-life-coping/managing-stress-anxiety.html
- CDC, 2018. Physical activity guidelines for Americans. 2nd ed. Washington, DC: U.S. Department of Health and Human Services, 118.
- CDC, 2021. FastStats: Exercise or physical activity. https://www.cdc.gov/nchs/fastats/exercise.htm
- Celis-Morales, C.A., et al., 2017. Association between active commuting and incident cardiovascular disease, cancer, and mortality: prospective cohort study. BMJ, 357, j1456. doi:10.1136/bmj.j1456
- Chen, M., et al., 2019. Effects of neighborhood green space on PM2.5 mitigation: evidence from five megacities in China. Building and environment, 156, 33–45. doi:10.1016/j.buildenv.2019.03.007
- Chen, Z., He, Y., and Yu, Y., 2016. Enhanced functional connectivity properties of human brains during in-situ nature experience. Peer journal, 4, e2210. doi:10.7717/peerj.2210
- Chen, L. and Ng, E., 2012. Outdoor thermal comfort and outdoor activities: a review of research in the past decade. Cities, 29 (2), 118–125. doi:10.1016/j.cities.2011.08.006.
- Cohen, J., 1988. Statistical power analysis for the behavioral sciences. 2nd ed. New York, USA: L. Erlbaum Associates.
- Coventry, P.A., et al., 2019. The mental health benefits of purposeful activities in public green spaces in urban and semi-urban neighbourhoods: a mixed-methods pilot and proof of concept study. International journal of environmental research and public health, 16 (15), 2712. doi:https://doi.org/10.3390/ijerph16152712.
- Eanes, A.M., et al., 2020. Assessing inequitable urban heat islands and air pollution disparities with low-cost sensors in Richmond, Virginia. Sustainability, 12 (23), 10089. doi:10.3390/su122310089.
- Elsadek, M., Liu, B., and Xie, J., 2020. Window view and relaxation: viewing green space from a high-rise estate improves urban dwellers’ wellbeing. Urban forestry & urban greening, 55, 126846. doi:10.1016/j.ufug.2020.126846
- Gailey, S., et al., 2021. Green mobility and obesity risk: a longitudinal analysis in California. Health & Place, 68, 102503. doi:10.1016/j.healthplace.2020.102503
- Gidlow, C.J., et al., 2016. Where to put your best foot forward: psycho-physiological responses to walking in natural and urban environments. Journal of environmental psychology, 45, 22–29. doi:10.1016/j.jenvp.2015.11.003
- Hoffman, J.S., Shandas, V., and Pendleton, N., 2020. The effects of historical housing policies on resident exposure to intra-urban heat: a study of 108 US urban areas. Climate, 8 (1), 12. doi:10.3390/cli8010012.
- Horiuchi, M., et al., 2013. Influence of forest walking on blood pressure, profile of mood states and stress markers from the viewpoint of aging. Journal of aging & gerentology, 1, 917, 1, 917. doi:10.12974/2309-6128.2013.01.01.2.
- Hystad, P. and Cusack, L., 2019. A real-world experimental study of physiological stress responses to urban green space. Environmental Epidemiology, 3, 172. doi:10.1097/01.EE9.0000607680.69832.06
- Jennings, V., et al., 2017. Urban green space and the pursuit of health equity in parts of the United States. International journal of environmental research and public health, 14 (11), 1432. doi:https://doi.org/10.3390/ijerph14111432.
- Kaplan, R. and Kaplan, S., 1989. The experience of nature: a psychological perspective. Cambridge, UK: Cambridge University Press.
- Kaplan, S., 1995. The restorative benefits of nature: toward an integrative framework. Journal of environmental psychology, 15 (3), 169–182. doi:10.1016/0272-4944(95)90001-2.
- Kaplan, S., 2001. Meditation, restoration, and the management of mental fatigue. Environment and behavior, 33 (4), 480–506. doi:10.1177/00139160121973106.
- Knaust, T., et al., 2021. Exposure to virtual nature: the impact of different immersion levels on skin conductance level, heart rate, and perceived relaxation. Virtual reality. 26, 925938. 26, 925938. doi:10.1007/s10055-021-00595-2.
- Kondo, M.C., et al., 2018. Urban green space and its impact on human health. International journal of environmental research and public health, 15 (3), 445. doi:https://doi.org/10.3390/ijerph15030445.
- Kondo, M.C., Jacoby, S.F., and South, E.C., 2018. Does spending time outdoors reduce stress? A review of real-time stress response to outdoor environments. Health & place, 51, 136–150. doi:10.1016/j.healthplace.2018.03.001
- Kruize, H., et al., 2019. Urban green space: creating a triple win for environmental sustainability. Health, and health equity through behavior change. International journal of environmental research and public health, 16 (22), 4403. doi:10.3390/ijerph16224403.
- Kuras, E.R., Hondula, D.M., and Brown-Saracino, J., 2015. Heterogeneity in individually experienced temperatures (IETs) within an urban neighborhood: insights from a new approach to measuring heat exposure. International journal of biometeorology, 59 (10), 1363–1372. doi:10.1007/s00484-014-0946-x.
- Lakens, D., 2013. Calculating and reporting effect sizes to facilitate cumulative science: a practical primer for t-tests and ANOVAs. Frontiers in psychology, 4. doi:https://doi.org/10.3389/fpsyg.2013.00863
- Leavitt, M.O., 2008. Physical activity guidelines for Americans. U.S Department of Health and Human Servcies. https://health.gov/paguidelines/2008/pdf/paguide.pdf
- Lee, H.J. and Lee, D.K., 2019. Do sociodemographic factors and urban green space affect mental health outcomes among the urban elderly population? International journal of environmental research and public health, 16 (5), 789. doi:10.3390/ijerph16050789.
- Liu, Z., et al., 2015. Seasonal and diurnal variation in particulate matter (PM10 and PM2.5) at an urban site of Beijing: analyses from a 9-year study. Environmental science and pollution research international, 22 (1), 627–642. doi:10.1007/s11356-014-3347-0.
- Macpherson, H., et al., 2017. A life-long approach to physical activity for brain health. Frontiers in aging neuroscience, 9, 147. doi:https://doi.org/10.3389/fnagi.2017.00147
- Matthews, G., Jones, D.M., and Chamberlain, A.G., 1990. Refining the measurement of mood: the UWIST mood adjective checklist. British journal of psychology, 81 (1), 17–42. doi:10.1111/j.2044-8295.1990.tb02343.x.
- Maxim Integrated, 2021. IButton Temperature Loggers (DS1922L/DS1922T) [Computer software]. Maxim Integrated Products, Inc. https://datasheets.maximintegrated.com/en/ds/DS1922L-DS1922T.pdf
- Mulckhuyse, M. and Theeuwes, J., 2010. Unconscious attentional orienting to exogenous cues: a review of the literature. Acta psychologica, 134 (3), 299–309. doi:10.1016/j.actpsy.2010.03.002.
- Mygind, L., et al., 2021. Effects of public green space on acute psychophysiological stress response: a systematic review and meta-analysis of the experimental and quasi-experimental evidence. Environment and behavior, 53 (2), 184–226. doi:10.1177/0013916519873376.
- Nardone, A., et al., 2021. Redlines and greenspace: the relationship between historical redlining and 2010 greenspace across the United States. Environmental health perspectives, 129 (1), 017006. doi:10.1289/EHP7495.
- Neale, C., et al., 2017. The aging urban brain: analyzing outdoor physical activity using the emotiv affectiv suite in older people. Journal of urban health, 94 (6), 869–880. doi:10.1007/s11524-017-0191-9.
- Neale, C., et al., 2020. The impact of walking in different urban environments on brain activity in older people. Cities & health, 4 (1), 94–106. doi:10.1080/23748834.2019.1619893.
- Olafsdottir, G., et al., 2020. Health benefits of walking in nature: a randomized controlled study under conditions of real-life stress. Environment and behavior, 52 (3), 248–274. doi:10.1177/0013916518800798.
- Richmond City Health District, 2017. Community Health Assessment: Richmond City. http://www.vdh.virginia.gov/content/uploads/sites/119/2017/09/RCHD-CHA-Aug-2017.pdf
- Roe, J., et al., 2019. The restorative health benefits of a tactical urban intervention: an urban waterfront study. Frontiers in built environment, 5. doi:10.3389/fbuil.2019.00071.
- Roe, J., et al., 2020. The urban built environment, walking and mental health outcomes among older adults: a pilot study. Frontiers in public health, 8, 575946. doi:https://doi.org/10.3389/fpubh.2020.575946
- Roe, J. and Aspinall, P., 2011. The restorative benefits of walking in urban and rural settings in adults with good and poor mental health. Health & place, 17 (1), 103–113. doi:10.1016/j.healthplace.2010.09.003.
- Saverino, K.C., et al., 2021. Thermal inequity in Richmond, VA: the effect of an unjust evolution of the urban landscape on urban heat islands. Sustainability, 13 (3), 1511. doi:10.3390/su13031511.
- Scott, A.A., et al., 2017. Intraurban temperature variability in Baltimore. Journal of applied meteorology and climatology, 56 (1), 159–171. doi:10.1175/JAMC-D-16-0232.1.
- Shandas, V., et al., 2019. Integrating satellite and ground measurements for predicting locations of extreme urban heat. Climate, 7 (1), 5. doi:10.3390/cli7010005.
- Sinharay, R., et al., 2018. Respiratory and cardiovascular responses to walking down a traffic-polluted road compared with walking in a traffic-free area in participants aged 60 years and older with chronic lung or heart disease and age-matched healthy controls: a randomised, crossover study. The lancet, 391 (10118), 339–349. doi:10.1016/S0140-6736(17)32643-0.
- Sugiyama, T., et al., 2013. Initiating and maintaining recreational walking: a longitudinal study on the influence of neighborhood green space. Preventive medicine, 57 (3), 178–182. doi:10.1016/j.ypmed.2013.05.015.
- Tieskens, K.F., et al., 2022. Mapping the gaps between cooling benefits of urban greenspace and population heat vulnerability. The science of the total environment, 845, 157283. doi:10.1016/j.scitotenv.2022.157283
- Tilley, S., et al., 2017. Older people’s experiences of mobility and mood in an urban environment: a mixed methods approach using electroencephalography (EEG) and interviews. International journal of environmental research and public health, 14 (2), 151. doi:10.3390/ijerph14020151.
- Twohig-Bennett, C. and Jones, A., 2018. The health benefits of the great outdoors: a systematic review and meta-analysis of greenspace exposure and health outcomes. Environmental research, 166, 628–637. doi:10.1016/j.envres.2018.06.030
- Tyrväinen, L., et al., 2014. The influence of urban green environments on stress relief measures: a field experiment. Journal of environmental psychology, 38, 1–9. doi:10.1016/j.jenvp.2013.12.005
- Ulrich, R.S., 1981. Natural versus urban scenes: some psychophysiological effects. Environment and behavior, 13 (5), 523–556. doi:10.1177/0013916581135001.
- Ulrich, R.S., et al., 1991. Stress recovery during exposure to natural and urban environments. Journal of environmental psychology, 11 (3), 201–230. doi:10.1016/S0272-4944(05)80184-7.
- United Nations, 2018. World urbanization prospects: the 2018 revision. United Nations, New York. http://www.un.org/esa/population/publications/wup2007/2007wup.htm
- Wang, S., et al., 2021. Characterization of heat index experienced by individuals residing in urban and rural settings. Journal of exposure science & environmental epidemiology, 31, 641653.31, 641653. doi:10.1038/s41370-021-00303-x.
- Wechsler, D., 1958. The measurement and appraisal of adult intelligence. 4th ed. Williams & Wilkins Co, p. ix, 297. doi:10.1037/11167-000.
- Xue, P., et al., 2021. Investigation of outdoor pedestrian shading preference under several thermal environment using remote sensing images. Building and environment, 200, 107934. doi:10.1016/j.buildenv.2021.107934
- Yang, Y., et al., 2021. Urban greenery cushions the decrease in leisure-time physical activity during the COVID-19 pandemic: a natural experimental study. Urban forestry & urban greening, 62, 127136. doi:10.1016/j.ufug.2021.127136
- Zhang, H. 2003. Human thermal sensation and comfort in transient and non-uniform thermal environments. Doctorate, University of California, Berkeley. https://escholarship.org/uc/item/11m0n1wt