
 ?Mathematical formulae have been encoded as MathML and are displayed in this HTML version using MathJax in order to improve their display. Uncheck the box to turn MathJax off. This feature requires Javascript. Click on a formula to zoom.
ABSTRACT
Previous research has illustrated the role of urban green and blue spaces in improving the economic, social, environmental, and health-related outcomes of urban populations. The Connswater Community Greenway is presented as a case study to assess the social value of an urban regeneration project. Using real-world data from two time points (2012 and 2017), our analysis focussed on eight key elements: property values; flood alleviation; tourism; biodiversity; climate change; health and wellbeing; crime; and employment and productivity. Using social return on investment analysis, we estimated the value of the Connswater Community Greenway over a 40-year horizon. The total value was estimated to be between £56.8m and £67m. After subtracting the costs (£42.2m), the net present value of the Connswater Community Greenway was £14.6m - £24.8m. The benefit-cost ratio was 1.34 – 1.59, meaning that for every £1 invested in the Connswater Community Greenway, the local economy gains between £1.34 and £1.59. Overall, the Connswater Community Greenway will provide a positive return on investment which will be realised after 30 years. Social return on investment analysis provides a framework for the incorporation of many multifunctional benefits of urban green and blue spaces into economic evaluation, providing a more complete analysis of value.
Introduction
Investment in new or improved urban green and blue spaces (UGBS) can generate various social, economic, environmental, and health benefits for urban populations. For example, UGBS can mitigate against urban heat island effects (Aram et al. Citation2019), improve air quality (Nowak et al. Citation2006, Abhijith et al. Citation2017), increase biodiversity (Lepczyk et al. Citation2017), attenuate noise (Nieuwenhuijsen et al. Citation2017), and promote physical activity (Akpinar Citation2016, Jang and Kang Citation2016). UGBS is defined as any urban space with a high proportion of vegetative ground cover, with significant recreational and amenity value (Schipperijn et al. Citation2013). Examples of UGBS include larger spaces such as parks, urban forests, nature conservation areas, greenways and trails (Roy et al. Citation2012) but also small or inaccessible green spaces such as roadside greenery, green roofs and vertical greenery systems (WHO Regional Office for Europe Citation2016, World Health Organization Citation2017). Permanent changes to the urban environment such as the installation of new (or modification of existing) green and blue spaces can require a significant investment of time and resources. Despite the multifunctional benefits of UGBS being well documented (Lee and Maheswaran Citation2011, Zhou and Rana Citation2012, Hunter et al. Citation2015, Kondo et al. Citation2018), there is a paucity of studies that have attempted to quantify the multifunctional benefits of UGBS and describe how these translate directly into positive externalities for local economies.
In addition to significantly improved physical health (Twohig-Bennett and Jones Citation2018), UGBS has the potential to reduce health inequalities (Public Health England Citation2014, Geary et al. Citation2021). This has been highlighted in calls by The United Nations and the World Health Organisation for more investment in UGBS (World Health Organization Citation2017, United Nations Habitat III Citation2017). Individuals living in socioeconomically disadvantaged areas are disproportionately affected by poor health and mental wellbeing, and higher rates of chronic disease (Kontopantelis et al. Citation2018). Furthermore, in the UK, there is a disparity in access to UGBS across the socioeconomic gradient, with low-income households having inadequate access to green spaces, poorer air quality and increased exposure to flooding (Public Health England Citation2014). Consequently, it is implied that the current distribution of UGBS may contribute to or, some cases exacerbate, existing health inequalities (Wolch et al. Citation2014). Thus, targeting investment in UGBS towards socioeconomically disadvantaged populations may be a means to both improve population health and reduce health inequalities.
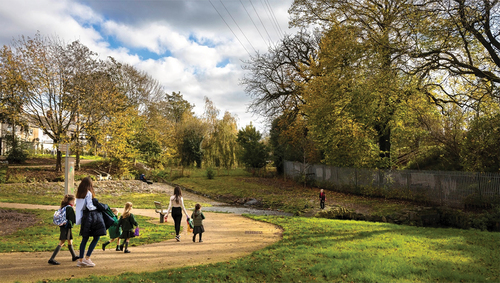
The Connswater Community Greenway (CCG), completed in 2017, was a significant urban regeneration project based in Belfast, UK. A major part of the intervention was the introduction of UGBS to areas that were not previously well provisioned with high-quality natural spaces. This included the more disadvantaged inner city area as well as the relatively affluent inner suburbs. The compact inner city area contains some of the most deprived wards in Northern Ireland (NI), making it an ideal context for an intervention targeted at reducing health and social inequalities. This is important given the unequal distribution of access to UGBS that is prevalent in many cities across the UK and Europe (Macintyre et al. Citation2008, Public Health England Citation2014, European Environment Agency Citation2022). The CCG functions as a linear public park and pedestrianised travel corridor, providing opportunities for recreation, physical activity, and active travel (Akpinar Citation2016, Jang and Kang Citation2016). By promoting active transport modalities such as walking and cycling (Lindsey Citation1999), the CCG can support a modal shift away from motor transport, thereby reducing greenhouse gas emissions associated with travelling by car (Ngo et al. Citation2018). Moreover, the CCG provides multifunctional infrastructure (Walmsley Citation2006) with amenity and, by extension, recreational value (Scott Shafer et al. Citation2013).
Economic evaluations of UGBS and their broader social and economic benefits are scarce. A recent review proposed that future studies on UGBS should include economic evaluations (Hunter et al. Citation2019), ideally by including the environmental and societal impacts of UGBS in addition to the salutogenic effects. It is possible that the extant literature of economic evaluations of UGBS overlooks important dimensions of UGBS benefits and therefore undervalues its contribution to sustainable urbanisation. Monetising non-market values, such as improved air quality and mental wellbeing, can be challenging. But if resource allocation is to be appropriately informed, they must be more comprehensively explored. This necessitates the introduction of more high-quality economic evaluations of UGBS to add to the limited current evidence base.
To date, there have been two studies modelling the economic impact of the CCG. In the first (Dallat et al. Citation2014), a macro-simulation PREVENT model was used to estimate the CCG’s potential to reduce the economic burden attributed to cardiovascular disease, type 2 diabetes and cancer through increased physical activity. It was estimated that a 2% minimum increase in physical activity levels would result in a reduction of morbidity and mortality equivalent to £18,411 per disability-adjusted life-year. A more recent evaluation by Hunter et al. (Hunter et al. Citation2020) included an expected social return on investment (SROI) of the CCG. The benefit-cost ratio (BCR) was estimated at between 2.88 and 5.81, suggesting the CCG was likely to offer good value for money. Given that the construction of the CCG was completed in 2017, the previous evaluations were based on several a priori assumptions, as various sets of data were not yet available. Now that the CCG is completed and open to the public, it is possible to revisit these calculations using available real-world data.
The CCG was a suitable setting for a natural experiment by facilitating an investigation of how differing exposures to the intervention result in different outcomes across two populations (e.g. those who live within 500 m of the CCG and those who do not). We consulted Deidda et al’s (Deidda et al. Citation2019) framework for the economic evaluation of natural experiments. Natural experiments resemble true experiments, however, the circumstances are largely outside the investigators’ control (Dunning Citation2012), and as a result the strength of the study is predicated on the capacity of researchers to minimise bias arising from complex and overlapping extraneous factors. Natural experiments are useful when it is not feasible or practical to randomise individuals to a group. Deidda et al.’s framework provides a guide to the development of a study from the early design phase to ensure sufficient data to perform a robust, holistic economic evaluation.
The objective of this study was to conduct an updated SROI analysis of the CCG based on the framework previously presented by Hunter et al. (Citation2020) over an assumed lifetime of 40 years using data available pre- (2012) and post-implementation (2017). Our analysis uses both primary and secondary data collected before and after the Greenway was constructed. In line with recommendations from the HM Treasury Green Book (HM Treasury Citation2013), and the framework put forward by Deidda et al. (Citation2019), we report the estimated economic benefits of eight dimensions of the CCG and compare these to the total costs of the project. Then, we describe various sensitivity analyses to explore the robustness of the results. Finally, we explore the societal impact of the CCG over its lifetime and discuss the scope for further research in the area of economic evaluations of UGBS.
Methods
Population and setting: the Connswater Community Greenway
The CCG is situated in East Belfast (see ), NI, within an electoral constituency that contains a resident population of 96,228 in 2020 (Northern Ireland Statistics and Research Agency Citation2021). In 2019, East Belfast was ranked fourth among constituencies in NI for the highest age-standardised mortality rate due to circulatory, smoking-related and other preventable diseases among under-75s (Northern Ireland Assembly Citation2022). In addition, East Belfast had the fifth-highest age-standardised mortality rate due to respiratory disease among the under-75s (Northern Ireland Assembly Citation2022). Four of the 46 Super Output Areas (SOAs) in East Belfast (including Ballymacarrett and The Mount) are ranked in the 10% most deprived wards in NI (Northern Ireland Statistics and Research Agency Citation2017). In 2020, East Belfast had the sixth-highest proportion of claimants eligible for income support in NI, and the fifth-highest proportion of children eligible for free school meals (another metric of deprivation) (Northern Ireland Assembly Citation2022).
Figure 1. The Connswater Community Greenway and constituency of East Belfast.
The CCG (www.communitygreenway.co.uk) was a major urban regeneration project in Belfast, NI, funded primarily by a Big Lottery Living Landmarks Award and provision of other funding by local government departments and the local city council (totalling £40 m).
Specific aspects of the regeneration included: provision of a 9 km urban greenway along the course of 3 rivers; 5 km of remediated water courses; 16 km of new or improved foot and cycle paths (); development of a new civic square; development of 8 tourism and heritage trails; 23 new or improved bridges or crossings; 22 new signage points; installation of public art; 13 hectares of upgraded parks; 2 multi-use games areas; 2 new public toilets. Many of the green spaces that became part of the CCG did exist prior to the intervention but were mostly unconnected to each other with poor accessibility to surrounding neighbourhoods.
Figure 2. Greenway path situated within the CCG network in East Belfast.
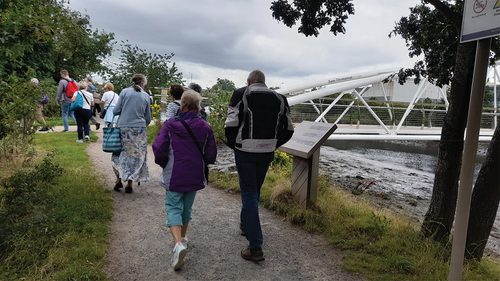
To improve the safety of the CCG, a closed-circuit television surveillance system was installed, and park wardens were recruited. 24-hour illuminated lighting columns were installed along the greenway (), making it the first area of UGBS to be available for use 24 hours per day in NI. The CCG was promoted by the EastSide Partnership, a local charitable organisation, who advertised the Greenway, and organised various community engagement events (Tully et al. Citation2013). In addition to this, local communities were engaged in the design of the greenway and the naming of local bridges (). Two education officers were employed to increase awareness of the CCG among 26 local schools and colleges. A full-time community support officer was employed as part of the project’s ‘bottom-up’ approach. This project recognised that UGBS interventions are long-term investments as reflected by the 40-year management and maintenance plan for the CCG.
Figure 3. Greenway path with newly installed lighting columns.
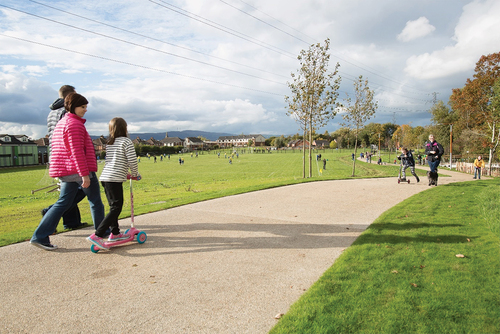
Figure 4. Bridge providing improved access to local green spaces along the CCG network.
The regeneration also included an £11 m flood alleviation scheme, part of which involved moving the course of a river away from a residential area that was previously prone to flooding. Accessibility to the parks was also improved through the installation of new paths, bridges and access points. For example, one new park gate increased the number of households in its 5 min catchment by 59% and the 15 min catchment by 33%.
The CCG represents a significant economic investment in the local community and provides access to UGBS for both local and non-local residents. The provision of leisure and recreational opportunities, as well as the aesthetic improvements, create amenity value for local residents, promoting ‘quality of place’ (Saraev Citation2012). The inclusion of 24-hour lighting fixtures and surveillance systems are important to facilitate the use of the CCG, further contributing to quality of place by improving users’ sense of safety and trust (Mason Citation2010). Given that the CCG extends across a large area of East Belfast (see ), the installation of bridges, public toilets and signage combined with various community engagement initiatives coordinated by Eastside Greenways (a subsidiary of the Eastside Partnership) serve to improve access for people from a diverse range of socioeconomic backgrounds, thereby ensuring that the social, economic, environmental and health-related benefits are distributed evenly across the community.
Costs of the Connswater Community Greenway
The EastSide Partnership obtained funding for the CCG from a Big Lottery Living Landmarks Award and the project was developed in collaboration with the Belfast City Council. Other funders were the Department for Communities (£3.7 m) and the Department for Infrastructure (£8.7 m) in NI (Hunter et al. Citation2020). The total costs associated with construction were £40 m, higher than the initial estimate of £35 m (Hunter et al. Citation2020). The Belfast City Council is responsible for the maintenance of the CCG, estimated at an additional cost of £4 m over 40 years. Using the social time preference rate of 3.5% (discussed below), the net present value of this is £2,235,507.
Analytical framework
As recommended by guidelines published in the HM Treasury Green Book and Deidda’s framework for economic evaluations of natural experiments, we adopted a societal perspective to capture the relevant benefits generated by the CCG. The social, economic and environmental benefits considered as part of the SROI analyses are displayed in the logic model (), based on an example logic model (Deidda et al. Citation2019). The model presents the inputs (costs of the interventions) and the expected short-term and long-term outcomes of the CCG over its lifetime. The time horizon of the analysis was 40 years – the expected lifetime of the CCG (Hunter et al. Citation2020).
Figure 5. Logic model of the short and long-term outcomes of the Connswater Community Greenway.
Our analytical framework builds on a previous SROI analysis conducted by Hunter et al. (Citation2020). The co-benefits explored in the present analysis were identified during extensive consultations with the Connswater Community Greenway Management Committee, as well as multi-sectoral stakeholders and local community members during the development phase of the Greenway. Members of the research team consulted with stakeholders during monthly stakeholder fora during the development phase from 2010-2012. Approximately 80 stakeholders attended the monthly discussions. Further, in August 2022 we conducted a Group Model Building workshop with 20 multi-sectoral stakeholders and local community members to explore the impacts of the Connswater Community Greenway post-implementation. Through these consultation with stakeholders, we identified eight key elements which were likely to be affected by the CCG: (1) property values; (2) flood alleviation; (3) tourism; (4) biodiversity; (5) climate change; (6) health and wellbeing; (7) crime; and (8) employment and productivity. The data sources and estimates of effect sizes are described for each element (and explored in greater detail in Supplementary File 1 - Appendix).
Using data from two time points pre- and post-intervention (2012 and 2017, respectively), we derived estimates of the monetary value of each of the aforementioned co-benefits. It was assumed that these benefits would be maintained over the 40-year lifetime of the CCG, and the net present social value (NPSV) was obtained by summing the total discounted monetary value of each co-benefit over the 40 years and subtracting the costs for construction and maintenance. According to the HM Treasury Green Book (HM Treasury Citation2013), the NPSV constitutes a ‘summary measure of social welfare’. All future monetary benefits and costs (such as maintenance) were discounted by 3.5% (HM Treasury Citation2013) from the base year of 2017 when construction of the CCG was completed. The BCR was calculated by dividing the total value of the discounted benefits by the total discounted costs. The data that were used to assess the impact of the CCG on each element are described in .
Table 1. Co-benefit measurement instruments, conversion to monetary values and sources.
Displacement or attribution effects were not estimated due to the lack of appropriate data. The effects of the CCG are expected to last 40 years, but the strength of the effects may diminish or increase over that time. This effect, which is referred to as ‘drop-off’, was addressed in sensitivity analyses, which used shorter expected lifetimes of the CCG.
Time horizon and discounting
In line with the expected lifetime of the CCG (Hunter et al. Citation2020), we adopted a time horizon of 40 years for the analysis. All future monetary benefits were discounted from the base year of 2017, and assumed to be maintained over the 40-year period. By discounting the costs and benefits of the CCG incurred over this period, we were able to compare the present values and determine the return on investment. Based on time preference theory, this approach is founded on the assumption that goods and services have a greater relative valuation in the present compared to the future.
The standard discount rate for UK governmental appraisal is 3.5%, also known as the ‘social time preference rate’ (STPR) (NICE Citation2008, HM Treasury Citation2013). The HM Treasury Green Book (HM Treasury Citation2013) states that ‘future costs and benefits should be discounted by the Social Time Preference Rate to provide the present value’. The STPR is comprised of two components: ‘time preference’ and ‘wealth effect’. ‘time preference’ is the discount rate that assumes that there will be no change in future consumption. The ‘wealth effect’ assumes that consumption will grow in the future and consequently, its marginal utility will diminish (HM Treasury Citation2013). The STPR can be expressed mathematically as follows:
Where r is the STPR; ρ is the time preference; and μg is the wealth effect (μ is the marginal utility of consumption multiplied by the expected growth rate of future consumption, ). The Treasury Green Book’s preferred values for each component are as follows: ρ = 1.5%; μ = 1.0; and g = 2%. Therefore, 0.015 + 1 × 0.02 = 3.5%.
Sensitivity analysis
Broadly in line with a recent framework for understanding real-world evidence variation (Wang et al. Citation2022), several sensitivity analyses were conducted to assess the impact of alternative discount rates, shorter time horizons, and uncertainty in the model due to potential double counting or displacement. In these analyses, the social present values for flood alleviation, land and property values, tourism, biodiversity, and climate change, were estimated using alternative discount rates of 0%, 1.5% and 5% and shorter time horizons of 10, 20, and 30 years. We assessed the sensitivity of the model to a change in the parameters that made up the overall estimate of NPSV, namely, by removing tourism, biodiversity and flood alleviation. Tourism was removed due to the possibility of double counting with biodiversity. Biodiversity and flood alleviation were removed as there was a risk that these parameters were captured in increased property values.
Results
Element 1: property values
Proximity to UGBS has been shown to positively impact property values (Morancho Citation2003, Wu et al. Citation2015, Liebelt et al. Citation2018, Office for National Statistics Citation2019). The Office for National Statistics (ONS) reported that UGBS increased the prices of property within 200 m by 0.53% to 3.58% (Office for National Statistics Citation2018), with similar results for houses within 500 m. For medium to large functional green spaces, it was estimated that property prices would increase by 0.60% to 1.07%. Therefore, for our analysis, we used geographic information system data to calculate the number of properties within 500 m of the CCG with a standard Euclidean buffer using Ordnance Survey NI data (n = 19,761).
Summary of model assumptions
The average price of terraced and semi-detached properties in the CCG area was £135,398 in 2009-2014 (Built Environment Research Institute Citation2019). However, the number of properties traded since the introduction of the CCG was not sufficient to reliability estimate an increase in property prices. Consequently, we calculated the average increase in value of properties within 500 m of the CCG using the ONS estimates that were based on medium to large functional green spaces (0.60% to 1.07%). This equates to an increase of £812 - £1,450 to each property on average in net value added. Over the lifetime of the greenway, this is estimated to be between £16,053,599 and £28,628,919, or between £401,340 and £715,723 per year assuming the increase in prices is linear. The discounted monetary value of this increase in property prices is between £8,971,984 and £16,000,039 (3.5%, 40 years).
Total monetary value
The total value of the increase in property prices is projected to be between £8,971,984 and £16,000,039 (3.5%, 40 years).
Element 2: flood alleviation
Flood defences were installed as part of the CCG regeneration project targeting 1,741 properties that were previously prone to flooding. A previous analysis of the benefits and costs of flood alleviation measures was conducted by Jacobs Engineering UK Ltd. They estimated that the new measures should avoid damages of £54.7 m (variable discount rate of 2.5-3.5%) over an expected lifetime of 100 years. Hunter et al. previously calculated that this would equate to average annual damages avoided equivalent to £1,947,405 (Hunter et al. Citation2020). This was calculated by dividing the sum of the total benefits (£54.7 m) by the summation of the compounded discount factors (29.863) and applying the Retail Price Index to inflate costs to present day. The savings from average annual damages avoided was projected over 40 years and discounted by 3.5% to derive the present value of flooding alleviation which was estimated to be £43,534,388 (or £1,947,405 per year).
Element 3: tourism
The tourism sector in NI has undergone a period of sustained growth in the past 12 years. Between 2005 and 2017, it is estimated that revenue from overnight trips in NI increased from £503 m to £926 m (Tourism Northern Ireland Citation2017). In 2018, country parks, urban parks and forests, such as the CCG accounted for 42% of all visitors reported (Northern Ireland Statistics and Research Agency Citation2018). The CCG has recreational and amenity value for both residents living in close proximity and external visitors to NI. As such, changes in property prices can be used to capture the value of the CCG to residents, however they will not gauge the value to tourists or external visitors who bring additional economics benefits through spending in the local area. For example, a new public square commemorating CS Lewis (https://visitbelfast.com/partners/cs-lewis-square/) which sits adjacent to the EastSide Visitor Centre, has seen significant growth in the number of external visitors and has become an important focal point for tourism in East Belfast. This is expected to serve as a platform for long-term economic growth in the local area which will be realised through increased expenditure in local amenities and businesses.
Summary of model assumptions
Intercept surveys conducted along the CCG estimated that there were 56,589 (an increase of 54%) additional visits in 2017 compared to 2011 by internal (or domestic) non-local individuals for leisure or recreation purposes whose journeys originated from postcodes outside of the CCG area. Only one journey originated from outside NI, therefore a multiplier effect was not applied to our estimates to account for non-domestic tourist contributions to the NI economy.
A UK-based meta-analysis, using survey data from 40,000 households, predicted per-visit values for different environmental sites that included ‘freshwater and floodplains’ or ‘greenbelt and urban fringe farmlands’. For our analysis, we used the lowest and highest per trip values (£1.54 and £5.36, respectively) to estimate the cost-per-visit for the CCG (Sen et al. Citation2014). Assuming that internal non-local individuals are willing to pay an amount at least equal to travel costs for the benefits of visiting the site, and assuming no shared journeys, these costs provide a conservative estimate of the non-local recreational benefits of the CCG.
The cost-per-visit values (£1.54 and £5.36) were multiplied by the number of additional external visitors accrued between 2011 and 2017 (n = 56,589 or n = 9,432 per year). Assuming a 54% increase in external visitors continues from 2017, the potential value would be approximately £87,147 - £303,316 in the first six years after the completion of the CCG (or £14,525- £50,553 per year). Over the lifetime of the CCG, this would equate to between £324,696 and £1,130,112 (3.5%, 40 years).
It is worth noting that we did not allow for an exponential increase in additional external visitors to the CCG over the 40-year horizon. Our assumptions are based on the increase in external visitors remaining flat, thus we provide a conservative estimate of the value of tourism.
Total monetary value
Over the lifetime of the CCG, the total monetary value of additional visitors is between £324,696 and £1,130,112.
Element 4: biodiversity
Biodiversity can be characterised in terms of species richness and variation within a given ecosystem (Purvis and Hector Citation2000). Recent research shows a decline in biodiversity over the past decades, due in large part to the impact of human activity and urbanisation (Pereira et al. Citation2010, Concepción et al. Citation2015). Maintaining – and creating – healthy ecosystems is of critical importance to planetary health, contributing in a variety of ways to human wellbeing (The Lancet Planetary Health Citation2022). The CCG regeneration project cleaned 5 km of the river and added 7.84 hectares of various grasses, wildflowers, and shrubs, 498 trees and 352 linear metres of hedging. However, is it difficult to define the value of these measures and the impact on biodiversity in monetary terms.
Summary of model assumptions
UGBS provide ecosystem services that have ‘existence value’ which is derived from the knowledge that the UGBS, and their concomitant benefits, exist (Davidson Citation2013). It has been argued that assigning monetary values to natural resources is crude or inaccurate (Spash and Vatn Citation2006, Spangenberg and Settele Citation2010), however there is utility in attempting to translate the worth of an environmental good into a monetary value when possible and appropriate, particularly in instances where a similar analysis has been conducted. Using the benefit transfer method is one way to accomplish this goal. This involves using the economic values for ecosystem services derived from one location and/or context and applying them to another (OECD Citation2006).
A Sheffield-based study used a choice experiment to estimate the willingness-to-pay (WTP) of UGBS visitors for an increase in biodiversity (Dallimer et al. Citation2014). Similar to the CCG area in East Belfast, the natural landscape of Sheffield is comprised of several rivers in urban and suburban areas. Participants in the experiment indicated that they were willing to pay £11.99, £13.48 and £9.38 in additional annual tax for a 10% increase in birds, plants, and aquatic macroinvertebrates, respectively. They would pay £16.51, £7.86, and £11.91 in additional tax for a 25% increase.
Given that it is likely that the extensive regeneration of the area has achieved at least a 10% improvement in biodiversity, although no measures are available, we used the WTP calculated for a 10% increase in birds, plants, and aquatic macroinvertebrates.
By subtracting the WTP to travel (£1.54 - £5.36) of additional external visitors to the CCG (n = 56,589), we were able to estimate the potential value of a 10% increase in biodiversity. In the first six years of the CCG, this would equate to a value between £1,062,176 and £1,710,685 (or £177,029 - £285,114 per year). Over the lifetime of the CCG, it is projected that this will equate to a total monetary value between £3,957,502 and £6,373,750 (3.5%, 40 years). These are likely conservative estimates as they do not account for increases in the quality of the amenities which will likely increase WTP further.
Total monetary value
The total monetary value attributed to increased biodiversity associated with the CCG is between £3,957,502 and £6,373,750 (3.5%, 40 years).
Element 5: climate change
There are a number of climate-related benefits associated with UGBS: reduced air and surface temperatures (The Mersey Forest, Natural Economy Northwest, CABE, Natural England, Yorkshire Forward, The Northern Way Citation2010), carbon sequestration (Nero et al. Citation2017, Shadman et al. Citation2022) and reduced pollution through the provision of active travel corridors that both support and encourage walking and cycling as an alternative to motor transport (Horte and Eisenman Citation2020). Compared to other cities in Europe, Belfast is relatively car-dependent (INRIX Citation2022) - only 2% of journeys were made by bicycle in 2020 (Department for Infrastructure Citation2020).
Summary of model assumptions
The CCG includes 16 km of protected cycling pathways and connects parts of suburban East Belfast to the city centre. Traffic count data for three main roads in East Belfast and surveys of cyclists at four locations in the CCG were collected between 2012-2017. The data showed that there were 734 fewer cars on the roads in the CCG area per day on average, a reduction of 1% (Department for Infrastructure Citation2018), which we attribute to a 405% increase in cyclists using the CCG. The average volume of cars during peak commuting times on workdays (Monday-Friday) was 11,582 in 2012. Therefore, attributing a 1% reduction in these journeys to a modal shift in favour of cycling on the CCG equates to 116 fewer daily car journeys due to a modal shift in favour of cycling.
In 2017, the average length of a car journey for commuting and business in NI was 12.1 km (Department for Infrastructure Citation2019), and an average car emitted 0.29 kg of CO2 per km in 2017 (Department for Business Energy & Industrial Strategy Citation2017), therefore an average car journey would emit 3.51 kg. Allowing six weeks per year for holidays (30 working days), it is assumed that people commute to work approximately 230 days per year. Over one year, commuting by car in NI would emit an estimated 807.3 kg of CO2. The UK government values carbon emissions as £4.13 per tonne of CO2 in policy evaluations (Department for Business Energy & Industrial Strategy Citation2018). In one year, the present value of reduced carbon emissions from 116 fewer cars would equal £387. Therefore, the present value of the CCG concerning reduced carbon emissions is £8,646 (3.5%, 40 years).
Total monetary value
The total monetary value associated with the reduction of air pollution is estimated to be £8,646 (3.5%, 40 years).
Element 6: health and wellbeing
UGBS has been directly and indirectly linked to improved health and wellbeing, as well as reduced health inequalities (Mitchell and Popham Citation2008). Multiple mechanisms exist through which UGBS can lead to better health outcome for urban populations. For example, UGBS provide settings that can be used for exercise (Bedimo-Rung et al. Citation2005, Coombes et al. Citation2010, Schipperijn et al. Citation2013, Brown et al. Citation2014, James et al. Citation2015) which in turn reduces the risk for various non-communicable diseases (NCDs) such as coronary heart disease (Mitchell and Popham Citation2008, Gascon et al. Citation2016), hypertension (Astell-Burt and Feng Citation2019, Moreira et al. Citation2020, Bauwelinck et al. Citation2020), and type 2 diabetes (Bodicoat et al. Citation2014, Dela Fuente et al. Citation2020), as well as important modifiable risk factors for NCDs such as obesity (Lachowycz and Jones Citation2011) and sedentary behaviour (James et al. Citation2015, Motomura et al. Citation2022). A recent review highlighted the role of exposure to UGBS in reducing the risk for type 2 diabetes, all-cause and cardiovascular mortality, diastolic blood pressure, heart rate variability, and cholesterol (Twohig-Bennett and Jones Citation2018). Additionally, people living closer to UGBS have been found to have lower mental distress and higher wellbeing, after controlling for socioeconomic status (White et al. Citation2013).
Counter to expectations based on the results of earlier studies, data from The Physical Activity and Rejuvenation of Connswater (PARC) study (Hunter et al. Citation2021) did not find a significant intervention effect in the physical activity or mental health and wellbeing of the local population compared to comparator data. The data suggested that the physical activity levels of the target population decreased between 2010 and 2017, similar to NI adult population trends. Mean quality of life also demonstrated a decline over the same period. However, a decline in quality of life was also observed in the control area, which was more pronounced than that of the CCG group.
We have conservatively estimated that these benefits are conditional on residential proximity to the site and embedded in property values. This is a conservative estimate – ignoring for example health benefits that accrue to visitors and the reduced dependence on cars for transport. However, it is worth acknowledging the difficulty in modelling the counterfactual, given the changes in the supply of healthcare services which can also impact the utilisation of these services. We do not account for changes in the uptake of healthcare services and have likely underestimated the impact of the CCG on the health and wellbeing of the population. Though the data collected between 2011 and 2017 ostensibly show no improvement in health and wellbeing, this does not preclude the possibility that improvements to health and wellbeing will occur over the 40-year lifetime of the CCG project and that compared to the control area, negative health effects were less pronounced.
Element 7: crime
UGBS has been shown to have both positive and negative impacts on crime (Garvin et al. Citation2013, Venter et al. Citation2022). According to the theory of social disorganisation, social capital can be negatively impacted by crime and violence; a problem which is further exacerbated by a lack of social cohesion or shared values in communities (Coleman Citation1988, Kawachi et al. Citation1999). UGBS can mitigate against this by reinforcing the emotional connection of residents to their local neighbourhoods (McCunn and Gifford Citation2014) and nurturing a sense of community which, in turn, encourages greater social cohesion (Peters et al. Citation2010, Wan et al. Citation2021). UGBS can also instil greater feeling of safety and trust in neighbourhoods (Kuo et al. Citation1998), and generate a reduction in crime, violence and aggression (Mason Citation2010, Bogar and Beyer Citation2016). Studies have investigated how the different characteristics of UGBS (i.e. size, lighting, vegetation type) can affect crime rates. For example, the presence of vegetation has been shown to encourage the use of public spaces, promoting social supervision which contributes to reduced violent crime and burglaries (Wolfe and Mennis Citation2012). Recreational facilities for sport, adequate lighting and nearby public transport stops may discourage crime (Kimpton et al. Citation2017).
Local crime rates in the CCG area showed a gradual decrease in between 2014 and 2018. This was broadly in line with the rest of NI and Belfast which also observed a decline in crime reported between 2015 and 2017, and a small increase between 2017 and 2018. Ward-level data obtained from the Northern Ireland Neighbourhood Information Service showed an overall decrease in criminal offences reported across the various wards closest to the CCG (Northern Ireland Neighbourhood Information Service Citation2022). Between 2012 and 2017, criminal offences reported in CCG wards relating to burglary, theft and criminal damage fell by 10%, 5% and 14%, respectively.
Based on 2015/16 prices, it was estimated that the average cost of a domestic burglary was £5,930, theft £1,380, and criminal damage (excluding arson) £1,350 (UK Home Office Citation2018). By multiplying the total number of burglaries, thefts and criminal damages by their respective costs we found the total costs of these crimes were £8,521,310 in 2012 and £7,744,270 in 2017, representing an 8.8% decrease over five years.
The total estimated cost savings due to reduced crime in the CCG area was £777,040 between 2012 and 2017. However, as the decrease in crime was largely in line with the rest of Belfast and NI, we cannot attribute these cost savings to the introduction of the CCG. Similar to health and wellbeing, it is likely that any reduction in crime will be captured in increase property values.
Element 8: employment and productivity
Large-scale urban regeneration projects, such as the CCG, can create new job opportunities for local residents and potentially improve productivity for local employees who make use of the new facilities. One of the mechanisms through which improved productivity can be achieved is physical activity. However, interventions targeting increased productivity in workplaces usually have both social and environmental components (To et al. Citation2013).
Three large employers are located in the CCG area: the Holywood Arches Health Centre, Bombardier Aerospace, and Allied Bakeries. While increased physical activity can improve productivity and reduce absenteeism (van Amelsvoort et al. Citation2006), data collected between 2011-17 do not show an increase in physical activity pre- and post-implementation of the CCG. Rather, physical activity levels decreased. As a result, there are no data to suggest the CCG has engendered an increase in the physical activity of the population living in close proximity to the intervention. Further, any future increases in the physical activity of the employees hired by the aforementioned businesses will be difficult to attribute to the CCG. Further complications would arise by attempting to determine the proportion of these employees who are actively using the greenway, and whether the CCG prompted a shift towards active transport modalities.
Due to the lack of available evidence, it is not possible to quantify any change of employability and productivity resulting from the CCG. Additionally, newly created jobs on the greenway would be regarded as a cost associated with the project, paid for by the NI government, and therefore would not provide a reliable measure of new employment opportunities created by the CCG that benefit the NI economy.
Net present social value and benefit-cost ratio
The total social present value of the CCG was estimated to be between £56,797,217 and £67,046,935, from five elements of social and environmental change: land and property, flood alleviation, tourism, biodiversity, and climate change (). Three additional elements were assessed but ultimately excluded due to lack of supporting data (health and wellbeing; employment and productivity; crime).
Table 2. Costs and social present value of the Connswater Community Greenway.
After accounting for construction costs (£40,000,000) and maintenance costs (£2,235,507), the NPSV was between £14,561,710 and £24,811,428. The BCR of the CCG is estimated to be between 1.34 and 1.59. This indicates that for each pound invested in the CCG, the local economy gains between £1.34 and £1.59. It should be noted that the construction costs of the CCG were not discounted, therefore these estimates are likely to be an underestimate of the value for money of the CCG. However, there is the potential for double counting of benefits; increased property values may be part attributed to the reduced risk of flooding or improved biodiversity.
Sensitivity analysis
The resulting BCRs of the sensitivity analysis are presented in , ranging from 0.58 (3.5%, 10 years) to 2.79 (0%, 40 years) when the discount rates and time horizons were varied.
Table 3. BCRs for various discount rates and lifetimes of the greenway.
The alternative present value of land and property values is between £12,407,765 and £22,127,181 (1.5%, 40 years): flooding £60,205,683 (1.5%, 40 years); tourism £449,038 and £1,562,884 (1.5%, 40 years); biodiversity £5,473,009 and £8,814,548 (1.5%, 40 years); and climate change £11,957 (1.5%, 40 years).
BCRs for discount rates between 0% and 5% are presented in . They range from 0.58 to 2.79. BCRs also vary depending on the expected lifetime of the CCG. For an expected lifetime of ten years, the BCR would be 0.58 to 0.68. For lifetimes of 20 and 30 years, the BCRs are 0.93 to 1.10 and 1.17 to 1.39, respectively. These results suggest that the minimum time horizon for a positive return on investment in respect to NPSV is 30 years.
A further sensitivity analyses addressed uncertainty in the model and re-estimated the BCR after removing the present value of three parameters: i) tourism; ii) biodiversity; and iii) flood alleviation. Tourism was removed due to the possibility of double counting with biodiversity and the risk that external visitors to the CCG may displace tourism elsewhere in NI. Without the present value of tourism, the BCR was 1.34 to 1.56. Biodiversity was removed due to the possibility that it was also captured by increased property values. After removing the present value of biodiversity, the BCR was 1.25 to 1.44. We also explored an alternative scenario where the CCG had not included flooding alleviation measures. When the construction costs of the flood alleviation measures (£11,695,970) and the present value of cost savings due to flood alleviation (£43,534,388) were removed, the resulting BCR was 0.43 to 0.77.
Discussion
Social return on investment of the Connswater Community Greenway
The results of the SROI analysis indicated that the CCG offers a positive return on investment with respect to both the NPSV and BCR. Over its 40-year lifetime, we estimate that the CCG will bring total social benefits of between £56,797,217 and £67,046,935. In the base case analysis, the BCR is between 1.34 and 1.59, meaning that for every £1.00 invested in the CCG, NI will experience benefits equivalent to £1.34 to £1.59. This was attributed to increased local property value, protection from flooding, increased tourism, improved biodiversity, and a reduction in air pollution. In order of estimated present value, the elements were flood alleviation (£43,534,388), property (£8,971,984 to £16,000,039), biodiversity (£3,957,502 to £6,373,750), tourism (£324,696 to £1,130,112), and climate change (£8,646). Other elements (health and wellbeing; employment and productivity; crime) were considered but could not be quantified and/or monetised for this analysis. As a result, it is likely that our estimates of the full benefits of the CCG are conservative.
To offset the risk of double counting and improve the robustness of the results we conducted sensitivity analyses to examine how removing three elements of the SROI framework (tourism; biodiversity; flood alleviation) affected the BCR. This was conducted due to the possibility that the flood alleviation measures and increased biodiversity were both captured by increase property prices. However, the risk of these values overlapping was low due to the methodology that was used to measure property prices (aesthetic value of nearby greenspace). The BCR fell to 1.25-1.44 after removing biodiversity, and 0.43-0.77 when flooding alleviation measures and their estimated costs were removed. These revised BCRs indicate that flooding alleviation measures account for a significant portion of the CCG’s NPSV. The sensitivity analyses also addressed the possibility of shorter lifetimes of the CCG: the BCRs were 0.58 to 0.68 for ten years and 0.93 to 1.10 for 20 years, indicating that a positive return on investment for the CCG will not be realised until at least 30 years post-intervention.
Compared to the current analysis, a previous economic evaluation projected greater monetary benefits associated with the CCG (Hunter et al. Citation2020). The authors attributed a portion of this to improvements in health and wellbeing, an effect that we were unable to capture due to a lack of supporting data. The estimated cost of the CCG was also initially lower: £35 m compared to the updated total of £40 m. As a result of lower overall benefits and higher costs, the BCR of the current analysis was also lower: 1.34-1.59 compared to 2.88-5.81. Arguably, however, the present analysis represents a more accurate picture of the CCG’s social value added given that more data were available since its completion.
Health and social inequalities
As previously alluded to, the distribution of effects across population subgroups has important implications for health inequalities. This was not addressed in the present SROI, nor was the effect on other social inequalities. In the UK, individuals living in areas of socioeconomic deprivation carry a disproportionate burden of NCDs (Kontopantelis et al. Citation2018). As such, these individuals stand to benefit considerably from population-based health-promoting interventions such as the CCG. It has previously been posited that high-level interventions that target structural factors are more effective at reducing health inequalities than conventional information-based approaches (Macintyre Citation2007). Further, interventions which require less individual agency are also more effective at reducing inequalities (White et al. Citation2009).
By altering the context within which individuals live and move around, UGBS can reduce the existing social variation in exposure to risk factors for NCDs. For example, socioeconomically disadvantaged communities are more likely to live in areas with poor air quality (Pye et al. Citation2006) - a problem that UGBS can ameliorate. Universal access to UGBS can not only mitigate against the environmental and social stressors prevalent in disadvantaged communities, but they can also provide a foundation for sustainable urbanisation and a platform for progress towards a more equitable distribution of health among urban populations. This message is reiterated in the United Nation’s Sustainable Development Goals (United Nations General Assembly Citation2015) which highlight the role of UGBS in making cities more resilient and sustainable. Specifically, Target 11.7 states that, by 2030, cities should ‘provide universal access to safe, inclusive and accessible, green and public spaces, in particular for women and children, older persons and persons with disabilities’.
The creation of new UGBS carries a risk of further entrenching environmental inequalities through the process of gentrification (Checker Citation2011, Eckerd Citation2011). Gentrification is regarded as an unintended consequence of improving the environmental quality of an area, characterised by class succession and displacement (Atkinson Citation2000). Researchers have argued that the provision of new green spaces, and all the ecosystem services accompanying it, can precipitate an increase in property values as areas become more attractive to investors, resulting in fundamental changes to the sociodemographic composition of an area and displacement of residents. Sieg et al. (Citation2004) hypothesised that the main beneficiaries of environmental improvements are wealthier households that can afford increasing rents and higher property prices. Ultimately, there is a risk that ‘green gentrification’ could increase social inequity in the long-term (Anguelovski et al. Citation2022) and reinforce segregation (Anguelovski et al. Citation2018), which would be detrimental in Belfast, a historically segregated city. Policymakers need to recognise the potential impact that new UGBS can have on the makeup of local areas and ensure that lower-income residents are not displaced.
Methodological considerations
UGBS interventions with a prominent public health component such as the CCG are inherently linked to a wide range of social, economic, environmental and health outcomes. Therefore, a broader concept of (social) value which is captured by SROI analysis (Cabinet Office & Office of the Third Sector Citation2009) make it better suited to estimate the outcomes of UGBS interventions when compared to more reductionist methods of economic evaluation such as cost-benefit analysis or cost-utility analysis. However, the economic evaluation of UGBS interventions is a relatively nascent area of research, and so there are some aspects of this methodological framework that warrant additional consideration that include (Banke-Thomas et al. Citation2015, Masters et al. Citation2017, Ashton et al. Citation2020): transparency around the underlying methodology; the use of reliable data from different sources; thorough documentation of the analyses that were performed; and results that are robust to sensitivity analyses.
Conducting an economic appraisal of public health interventions (PHI) presents several additional challenges, as there are relatively few guidelines. This comes from the difficulty associated with evaluating interventions that target large groups or whole populations – a characteristic of PHIs (Weatherly et al. Citation2009). Weatherly et al.’s review presents four challenges associated with economic evaluations of PHIs. These are: i) attribution of effects; ii) accurately measuring and valuing outcomes; iii) accounting for intersectoral costs; and iv) consideration of equity.
The first challenge, attribution of effects, stems from the difficulty inherent in trying to estimate long-term effects arising from a non-randomised, uncontrolled experiment (Weatherly et al. Citation2009). To circumvent this issue, and rule out potential double counting, sensitivity analyses can be used to simulate different scenarios and combinations of the various parameters that make up the original model (Briggs and Gray Citation1999, Walker and Fox-Rushby Citation2001).
The second challenge, which relates to accurately measuring and valuing the outcomes, can be attributed to a lack of reliable data attached to all the outcomes. This problem is particularly prominent when valuing non-health related outcomes, and exposes the analysis to possible measurement error. Certain models of sensitivity analysis, such as quantitative bias analysis, can be used to measure the magnitude of measurement error (van Smeden et al. Citation2020). This is particularly relevant when trying to capture linkages between various exposure measurements and health effects (Gryparis et al. Citation2009).
The third challenge corresponds to the intersectoral costs and benefits that arise from PHIs. Expenditure in some sectors may reduce the need for funding in others, creating a ripple effect. PHIs will carry an opportunity cost, therefore it is important that the full social benefits are assessed, as well as spill over effects in other sectors of the economy (Drummond et al. Citation2008). To allows for this, the current analysis explored eight areas where the CCG may impact society and converted the associated outcomes into monetary values to facilitate comparisons with other similar interventions.
The fourth and final challenge is the consideration of equity and the distribution of effects across population subgroups. This is a pertinent issue when considering the impact of PHIs on health inequalities. For example, socioeconomically disadvantaged population subgroups may not experience the same benefits as less disadvantaged subgroups, thus there is an underlying uncertainty regarding precisely what benefits the intervention will yield, and for whom. A corollary to this is the issue of displacement effects which may occur. For instance, if non-local visitors to the CCG are substituting their journey to another location, this will generate to overall benefit to the NI economy. This was addressed in sensitivity analysis by removing the value of tourism.
A lack of specific guidance hinders the widespread application of SROIs in public health. Banke-Thomas (Banke-Thomas et al. Citation2015) note that the quality of SROI studies has not improved over time, and that robust reporting guidelines are required to improve the quality of future studies. A solution to this would be to augment the framework for conducting economic evaluations of natural experiments (Deidda et al. Citation2019) with the CHEERS checklist for reporting economic evaluations of health interventions (Husereau et al. Citation2013).
Strengths and limitations
The present SROI analysis attempted to delineate the social benefits of the CCG and, in doing so, monetised the economic impact of this UGBS intervention on the NI economy. The Methods section sets out a rationale for how data were interpreted and the discount rates were applied. Sensitivity analyses were used to explored how alternative discount rates and time horizons affected the NPSV of the CCG, as well as the potential impact of double counting. The sensitivity analyses indicated the CCG would yield a net positive social return on investment after a minimum lifetime of 30 years, discounted at 3.5%.
The analysis had several limitations, the most salient of which was that of insufficient or unreliable data. For example, data used to generate estimates of the present values of tourism, biodiversity, and property values were derived from English studies, which may not be representative of NI. As far as possible, the estimates were chosen from areas in England that could reasonably represent a Northern Irish population. Furthermore, despite a link between UGBS and improved employment productivity and reduced absenteeism, this could not be explored due to insufficient data.
It was not possible to examine the potential future changes in physical activity in the CCG area. Ideally, a similar neighbourhood in Belfast could have been used as a comparison to investigate the changes in physical activity before and after the completion of the CCG in a difference-in-difference study. This had originally been included in the study plans, but another organisation did not repeat their study, therefore no comparison was available. It has been proposed that reductions in crime are associated with increased property values (Pope and Pope Citation2012), therefore, it is plausible that we have double counted and conflated the monetary benefits of both.
The limitations of the present SROI analysis throw into sharp relief the importance of ensuring that economic evaluations are incorporated into the early stages of study design. The missing information that we previously mentioned may be a result of this, and so may have biased the results. However, as indicated earlier, the benefits of the CCG have likely been undervalued as some elements could not be monetised. For that reason, we suspect that the present BCR represents a conservative estimate of the CCG’s potential value. This point is further reinforced when considering that our analysis did not measure the health and wellbeing effects conferred by reduced exposure to air pollution (OECD Citation2016). We did not account for the indirect impacts of UGBS healthcare expenditure, nor did we measure the economic cost of illness and premature deaths attributed to air pollution and how this would be reduced by the CCG. There were two additional areas where we identified potential attribution issues intersecting with health and wellbeing that were excluded from our analysis: first, the health benefits ascribed to exposure to nature and greater biodiversity (von Hertzen et al. Citation2015, Gascon et al. Citation2015, Bratman et al. Citation2019, Hammoud et al. Citation2022); and second, how reduced crime can potentially benefit mental wellbeing (Cornaglia et al. Citation2014, Dustmann and Fasani Citation2016).
It can be difficult to disentangle the effects of broader social policies and changes from those of the CCG intervention. Thus, demonstrating causality in UGBS interventions presents many challenges, foremost of which is addressing the counterfactual. Using real-world data pre- and post-intervention obviates modelling two contrasting scenarios whereby an amenity is both present and not present.
Lastly, questions arise over the distributional effects of the intervention and how the various elements that make up the SROI model affect some groups differently than others, thus making it difficult for these types of analyses to drill down into the true beneficiaries of such an intervention. As noted by Saunders, ‘there are daunting methodological problems in identifying robust causal links between interventions, programmes and policies and desired outcomes. The processes linking funding allocations, policy priorities, mechanisms and effects are likely to be indirect, hard to identify and even harder to measure. Hence the problem of attribution – i.e. the difficulty in identifying the extent to which a particular intervention has created a specific outcome’ (Saunders Citation2011).
Conclusions
In conclusion, based on real-world data collected at two time points (2012 and 2017), the results indicated that the Connswater Community Greenway is likely to generate benefits whose value can be captured in various ways including increased residential property values, reduced risk of flooding, increased tourism, improved biodiversity, and reduced air pollution. It is also expected to increase physical activity in residents and improve their mental health and wellbeing, but data were not available to attribute positive health-related changes in physical activity to the Connswater Community Greenway. The total social present value of the expected changes is estimated to be between £56.8 m and £67 m, resulting in a benefit-cost ratio of 1.34 to 1.59. Therefore, the Connswater Community Greenway is likely to be a good investment. This evidence both demonstrates the value of conducting social return on investment analysis on urban green and blue spaces to show the socioeconomic benefits, as well as providing compelling evidence for policymakers to invest in urban green and blue spaces. From a methodological standpoint, the present study illustrates how social return on investment analysis is a useful tool for the economic evaluation of the multifunctional benefits of urban green and blue space interventions.
Supplemental Material
Download PDF (844.9 KB)Acknowledgements
GroundsWell (https://www.groundswelluk.org/) is an interdisciplinary consortium involving researchers, policymakers, implementers and communities. It is led by Queen’s University Belfast, University of Edinburgh and University of Liverpool in partnership with Cranfield University, University of Exeter, University of Glasgow, University of Lancaster and Liverpool John Moores University. We would like to acknowledge our partners including: Belfast, Edinburgh and Liverpool City Councils, Public Health Agencies of Scotland and Northern Ireland, Greenspace Scotland, Scottish Forestry, Edinburgh and Lothians Health Foundation, Department for Infrastructure Northern Ireland, Belfast Healthy Cities, Climate Northern Ireland, Health Data Research UK, Administrative Data Research Centre, NatureScot, Mersey Care NHS Foundation Trust, Liverpool City Region Combined Authority, Liverpool Health Partners, NHS Liverpool Clinical Commissioning Group, the Scottish Government, Edinburgh Health and Social Care Partnership, HSC Research and Development Office Northern Ireland, EastSide Partnership, Ashton Centre, Regenerus, Sustrans, Cycling UK, CHANGES, The Mersey Forest, Translink, Anaeko, AECOM Ltd, The Paul Hogarth Company and Moai Digital Ltd. The PARC study was supported by a grant from the National Prevention Research Initiative (NPRI) (grant number: G0802045/1). The funding partners are (in alphabetical order): Alzheimer’s Research Trust; Alzheimer’s Society; Biotechnology and Biological Sciences Research Council; British Heart Foundation; Cancer Research UK; Chief Scientist Office; Scottish Government Health Directorate; Department of Health; Diabetes UK; Economic and Social Research Council; Engineering and Physical Sciences Research Council; Health and Social Care Research and Development Division of the Public Health Agency (HSC R&D Division); Medical Research Council; The Stroke Association; Welsh Assembly Government and World Cancer Research Fund. The authors declare that the funders had no role in any aspect of the study, including the study design; in the collection, analysis and interpretation of data; in the writing of the report; or in the decision to submit the article for publication.
Disclosure statement
No potential conflict of interest was reported by the author(s).
Data availability statement
Data will be made available on reasonable request to the study team.
Supplementary material
Supplemental data for this article can be accessed online at https://doi.org/10.1080/23748834.2023.2211226.
Additional information
Funding
Notes on contributors
Christopher Tate
Christopher Tate is a postdoctoral research fellow in Health Economics in the UKPRP GroundsWell consortium based at the Centre for Public Health, Queen’s University Belfast. His research centres on exploring the role of urban green and blue spaces in promoting better economic, social, and health-related outcomes for urban populations. Research interests include: the contribution of urban green and blue spaces to the United Nation’s Sustainable Development Goals; quantitative methods that assess individual policy-related preferences and analysis of discrete choice experiments; economic decision-making and the use of innovative experimental designs; and economic impact and evaluation studies including social return on investment.
Ciaran O’Neill
Ciaran O’Neill is Professor of Health Economics at Queen’s University Belfast and Adjunct Professor of Health Economics at the National University of Ireland, Galway, and a co-investigator in the UKPRP GroundsWell consortium. His research interests include the analysis of health care disparities, policy and technology evaluation, and the measurement and analysis of health preferences. He is a teacher and researcher with over 30 years’ experience in the field of health and has taught and supervised students at all levels of their university education.
Ngan Tran
Ngan Tran is a postdoctoral research fellow in Health Economics in the UKPRP GroundsWell consortium based at the Centre for Public Health, Queen’s University Belfast. Her background is in public health with further degrees on international health and health economics. Ngan’s research interests are in behaviour research, health system research, and global health. Her research projects in the last 10 years were focused on tobacco control, cancer epidemiology, and health economic aspects of non-communicable diseases.
Leonie Heron
Leonie Heron is a postdoctoral research fellow at the Institute of Social and Preventive Medicine, University of Bern. Her previous research focused on the health economics of physical inactivity and sedentary behaviour, including the economic evaluation of interventions. She completed a PhD in health economics and epidemiology at Queen’s University Belfast in 2020. Her current research interests include evidence synthesis and infectious disease epidemiology.
Frank Kee
Frank Kee is a Professor of Public Health Medicine and clinical epidemiologist who directs the Centre for Public Health at Queen’s University Belfast, and is a co-investigator of the UKPRP GroundsWell consortium. He has also worked with the NHS public health service as a consultant for 30 years and has served on numerous UKRI and NIHR public health scientific advisory panels.
Mark A. Tully
Mark A. Tully is Professor of Public Health and Interim Director of Research at the School of Medicine, Ulster University. He is also the Director of the Northern Ireland Public Health Research Network. His research focuses on addressing population levels of physical inactivity and sedentary behaviour, which are major causes of poor physical and mental wellbeing. His research includes interventions targeting older adults and socio-economically disadvantaged communities, using a wide range of methodological approaches.
Mary Dallat
Mary A.T. Dallat is a Public Health Speciality Registrar currently based at the Public Health Agency in Northern Ireland. At the start of her public health training she undertook a PhD which was primarily focused on applying traditional techniques of health economic analysis to evaluate public health interventions, particularly physical activity interventions.
Ruth F. Hunter
Ruth F. Hunter is Professor of Public Health and Planetary Health at the Centre for Public Health, Queen’s University Belfast and Principal Investigator of the UKPRP GroundsWell consortium. She co-leads the Epidemiology and Public Health Research group and the Complexity, Public Health and Planetary Health cluster. Her work primarily involves investigating how we can improve our urban environment for better population health and planetary health. She is particularly interested in research at the intersection of public health and planetary health. Her work involves the application of systems-thinking and complexity science methods, as well as natural experiments, complex intervention development and evaluation, geo-spatial data science and computer vision methods.
References
- Abhijith, K.V., et al., 2017. Air pollution abatement performances of green infrastructure in open road and built-up street canyon environments – a review. Atmospheric environment, 162, 71–86. doi:10.1016/j.atmosenv.2017.05.014.
- Akpinar, A., 2016. Factors influencing the use of urban greenways: a case study of Aydin, Turkey. Urban forestry and urban greening, 16, 123–131. doi:10.1016/j.ufug.2016.02.004
- Anguelovski, I., Connolly, J., and Brand, A.L., 2018. From landscapes of utopia to the margins of the green urban life. City, 22 (3), 417–436. doi:10.1080/13604813.2018.1473126.
- Anguelovski, I., et al., 2022. Green gentrification in European and North American cities. Nature communications, 13 (1), 3816. doi:10.1038/s41467-022-31572-1.
- Aram, F., et al., 2019. Urban green space cooling effect in cities. Heliyon, 5 (4), e01339. doi:10.1016/j.heliyon.2019.e01339.
- Ashton, K., et al., 2020. Health impact and social value of interventions, services, and policies: a methodological discussion of health impact assessment and social return on investment methodologies. Frontiers in public health, 8, 49. doi:10.3389/fpubh.2020.00049
- Astell-Burt, T. and Feng, X., 2019. Urban green space, tree canopy, and prevention of heart disease, hypertension, and diabetes: a longitudinal study. The lancet planet health, 3, S16. doi:10.1016/S2542-5196(19)30159-7
- Atkinson, R., 2000. Measuring gentrification and displacement in Greater London. Urban Studies, 37 (1), 149–165. doi:10.1080/0042098002339.
- Banke-Thomas, A.O., et al., 2015. Social Return on Investment (SROI) methodology to account for value for money of public health interventions: a systematic review. BMC public health, 15 (1), 582. doi:10.1186/s12889-015-1935-7.
- Bauwelinck, M., et al., 2020. Residential urban greenspace and hypertension: a comparative study in two European cities. Environmental research, 191, 110032. doi:10.1016/j.envres.2020.110032.
- Bedimo-Rung, A.L., Mowen, A.J., and Cohen, D.A., 2005. The significance of parks to physical activity and public health. American journal of preventive medicine, 28 (2), 159–168. doi:10.1016/j.amepre.2004.10.024.
- Bodicoat, D.H., et al., 2014. The association between neighbourhood greenspace and type 2 diabetes in a large cross-sectional study. BMJ open, 4 (12), e006076. doi:10.1136/bmjopen-2014-006076.
- Bogar, S. and Beyer, K.M., 2016. Green space, violence, and crime: a systematic review. Trauma, violence & abuse, 17 (2), 160–171. doi:10.1177/1524838015576412.
- Bratman, G.N., et al., 2019. Nature and mental health: an ecosystem service perspective. Science advances, 5 (7). doi:10.1126/sciadv.aax0903.
- Briggs, A.H. and Gray, A.M., 1999. Handling uncertainty in economic evaluations of healthcare interventions. The BMJ, 319 (7210), 635–638. doi:10.1136/bmj.319.7210.635.
- Brown, G., Schebella, M.F., and Weber, D., 2014. Using participatory GIS to measure physical activity and urban park benefits. Landscape and urban planning, 121, 34–44. doi:10.1016/j.landurbplan.2013.09.006
- Built Environment Research Institute, 2019. BERI annual report. Ulster University.
- Cabinet Office & Office of the Third Sector, 2009. A guide to social return on investment [Internet]. Available from: https://neweconomics.org/uploads/files/aff3779953c5b88d53_cpm6v3v71.pdf
- Checker, M., 2011. Wiped out by the “Greenwave”: environmental gentrification and the paradoxical politics of urban sustainability. City & society, 23 (2), 210–229. doi:10.1111/j.1548-744X.2011.01063.x.
- Coleman, J.S., 1988. Social capital in the creation of human capital. AJS; American journal of sociology, 94, S95–120. doi:10.1086/228943
- Concepción, E.D., et al., 2015. Impacts of urbanisation on biodiversity: the role of species mobility, degree of specialisation and spatial scale. Oikos, 124 (12), 1571–1582. doi:10.1111/oik.02166.
- Coombes, E., Jones, A.P., and Hillsdon, M., 2010. The relationship of physical activity and overweight to objectively measured green space accessibility and use. Social science & medicine, 70 (6), 816–822. doi:10.1016/j.socscimed.2009.11.020.
- Cornaglia, F., Feldman, N.E., and Leigh, A., 2014. Crime and mental well-being. The journal of human resources, 49 (1), 110–140. doi:10.1353/jhr.2014.0005.
- Dallat, M., et al., 2014. Urban greenways have the potential to increase physical activity levels cost-effectively. European journal of public health, 24 (2), 190–195. doi:10.1093/eurpub/ckt035.
- Dallimer, M., et al., Apr 2014. Quantifying preferences for the natural world using monetary and nonmonetary assessments of value. Conservation biology: The journal of the society for conservation biology, 28 (2), 404–413. doi:10.1111/cobi.12215.
- Davidson, M.D., 2013. On the relation between ecosystem services, intrinsic value, existence value and economic valuation. Ecological economics, 95, 171–177. doi:10.1016/j.ecolecon.2013.09.002
- DEFRA, 2003. Flood and coastal defence project appraisal guidance. London, UK: Defra Flood Management Division.
- Deidda, M., et al., 2019. A framework for conducting economic evaluations alongside natural experiments. Social science & medicine, 220, 353–361. doi:10.1016/j.socscimed.2018.11.032
- Dela Fuente, F., et al., 2020. Green space exposure association with type 2 diabetes mellitus, physical activity, and obesity: a systematic review. International journal of environmental research and public health, 18 (1), 97. doi:10.3390/ijerph18010097.
- Department for Business Energy & Industrial Strategy, 2017. Greenhouse gas reporting: conversion factors 2017. UK Government.
- Department for Business Energy & Industrial Strategy, 2018. Updated short-term traded carbon value used for UK public policy appraisal.
- Department for Infrastructure, 2018. Northern Ireland traffic count data. Open Data NI.
- Department for Infrastructure, 2019. Travel survey for Northern Ireland in-depth report 2015-17.
- Department for Infrastructure, 2020. Travel survey for Northern Ireland headline report 2020 [Internet]. Available from: https://www.infrastructure-ni.gov.uk/articles/travel-survey-northern-ireland
- Drummond, M., Weatherly, H., and Ferguson, B., 2008. Economic evaluation of health interventions. The BMJ, 337, a1204. doi:10.1136/bmj.a1204
- Dunning, T., 2012. Natural experiments in the social sciences: a design-based approach. Cambridge, UK: Cambridge University Press.
- Dustmann, C. and Fasani, F., 2016. The effect of local area crime on mental health. The economic journal, 126 (593), 978–1017. doi:10.1111/ecoj.12205.
- Eckerd, A., 2011. Cleaning up without clearing out? A spatial assessment of environmental gentrification. Urban affairs review, 47 (1), 31–59. doi:10.1177/1078087410379720.
- European Environment Agency, 2022. Who benefits from nature? Social inequalities in access to urban green and blue spaces across Europe [Internet]. Available from: https://www.eea.europa.eu/publications/who-benefits-from-nature-in
- Garvin, E.C., Cannuscio, C.C., and Branas, C.C., 2013. Greening vacant lots to reduce violent crime: a randomised controlled trial. Injury prevention, 19 (3), 198–203. doi:10.1136/injuryprev-2012-040439.
- Gascon, M., et al., 2015. Mental health benefits of long-term exposure to residential green and blue spaces: a systematic review. International journal of environmental research and public health, 12 (4), 4354–4379. doi:10.3390/ijerph120404354.
- Gascon, M., et al., 2016. Residential green spaces and mortality: a systematic review. Environment international, 86, 60–67. doi:10.1016/j.envint.2015.10.013.
- Geary, R.S., et al., 2021. A call to action: improving urban green spaces to reduce health inequalities exacerbated by COVID-19. Preventive medicine, 145, 106425. doi:10.1016/j.ypmed.2021.106425
- Gryparis, A., et al., 2009. Measurement error caused by spatial misalignment in environmental epidemiology. Biostatistics, 10 (2), 258–274. doi:10.1093/biostatistics/kxn033.
- Hammoud, R., et al., 2022. Smartphone-based ecological momentary assessment reveals mental health benefits of birdlife. Scientific reports, 12 (1), 17589. doi:10.1038/s41598-022-20207-6.
- HM Treasury, 2013. The green book: appraisal and evaluation in central government. London, UK: His Majesty's Stationery Office.
- Horte, O. and Eisenman, T., 2020. Urban greenways: a systematic review and typology. Land, 9 (2), 40. doi:10.3390/land9020040.
- Hunter, R., et al., 2021. Investigating the physical activity, health, wellbeing, social and environmental effects of a new urban greenway: a natural experiment (the PARC study). The international journal of behavioral nutrition and physical activity, 18, 142. doi:10.1186/s12966-021-01213-9.
- Hunter, R.F., et al., 2015. The impact of interventions to promote physical activity in urban green space: a systematic review and recommendations for future research. Social science & medicine, 124, 246–256. doi:10.1016/j.socscimed.2014.11.051
- Hunter, R.F., et al., 2019. Environmental, health, wellbeing, social and equity effects of urban green space interventions: a meta-narrative evidence synthesis. Environment international, 130, 104923. doi:10.1016/j.envint.2019.104923.
- Hunter, R.F., et al., 2020. Social return on investment analysis of an urban greenway. Cities & health, 6 (4), 693–710. doi:10.1080/23748834.2020.1766783.
- Husereau, D., et al., 2013. Consolidated Health Economic Evaluation Reporting Standards (CHEERS) statement. The BMJ, 346 (mar25 1), f1049–f1049. doi:10.1136/bmj.f1049.
- INRIX, 2022. INRIX global traffic scorecard.
- James, P., et al., 2015. A review of the health benefits of greenness. Current epidemiology reports, 2 (2), 131–142. doi:10.1007/s40471-015-0043-7.
- James, P., Banay, R.F., and Hart, J.E., 2015. Review of the health benefits of Laden F. A Greenness. Current epidemiology reports, 2 (2), 131–42.
- Jang, M. and Kang, C.-D., 2016. The effects of urban greenways on the geography of office sectors and employment density in Seoul, Korea. Urban Studies, 53 (5), 1022–1041. doi:10.1177/0042098015569973.
- Kawachi, I., Kennedy, B.P., and Wilkinson, R.G., 1999. Crime: social disorganization and relative deprivation. Social science & medicine, 48 (6), 719–731. doi:10.1016/S0277-9536(98)00400-6.
- Kimpton, A., Corcoran, J., and Wickes, R., 2017. greenspace and crime: an analysis of greenspace types, neighboring composition, and the temporal dimensions of crime. The journal of research in crime and delinquency, 54 (3), 303–337. doi:10.1177/0022427816666309.
- Kondo, M.C., et al., 2018. Urban green space and its impact on human health. International journal of environmental research and public health, 15 (3), 445. doi:10.3390/ijerph15030445.
- Kontopantelis, E., et al., 2018. Disparities in mortality among 25–44-year-olds in England: a longitudinal, population-based study. The lancet public health, 3 (12), e567–75. doi:10.1016/S2468-2667(18)30177-4.
- Kuo, F.E., et al., 1998. Fertile ground for community: inner-city neighborhood common spaces. American journal of community psychology, 26 (6), 823–851. doi:10.1023/A:1022294028903.
- Lachowycz, K. and Jones, A.P., 2011. Greenspace and obesity: a systematic review of the evidence. Obesity reviews: An official journal of the international association for the study of obesity, 12 (5), e183–9. doi:10.1111/j.1467-789X.2010.00827.x.
- Lee, A.C.K. and Maheswaran, R., 2011. The health benefits of urban green spaces: a review of the evidence. Journal of public health, 33 (2), 212–222. doi:10.1093/pubmed/fdq068.
- Lepczyk, C.A., et al., 2017. Biodiversity in the city: fundamental questions for understanding the ecology of urban green spaces for biodiversity conservation. Bioscience, 67 (9), 799–807. doi:10.1093/biosci/bix079.
- Liebelt, V., Bartke, S., and Schwarz, N., 2018. Hedonic pricing analysis of the influence of urban green spaces onto residential prices: the case of Leipzig, Germany. European planning studies, 26 (1), 133–157. doi:10.1080/09654313.2017.1376314.
- Lindsey, G., 1999. Use of urban greenways: insights from Indianapolis. Landscape and urban planning, 45 (2–3), 145–157. doi:10.1016/S0169-2046(99)00023-7.
- Macintyre, S., 2007. Inequalities in health in Scotland: what are they and what can we do about them? MRC Social and Public Health Sciences Unit Occasional Papers. Glasgow: MRC Social and Public Health Sciences Unit.
- Macintyre, S., Macdonald, L., and Ellaway, A., 2008. Do poorer people have poorer access to local resources and facilities? The distribution of local resources by area deprivation in Glasgow, Scotland. Social science & medicine, 67 (6), 900–914. doi:10.1016/j.socscimed.2008.05.029.
- Mason, S.G., 2010. Can community design build trust? A comparative study of design factors in Boise, Idaho neighborhoods. Cities, 27 (6), 456–465. doi:10.1016/j.cities.2010.07.003.
- Masters, R., et al., 2017. Return on investment of public health interventions: a systematic review. Journal of epidemiology and community health, 71 (8), 827 LP–834. doi:10.1136/jech-2016-208141.
- McCunn, L.J. and Gifford, R., 2014. Interrelations between sense of place, organizational commitment, and green neighborhoods. Cities, 41, 20–29. doi:10.1016/j.cities.2014.04.008
- Mitchell, R. and Popham, F., 2008. Effect of exposure to natural environment on health inequalities: an observational population study. The lancet, 372 (9650), 1655–1660. doi:10.1016/S0140-6736(08)61689-X.
- Morancho, A.B., 2003. A hedonic valuation of urban green areas. Landscape and urban planning, 66 (1), 35–41. doi:10.1016/S0169-2046(03)00093-8.
- Moreira, T.C.L., et al., 2020. Green spaces, land cover, street trees and hypertension in the megacity of São Paulo. International journal of environmental research and public health, 17 (3), 725. doi:10.3390/ijerph17030725.
- Motomura, M., et al., 2022. Associations of public open space attributes with active and sedentary behaviors in dense urban areas: a systematic review of observational studies. Health & place, 75, 102816. doi:10.1016/j.healthplace.2022.102816.
- Nero, B.F., et al., 2017. urban green spaces enhance climate change mitigation in cities of the global South: the case of Kumasi, Ghana. Procedia engineering, 198, 69–83. doi:10.1016/j.proeng.2017.07.074
- Ngo, V.D., Frank, L.D., and Bigazzi, A.Y., 2018. Effects of new urban greenways on transportation energy use and greenhouse gas emissions: a longitudinal study from Vancouver, Canada. Transportation research part D: Transport and environment, 62, 715–725. doi:10.1016/j.trd.2018.04.013
- NICE, 2008. Guide to the methods of technology appraisal. London: NICE.
- Nieuwenhuijsen, M.J., et al., 2017. Fifty shades of green: pathway to healthy urban living. Epidemiology, 28 (1), 63–71. doi:10.1097/EDE.0000000000000549.
- Northern Ireland Assembly, 2022. Constituency profiles [Internet]. Available from: http://www.niassembly.gov.uk/assembly-business/research-and-information-service-raise/constituency-profiles/
- Northern Ireland Neighbourhood Information Service, 2022. Police recorded crime (administrative geographies) [Internet]. Available from: https://www.ninis2.nisra.gov.uk/public/PivotGrid.aspxds=10435&lh=76&yn=2001-2020&sk=131&sn=CrimeandJustice&yearfilter=
- Northern Ireland Statistics and Research Agency, 2017. Northern Ireland Multiple Deprivation Measure 2017 (NIMDM2017) [Internet]. Available from: https://www.nisra.gov.uk/publications/nimdm17-soa-level-results
- Northern Ireland Statistics and Research Agency, 2018. Tourism: statistics bulletin [Internet]. Available from: https://www.nisra.gov.uk/sites/nisra.gov.uk/files/publications/Annual-Tourism-Statistics-Publication-2018%281%29.pdf
- Northern Ireland Statistics and Research Agency, 2021. 2020 mid year population estimates for Northern Ireland [Internet]. Available from: https://www.nisra.gov.uk/publications/2020-mid-year-population-estimates-northern-ireland
- Nowak, D.J., Crane, D.E., and Stevens, J.C., 2006. Air pollution removal by urban trees and shrubs in the United States. Urban forestry and urban greening, 4 (3–4), 115–123. doi:10.1016/j.ufug.2006.01.007.
- OECD, 2006. Benefits Transfer. In: D. Pearce, G. Atkinson and S. Mourato, eds. Cost-benefit analysis and the environment: recent developments. Paris: OECD Publishing, 253–267.
- OECD, 2016. The economic consequences of outdoor air pollution. Paris: OECD.
- Office for National Statistics, 2018. Estimating the impact urban green space has on property price - Office for National Statistics.
- Office for National Statistics, 2019. Urban green spaces raise nearby house prices by an average of £2, 500 [Internet]. Available from: https://www.ons.gov.uk/economy/environmentalaccounts/articles/urbangreenspacesraisenearbyhousepricesbyanaverageof2500/2019-10-14
- Penning-Rowsell, E., et al., 2005. The benefits of flood and coastal risk management: a handbook of assessment techniques. London: Middlesex University Press.
- Pereira, H.M., et al., 2010. Scenarios for global biodiversity in the 21st century. Science, 330 (6010), 1496–1501. doi:10.1126/science.1196624.
- Peters, K., Elands, B., and Buijs, A., 2010. Social interactions in urban parks: stimulating social cohesion? Urban forestry and urban greening, 9 (2), 93–100. doi:10.1016/j.ufug.2009.11.003.
- Pope, D.G. and Pope, J.C., 2012. Crime and property values: evidence from the 1990s crime drop. Regional science and urban economics, 42 (1–2), 177–188. doi:10.1016/j.regsciurbeco.2011.08.008.
- Public Health England, 2014. Local action on health inequalities: improving access to green spaces. Health Equity Evidence Review 8. London.
- Purvis, A. and Hector, A., 2000. Getting the measure of biodiversity. Nature, 405 (6783), 212–219. doi:10.1038/35012221.
- Pye, S., King, K., and Sturman, J., 2006. Air quality and social deprivation in the UK: an environmental inequalities analysis. London, UK: DEFRA.
- Roy, S., Byrne, J., and Pickering, C., 2012. A systematic quantitative review of urban tree benefits, costs, and assessment methods across cities in different climatic zones. Urban forestry and urban greening, 11 (4), 351–363. doi:10.1016/j.ufug.2012.06.006.
- Saraev, V., 2012. Economic benefits of greenspace. Edinburgh: Forestry Commission Research report.
- Saunders, M., 2011. Capturing effects of interventions, policies and programmes in the European context: a social practice perspective. Evaluation, 17 (1), 89–102. doi:10.1177/1356389010394480.
- Schipperijn, J., et al., 2013. Associations between physical activity and characteristics of urban green space. Urban forestry and urban greening, 12 (1), 109–116. doi:10.1016/j.ufug.2012.12.002.
- Scott Shafer, C., et al., 2013. Recreation and amenity values of urban stream corridors: implications for green infrastructure. Journal of urban design, 18 (4), 478–493. doi:10.1080/13574809.2013.800450.
- Sen, A., et al., 2014. Economic assessment of the recreational value of ecosystems: methodological development and national and local application. Environmental & resource economics, 57 (2), 233–249. doi:10.1007/s10640-013-9666-7.
- Shadman, S., et al., 2022. The carbon sequestration potential of urban public parks of densely populated cities to improve environmental sustainability. Sustainable energy technologies and assessments, 52, 102064. doi:10.1016/j.seta.2022.102064.
- Sieg, H., et al., 2004. Estimating the general equilibrium benefits of large changes in spatially delineated public goods. International economic review, 45 (4), 1047–1077. doi:10.1111/j.0020-6598.2004.00297.x.
- Spangenberg, J.H. and Settele, J., 2010. Precisely incorrect? Monetising the value of ecosystem services. Ecological complexity, 7 (3), 327–337. doi:10.1016/j.ecocom.2010.04.007.
- Spash, C.L. and Vatn, A., 2006. Transferring environmental value estimates: issues and alternatives. Ecological economics, 60 (2), 379–388. doi:10.1016/j.ecolecon.2006.06.010.
- The Lancet Planetary Health, 2022. Reaching a balance with wild species. The lancet planet health, 6 (8), e640. doi:10.1016/S2542-5196(22)00177-2.
- The Mersey Forest, Natural Economy Northwest, CABE, Natural England, Yorkshire Forward, The Northern Way, et al., 2010. GI-Val: the green infrastructure valuation toolkit. Version 1.6 (updated in 2018).
- To, Q.G., et al., 2013. Workplace physical activity interventions: a systematic review. The American journal of health promotion, 27 (6), 113–124. doi:10.4278/ajhp.120425-LIT-222.
- Tourism Northern Ireland, 2017. Tourism Trends.
- Tully, M.A., et al., 2013. Physical activity and the rejuvenation of Connswater (PARC study): protocol for a natural experiment investigating the impact of urban regeneration on public health. BMC public health, 13 (1), 774. doi:10.1186/1471-2458-13-774.
- Twohig-Bennett, C. and Jones, A., 2018. The health benefits of the great outdoors: a systematic review and meta-analysis of greenspace exposure and health outcomes. Environmental research, 166, 628–637. doi:10.1016/j.envres.2018.06.030
- UK Home Office, 2018. The economic and social costs of crime.
- United Nations General Assembly, 2015. Transforming our world: the 2030 agenda for sustainable development [Internet]. New York. Available from: https://www.unfpa.org/resources/transforming-our-world-2030-agenda-sustainable-development
- United Nations (Habitat III), 2017. New Urban Agenda.
- van Amelsvoort, L.G.P.M., et al., 2006. Leisure time physical activity and sickness absenteeism; a prospective study. Occupational medicine, 56 (3), 210–212. doi:10.1093/occmed/kqj026.
- van Smeden, M., Lash, T.L., and Groenwold, R.H.H., 2020. Reflection on modern methods: five myths about measurement error in epidemiological research. International journal of epidemiology, 49 (1), 338–347. doi:10.1093/ije/dyz251.
- Venter, Z.S., et al., 2022. Is green space associated with reduced crime? A national-scale study from the Global South. The science of the total environment, 825, 154005. doi:10.1016/j.scitotenv.2022.154005
- von Hertzen, L., et al., 2015. Helsinki alert of biodiversity and health. Annals of medicine, 47 (3), 218–225. doi:10.3109/07853890.2015.1010226.
- Walker, D. and Fox-Rushby, J., 2001. Allowing for uncertainty in economic evaluations: qualitative sensitivity analysis. Health policy and planning, 16 (4), 435–443. doi:10.1093/heapol/16.4.435.
- Walmsley, A., 2006. Greenways: multiplying and diversifying in the 21st century. Landscape and urban planning, 76 (1–4), 252–290. doi:10.1016/j.landurbplan.2004.09.036.
- Wan, C., Shen, G.Q., and Choi, S., 2021. Underlying relationships between public urban green spaces and social cohesion: a systematic literature review. City, culture and society, 24, 100383. doi:10.1016/j.ccs.2021.100383
- Wang, S.V., et al., 2022. Understanding variation in the results of real-world evidence studies that seem to address the same question. Journal of clinical epidemiology, 151, 161–170. doi:10.1016/j.jclinepi.2022.08.012
- Weatherly, H., et al., 2009. Methods for assessing the cost-effectiveness of public health interventions: key challenges and recommendations. Health policy, 93 (2–3), 85–92. doi:10.1016/j.healthpol.2009.07.012.
- White, M., Adams, J., and Heywood, P., 2009. How and why do interventions that increase health overall widen inequalities within populations? In: S. Babones, ed. Social inequality and public health. Bristol, UK: Policy Press, 64–81.
- White, M.P., et al., Jun 2013. Would you be happier living in a greener urban area? A fixed-effects analysis of panel data. Psychological science, 24 (6), 920–928. doi:10.1177/0956797612464659.
- WHO Regional Office for Europe, 2016. Urban green spaces and health. Copenhagen.
- Wolch, J.R., Byrne, J., and Newell, J.P., 2014. Urban green space, public health, and environmental justice: the challenge of making cities ‘just green enough. Landscape and urban planning, 125, 234–244. doi:10.1016/j.landurbplan.2014.01.017
- Wolfe, M.K. and Mennis, J., 2012. Does vegetation encourage or suppress urban crime? Evidence from Philadelphia, PA. Landscape and urban planning, 108 (2–4), 112–122. doi:10.1016/j.landurbplan.2012.08.006.
- World Health Organization, 2017. Urban green spaces: a brief for action. Regional Office For Europe.
- Wu, J., et al., 2015. Impact of Urban Green Space on Residential Housing Prices: case study in Shenzhen. Journal of urban planning and development, 141 (4). doi:10.1061/(ASCE)UP.1943-5444.0000241.
- Zhou, X. and Rana, M.M.P., 2012. Social benefits of urban green space: a conceptual framework of valuation and accessibility measurements. Management of environmental quality, 23 (2), 173–189. doi:10.1108/14777831211204921.