
ABSTRACT
Cities worldwide have adopted the ‘20-minute neighbourhood’ concept to promote local healthy living through the provision of everyday services close to home. However, evidence on their impact beyond active travel is lacking. This study investigates whether 20-minute neighbourhoods shape people’s interactions with food stores. Data were from 769 participants from the 2018-2019 Places and Locations for Activity and Nutrition study (ProjectPLAN) conducted in Melbourne and Adelaide, Australia. Outcomes were distance from home to different food stores, frequency of store visits, transport mode to food stores, and reasons for shopping at primary food store. Comparisons were made between those in 20-minute neighbourhoods and non-20-minute neighbourhoods. Visited stores were closer to home for those in 20-minute neighbourhoods. Residents of 20-minute neighbourhoods more frequently visited an additional fruit and vegetable outlet than those of non-20-minute neighbourhoods. While car travel prevailed across neighbourhood types, walking to food stores was more common in 20-minute neighbourhoods. Differences were observed in reasons for shopping at primary food store between residents of 20-minute neighbourhoods and non-20-minute neighbourhoods. This study suggests 20-minute neighbourhoods offer opportunities for greater engagement with local food stores. Whilst walking to stores is more common in 20-minute neighbourhoods, car use remains a dominant travel mode.
Introduction
Increasingly, practitioners and policy makers are advocating for land use planning policies to create healthy environments that encourage healthy lifestyles (Lowe et al. Citation2022). Terms such as 20-minute neighbourhood (Portland Plan Citation2012, Victoria State Government Citation2019, The Scottish Government Citation2020), x-minute neighbourhood (Logan et al. Citation2022), and 15-minute city (Paris Citation2021) have been used to reflect the concept of compact mixed-used neighbourhoods. Underlying the many variations of the concept is a core aim to promote local and healthy living through the provision of easily accessible everyday amenities and services (e.g. grocery stores, parks and gardens) (Portland Plan Citation2012, Department of Environment Citation2017). In Australia, strategic planning documents from the city of Melbourne have repeatedly promoted 20-minute neighbourhoods as a key component in recent urban planning strategies (State of Victoria and Department of Transport Citation2014, State of Victoria Citation2015, Department of Environment Citation2017, Victoria State Government Citation2019). Similar concepts related to compact urban planning designed to promote healthier lifestyles have also been put forward in other Australian cities including Adelaide (Government of South Australia and Department of Planning Citation2017). Whilst benefits related to healthier lifestyles and local living have been consistently projected (Victoria State Government Citation2019, Emery and Thrift Citation2021), direct evidence to underpin such claims is generally lacking, and potential negative impacts are not considered in existing policy documents. A critique of Plan Melbourne’s strategy for 20-minute neighbourhoods has highlighted the loosely defined characteristics of the 20-minute neighbourhood concept in policy documents and emphasised the need for more details regarding the measurement of a 20-minute neighbourhood, monitoring procedures and thorough impact assessments (Thornton et al. Citation2022). Whilst the concept appears laudable in principle, a recent policy review of the 20-minute neighbourhood concept across different countries also stressed the general lack of operationalisation and measurable targets to enable implementation and to deliver actual planning outcomes (Gower and Grodach Citation2022).
With 20-minute neighbourhoods aiming to promote healthy and local living (e.g. healthy diets and active travel) through improved service provision (Victoria State Government Citation2019, Emery and Thrift Citation2021), research examining whether and how 20-minute neighbourhoods shape interactions with local food environments is warranted. Previously, we have examined such interactions with cafés, takeaway outlets and local restaurants (Oostenbach et al. Citation2022). In the present study, we turn our attention to interactions with grocery stores and fruit and vegetable retailers.
For over 20 years, research has pointed to potential associations between local neighbourhood food environments and health behaviours and outcomes (Glanz et al. Citation2005, Story et al. Citation2008), although the evidence base remains mixed (Giskes et al. Citation2011, Caspi et al. Citation2012, Engler-Stringer et al. Citation2014, Rahmanian et al. Citation2014, Cobb et al. Citation2015, Abeykoon et al. Citation2017, Atanasova et al. Citation2022). Existing assumptions that proximity-based indicators of accessibility will be reflected in health behaviours are misguided. For example, we should not assume that people use the food stores most proximal to where they live (Hillier et al. Citation2011, Drewnowski et al. Citation2012, Krukowski et al. Citation2012, Thornton et al. Citation2017). This can be partly explained by the fact that various factors may influence food store choice, such as proximity to work, price, opening hours, public transport access and ease of parking (Ayala et al. Citation2005, Wiig and Smith Citation2009, Drewnowski et al. Citation2012, Kerr et al. Citation2012, Krukowski et al. Citation2012, Citation2013, Cannuscio et al. Citation2014, Minaker et al. Citation2016).
Another core assumption of 20-minute neighbourhoods is that they will encourage non-motorised forms of transport and in the case of Melbourne, walking is promoted as the main alternative form of transport (Portland Plan Citation2012, Department of Environment Citation2017). From a food shopping perspective, walking for food shopping means people have to carry their groceries, which for some people may be a deterrent, even for short trips (Mackett Citation2003). The convenient cargo function of the car (i.e. enabling drivers to carry goods and other people with them) has previously been identified as a key reason for car dependence, particularly for (food) shopping trips (Ibrahim Citation2003, Mackett Citation2003, Mattioli et al. Citation2016). In Melbourne, and many other Australian cities, transporting goods using means such as a bicycle still remains a relatively rare behaviour, even when the terrain and weather is favourable (Munro Citation2019). Although residents of 20-minute neighbourhoods may use food stores close to home (Oostenbach et al. Citation2022), it is unclear whether they still drive to buy groceries. Whilst longer distance to grocery stores has been linked to driving to grocery stores (Guy Citation2009, Jiao et al. Citation2011, Rokseth et al. Citation2021), residential proximity to grocery stores may not necessarily mean people walk or cycle for food shopping (Mackett Citation2003). Given the routine nature of food shopping and that driving is the main mode of transport (for shopping trips) in Australia and other high-income countries (Department for Transport Citation2016b, Citation2016a, Hagberg and Holmberg Citation2017, National Transport Authority Citation2018, Infrastructure Australia Citation2019), it is important to examine whether the 20-minute neighbourhood concept holds the potential to promote active transport when shopping for food.
This study investigates associations between neighbourhood type (20-minute neighbourhood vs. non-20-minute neighbourhood) and the location of visited grocery stores in Melbourne and Adelaide, Australia. It also descriptively explores differences in frequency of visits and mode of transport to visited grocery stores between residents of 20-minute neighbourhoods and non-20-minute neighbourhoods. Differences in the reasons for shopping at main food store between residents of 20-minute neighbourhoods and non-20-minute neighbourhoods are also descriptively explored. Understanding how people choose stores at which they shop will help inform policy makers and urban planners designing neighbourhoods that facilitate healthy food behaviours and in turn promote good health, particularly if reasons are modifiable factors (e.g. infrastructure such as parking and public transport access). While we recognise that investigating food shopping behaviours will help shed light on potential health implications of 20-minute neighbourhoods, we wish to emphasise that our focus is on health behaviours rather than health outcomes. This distinction is crucial because behaviours tend to respond more readily to cues within the built environment, while health outcomes represent the cumulative impact of exposures over an extended period of time.
Methods
This study used data from participants (N = 769) who completed the ‘food survey’ of the cross-sectional Places and Locations for Activity and Nutrition study (ProjectPLAN). Designed to investigate the benefits of living in a 20-minute neighbourhood (20MN) on physical activity and food behaviours, ProjectPLAN was conducted between October 2018 and May 2019 among adults aged 18 years and over living in Melbourne and Adelaide, Australia. Melbourne represents a higher density setting and is the city promoting the 20MN concept (Victoria State Government Citation2019). Adelaide is a lower density setting and has similar plans to promote healthier lifestyles through urban redesign (Government of South Australia and Department of Planning Citation2017). Ethics approval for ProjectPLAN was obtained from the Deakin University Human Research Ethics Committee (HEAG-H 168_2017).
Sampling strategy
Residential addresses were identified from each strata combination of city (Melbourne or Adelaide), neighbourhood type (20MN or non-20MN) and neighbourhood socio-economic status (SES) (high SES or low SES). A random selection of households from within each strata were invited by mail to participate in the survey. It was requested that the main household food purchaser complete the food survey. Additional details on sampling for the food survey are published elsewhere (Oostenbach et al. Citation2022).
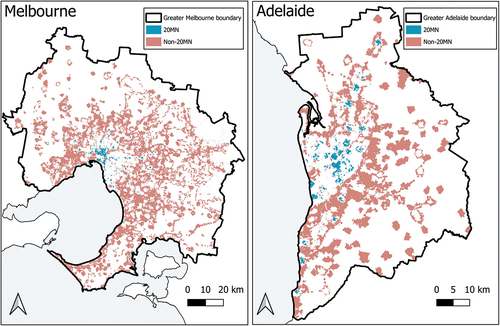
The 20MN definition used was based on a measure of access to five layers of resource groups: healthy food (large supermarkets, smaller supermarkets, fruit and vegetable store/market), community facilities (primary schools, general practitioners, pharmacies, libraries, post offices, cafés), recreation facilities (gyms), public open spaces (natural and semi-natural open space, parks and gardens, conservation reserves, recreation corridors, sports fields and organised recreation areas) and public transport (bus stops, tram stops, train stations). Location data for the resources were obtained using government and commercial data sources. Non-20MNs were those that had few of the individual attributes listed against the layers (no more than five for Melbourne and no more than four for Adelaide). It is noted here that the measure that we operationalised and used aligned with the various terms and concepts presented in the Plan Melbourne urban planning document (State of Victoria Citation2015). However, this concept as presented in the planning document remains vague and poorly rationalised. The authors were therefore required to use some discretion in the development of this measure with the rationale underpinning the approach used fully described in a publication that specifically details the operationalisation of the 20MN measure (Thornton et al. Citation2022). presents the spatial distribution of 20MNs and non-20MNs in Melbourne and Adelaide.
Figure 1. Spatial distribution of 20-minute neighbourhoods (20MNs) and non-20-minute neighbourhoods (non-20MNs) in Melbourne and Adelaide.
Neighbourhood SES was defined using the Index of Relative Socio-economic Advantage and Disadvantage (IRSAD) from the Australian Bureau of Statistics at both the statistical area (SA) level 1 and level 2 (Australian Bureau of Statistics Citation2018). This index summarises data on economic and social conditions of individuals and households within an area, such as relative advantage and disadvantage measures, using income and occupation data from the Australian census (Australian Bureau of Statistics Citation2018). At each SA level, the areas were ranked according to IRSAD and these ranks were split into deciles ranging from 1 (lowest SES) to 10 (highest SES) (Australian Bureau of Statistics Citation2018). SA1s within deciles 1, 2 or 3 that were nested within SA2 IRSAD deciles 1, 2 or 3 were defined as low SES areas. This reflects smaller areas of lower SES within a larger community of lower SES areas and avoids a situation where low SES SA1s are surrounded by higher SES areas. The method was repeated for SA1s and SA2s within deciles 8, 9 and 10 to represent high SES areas.
Study variables: outcomes
Distance to primary food outlet, secondary food outlet and additional fruit and vegetable outlet
Three distance outcomes were considered. All participants were asked to provide details of the supermarket, grocery store or market where most food is purchased. This was termed the primary food outlet. Participants were asked to provide the name of one store or market that they buy the most food from, as well as the suburb and street name or nearest intersection or landmark for this store or market. Full addresses were obtained using Google Maps and the X-Y coordinates were extracted. Participant home addresses were mapped and the shortest road network distance between the home address and the store or market was calculated for each participant, using the user-written command osrmtime in Stata (Huber and Rust Citation2016).
The other distance outcomes included distance to a secondary food outlet (i.e. a supermarket, grocery store or market visited at least once every two weeks to purchase food) and distance to an additional fruit and vegetable outlet (i.e. store or market visited at least once every two weeks to purchase fresh fruit or vegetables), where relevant. Distances were calculated in the same manner as for the primary food outlet. Where participants entered more than one store for the main food outlet (6.2% of 769 participants reported more than one primary food outlet), the first listed outlet was used as the primary food outlet and other outlets were considered as the secondary or fresh fruit or vegetable outlet.
Frequency of visits and mode of transport to primary food outlet, secondary food outlet and additional fruit and vegetable outlet
All participants were asked how often they usually visit their primary food outlet (‘less often than once every two weeks’, ‘once every two weeks’, ‘once per week’, ‘twice per week’, ‘three times per week’, ‘four times per week’, ‘five times per week’, ‘six times per week’, or ‘seven or more times per week’) and how they usually travelled to this outlet (‘car’, ‘walk’, ‘bicycle’, ‘public transport’, or ‘other’). Participants who reported also visiting a secondary food or additional fresh fruit or vegetable outlet at least once every two weeks were asked to provide details of their frequency of visits to each of those additional outlets (‘once every two weeks’, ‘once per week’, ‘twice per week’, ‘three times per week’, ‘four times per week’, ‘five times per week’, ‘six times per week’, or ‘seven or more times per week’) and usual mode of transportation to each of those outlets (same response categories as for primary outlet).
Reasons for shopping at primary food outlet
All participants were asked to select reasons for shopping at their primary food outlet from a list of responses, including ‘ease of getting a car park’, ‘easily accessible by public transport’, ‘freshness or variety of fruit and vegetables’, ‘availability of culturally specific food items’, ‘it is close to home’, ‘it is close to other shops and services I use’, ‘it is close to work’, ‘low price of food items’, and ‘wide product range’. More specifically, for each listed reason, participants were asked to indicate (yes/no) if it was an important reason for them shopping at their primary food outlet. Additionally, amongst the options participants indicated as important reasons, they were asked to select the most important reason for shopping there.
Study variables: exposures
The main comparison of interest in this study was neighbourhood type: 20MN or non-20MN. The 20MN contains access to all features (healthy food, community facilities, recreation facilities, public open space and public transport), i.e. areas with a higher level of service and amenity provision. The non-20MN includes access to only a few features, i.e. areas with a lower level of service and amenity provision. The more detailed description can be found in the sampling strategy section and in the operationalisation paper (Thornton et al. Citation2022).
Study variables: other covariates
As per best practice (Tennant et al. Citation2020), a causal diagram was developed to identify key potential confounders of the association between residing in a 20MN and distance travelled to food outlets (see Supplementary Additional file 1). Age (years), choose to walk or cycle rather than drive (always or mostly, sometimes, rarely or never), self-rated health (poor or fair, good, very good or excellent), relationship status (in a relationship and living with partner, in a relationship and not living with partner, single), children in the household (no children, at least one child aged 4 years or under, only child(ren) aged over 4 years), highest household qualification (less than university, university), and ability to manage on household income (very difficult or difficult, just getting by, comfortable or very comfortable) were all identified as potential individual and household level confounders. Additionally, as a measure of neighbourhood self-selection, we used preference to live in a neighbourhood because there was a supermarket within a 20-minute walk (i.e. if participants could reach a grocery store or supermarket within a 20-minute walk and if this was a reason they chose to move or live there) (Lamb et al. Citation2020). Responses were categorised as not important (i.e. not within a 20-minute walk or within a 20-minute walk but not an important reason for living here) or important (i.e. within a 20-minute walk and an important reason for choosing to move or live here).
Gender (male/female) was considered as it was assumed to be prognostic of the outcome. As stratified sampling was conducted by neighbourhood SES (low/high), this variable was also included in the analysis.
Statistical analysis
Analyses were conducted separately for Melbourne and Adelaide to explore potential cross-context differences. It was considered a priori that the impact of 20MNs could differ between both cities due to differences in population density, density of services and amenities and public transport infrastructure. Linear regression models were fitted to examine the association between residing in a 20MN and distance travelled to the primary food outlet. Minimally adjusted models included only the stratification variable neighbourhood SES. Fully adjusted models included all covariates. Distance travelled to food outlets was log-transformed to deal with the skewed distribution. Coefficients were exponentiated to ease interpretation of log-linear β estimates and obtain geometric means interpreted as a percentage change in outcome as compared to the reference group for a categorical exposure variable (or with each unit increase in a continuous exposure variable). It was assumed that the distance travelled may be more correlated for participants residing closer to one another (people living near to each other are exposed to the same neighbourhood and may thus have similar behaviours). Therefore, an inverse distance matrix was created using the home addresses of participants in each city and Moran’s I was used to test for evidence of residual spatial autocorrelation (Moran Citation1950, Yang et al. Citation2022). Moran’s I is the most commonly used measure of spatial autocorrelation, providing a measure of how related observations are (i.e. model residuals in this context) based on the location at which they are measured. It is a measure of correlation which ranges from values of −1 which indicates negative spatial autocorrelation or complete spatial dispersion to 1 indicating high positive spatial autocorrelation. A value of 0 indicates complete spatial randomness (perfect dispersion). When residual spatial autocorrelation is present, findings from linear regression models may be misleading as these models assume independent errors. Therefore, spatial autoregressive models were fitted which account for spatial autocorrelation. These included spatially lagged errors using the inverse distance matrix.
A complete case analysis was conducted assuming data were Missing Completely At Random (MCAR). Sample characteristics were compared for the full sample, complete case sample and omitted participants (see Supplementary Additional file 2). The complete case sample appears to be representative of the original sample, as sample characteristics appear similar for both. Only participants who provided a secondary food outlet or additional fruit and vegetable outlet were included in the analyses for these outcomes. These outcomes were modelled using the same approach as adopted for the primary outcome. The final sample size for each outcome is shown in .
Figure 2. Boxplots of distance from home to food outlets by neighbourhood type and city.
Descriptive characteristics of the frequency of visits and mode of transport to each food outlet, and reasons for shopping at their primary food outlet were calculated by neighbourhood type. Fisher’s Exact Tests were used to determine if there was evidence of an association between neighbourhood type and these outcomes. All statistical analyses were conducted using Stata version 16.0.
Results
Of 769 participants who completed the food survey, 358 were from Melbourne and 411 from Adelaide (see Supplementary Additional file 3). Of these, 301 (84.1%) from Melbourne and 370 (90.0%) from Adelaide were included in the complete case analysis for the primary food outlet outcomes. Sample descriptive characteristics for the complete case analysis for the primary food outlet outcomes are shown in .
Table 1. Descriptive characteristics of the participants by neighbourhood type and city (N = 671).
Distance to primary food outlet, secondary food outlet and additional fruit and vegetable outlet
presents the boxplots of distance from home to each outlet by neighbourhood type across each city. The median distance travelled to the primary food outlet in both cities was greater in non-20MNs (Melbourne: 3.4 km, IQR: 2.4–4.6 km; Adelaide: 3.0 km, IQR: 2.4–4.3 km) than in 20MNs (Melbourne: 1.4 km, IQR: 0.8–2.7; Adelaide: 1.4 km, IQR: 0.9–2.0 km). The median distances travelled to the secondary and additional fruit and vegetable outlets were also greater in non-20MNs than in 20MNs in both cities.
Models of log distance to primary food outlet
There was strong evidence of a difference in log distance to the primary food outlet between non-20MNs and 20MNs in both Melbourne (spatial regression β = −0.72, 95% CI −0.91 to −0.54) and Adelaide (spatial regression β = −0.84, 95% CI −1.01 to −0.68), with those living in 20MNs travelling shorter distances to the primary food outlet than those living in non-20MNs. There was strong evidence of spatial autocorrelation in the distance to the primary food outlet in Adelaide (p < 0.001) but not Melbourne (p = 0.74). Supplementary Additional files 4 and 5 present the full results for each model including estimates for covariates included in the adjusted models.
Results from the exponentiated coefficients indicated that those living in 20MNs travelled 51% shorter distances to the primary food outlet (95% CI 42% to 60% shorter) in Melbourne and 57% shorter distances in Adelaide (95% CI 49% to 64% shorter) than those in non-20MNs in each city.
Models of log distance to secondary food outlet and additional fruit and vegetable outlet
As with the primary food outlet, average distances travelled were shorter for those living in 20MNs than those living in non-20MNs. Results from the regression models of log distance to the secondary food outlet and additional fruit and vegetable outlet for Melbourne and Adelaide are shown in Supplementary Additional files 6-9. The average distance travelled to the secondary food outlet was 49% shorter (95% CI 36% to 60% shorter) in 20MNs than non-20MNs in Melbourne and 50% shorter (95% CI 39% to 59%) in 20MNs than non-20MNs in Adelaide. The average distance travelled to an additional fruit and vegetable outlet was estimated to be 44% shorter (95% CI 18% to 62% shorter) in 20MNs in Melbourne and 43% shorter (95% CI 20% to 60% shorter) in 20MNs in Adelaide.
Frequency of visits to primary food outlet, secondary food outlet and additional fruit and vegetable outlet
There did not appear to be much difference in the frequency of visits to the primary or secondary food outlets between participants residing in 20MNs and non-20MNs in either Melbourne (primary: Fisher’s Exact Test p-value = 0.227; secondary: p = 0.835) or Adelaide (primary: p = 0.824; secondary: p = 0.256) (). Descriptive statistics provided some indication of a difference in frequency of visitation to an additional fruit and vegetable outlet between participants residing in 20MN and non-20MNs in Melbourne. A higher percentage in non-20MNs visited an additional fruit and vegetable outlet once per week (non-20MNs: 38%, 20MNs: 20%), whereas a higher percentage in 20MNs visited at least twice per week (non-20MNs: 10%, 20MNs: 23%). However, there was only weak evidence of a difference in frequency between neighbourhood types (p = 0.058). A similar pattern was observed for fruit and vegetable outlet visitation frequency in Adelaide (p = 0.071).
Table 2. Frequency of visits and mode of transport to food outlets by neighbourhood type and city.
Mode of transport to primary food outlet, secondary food outlet and additional fruit and vegetable outlet
The usual mode of transport to primary, secondary and additional fruit and vegetable outlets by neighbourhood type and city is shown in . There was strong evidence of a difference between 20MNs and non-20MNs in mode of transport used to travel to the primary food outlet in Melbourne (Fisher’s Exact Test p-value < 0.001) and Adelaide (p < 0.001). Almost all participants from non-20MNs (Melbourne 94%, Adelaide 98%) reported travelling to the primary food outlet by car whereas a lower percentage was observed in 20MNs, although this still indicated the majority of participants travelled by car (Melbourne 61%, Adelaide 78%). The percentage of participants who walked to the primary food outlet was higher in 20MNs (Melbourne 30%, Adelaide 19%) than in non-20MNs (Melbourne 1%, Adelaide 1%). Similar results were observed for the secondary food outlet and additional fruit and vegetable food outlet in each city, although the differences in the percentage who travelled by car in 20MNs and non-20MNs was much greater in Melbourne than in Adelaide. Almost 91% of those in non-20MNs travelled by car to the secondary food outlet in Melbourne, compared to only 56% in 20MNs. Meanwhile, 95% of those in non-20MNs travelled by car to the additional fruit and vegetable food outlet in Melbourne, compared to only 45% in 20MNs. Another finding of note is the almost complete absence of participants cycling to access food outlets across both neighbourhood types and cities ().
Reasons for shopping at primary food outlet
shows the proportion of participants who reported each reason for shopping at primary food outlet by neighbourhood type and city. A higher percentage of participants from non-20MNs reported the ease of getting a car park as an important reason to shop at their primary food outlet than in 20MNs in Melbourne (non-20MNs: 82%, 20MN: 58%, Fisher’s Exact Test p-value < 0.001) and Adelaide (non-20MNs: 80%, 20MN: 70%, p = 0.027). While a higher percentage of participants from 20MNs reported easy access by public transport as an important reason to shop at their primary food outlet in Melbourne (20MNs: 27%, non-20MNs: 17%, p = 0.042), no major differences were observed in Adelaide (20MNs: 17%, non-20MNs: 13%, p = 0.235). A higher percentage of participants from non-20MNs reported the food outlet being close to other shops as an important reason to shop at their primary food outlet in Melbourne (non-20MNs: 76%, 20MNs: 58%, p = 0.001), but differences in percentages across neighbourhood type were smaller in Adelaide (non-20MNs: 67%, 20MNs: 58%, p = 0.101). Low price was also an important reason for a higher percentage of participants from non-20MNs in Adelaide (non-20MNs: 59%, 20MNs: 38%, p < 0.001), but no differences in percentage of participants across neighbourhood type were observed in Melbourne (non-20MNs: 47%, 20MNs: 46%, p = 0.905).
Table 3. Reasons for shopping at primary food outlet or market by neighbourhood type and city.
Most important reason for shopping at primary food outlet
There was little evidence of a difference in the most important reason for shopping at the primary food outlet by neighbourhood type in Melbourne (Fisher’s Exact Test p-value = 0.134), with closeness to home the most commonly reported most important reason for participants in both 20MNs (47%) and non-20MNs (43%) (). However, there was strong evidence of a difference in the most important reason by neighbourhood type in Adelaide (p = 0.007). Although the most frequently reported reason was closeness to home in both 20MNs and non-20MNs, the percentage was higher in 20MNs (20MN: 46%, non-20MN: 33%). Combined, the various in-store factors (price, product range, and freshness) were also seen as the most important reason for shopping at the primary food outlet across both neighbourhood types and cities.
Discussion
This study examined associations between neighbourhood type (20MN vs. non-20MN) and the location of visited food outlets, frequency of visits, mode of transport to those outlets, and differences in the reasons for shopping at primary food outlet. Key results indicated that visited food outlets were closer to home for those in 20MNs than in non-20MNs and that while travelling by car was generally the most dominant mode of transport to food outlets across both neighbourhood types, a larger proportion of residents of 20MNs walked to their frequently used food outlets compared to non-20MNs.
Our previous research has suggested residents of 20MNs travel shorter distances from home to access out-of-home food outlets such as cafés, restaurants, and takeaway outlets compared to residents of non-20MNs (Oostenbach et al. Citation2022). Along with the present findings, these results provide evidence that living in a 20MN results in a shorter distance travelled from home to food purchase locations. However, whilst more localised grocery shopping behaviours were observed in residents of 20MNs, no differences in the frequency of visits to grocery stores (primary and secondary outlet) were observed between residents of 20MNs and non-20MNs. This may be because even with more proximal access to food, people may have a preference to undertake grocery shopping in bulk resulting in less frequent store visits as opposed to visiting more frequently and buying fewer items. More frequent visits to an additional fruit and vegetables outlet may relate to the nature of these perishable items which people prefer to purchase fresh as required.
Access to a mix of destinations in local neighbourhoods including supermarkets and small food stores has previously been linked to more frequent walking (King et al. Citation2015). We found that a larger proportion of residents of 20MNs walked to food outlets compared to non-20MNs. The higher level of local service provision in 20MNs may foster active travel for food shopping, supporting the projected benefit of active living in 20MNs (Victoria State Government Citation2019). Active travel such as walking and cycling to grocery stores present an opportunity to increase overall levels of physical activity. Higher levels of physical activity have been linked to numerous health benefits such as preventing cardiovascular disease, cancer, and obesity (Anderson and Durstine Citation2019). However, travelling by car remained the most dominant mode of transport to reach food outlets across both neighbourhood types, aligning with evidence showing that travelling by car is the main mode of transport in Australia (Infrastructure Australia Citation2019), including for shopping trips (Department of Transport and Main Roads Citation2012, Bureau of Transport Statistics Citation2014, Eady and Burtt Citation2019). Further, the use of cycling as a mode of transport was almost completely absent. The convenience of driving a car and the ability to carry heavy goods is a main reason frequently reported for using the car for shopping trips, even when trips are short (Mackett Citation2003). Other important reasons why people may favour the car over active modes of transport is the lack of safety and adequate pedestrian and cycling infrastructure (Saelens et al. Citation2003, de Souza et al. Citation2014). To promote a shift away from cars towards active forms of transport, neighbourhoods need to provide residents with the adequate infrastructure to use active transport, including a safe network of walking and cycling lanes connecting residents to daily amenities and services (Yang et al. Citation2019, Mueller et al. Citation2021). Additionally, for many years Australian urban policies have emphasised walking over cycling leaving the cycling infrastructure behind. Reducing car dependence for food shopping trips will likely require the use of alternative material arrangements to carry goods, i.e. new means to fulfil the cargo function so far mainly attributed to cars (Bartiaux Citation2013, Mattioli et al. Citation2016). Thus, changes in the pedestrian and cycling infrastructure should also be paralleled by the promotion of behaviours facilitating a convenient use of active transport for grocery shopping activities, including, for example, the use of shopping trolleys (Calvignac et al. Citation2014, Mattioli et al. Citation2016) and cargo bikes (i.e. bicycles designed to transport loads) (Wrighton Citation2014, Riggs Citation2016, Wrighton and Reiter Citation2016). Further research is warranted to understand how to effectively promote non-motorised forms of transports when shopping for food accounting for the importance given to the cargo function of travel (Mattioli et al. Citation2016). Until large scale urban changes are mandated, the number of people cycling in Australian cities for purposes such as food shopping will continue to lag behind many of their European counterparts.
In terms of reasons why people choose to shop at their primary food outlet, a larger proportion of residents of non-20MNs reported the easy of getting a car park as an important reason for shopping at primary food outlet, likely reflecting the high proportion of non-20MN residents using a car as main mode of transport (Melbourne 94%, Adelaide 98%). Easy access by public transport was an important reason for a larger proportion of residents of 20MNs, although the difference between neighbourhood type was evident in Melbourne but not Adelaide. This difference across cities may be attributed to the lack of an extensive public transport system in Adelaide (Adelaide Metro Citation2023), which was also captured by the limited use of public transport to access food outlets by Adelaide residents. It is worth noting that while easy access by public transport was often reported as an important reason for shopping at primary outlet amongst those in 20MNs in Melbourne (27%), the percentage of participants actually using public transport as main transport mode was much lower (4%). Being close to home was the most important reason for shopping at primary food outlet for most 20MN residents in Adelaide, likely further stressing the importance of local service provision in 20MNs when people do not have access to an extensive public transport system. Only evident in Melbourne was the closeness to other shops and services reported as an important reason amongst a larger proportion of residents of non-20MNs than 20MNs. If non-20MN residents need to travel longer distance to access food outlets, perhaps they choose destinations where they can combine multiple trip purposes to compensate for efforts invested in reaching destinations further away from home (Tong et al. Citation2004, Arentze et al. Citation2005). In Adelaide, a larger proportion of non-20MN residents reported low price of food items as an important reason for shopping at primary food outlet, emphasising the importance of access to affordable food stores with nutritious foods. Overall, findings are consistent with previous research reporting proximity to home (Wiig and Smith Citation2009, Krukowski et al. Citation2012, Citation2013, Minaker et al. Citation2016), food affordability (Wiig and Smith Citation2009, Krukowski et al. Citation2012, Citation2013, Netopil et al. Citation2014, Minaker et al. Citation2016), and proximity to public transport (Wiig and Smith Citation2009, Netopil et al. Citation2014) as reasons for food store choice. Our findings further extend our understanding of why people choose the food outlet they do, as we considered the type of neighbourhood people live in. We observed differences across neighbourhood type and city, providing new insights to urban planners in terms of factors to consider when designing neighbourhoods.
This is the first study to examine how and why people in 20MNs and non-20MNs use local food environments. In addition to investigating the frequency of visits to food outlets in the context of people’s residential neighbourhood, we also explored the location of the food outlets visited and reasons for choosing them, providing a more comprehensive understanding of neighbourhood use. However, although we captured the frequency and location of most visited food outlets, it cannot be excluded that some people visit more than three food outlets for grocery shopping. Future research should assess interactions with all food outlets people grocery shop at. Whilst we were able to capture a wide range of potential reasons why people choose to shop at their main food outlet, not all possible reasons were listed as an option (e.g. schedule compatibility with opening hours or easily accessible by active transport). Future qualitative work could provide deeper insights into reasons why people choose to shop at particular food stores. The 20MN concept was operationalised based on Plan Melbourne’s definition of a 20MN (State of Victoria Citation2015). While the operationalised measure in this study included the availability of healthy food stores, the quality of the transport infrastructure to access food stores was not considered.
Conclusion
This study provides evidence supporting the projected benefits of active and local living in 20-minute neighbourhoods. Residents of 20-minute neighbourhoods travelled shorter distances to visit food outlets than those in non-20-minute neighbourhoods, suggesting 20-minute neighbourhoods may promote more local grocery shopping. Using a car to access food stores was often reported, however, a larger proportion of residents of 20-minute neighbourhoods walked to food outlets compared to non-20-minute neighbourhoods, suggesting 20-minute neighbourhoods may foster active travel for grocery shopping trips. Further research is needed to understand how 20-minute neighbourhoods could reduce car dependency for food shopping trips. This study also extends our understanding of why people choose to shop at their primary food outlet by considering reasons for food outlet choice depending on the type of neighbourhood they live in. We encourage policy makers and planners to promote mixed-use development and to put further emphasis on pedestrian and cycling infrastructure to lower the reliance on car use.
Supplemental Material
Download TIFF Image (13.9 MB)Supplemental Material.docx
Download MS Word (253.1 KB)Acknowledgements
The authors thank Neil Coffee, Kylie Ball, Mark Daniel, Yan Kestens, and Basile Chaix for their contributions to the ProjectPLAN study conceptualisation and data collection tools. Also acknowledged are Keren Best, Simon Best, Ralf Dieter-Schroers, and Steffi Renehan for their assistance with the data collection processes.
Disclosure statement
No potential conflict of interest was reported by the author(s).
Supplementary material
Supplemental data for this article can be accessed online at https://doi.org/10.1080/23748834.2023.2297333
Correction Statement
This article has been republished with minor changes. These changes do not impact the academic content of the article.
Additional information
Funding
Notes on contributors
Laura H. Oostenbach
Laura H. Oostenbach, PhD, is a Postdoctoral Researcher within the Faculty of Business and Economics at the University of Antwerp.
Alissa J. Burnett
Alissa J. Burnett, PhD, is a Lecturer in Nutrition Sciences within the Institute for Physical Activity and Nutrition (IPAN) at Deakin University.
Karen E. Lamb
Karen E. Lamb, PhD, is a Biostatistician and Associate Professor at the Centre for Epidemiology and Biostatistics in the Melbourne School of Population and Global Health at the University of Melbourne.
Lukar E. Thornton
Lukar E. Thornton, PhD, is an Assistant Research Professor in Food Purchasing and Environments within the Faculty of Business and Economics at the University of Antwerp.
References
- Abeykoon, A.H., Engler-Stringer, R., and Muhajarine, N., 2017. Health-related outcomes of new grocery store interventions: a systematic review. Public health nutrition, 20 (12), 2236–2248. doi:10.1017/S1368980017000933
- Adelaide Metro, 2023. Network maps [ Online]. Adelaide: Government of South Australia. Available from: https://www.adelaidemetro.com.au/plan-a-trip/network-maps [Accessed 13 February 2023].
- Anderson, E. and Durstine, J.L., 2019. Physical activity, exercise, and chronic diseases: a brief review. Sports medicine and health science, 1 (1), 3–10. doi:10.1016/j.smhs.2019.08.006
- Arentze, T.A., Oppewal, H., and Timmermans, H.J.P., 2005. A multipurpose shopping trip model to assess retail agglomeration effects. Journal of marketing research, 42 (1), 109–115. doi:10.1509/jmkr.42.1.109.56884
- Atanasova, P., et al., 2022. The impact of the consumer and neighbourhood food environment on dietary intake and obesity-related outcomes: a systematic review of causal impact studies. Social science & medicine, 299, 114879. doi:10.1016/j.socscimed.2022.114879
- Australian Bureau of Statistics, 2018. 2033.0.55.001 - census of population and housing: socio-economic indexes for areas (SEIFA), Australia, 2016 [ Online]. Canberra Australian Bureau of Statistics. Available from: https://www.abs.gov.au/ausstats/[email protected]/Lookup/by%20Subject/2033.0.55.001~2016~Main%20Features~IRSAD~20 [Accessed 31 October 2021].
- Ayala, G.X., et al., 2005. Restaurant and food shopping selections among Latino women in Southern California. Journal of the American dietetic association, 105 (1), 38–45. doi:10.1016/j.jada.2004.10.023
- Bartiaux, F., 2013. Moving to a life with no car in a system of automobility? A practice-theory approach. In: T.L. Lindström, ed. Rethink, Renew, Restart. Proceedings of the ECEEE summer study 2013. Stockholm: Borg & Co.
- Bureau of Transport Statistics, 2014. Household travel survey report: Sydney 2012/13. Sydney: Bureau of Transport Statistics.
- Calvignac, C., Bruyère, N., and Cochoy, F., 2014. Conso-motion et design durables. Université Toulouse le Mirai, ISSUU: Institut supérieur des arts de Toulouse et CERTOP.
- Cannuscio, C.C., et al., 2014. The social dynamics of healthy food shopping and store choice in an urban environment. Social science & medicine, 122, 13–20. doi:10.1016/j.socscimed.2014.10.005
- Caspi, C.E., et al., 2012. The local food environment and diet: a systematic review. Health & place, 18 (5), 1172–87. doi:10.1016/j.healthplace.2012.05.006
- Cobb, L.K., et al., 2015. The relationship of the local food environment with obesity: a systematic review of methods, study quality, and results. Obesity, 23 (7), 1331–1344. doi:10.1002/oby.21118
- de Souza, A.A., Sanches, S.P., and Ferreira, M.A.G., 2014. Influence of attitudes with respect to cycling on the perception of existing barriers for using this mode of transport for commuting. Procedia - social & behavioral sciences, 162, 111–120. doi:10.1016/j.sbspro.2014.12.191
- Department for Transport, 2016a. National travel survey: England 2015. London: Department for Transport.
- Department for Transport, 2016b. National travel survey why people travel: shopping. London: Department for Transport.
- Department of Environment, Land, Water & Planning, 2017. Plan Melbourne 2017–2050. Brunswick: The State of Victoria Department of Environment, Land, Water and Planning.
- Department of Transport and Main Roads, 2012. Household travel in Maryborough. Maryborough: The State of Queensland.
- Drewnowski, A., et al., 2012. Obesity and supermarket access: proximity or price? American journal of public health, 102 (8), e74–e80. doi:10.2105/AJPH.2012.300660
- Eady, J. and Burtt, D., 2019. Walking and transport in Melbourne suburbs. Melbourne: Victoria Walks.
- Emery, T. and Thrift, J., 2021. 20-minute neighbourhoods - creating healthier, active, prosperous communities: an introduction for council planners in England. London: Town and Country Planning Association.
- Engler-Stringer, R., et al., 2014. The community and consumer food environment and children’s diet: a systematic review. BMC public health, 14 (1), 522. doi:10.1186/1471-2458-14-522
- Giskes, K., et al., 2011. A systematic review of environmental factors and obesogenic dietary intakes among adults: are we getting closer to understanding obesogenic environments? Obesity reviews, 12 (5), e95–e106. doi:10.1111/j.1467-789X.2010.00769.x
- Glanz, K., et al., 2005. Healthy Nutrition Environments: Concepts and Measures. American journal of health promotion, 19 (5), 330–333. doi:10.4278/0890-1171-19.5.330
- Government of South Australia & Department of Planning, Transport and Infrastructure, 2017. The 30-year plan for greater Adelaide 2017 update. Adelaide: Government of South Australia, Department of Planning, Transport and Infrastructure.
- Gower, A. and Grodach, C., 2022. Planning innovation or city branding? Exploring how cities operationalise the 20-minute neighbourhood concept. Urban policy and research, 40 (1), 36–52. doi:10.1080/08111146.2021.2019701
- Guy, C., 2009. ‘Sustainable transport choices’ in consumer shopping: a review of the UK evidence. International journal of consumer studies, 33 (6), 652–658. doi:10.1111/j.1470-6431.2009.00818.x
- Hagberg, J. and Holmberg, U., 2017. Travel modes in grocery shopping. International journal of retail & distribution management, 45 (9), 991–1010. doi:10.1108/IJRDM-08-2016-0134
- Hillier, A., et al., 2011. How far do low-income parents travel to shop for food? Empirical evidence from two urban neighborhoods. Urban geography, 32 (5), 712–729. doi:10.2747/0272-3638.32.5.712
- Huber, S. and Rust, C., 2016. Calculate travel time and distance with OpenStreetMap data using the Open Source Routing Machine (OSRM). The stata journal, 16 (2), 416–423. doi:10.1177/1536867X1601600209
- Ibrahim, M.F., 2003. Car ownership and attitudes towards transport modes for shopping purposes in Singapore. Transportation, 30 (4), 435–457. doi:10.1023/A:1024701011162
- Infrastructure Australia, 2019. An assessment of Australia’s future infrastructure needs: the Australian infrastructure audit 2019. Sydney: Infrastructure Australia.
- Jiao, J., Moudon, A.V., and Drewnowski, A., 2011. Grocery shopping. Transportation research record: journal of the transportation research board, 2230 (1), 85–95. doi:10.3141/2230-10
- Kerr, J., et al., 2012. Predictors of trips to food destinations. International journal of behavioral nutrition and physical activity, 9 (1), 58. doi:10.1186/1479-5868-9-58
- King, T.L., et al., 2015. Does the presence and mix of destinations influence walking and physical activity? International journal of behavioral nutrition and physical activity, 12 (1). doi:10.1186/s12966-015-0279-0
- Krukowski, R.A., et al., 2012. Qualitative study of influences on food store choice. Appetite, 59 (2), 510–516. doi:10.1016/j.appet.2012.06.019
- Krukowski, R.A., et al., 2013. There’s more to food store choice than proximity: a questionnaire development study. BMC public health, 13 (1), 586. doi:10.1186/1471-2458-13-586
- Lamb, K.E., et al., 2020. Methods for accounting for neighbourhood self-selection in physical activity and dietary behaviour research: a systematic review. International journal of behavioral nutrition and physical activity, 17 (1). doi:10.1186/s12966-020-00947-2
- Logan, T.M., et al., 2022. The x-minute city: measuring the 10, 15, 20-minute city and an evaluation of its use for sustainable urban design. Cities, 131, 103924. doi:10.1016/j.cities.2022.103924
- Lowe, M., et al., 2022. City planning policies to support health and sustainability: an international comparison of policy indicators for 25 cities. The lancet global health, 10 (6), e882–e894. doi:10.1016/S2214-109X(22)00069-9
- Mackett, R.L., 2003. Why do people use their cars for short trips? Transportation, 30 (3), 329–349. doi:10.1023/A:1023987812020
- Mattioli, G., Anable, J., and Vrotsou, K., 2016. Car dependent practices: findings from a sequence pattern mining study of UK time use data. Transportation research part A: Policy and practice, 89, 56–72. doi:10.1016/j.tra.2016.04.010
- Minaker, L.M., et al., 2016. Associations between frequency of food shopping at different store types and diet and weight outcomes: findings from the NEWPATH study. Public health nutrition, 19 (12), 2268–2277. doi:10.1017/S1368980016000355
- Moran, P.A.P., 1950. Notes on continuous stochastic phenomena. Biometrika, 37 (1–2), 17. doi:10.1093/biomet/37.1-2.17
- Mueller, N., et al., 2021. Integrating health indicators into urban and transport planning: a narrative literature review and participatory process. International journal of hygiene and environmental health, 235, 113772. doi:10.1016/j.ijheh.2021.113772
- Munro, C., 2019. Australian cycling participation 2019. Sydney: Austroads.
- National Transport Authority, 2018. National household travel survey. Dublin: National Transport Authority.
- Netopil, T., Antošová, V., and Turčínková, J., 2014. Retirees: how do they choose their grocery store? How do they shop? Procedia economics and finance, 12, 480–488. doi:10.1016/S2212-5671(14)00370-0
- Oostenbach, L.H., Lamb, K.E., and Thornton, L.E., 2022. Is having a 20-minute neighbourhood associated with eating out behaviours and takeaway home delivery? A cross-sectional analysis of ProjectPLAN. BMC public health, 22 (1). doi:10.1186/s12889-022-12587-1
- Paris, 2021. Paris ville du quart d’heure, ou le pari de la proximité [ Online]. Paris. Available from: https://www.paris.fr/dossiers/paris-ville-du-quart-d-heure-ou-le-pari-de-la-proximite-37 [Accessed 16 November 2021].
- Portland Plan, 2012. 20-minute neighborhoods analysis: background report and analysis area summaries. Portland: City of Portland Bureau of Planning and Sustainability.
- Rahmanian, E., et al., 2014. The association between the built environment and dietary intake - a systematic review. Asia pacific journal of clinical nutrition, 23 (2), 183–196. doi:10.6133/apjcn.2014.23.2.08
- Riggs, W., 2016. Cargo bikes as a growth area for bicycle vs. auto trips: exploring the potential for mode substitution behavior. Transportation research part F: Traffic psychology and behaviour, 43, 48–55. doi:10.1016/j.trf.2016.09.017
- Rokseth, L.S., et al., 2021. Reducing private car demand, fact or fiction? A study mapping changes in accessibility to grocery stores in Norway. European transport research review, 13 (1). doi:10.1186/s12544-021-00500-7
- Saelens, B.E., Sallis, J.F., and Frank, L.D., 2003. Environmental correlates of walking and cycling: findings from the transportation, urban design, and planning literatures. Annals of behavioral medicine, 25 (2), 80–91. doi:10.1207/S15324796ABM2502_03
- The Scottish Government, 2020. Scotland’s fourth national planning framework position statement. Edinburgh: The Scottish Government.
- State of Victoria, 2015. Plan Melbourne Refresh: Discussion Paper. Melbourne: Victorian Government.
- State of Victoria & Department of Transport, Planning and Local Infrastructure, 2014. Plan Melbourne: metropolitan planning strategy. Melbourne: State of Victoria, Department of Transport, Planning and Local Infrastructure.
- Story, M., et al., 2008. Creating healthy food and eating environments: policy and environmental approaches. Annual review of public health, 29 (1), 253–272. doi:10.1146/annurev.publhealth.29.020907.090926
- Tennant, P.W.G., et al., 2020. Use of directed acyclic graphs (DAGs) to identify confounders in applied health research: review and recommendations. International journal of epidemiology, 50 (2), 620–632. doi:10.1093/ije/dyaa213
- Thornton, L.E., et al., 2017. Where do people purchase food? A novel approach to investigating food purchasing locations. International journal of health geographics, 16 (1). doi:10.1186/s12942-017-0082-z
- Thornton, L.E., et al., 2022. Operationalising the 20-minute neighbourhood. International journal of behavioral nutrition and physical activity, 19 (1). doi:10.1186/s12966-021-01243-3
- Tong, C.O., Wong, S.C., and Leung, B.S.Y., 2004. Effect of land use on decisions of shopping tour generation: a case study of three traditional neighborhoods in WA. Transportation, 31 (2), 153–181. doi:10.1023/B:PORT.0000016578.21486.af
- Victoria State Government, 2019. 20-minute neighbourhoods: creating a more liveable Melbourne. Melbourne: The State of Victoria Department of Environment, Land, Water and Planning.
- Wiig, K. and Smith, C., 2009. The art of grocery shopping on a food stamp budget: factors influencing the food choices of low-income women as they try to make ends meet. Public health nutrition, 12 (10), 1726–1734. doi:10.1017/S1368980008004102
- Wrighton, S., 2014. Cyclelogistics moving Europe forward: Final Public Report. Cyclelogistics.
- Wrighton, S. and Reiter, K., 2016. CycleLogistics – moving Europe forward! Transportation research procedia, 12, 950–958. doi:10.1016/j.trpro.2016.02.046
- Yang, G., et al., 2022. Comparison of spatial approaches to assess the effect of residing in a 20-minute neighbourhood on body mass index. Spatial and spatio-temporal epidemiology, 43, 100546. doi:10.1016/j.sste.2022.100546
- Yang, Y., et al., 2019. Towards a cycling-friendly city: an updated review of the associations between built environment and cycling behaviors (2007–2017). Journal of transport & health, 14, 100613. doi:10.1016/j.jth.2019.100613