
ABSTRACT
The continued prevalence of car dependency is a concern worldwide due to known negative health, social, economic, and environmental impacts. Belfast is a city in the United Kingdom with high levels of car dependency and car use. The most successful interventions to reduce the complex problem of car dependency combine a range of approaches, but how the influencing factors work together and interact to successfully achieve a change in car dependency is poorly understood. This study aimed to better understand the factors that influence the high levels of car dependency in the Belfast Metropolitan Area. We worked with 17 stakeholders to co-design a causal loop diagram to understand the complex system of car dependency in the city. The causal loop diagram reflects a shared understanding of car dependency and highlights the various mechanisms that are important for reducing car dependency. Twenty-three factors under the four themes of policy, infrastructure, economics, and social norms were identified and four key feedback loops between these themes are discussed. It is shown how individual behaviour in relation to travel mode choice is influenced by system-wide factors that, in the Belfast context, make car use the easiest and most convenient choice for the majority.
Introduction
Defining car dependency
Car dependency can be defined as high levels of per capita car travel, due to car-oriented land use patterns, behavioural preferences for car use, and inadequate transport mode alternatives (Jeekel Citation2013). It occurs in an environment where, for the majority, car travel is the most convenient and easiest choice, which means that travel habits based around the car become embedded within the culture (Jeekel Citation2013, Mattioli et al. Citation2016). As a concept, car dependency differs from the term ‘car use’ in that it is not solely about the proportion or number of trips being made by car, but about the systemic influences that lead to this use (Jeekel Citation2013). Car dependency is similar to car dominance and is the interaction of political, economic, environmental, interpersonal, and individual factors that create a car-orientated society. Newman and Kenworthy (Citation1999) highlight the link to policy, stating that car dependency is where cars as the preferred mode of transport dominates in decision-making on transport, infrastructure, urban planning, and land use.
Car dependency has economic, environmental, social development, and public health implications, including widening inequalities (Hunter et al. Citation2021). Car dependency can lead to negative impacts on air quality, increases in noise pollution, reductions in local neighbourhood accessibility, an increase in car-related injuries and deaths and reductions in levels of active travel, such as walking and cycling. An umbrella review of the literature by Cleland et al. (Citation2023) demonstrates the links between car dependency and these themes and highlights the need for more investigation of the impacts of meso and macro-level interventions.
Car dependency can be both subjective and objective (Jeekel Citation2013). Subjective car dependency links to individual habits and a culture of car use, with a lack of information or interest in other modes (Jeekel Citation2013). Objective car dependency links to a lack of alternatives to the car that are either viable financially, convenient or in terms of the travel time they take (Jeekel Citation2013). These types of dependency are relevant and should be considered when we think of potential solutions to counteract high levels of car usage.
Existing research shows that there are some common objective factors that influence levels of car dependency in urban areas (Xiao et al. Citation2022). For instance, where there are high levels of car dependency, there is usually a large proportion of road space allocated to the car over other modes, including large amounts of land for parking (Héran and Ravalet 2008 (cited in Litman Citation2012), International Transport Forum Citation2019). Low-density development usually results in longer commuting distances and travel times, which tend to encourage travel by car (Dovey et al. Citation2017). The distance between home and work has been shown to have a strong influence on transport mode choice and levels of car use (Wiersma et al. Citation2016). Cost is another influence on transport mode choice. There is evidence that those cities that have put in place policies for some form of road user charging have seen reductions in congestion and emission levels (Kuss and Nicholas Citation2022), increasing the cost of car use on a per journey basis.
Subjective influences on car dependency are less well understood but are also an important factor to consider. Habitual behaviours, for example, where previous behaviour influences future behaviour, can have an impact on transport mode choice and these may continue to persist regardless of the objective physical environment (Bamberg et al. Citation2003, Carrus et al. Citation2008, Ercan et al. Citation2017, García et al. Citation2019). These may also reflect attitudes that will differ from person to person, where people feel differently about the same objective physical environment. This has been shown to be the case in children’s travel to school, for example (Michail et al. Citation2021). Although it is understood that there is a link between travel behaviour and subjective assessments of the built environment (especially in relation to risk and travel time), exactly how they interact to influence each other remains unclear (Van Acker et al. Citation2010, Wilkie et al. Citation2019).
Importantly though, there is surprisingly limited research that considers these and other objective and subjective factors in a holistic way, and how the complex interplay between these factors and the underlying policy environment shape sustained high levels of car use over time (Hunter et al. Citation2021).
The Belfast context
Northern Ireland, in the United Kingdom, is one of the most car-dependent regions in Europe (Lydon et al. Citation2021). An average person in Northern Ireland makes 82% of all their journeys by car (Department for Infrastructure Citation2020). The use of walking, cycling, and public transport for all journeys remains low at 24% and this figure has not changed between 2009 and 2019 (Department for Infrastructure Citation2021).
Belfast is the capital city of Northern Ireland and is one of the most congested cities in the United Kingdom (TomTom Citation2022). The Belfast Metropolitan Area additionally encompasses a number of commuter towns to Belfast and the areas surrounding them, including Carrickfergus, Bangor, Lisburn and Holywood. The city of Belfast has previous history as a site of political violence and territorial division, and was a site of conflict for over 30 years up until the mid-1990s. During this period, Northern Ireland was governed by direct rule by the United Kingdom’s Westminster government. This meant that there was a lack of local spatial focus that a local government could bring, as well as a dominance of roads interests, a reliance on technocratic policy processes and engineering-led programmes, and an increase in the levels of siloed working between departments (Sterrett et al. Citation2012, Esposito De Vita et al. Citation2016).
The current spatial configuration of Belfast reflects a focus on redevelopment and the modernisation of infrastructure aimed at growth and inward investment, especially roads and highways throughout the 1960s and 1970s. The Westlink, built in the 1970s, is an urban motorway that cuts through the north and west of the inner city, cutting through communities and creating an environment that feels heavily dominated by the car. The city core features high levels of parking provision. Peace walls put in place during the conflicts were designed as buffer zones between the various Protestant and Catholic communities in the city and still today can restrict movement around the city (Cunningham, 2014). Housing densities, even in the inner-city, are low at 6,500 people per square mile (World Population Review Citation2022), leading to a need to travel further to move within and between urban neighbourhoods, services and education facilities. Inner north Belfast, for example, features cul-de-sac layouts, two-storey housing and large areas of hardstanding and car parking, in spite of often low levels of car ownership (Sterrett et al. Citation2012). The population spread of the city has also been heightened as a result of residents choosing to move out of the city during the conflicts, and into the wider suburbs and dormitory towns and villages. This has created low-density suburbs and dormitory towns, extended travel to work catchments and further reliance on car-based transport, exacerbated by weak public transport infrastructure (Blair et al. Citation2013).
Over the last 20 years, there have been various governmental attempts to reduce car use in the city. A traffic masterplan was prepared for Belfast in 2015, to facilitate a reduction in traffic levels and delivered new infrastructure for walking, cycling and buses. The city’s Local Development Plan has the objective of promoting active travel and creating an accessible environment, in order to reduce car dependency. Significant investment has been put into a new bus rapid transit system for the city, and a new integrated transport hub will be opened in mid-2024. 20 mph limits have also been implemented in some high-pressure neighbourhoods where commuter traffic is especially problematic. However, the overall modal shift from the private car to walking, cycling and public transport has been limited, primarily because road provision and maintenance dominates the capital budget. There are also cultural barriers within transport planning that emphasise the importance of road infrastructure for economic competitiveness and the need to strengthen connectivity, especially for haulage (Murtagh et al. Citation2023).
Ultimately, there has not been the shift in capital or revenue spending on active travel to enable a significant modal shift and given the often divided nature of politics in Northern Ireland, the lack of a functioning Assembly and pressure from the private transport lobby, such transition has been slow. It is also clear however that there is increasing cross-party political will, policy pressure from health professionals and communities and lobbying by environmental NGOs, which are shifting the policy discourse (Murtagh et al. Citation2023). A key lesson here is that significant modal shift cannot be achieved through a single intervention (Cleland et al. Citation2021) and that a multi-sectoral and multi-policy action across a complex landscape is required (Mattioli et al. Citation2020). Given this context, there is a need to better understand what factors and mechanisms influence car dependency in Belfast from a systemic point of view, which has not been explored before, and how a shift to a more sustainable travel pattern might be achieved through orchestrated multi-sectoral action.
Systems thinking
There are many political, economic, environmental, interpersonal, and individual factors that contribute to car dependency levels in a given place and time (Lois and López-Sáez Citation2009, Noblet et al. Citation2014). It is the complex interplay between these factors, dynamically responding to each other, that generates the range of intended and unintended outcomes we observe. This means that identifying the potential contributing factors is not enough without also mapping the web of their dynamic interrelationships.
Causal loop diagrams are intended to provide a dynamic picture of how a system produces observed behaviour (Sterman Citation2000). To our knowledge, this method has not been used before to explore the complex system of car dependency. The main feature of this type of model or diagram is that the relationships between factors (often termed ‘nodes’) that compose the system are shown, which shape the structure and function of the system and how its factors may change over time and at different rates (Macmillan and Woodcock Citation2017). Relationships between factors are shown on the diagram using directional arrows, which demonstrate either a positive or negative causal impact of one node to another. Where factors are interrelated and influence each other, these form feedback loops (Trochim et al. Citation2006, Rickles et al. Citation2007). In balancing feedback loops, behaviours or events inside the loop counter one another, resisting changes in one direction and bringing stability to the process over time. In reinforcing feedback loops, behaviours or events inside the loop reinforce one another, amplifying the effect of the process over time.
Failure to recognise and account for the complexity of the system and the interaction of various factors and stakeholders that contribute to the levels of car dependency have critical consequences in policy design and implementation (Sterman Citation2011). A range of methods informed by systems thinking are available to help map and explore the structure and function of complex systems, including methods that heavily rely on the participation and perspective of the local stakeholders. One such approach is Group Model Building, which allows the co-creation of a shared understanding of causal pathways and system dynamics that generate the issue under investigation, which can be used to reach consensus on orchestrated actions across stakeholders (Hovmand Citation2014). This can also reveal unexpected areas of intervention to change an outcome, behaviour or norm.
Aim of this work
In this paper, we describe the output of a group model-building process to co-create, with local stakeholders, a causal loop diagram (Allender et al. Citation2015). This demonstrates the shared understanding of the complex system that shapes car dependency in the Belfast Metropolitan Area. The creation of this causal loop diagram is part of a larger project aimed at co-developing sustainable and scalable system-oriented interventions at the intersection of policy and environmental infrastructure, social context, environment, and individual agency to reduce car dependency for improved population health in Belfast (Hunter et al. Citation2021). The causal loop diagram will be used to create a consensus model among a range of local stakeholders and inform discussions about possible co-ordinated intervention approaches and policy design.
Methods
This study set out to co-design and create a causal loop diagram with local stakeholders, following the principles of system dynamics modelling and group model building as introduced above. It incorporated stakeholder mapping and survey, stakeholder interviews and a group model-building workshop (see below for details) received approval from the Queen’s University Belfast Faculty of Medicine, Health and Life Sciences Research Ethics Committee (MHLS 20_141, EPS 21_43 and MHLS 21_70, respectively). Seventeen stakeholders ultimately took part in the development of the causal loop diagram.
The methods used in this study sought to deliver a causal loop diagram that was reflective of the various stakeholders’ experience, knowledge, perceptions, and views about the influences on, and the consequences of, car dependency in the Belfast Metropolitan Area. This ensured that it was meaningful to the stakeholders as a consensual and co-produced understanding of the problem, as well as forming the basis of a tool to explore the future impact on how sectoral and multi-sectoral public policies to reduce car dependency are shaped and implemented.
Stakeholder mapping and participant recruitment
The participants involved in this study were identified via a stakeholder network survey and analysis conducted in March and April 2021. More details on this can be found in the study protocol paper (Hunter et al. Citation2021). The initial survey sample was composed by the nine named project partners. Snowball sampling was used to recruit further participants for the survey, by asking survey respondents to identify other stakeholders whose work relates to car dependency in the Belfast Metropolitan Area, stopping when no more new stakeholders were nominated (three waves). Sixty-five organisations and individuals responded to the survey.
From the pool of organisations and individuals that took part in the survey or were nominated by respondents, we used a purposeful sample of 19 (three academics, three from the private sector, four from the civil society/not for profit, and nine from the public sector) to take part in the development of the causal loop diagram to ensure a balance across sectors. Seventeen accepted the invitation (one organisation from the public sector and one from the civil society declined). Those who participated in the workshop came from a range of disciplines: public health, urban planning, urban regeneration, architecture, engineering, active travel, public transport, inclusive mobility and transport, and environmental sustainability and development. Representatives of public sector organizations from both the national and local council level participated in the workshop.
Creating the causal loop diagram
There were five main stages in the development of the causal loop diagram. Two of these focussed on primary data collection from stakeholders (one-to-one interviews and group model-building workshop) and a third used secondary data via a policy review to develop an understanding of the existing policy background in the city. The last two involved drafting and finishing the diagram according to the findings and discussions in the data collection stages. Each stage is detailed below.
Policy review
A desktop policy review was undertaken (BM) to improve understanding of the Belfast context and the policies that might influence car dependency. The aim of the review was (i) to assess the scope of the policy arena and the relationship between spatial planning and transport policy over time; (ii) to describe the current key policies, programmes and investments in relation to transport in the Belfast Metropolitan Area; (iii) to evaluate the relationship between transport, land use planning and urban policy; (iv) and to highlight the priorities of area-based communities on transport and connectivity as it affects their neighbourhoods. The review assessed strategic and local planning policy, transport strategies, urban regeneration and housing frameworks for the city. It considered policies and programmes that related to Northern Ireland in general as well as those focusing on Belfast. The analysis was used to inform the stakeholder interviews and provide a context for the subsequent workshop.
Interviewing stakeholders
The 17 stakeholders provided informed written consent to be interviewed by a member of the research team using a semi-structured interview format with a question list as a guide (see Appendix C). Interviewees were asked about the reasons for, and consequences of, high levels of car usage in Belfast. They were prompted to identify economic, policy, social, individual, environment and health factors, and the interconnections between them. Interviewees were also asked about priorities for reducing car dependency in the region, the potential impact of initiatives to reduce car dependency in the Belfast Metropolitan Area and the consideration of the short-, medium, and long-term opportunities for reducing car dependency. The interviews lasted 45–60 minutes and were recorded and transcribed.
Preparation of draft causal loop diagram
An analysis of the identified key themes, factors and interconnections that emerged from the stakeholder interviews was completed by four members of the project team. Two members (LG and RH) had methodological and applied experience in causal loop diagramming, and the other two were the interviewers (HW and IA). An initial screening of key factors and interconnections shaping car dependency in the Belfast Metropolitan Area was undertaken, which addressed: (a) the factors that have contributed to public transport provision and active travel in the area since 2009; and (b) the factors, priorities and future opportunities likely to influence car dependency in the area in the future. A close and repeated reading of the relevant text passages led to a baseline mapping of key health, economic, social, policy and environmental factors, and their interconnections (direction of influence), for car dependency in the Belfast Metropolitan Area. Reflecting on the open character of the semi-structured interviews, attention was also placed on whether such key factors were raised in response to subsequent questions over the course of the interview (Schmidt Citation2004). This initial analysis was then mapped onto an initial draft of a causal loop diagram, intended to reflect the output from the stakeholder interviews and to consider how the various factors identified linked together. The interviewers (HW and IA) reviewed this together to ensure it was an accurate reflection of the outputs. The insights from the policy review were also used as a cross-check at this stage.
Stakeholder workshop
All the stakeholders involved in the interviews were invited to attend a group model-building workshop to discuss and refine the causal loop diagram as drafted by LG, RH, HW and IA. The aims of the workshop were to (i) bring these stakeholders together to build a shared understanding of the complex system influencing car dependency in the Belfast Metropolitan Area, and (ii) identify and explore priorities and actions to reduce car dependency and consider what is needed to implement the actions (Richardson and Andersen Citation1995, Vennix Citation1999, Rouwette et al. Citation2002, Hovmand et al. Citation2012). Ten stakeholders attended the workshop, six of whom were previous interviewees. Four were not interviewees, but another member of their organisation. It was ensured that this sample still included all of the disciplines from those that were interviewed. The draft causal loop diagram was sent out to stakeholders before the workshop to provide them with an opportunity to consider it in advance, together with a tutorial on how to read it and details about the workshop. The workshop was held online on Zoom over 2 hours in October 2021. Holding the workshop online proved the most convenient and preferred method for participants given the COVID-19 status at the time. A wider range of people were able to attend than otherwise might have done and discussion flowed easily, possibly related to the fact that many of the stakeholders already knew each other. The facilitation team included two designated facilitators (LG and IA), one meeting convener (RH), one modeller (CM), one timekeeper (CC) and one note keeper (HW). A more detailed description of these roles can be found on Scriptapedia (Citationn.d.).
The agenda for the workshop followed a series of scripted activities informed by the content provided on Scriptapedia (see Appendix A). The workshop began with the meeting convener (RH) providing a short introduction to the project and the problem to be addressed. The facilitators (LG and IA) then introduced systems thinking and causal loop diagramming to the participants, to help them to understand how the information provided in the interviews was being used to create a diagram. The draft of the causal loop diagram was shown to the group and then time was given to discuss it and to propose any changes to it. The online platform Kumu was used to explore the model in the workshop and to make any changes to it ‘live’. These changes were made by the modeller (CM), in discussion with the facilitator (LG). Once changes had been made, a further check was made with the group to ensure that they agreed that it was reflective of their views. Finally, the group was given some time to identify and prioritise actions to act upon the system. Participants were asked to identify as many actions as possible that, in their view, could impact the system and influence levels of car use in the Belfast Metropolitan Area. No prompts were given to participants and this was kept as open as possible. They were then asked to focus these on particular factors, relationships or feedback loops from the causal loop diagram and to rank these based on how easy it might be to implement and what impact it might have. These were collated on an online ideas board and then grouped into categories based on the type of intervention and the theme that it related to.
Refining the causal loop diagram
Following the workshop, four members of the project team (LG, RH, HW, IA) met to discuss and agree any changes that had been made or still needed to be made as a result of the discussions. The purpose of this was to refine the causal loop diagram, so that it was an accurate reflection of the stakeholders’ inputs. The aim was to ensure that the diagram reflected the co-design process with stakeholders and what they had said in both the interviews and the workshop.
The revised causal loop diagram was then sent to all those who participated in either the interviews, workshop or both, with an opportunity for them to provide feedback on the revised diagram. Only minor changes were proposed to the diagram following feedback from stakeholders.
Following on from the workshop, seven residents from Belfast provided written informed consent to participate in a semi-structured interview. This was to begin to ‘sense check’ the diagram and ensure that no critical factors relevant to residents and road users themselves were missed from the diagram. Residents were recruited via snowball sampling. Interviews took place over MS Teams (HW) and lasted approximately 30 minutes each, which was a preferred method for the participants and has been shown to be successful in other contexts (Smeekes et al. Citation2023). They were audio recorded and transcribed. Questions focussed on and what they believed influenced their decision-making in terms of how they got around the city (see Appendix B). A thematic analysis of the interviews was completed (HW), mapping the residents’ comments to the existing factors and relationships on the causal loop diagram. Any gaps in the diagram were highlighted by assessing where further description or clarification was required and by establishing if there were any insights from the residents that were not already covered within the diagram. Only minor changes were proposed to the diagram following feedback from the residents.
Findings
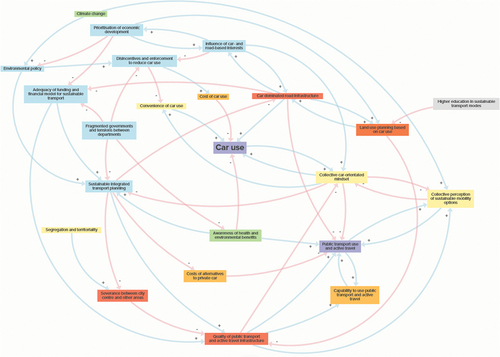
The final causal loop diagram () draws on insights gained from the policy review report, stakeholder and resident interviews and group model-building workshop. A total of 23 factors and 55 relationships between them were identified, as shown in . In the next section we present insights according to themes identified in the diagram, followed by insights about the key feedback loops found.
Figure 1. The causal loop diagram.
Factors in the causal loop diagram by theme
Four key themes were used to understand the causal loop diagram: policy (blue), infrastructure (red), economics (orange) and social norms (yellow). There were also three factors identified that did not fit under any major theme (grey).
Policy factors (blue)
Seven factors were identified under the theme of policy and this was seen by stakeholders as being a particularly important influence, with a number of specific issues relevant to the Belfast Metropolitan Area and Northern Ireland being highlighted. These are factors that are impacted by policy development within the city and where there is often a political influence too.
One of the main points noted was the fragmentation across government departments whose policy remit affected, directly or indirectly, the governance, management and planning of the transportation system. This included a lack of integration between transport planning and urban planning, and a similar lack of integration of transportation and energy planning, as well as poor links from these to public health and environmental policy. Stakeholders reflected on the lack of joined up thinking within government and how departments would often work in silos.
There was also said to be an overarching prioritisation of economic development policies over others and stakeholders highlighted how this often meant that environmental or health matters would be given less weight within policy. This impacted on how much focus alternative modes to the car were given. It meant that there was often insufficient funding available to support other modes of transport, as well as poor integration of sustainable transport modes.
They also noted the influence of car and road-based interests on policy and highlighted that car usage is often considered a driver for orthodox GDP measured economic growth, a measure increasingly viewed as a sub-optimal economic goal in terms of achieving sustainability, public health, climate and human wellbeing objectives (Barry Citation2020). There were no policies in the city that focused on financially disincentivising or enforcing reductions in car use, perhaps because it was seen as an economic driver. Road infrastructure as a driver of economic competitiveness, a policy emphasis on connectivity and reducing the frictional effects of distance on supply chains all play into a strong pro-car narrative.
Infrastructure factors (red)
Four factors were identified under the theme of infrastructure. These encompassed a range of considerations on how the infrastructure in the city influences car use. Stakeholders noted that there was a car dominated road infrastructure throughout most of the city. At the city-wide level, this was fuelled by major highways cutting through the city close to the centre, severing the city centre from other parts of the city and the suburbs. At the neighbourhood level, this was due to streets and road designs that prioritised cars over people and a lack of infrastructure for other modes. Within the city centre, stakeholders highlighted a large amount of space taken over by car parking and a poor quality public realm, including a lack of green and blue infrastructure.
The causal loop analysis also highlights the way in which land use planning, and the design of the built environment as a whole, is pivotal in supporting the car as a dominant mode of travel and roads as the infrastructure of choice. The lack of joined up thinking between planning and transport planning meant that within residential development, travel and transport were often deemed to be poorly considered. Both new and existing development in the city was generally low density, often with a lack of social infrastructure and poor transport links aside from those for car travel. It was also noted that job creation often focussed on the city centre (with more limited housing stock), meaning that residents were often reliant on travelling into the city centre for work and creating an extended travel to work area. Stakeholders also noted the dispersed rural populations outside of the city, who were more reliant on their cars to get around. Planning both enables a dispersed and car reliant settlement pattern; fails to support urban densification (that would encourage walking, cycling and efficient public transport); and shares a professional preference (planners and road engineers) for infrastructure-based solutions. The causal loop analysis identifies these points of connections and reveals the assumptions, professional values and priorities that are shared across policies and organisations and the professional ethics that support them. It was evident that although professionals understood the link between densification and travel mode choice, for example, the focus in discussions tended to be on transport infrastructure rather than the built environment more broadly.
In comparison to the dominance of infrastructure for cars, stakeholders commented on the poor quality infrastructure for transport by other modes. There was a perception of poor quality pedestrian and cycle infrastructure throughout most of the city. With regard to public transport, they noted that the frequency of services was not always sufficient, the route network was not comprehensive enough, and there were few orbital services that circuited the city rather than along arterial routes with a focus on the city centre. They also noted the perceived high cost of public transport. They noted the potential benefits of certain technologies such as real-time schedules for public transport.
Economic factors (orange)
Two factors were identified under the theme of economics, relating to economic considerations at the individual user level. ‘Cost of car use’ related to how much it costs to drive around the city and stakeholders suggested that this was an important influence on travel behaviour and that it was seen to be a relatively cheap way to get around. Ample free or low-cost parking availability and no other financial disincentives in place to use a car, such as road user charging or congestion charging, meant that the cost of using a car was relatively low. It was also noted that the upfront purchase costs of a car was often not considered when residents were making their daily journeys or being used when comparing the cost of a journey by car compared to public transport for example. This point also links to findings from the residents’ interviews, which highlighted the importance of considering how costs are perceived, showing that there is an element of subjectivity within this. Whereas those who drive a car reflected on it as a cheap mode of transport, residents who did not use a car thought that it was an expensive way to travel.
The costs of alternatives to the private car and how these compare is also featured as a factor on the causal loop diagram. This highlights the need to not only think about the costs of car use per se, but how it compares to other modes and how the costs of the different modes are perceived by residents. This links to the influence of policy and how much investment there is in other transport modes. Moreover, this connects the perceptive realm with resource allocation decisions and in particular the way in which road infrastructure is perceived to reduce car-based costs. In the same way, the causal loop analysis focuses on the way in which in investment in walking and cycling signifies its efficiencies for the users as well as its evident health and environmental benefits. Here, the analysis points to possibilities that investment in alternative modes registers an effect on public sentiment, modal shifts and the potential to be outpriced of expensive car-based use.
Social norm factors (yellow)
The theme of social norms relates largely to how car use is perceived in the city. Four factors have been identified under this theme. ‘Collective car-orientated’ mindset was highlighted by the stakeholders as an important influence on travel behaviours and norms. This relates to a general culture of car ownership and car use being seen as a positive thing and providing increased autonomy. The word ‘collective’ within this factor is important, providing clarity that this mindset is not driven by individuals, but rather is driven by the other higher-level factors identified.
Where there is a generally positive perception of car use, there is a negative perception of public transport and other mobility options, which is highlighted in the factor ‘collective perception of sustainable mobility options’. The car is seen as the most convenient transport choice by many, with it considered the quickest way to get around. Interviews with residents highlighted the subjectivity of the notion of convenience; however, and that this is also influenced by the embedded car-orientated mindset that many residents hold. That is, a car dominated transport system unsurprisingly gives rise to car-dependent norms, cultural expectations and consequent normalised and routinised car-dependent behaviours.
Stakeholders also highlighted the importance of considering the influence of ethno-nationalist segregation and territorial separation of communities. Residents in Belfast may have increased concerns over safety due to the previous conflict in the city and this can have an influence on their transport choices. This may have led to poorer integration of public transport services across the city. The frictional effects of territory is well embedded in a socio-psychological sense and in some neighbourhoods separated by peacelines, any form of mobility is either difficult or dangerous. However, the city has also desegregated remarkably in the last two decades making safe walking and cycling significantly more likely (Herrault and Murtagh Citation2019). As the city restructures and integrates walking and cycling, it can support these integrative processes in new and more imaginative ways and the potential of such modes in tackling segregation remains a site of policy possibility across the city.
Other factors (grey)
A small number of factors identified are outside of these four main themes. Stakeholders noted that there could be a lack of capability to use other modes of travel and this is shown by ‘capability to use public transport and active travel’. The importance of appropriate higher education that teaches future professionals about sustainable transport modes was also noted, and links to future policy and planning directions. Two other factors related to the awareness of the benefits of alternative transport modes. Stakeholders discussed a general lack of awareness of both the environmental and health benefits of using other modes. A link was also made to the influence of policy and a lack of consideration in policy of these benefits.
Relationships between factors and feedback loops
Four major feedback loops were identified within the causal loop diagram for further analysis. All of these were reinforcing loops. presents a description of each feedback loop identified. The four loops identified incorporate the themes shown within the causal loop diagram, but with a particular emphasis on the influence of both policy and infrastructure that feature within all of them.
Table 1. Major feedback loops.
Discussion
The study used a co-design approach and participatory methods to develop an understanding of car dependency in the Belfast Metropolitan Area and the complex systems within which it sits. This section will first discuss the specific factors relating to car dependency in the Belfast Metropolitan Area that emerged from this engagement in relation to the four main feedback loops identified. It will consider how an improved understanding of these factors could affect future levels of car usage in the city. It will then go on to discuss the success of the methods used and how the study successfully engaged with stakeholders to develop a common understanding of car dependency.
Learnings from the system
This study sought to identify the factors that influence car dependency in the Belfast Metropolitan Area, a city and surrounds that has higher levels of car use than other comparable cities in the United Kingdom and Europe (Department for Infrastructure Citation2020), and particularly high levels of car dependency (Lydon et al. Citation2021).
Objective influences: policy and infrastructure
The study has highlighted the importance of policy in influencing the car dominated road infrastructure within the city (Newman and Kenworthy Citation1999). Feedback loop R1 (infrastructure influences policy) shows the complexity within this relationship between policy and infrastructure. It demonstrates that the current heavily car dominated road infrastructure is increasing the influence of car and road-based interests and the need to acknowledge the economic interests (promoting orthodox GDP ‘economic growth’) that support and lock in a pro-roads approach in the city. With car travel seen as a mode that encourages economic growth (a faulty assumption), this is encouraging a political focus on the prioritisation of economic development over, for example, health or the environment. This is cognitively bolstered by economic arguments around competitiveness and connectivity; the cultural appropriation of the car (not least given the need for personal security in Northern Ireland); and the lack of clearly articulated alternatives and their multiple benefits, especially to the individual. Other research has shown the challenge of developing an understanding of the health impacts of car dependency (Widener and Hatzopoulou Citation2016, Harrison et al. Citation2021). Resources within the Belfast Metropolitan Area are disproportionately allocated to roads, with the balance between roads and public transport not achieving the realignment planned in the Regional Transport Strategy 2002, despite two decades of trying to achieve this.
Our policy review found that there are policies within the Belfast Metropolitan Area that establish the need to reduce car dependency, as also noted by Lowe et al. (Citation2022). Indeed, regional policy (RDS 2035 for NI) and transport strategies (Department for Regional Development Citation2011) for the city suggest that it is a political priority. In spite of this, there are concerns about how well governance and policy function in the city and its surrounds and the challenge of implementing policies once adopted. We found that many policies for the city are in draft, lack operational detail or do not demonstrate practically how they will affect a transportation system transition that will be based on increased use of public transport and active travel. There is also currently no up-to-date transport plan for the Belfast Metropolitan Area to lead such implementation at the local level.
Fragmented government and tensions between departments were also raised as a concern by stakeholders. R1 (infrastructure influences policy) reflects how this then goes on to impact the car dominated road infrastructure seen throughout the city. The Strategic Planning Policy Statement for Northern Ireland (DfI Citation2015) highlights the need for both better integrated land use and transport planning and makes a connection between public health and sustainable transport. Stakeholders highlighted that this type of integration is not being achieved in practice and that the form of these policies do not appear reflective of how local authority departments within the city function at present.
Land use planning within Belfast has historically been based around the car and other research has shown how this can lead to higher levels of car use (Dovey et al. Citation2017; Héran and Ravalet 2008 (cited in Litman Citation2012), International Transport Forum Citation2019). Feedback loop R4 (economic development prioritising cars) shows how this has influenced the car dominated road infrastructure seen across the city, which has also increased the influence of car and road-based interests and the prioritisation of orthodox GDP measured economic growth.
The car-dominated road infrastructure that exists within the city is strongly influenced by historic trends in road building. Stakeholders highlighted the influence of the Westlink cutting through the city centre, which creates an environment that both incentivises and normalises car use and makes it unpleasant and risky to walk and cycle. This highway runs particularly close to the city centre and acts to sever communities and reduce connectivity by other modes. The dominant discourse between stakeholders was that transport infrastructure was a key influencing factor on the built environment as a whole and often the driver for this. Development densities were often being derived from transport infrastructure proposals rather than the other way around. Stakeholders highlighted that there is a continuation of the low-density development seen in previous years in the city and that this is generally based around travel by car. Jobs are only being created within the city centre and travel to work distances are therefore increasing as low-density development continues to spread out to the city’s suburbs.
Although the impact of car dependency on inequalities was not always explicitly mentioned, it was implicit in many of the factors identified. Severance has been caused within the city as a result of car-dominated road infrastructure, for example, and some of the poorest communities in the city are located closest to this. Low-density development and a reliance on the car has meant that households are spending an increasing proportion of their incomes on car transport needs.
Subjective influences: the collective car-orientated mindset
The car culture that is said to pervade within the city has been highlighted as a reason for high levels of car dependency and feedback loop R2 (sustainable mobility perceptions) shows the influence that policy can have on this. This car-orientated mindset is not the cause of car dependency but rather an effect of it. It has been shown to be derived from other parts of the system that influence car use, and it is these that are then causing and sustaining this sub-optimal transportation culture and associated set of norms and mindset.
The car-orientated mindset appears to be strongly influenced by subjective factors, such as the (often faulty or partially informed) perception of cost and quality of other modes, similar in nature to ‘car pride’ (Moody and Zhao Citation2019). This can then lead to a reduction in use of these other modes as habits form, and residents do not feel capable or willing to use them. These subjective influences on car dependency are currently not well understood (Van Acker et al. Citation2010, Wilkie et al. Citation2019), but have been highlighted in this study as an important element within the system. An individuals’ subjective assessment of transport modes interacts with other more objective elements of infrastructure and policy to drive the system of car dependency. The role of the collective car-orientated mindset within the causal loop diagram highlights the importance of understanding how these influences work together.
In feedback loop R3 (car-orientated mindsets and car use), high levels of car use amplify and sustain a car orientated mindset. This is reinforced and linked together by both the city’s car dominated road infrastructure, as along with a lack of (dis)incentives and enforcement to reduce car use. These then influence both the cost and convenience of car use. There are few serious (dis)incentives or enforcement measures that would increase the cost of car use on an individual journey basis in the Belfast Metropolitan Area, in spite of evidence from other cities that policy measures such as road user charging and congestion charging are effective in reducing car use (Kuss and Nicholas Citation2022).
Both the stakeholders and the residents that we spoke to highlighted the importance of considering how the cost of car use compared with non-car transport options is perceived by individuals too and the potential for subjectivity and ill-informed decision-making. The economic drivers at the political and policy level may influence individual perceptions on the cost of car use. For example, in Belfast, but also in other cities, the upfront cost of a car is rarely considered by those who use their car regularly and when considering individual journey costs. The convenience of car use also features in R3 (car-orientated mindsets and car use) as an influence on car use itself. Although physical infrastructure may impact on convenience, it does this in an indirect way, and it is the perception of convenience that has the strongest influence on levels of car use. The car may not always be objectively more convenient, but the other influences related to the car-orientated mindset meant that it was often perceived that way.
Learnings from the process
The participatory processes used in this study ensured that the causal loop diagram produced reflected the views of a range of stakeholders, including residents. A key phase was the interviews, which helped the project team to put together a first draft of the causal loop diagram based on the stakeholders’ initial understandings.
The process then continued with the group-model building workshop. This supported building capacity within this group of stakeholders, by bringing them together to discuss a common theme. It is acknowledged that many of the stakeholders may have already had an interest in the topic, and that this was one of the reasons they were willing to take part in the project in the first instance. They were all well engaged with the process. The workshop enabled the various stakeholders to come together and share their views with each other. It meant they were able to communicate with each other about their experiences and expected outcomes. There was minimal disagreement between the stakeholders and they agreed on what the main issues were in the city.
In general, the stakeholders involved understood the issues well, as was also found by Langellier et al. (Citation2019) in their study. They were quick to understand how the causal loop diagram worked and how the issues might interact and were confident in making comments on this within the workshop. They discussed both the different interactions between some of the factors, as well as where additional factors could be added to the diagram. The workshop was a collaborative process, with both the stakeholders and project team working together to refine the causal loop diagram and produce a final version that the whole group were happy with.
Strengths and limitations
Bringing stakeholders together to create the causal loop diagram ensured that the final outcome was more likely to provide a shared understanding of the complex system and inter-relating factors influencing car dependency in the Belfast Metropolitan Area. Although it was hoped that the main issues relating to car dependency in the area would be brought out through this process, it does not necessarily provide an authoritative description and this was not the aim. The final causal loop diagram produced reflects the shared knowledge and understanding of the group of stakeholders and the expertise within this group. In particular, it identifies, not just the issues and the various positions that stakeholders often predictably took on them, but the points of disconnection as a focus for further inquiry. These included, for example, a perception bias about the personal affordability of cars; public literacy about the alternatives; the professional dominance of the policy environment by roads-orientated planners, transport engineers, surveyors and so on; and critically, resources, and how the policy rhetoric is not matched by modal investment.
Future research
In the next stage of the project, stakeholders will work with the project team to develop and refine a series of potential actions and interventions. These will draw on what has already been developed through the causal loop diagram and ensure that they reflect the challenges that have been highlighted (Hunter et al. Citation2021). Their input into this will be particularly valuable, to ensure that what is developed has the potential to be achievable and deliverable.
Conclusion
The co-design of the causal loop diagram with stakeholders in the Belfast Metropolitan Area was an effective method to engage those working in research, policy, practice, and local communities to provide a shared understanding of the factors influencing car dependency. The development of this shared language is critical across sectors, professionals, operators and interests is critical in identifying the connections and disconnections in the policy system and in explaining why car dependency remains so stubbornly high. Finance, lack of policy and governmental integration, perception and personal preference, limited and incomplete knowledge are all identified as reinforcing mechanisms in the way in which the arena works in practice. Both objective and subjective influences on car dependency were shown to be important to consider, as was the interaction between these. The causal loop diagram developed surfaces these drivers in policy, infrastructure, economics and transportation norms and mindset. It provides new insights on the influences of and on car dependency to support the development of multiple, integrated interventions to transition to a future less reliant on cars. This is important in order to reduce the multiple negative health, climate and environmental impacts that high levels of car dependency can lead to and lock in cities to a sub-optimal transportation system.
Glossary
Car dependency: high levels of per capita car travel, due to car-oriented land use patterns, behavioural preferences for car use, and inadequate transport mode alternatives.
Car use: number or proportion of people using cars as a mode of transport, but no specific link to the system that determines this
Causal Loop Diagram: a form of system mapping that provides a picture of how system dynamics produces observed behaviour
Factors: often termed ‘nodes’, these are the individual elements identified within a causal loop diagram
Feedback loop: used to show patterns of interaction between factors, which shape the function of the system and how its factors may change over time and at different rates
– Balancing feedback loop: behaviours or events inside the loop counter one another, resisting to changes in one direction and bringing stability to the process over time
– Reinforcing feedback loop: behaviours or events inside the loop reinforce one another, amplifying the effect of the process over time
Group model building: the co-creation of a shared understanding of causal pathways and system dynamics
Objective influences on car dependency: those influences linked to a lack of alternatives to the car that are either viable financially, convenient or in terms of the travel time they take
Subjective influences on car dependency: those influences linked to individual habits and a culture of car use, with a lack of information or interest in other modes
Acknowledgements
We would like to acknowledge our study partners: Department for Finance Innovation Lab, Department for Health, Department for Infrastructure, Belfast Healthy Cities, Belfast City Council, Translink, Sustrans, and the Northern Ireland Public Health Agency. We would also like to thank all of the participants who took part in the interviews and workshops.
Disclosure statement
No potential conflict of interest was reported by the author(s).
Additional information
Funding
Notes on contributors
Holly Weir
The project team was led by a team from the Centre for Public Health at Queen’s University Belfast. It also incorporated expertise from researchers from a range of other disciplines within the university, including public health, systems science, urban planning, urban policy, economics, climate change and social psychology.
References
- Allender, S., et al., 2015. A community based systems diagram of obesity causes. Public library of science one, 10 (7), e0129683. doi:10.1371/journal.pone.0129683
- Bamberg, S., Ajzen, I., and Schmidt, P., 2003. Choice of travel mode in the theory of planned behavior: the roles of past behavior, habit, and reasoned action. Basic and applied social psychology, 25 (3), 175–187. doi:10.1207/S15324834BASP2503_01
- Barry, J., 2020. A genealogy of economic growth as ideology and cold war core state imperative. New political economy, 25 (1), 18–29. doi:10.1080/13563467.2018.1526268
- Blair, N., Hine, J., and Bukhari, S.M.A., 2013. Analysing the impact of network change on transport disadvantage: a GIS-based case study of Belfast. Journal of transport geography, 31, 192–200. doi:10.1016/j.jtrangeo.2013.06.015
- Carrus, G., Passafaro, P., and Bonnes, M., 2008. Emotions, habits and rational choices in ecological behaviours: the case of recycling and use of public transportation. Journal of environmental psychology, 28 (1), 51–62. doi:10.1016/j.jenvp.2007.09.003
- Cleland, C.L., et al., 2021. A qualitative exploration of the mechanisms, pathways and public health outcomes of a city centre 20mph speed limit intervention: the case of Belfast, United Kingdom. Health & place, 70, 102627. doi:10.1016/j.healthplace.2021.102627
- Cleland, C.L., et al., 2023. Complex interventions to reduce car use and change travel behaviour: an umbrella review. Journal of transport & health, 31, 101652. doi:10.1016/j.jth.2023.101652
- Department for Infrastructure, 2021. Travel survey for Northern Ireland headline report: 2017–2019. Available from: https://www.gov.uk/government/statistics/travel-survey-for-northern-ireland-headline-report-2013-2015
- Department for Infrastructure, Northern Ireland, 2015. Strategic planning policy statement (SPPS) Northern Ireland.
- Department for Infrastructure, Northern Ireland, 2020. Travel survey for Northern Ireland. Available from: https://www.infrastructure-ni.gov.uk/articles/travel-survey-northern-ireland
- Department for Regional Development – Northern Ireland. 2011. Ensuring a sustainable transport future: a new approach to regional transportation. Available from: https://www.infrastructure-ni.gov.uk/sites/default/files/publications/drd/Ensuring%20a%20Sustainable%20Transport%20Future%20-%20A%20New%20Approach%20to%20Regional%20Transportation%20%28final%20version%2C%20April%202012%29.pdf.
- Dovey, K., Woodcock, I., and Pike, L., 2017. Isochrone mapping of urban transport: car-dependency, mode-choice and design research. Planning practice & research, 32 (4), 402–416. doi:10.1080/02697459.2017.1329487
- Ercan, T., et al., 2017. Public transportation adoption requires a paradigm shift in urban development structure. Journal of cleaner production, 142 (January), 1789–1799. doi:10.1016/j.jclepro.2016.11.109.
- Esposito De Vita, G., Trillo, C., and Martinez-Perez, A., 2016. Community planning and urban design in contested places. Some insights from Belfast. Journal of urban design, 21 (3), 320–334. doi:10.1080/13574809.2016.1167586
- García, J., et al., 2019. The influence of attitudes towards cycling and walking on travel intentions and actual behavior. Sustainability, 11 (9), 2554. doi:10.3390/su11092554
- Harrison, G., Grant-Muller, S.M., and Hodgson, F.C., 2021. A review of transport-health system dynamics models. Journal of transport & health, 22, 101138. doi:10.1016/j.jth.2021.101138
- Herrault, H. and Murtagh, B., 2019. Shared space in post-conflict Belfast. Space and polity, 23 (3), 251–264. doi:10.1080/13562576.2019.1667763
- Hovmand, P., 2014. Community based systems dynamics. New York: Springer.
- Hovmand, P.S., et al., 2012. Group model-building “Scripts” as a collaborative planning tool. Systems research and behavioral science, 29 (2), 179–193. doi:10.1002/sres.2105
- Hunter, R.F., et al., 2021. Developing system-oriented interventions and policies to reduce car dependency for improved population health in Belfast: study protocol. Systems, 9 (3), 62. doi:10.3390/systems9030062
- International Transport Forum, 2019. Reversing car dependency: summary and conclusions. Paris: OECD Publishing, ITF Roundtable Reports, No. 181. Available from: https://www.itf-oecd.org/reversing-car-dependency
- Jeekel, H., 2013. The car-dependent society: a European perspective. London: Routledge. doi:10.4324/9781315614311
- Kuss, P. and Nicholas, K.A., Feb 2022. A dozen effective interventions to reduce car use in European cities: lessons learned from a meta-analysis and transition management. Case studies on transport policy, 10 (3), 1494–1513. doi:10.1016/j.cstp.2022.02.001
- Langellier, B.A., et al., 2019. Using community-based system dynamics modeling to understand the complex systems that influence health in cities: the SALURBAL study. Health & place, 60 (November), 102215. doi:10.1016/j.healthplace.2019.102215
- Litman, T., 2012. Transportation land valuation: evaluating policies and practices that affect the amount of land devoted to transportation facilities. Victoria, BC: Victoria Transport Policy Institute. Available from: https://www.vtpi.org/land.pdf
- Lois, D. and López-Sáez, M., 2009. The relationship between instrumental, symbolic and affective factors as predictors of car use: a structural equation modelling approach. Transportation research part A: Policy and practice, 43, 790–799. doi:10.1016/j.tra.2009.07.008
- Lowe, M., et al., 2022. City planning policies to support health and sustainability: an international comparison of policy indicators for 25 cities. The lancet global health, 10 (6), e882–94. doi:10.1016/S2214-109X(22)00069-9.
- Lydon, M., et al., 2021. Understanding the barriers to NET-ZERO transport for rural roads: a northern Ireland case study. Journal of infrastructure preservation and resilience, 2 (1), 24. doi:10.1186/s43065-021-00038-x.
- Macmillan, A. and Woodcock, J., 2017. Understanding bicycling in cities using system dynamics modelling. Journal of transport & health, 7 (December), 269–279. doi:10.1016/j.jth.2017.08.002
- Mattioli, G., et al., 2020. The political economy of car dependence: a systems of provision approach. Energy research & social science, 66, 101486. doi:10.1016/j.erss.2020.101486
- Mattioli, G., Anable, J., and Vrotsou, K., 2016. Car dependent practices: findings from a sequence pattern mining study of UK time use data. Transportation research part A: Policy and practice, 89 (July), 56–72. doi:10.1016/j.tra.2016.04.010
- Michail, N., et al., 2021. Children’s experiences of their journey to school: integrating behaviour change frameworks to inform the role of the built environment in active school travel promotion. International journal of environmental research and public health, 18 (9), 4992. doi:10.3390/ijerph18094992
- Moody, J. and Zhao, J., 2019. Car pride and its bidirectional relations with car ownership: case studies in New York City and Houston. Transportation research part A: Policy and practice, 124, 334–353. doi:10.1016/j.tra.2019.04.005
- Murtagh, B., Garcia, L., and Hunter, R., 2023. Developing system-oriented interventions to reduce car dependency for improved population health in Belfast: policy mapping and socio-technical transitions. Belfast: Queen’s University Belfast. Available from: https://www.qub.ac.uk/sites/cardep/Filestore/Filetoupload,1748559,en.pdf
- Newman, P. and Kenworthy, J., 1999. Sustainability and cities: overcoming automobile dependence. Washington: Island Press.
- Noblet, C., Thøgersen, J., and Teisl, M., 2014. Who attempts to drive less in New England? Transportation research: Part F, traffic psychology and behaviour, 23, 69–80. doi:10.1016/j.trf.2013.12.016
- Richardson, G.P. and Andersen, D.F., 1995. Teamwork in group model building. System dynamics review, 11 (2), 113–137. doi:10.1002/sdr.4260110203
- Rickles, D., Hawe, P., and Shiell, A., 2007. A simple guide to chaos and complexity. Journal of epidemiology and community health, 61 (11), 933–937. doi:10.1136/jech.2006.054254
- Rouwette, E.A.J.A., Vennix, J.A.M., and van Mullekom, T., 2002. Group model building effectiveness: a review of assessment studies. System dynamics review, 18 (1), 5–45. doi:10.1002/sdr.229
- Schmidt, C., 2004. The analysis of semi-structured interviews. In: U. Flick, E. von Kardorff, and I. Steinke, eds. A companion to qualitative research. London: Sage, 253–258.
- Scriptapedia, n.d. Scriptapedia/role on group model building. Available from: https://en.wikibooks.org/wiki/Scriptapedia/Roles_in_Group_Model_Building
- Smeekes, O.S., Willems, H.C., and Blomberg, I., 2023. Implementing online group model building to unravel complex geriatric problems, a methodological description. BMC geriatrics, 23 (1), 431. doi:10.1186/s12877-023-04110-x
- Sterman, J., 2000. Business dynamics: systems thinking and modeling for a complex world. Irwin/McGraw-Hill.
- Sterman, J.D., 2011. Communicating climate change risks in a skeptical world. Climatic change, 108 (4), 811. doi:10.1007/s10584-011-0189-3
- Sterrett, K., Hackett, M., and Hill, D., 2012. The social consequences of broken urban structures: a case study of Belfast. Journal of transport geography, 21 (March), 49–61. doi:10.1016/j.jtrangeo.2012.01.014
- TomTom, 2022. Belfast traffic. Available from: https://www.tomtom.com/en_gb/traffic-index/belfast-traffic/
- Trochim, W.M., et al., 2006. Practical challenges of systems thinking and modeling in public health. American journal of public health, 96 (3), 538–546. doi:10.2105/AJPH.2005.066001.
- United Nations, 2022. World population review 2022. Available from: https://worldpopulationreview.com/
- Van Acker, V., Van Wee, B., and Witlox, F., 2010. When transport geography meets social psychology: toward a conceptual model of travel behaviour. Transport reviews, 30 (2), 219–240. doi:10.1080/01441640902943453
- Vennix, J.A.M., 1999. Group model-building: tackling messy problems. System dynamics review, 15 (4), 379–401. doi:10.1002/(SICI)1099-1727(199924)15:4<379:AID-SDR179>3.0.CO;2-E
- Widener, M.J. and Hatzopoulou, M., 2016. Contextualizing research on transportation and health: a systems perspective. Journal of transport & health, 3 (3), 232–239. doi:10.1016/j.jth.2016.01.008
- Wiersma, J., Bertolini, L., and Straatemeier, T., 2016. How does the spatial context shape conditions for car dependency? An analysis of the differences between and within regions in the Netherlands. Journal of transport and land use, 9 (3). doi:10.5198/jtlu.2015.583.
- Wilkie, S., et al., 2019. Restructuring the built environment to change adult health behaviors: a scoping review integrated with behavior change frameworks. Cities & health, 2 (2), 198–211. doi:10.1080/23748834.2019.1574954
- Xiao, C., et al., 2022. Shifting towards healthier transport: carrots or sticks? Systematic review and meta-analysis of population-level interventions. The lancet planetary health, 6 (11), e858–69. doi:10.1016/S2542-5196(22)00220-0
Appendix A. Group model building workshop agenda
Appendix B.
Resident Interview Questions
Q1. Please could you start by telling me a bit about yourself: how old are you, are there any other members of your household, and what neighbourhood area do you live in?
Q2. How many cars do you own in your household? Do you own any bikes or other vehicles?
Q3. Tell me about your normal daily routine, focussing on how you get around and the travel modes that you use
Q4. What do you think are the main things that influence your current travel habits?
Q5. Now thinking about the other members of your household, what does their daily routine look like and how do they get around?
Q6. What do you think influences their travel habits?
Q7. Levels of car use in Belfast are relatively high and haven’t changed much in the past 10 years – have you any thoughts on why this is?
Q8. What do you think are the main things that would need to change to influence car us in Belfast in the future?
Q9. Is there anything that could be changed to reduce your levels of car use? These could be financial, social, health, environment related
Q10. What do you think should be the priorities for reducing car use in Belfast? These could be either short, medium or long term changes
Q11. Do you have any thoughts on the Glider as a transport service or the Weavers Court transport hub development?
Q12. Have you any other suggestions on the future of transport and car dependency
in the Belfast metropolitan area that we should consider within the project?
Appendix C.
Stakeholder Interview Questions
Please introduce yourself and your relationship to the topic of car dependency
Use of public transport, walking and cycling has stayed broadly the same in Northern Ireland since 2009 (around 24%). Why do you think that this is the case?
Please list the critical health, social, economic (including low-income communities), and environmental drivers that will influence car use in Belfast through to 2050?
How these factors are interrelated, and affected by car dependency (considered as a ‘broader driver’)?
What do you think are the future opportunities to reduce car dependency over the short (in ten years), medium (10-20) and long term (21-30)?
What should be the priorities for reducing car dependency in Belfast? In particular, what can be done differently over the short, then medium, and then long term?
What role do local practices, innovative projects, community initiatives, local protest movements play in creating alternatives to the car. How can they be scaled, replicated or integrated within the transport offer?
How important do you think demand responsive transport; community-based transport networks and social car schemes might be in addressing car dependency in the Belfast metropolitan area?
Do you know or are you aware of any individual or group(s) doing anything radically different or innovative in terms of sustainability or management in or around reducing car dependency?
Do you feel that there is a need to change the structures governing transport for a reduction in car dependency in Belfast specifically and Northern Ireland generally?
What do you feel are the priorities for the development of the Weavers Court Transport Hub in terms of impact on the surrounding communities; the mix of uses within the hub; and connectivity to other transport modes and locations?
How effective do you think the Glider a. has been; b. can be in reducing car dependency in the city?
Do you feel that the Glider has had an impact on the following: the most disadvantaged communities along the route; commuters; the leisure and entertainment sector; the commercial health of the city centre; addressing (religious) segregation in the city?
Have you any other suggestions on the future of transport and car dependency in the Belfast metropolitan area that we should consider within the project?