
ABSTRACT
We aimed to examine whether features of the natural, built and socioeconomic neighbourhood environments were related to depressive symptoms in Australian mid-age and older adults; and whether traffic-related air pollution (TRAP) (NO2) and area-level SES moderated the associations. A total of 4141 of participants (Mage = 61 years) were included in this cross-sectional study. Neighbourhood environmental characteristics included percentages of parkland, blue space and commercial land use, population density (persons/hectare), street intersection density (intersections/km2) within 1 km residential buffers. Annual mean concentrations of nitrogen dioxide (NO2) were included. In total-effect models, greater street intersection connectivity was associated with fewer depressive symptoms. Population density was positively associated with depressive symptoms in direct-effect models. Residents from disadvantaged areas with low levels of NO2 and with greater commercial land use coverage reported fewer depressive symptoms. In contrast, residents were more likely to report depressive symptoms with greater coverage of commercial land use in high SES neighbourhoods with low levels of NO2. Street connectivity and population density play a role in the maintenance of mental health in older adults. NO2 and area-level SES are moderators of commercial land use-depression associations, and this knowledge can better inform planning of commercial destinations and facilities in urban environments.
Introduction
Depression is a common mental health disorder among older adults (persons 65 years of age and older), with a prevalence of 35% (Cai et al. Citation2023) and is believed to be underdiagnosed and undertreated (World Health Organisation Citation2023). Further, it is thought that approximately 7.4%-13.2% of older adults experience depressive symptoms in Australia (Mohebbi et al. Citation2019). In the ageing population, depression is a major cause of functional decline and disability, cognitive impairment and diminished quality of life (Vigo et al. Citation2016). Due to limited mobility and declining physical health, older adults tend to spend more time in their local neighbourhood (Barnett et al. Citation2020) and predominantly rely on local neighbourhood services (e.g. hospitals, supermarkets) and recreational facilities (e.g. parks, restaurants) (Barnett et al. Citation2018). Thus, the creation of age-friendly local neighbourhoods is recognised as a promising large-scale, population-level strategy to prevent depression as well as to alleviate the severity of depressive symptoms in older adults (Cerin et al. Citation2017, Gruebner et al. Citation2017).
Emerging evidence has shown that aspects of the natural (e.g. access to parks and blue spaces), built (e.g. higher dwelling density, interconnected streets) and socioeconomic neighbourhood environment (higher area-level socioeconomic status) are related to fewer depressive symptoms in older adults (e.g. Barnett et al. Citation2018, Chen et al. Citation2022, Japan; Gonzales-Inca et al. Citation2022, Finland; Guo et al. Citation2020, Hong Kong); however, several studies have shown opposite (Zhang et al. Citation2018, Hong Kong), non-linear (Yue et al. Citation2022, China), or no neighbourhood-depression associations (Annerstedt et al. Citation2012, Sweden). Discrepant findings may be, in part, because previous studies have mainly examined the effects of a single and/or a limited range of neighbourhood attributes on mental (Barnett et al. Citation2018) and cognitive health (Cerin et al. Citation2023, Soloveva et al. Citation2023) in non-clinical populations. However, and importantly, neighbourhood features can be causally related (Cerin Citation2019) (Figure S1 in Appendix J). For example, while increased shops and commercial destinations can encourage walking and socialising among older adults – which is beneficial for mental health (Cerin et al. Citation2017) – the same high percentage of commercial land use is usually accompanied by higher levels of air pollution, which increases the risk of late-life depression in older adults (Qiu et al. Citation2023). Thus, to allow an unbiased assessment of neighbourhood-depression associations (Cerin Citation2019), future studies should adjust for key neighbourhood attributes in the statistical analyses.
Emerging research shows that neighbourhood-depression associations may be further moderated by key neighbourhood attributes, such as neighbourhood socioeconomic status (Pearce et al. Citation2018, Scotland) and outdoor air pollution (Cerin et al. Citation2023, Australia; Yang et al. Citation2022, UK). Specifically, traffic-related air pollution (TRAP) (NO2) is one of the main contributors to air pollution in urban areas and presents significant mental health risks to older adults because they are more vulnerable to the adverse effects of environmental hazards, such as NO2 (Qiu et al. Citation2023). According to the World Health Organisation (World Health Organisation Citation2021), current recommendations state that annual average concentrations of NO2 should not exceed 10 µg/m3. For example, Yang et al. (Citation2022) have shown that the association between increased residential greenness and reduced odds of hospital admissions for mental disorders was stronger in low-level NO2 and was not observed in highly polluted neighbourhoods. This may suggest that if the levels of NO2 are low, older adults are likely to enjoy a full range of physically-, cognitively- and socially-stimulating activities in the neighbourhood, which, in turn, positively affect older adults’ mental health (Cerin et al. Citation2023).
Furthermore, the negative effects of high levels of NO2 on depressive symptoms may be mitigated in residents living in advantaged neighbourhoods because such areas are safer (less crime), have better access to commercial areas, parks and recreational facilities, public transport and health-related destinations (Cerin et al. Citation2017). For example, in China, Cao et al. (Citation2023) demonstrated that the cumulative effects of air pollution on mental health, as measured by real-time mental-health-related queries, are smaller in individuals living in cities with higher GDP per capita, more health resources, high percentage of parkland and more sports facilities in the area. However, increased exposure to air pollutants (such as fine particulate matter (PM2.5) and NO2 concentration)) was associated with a greater risk of late-life depression among older adults living in socioeconomically disadvantaged areas (Qiu et al. Citation2023). Hence, due to the presence of more neighbourhood environmental stressors (e.g. crime, air pollution, noise) (Gruebner et al. Citation2017) and fewer supporting resources (e.g. lack of health clinics and community centres, lack of social capital) that characterise disadvantaged neighbourhoods (Leslie and Cerin Citation2008), exposure to higher levels of NO2 can exacerbate depressive symptoms and increase the risk of depression in older adults (Pearce et al. Citation2018, Cerin et al. Citation2023). Such findings suggest that it is important to consider both neighbourhood socioeconomic status and NO2 as moderators of the neighbourhood-depression association in older adults because by understanding these complex relationships, we can better understand how neighbourhoods can support the mental health of its residents.
To address the above-mentioned knowledge gaps, this study examined: (1) the conjoint total and direct cross-sectional associations of neighbourhood natural, built and socioeconomic characteristics and air pollution (operationalised as annual average NO2 (TRAP) concentrations)) with depressive symptoms; and (2) the moderating effects of neighbourhood socioeconomic status and NO2 on the associations of the natural and built environment with depressive symptoms in mid-age and older adults. We hypothesise that neighbourhood socioeconomic status and NO2 will differentially affect the relationships of aspects of the natural and built environments with depressive symptoms in mid-age and older adults.
Methods
Sample
We used cross-sectional data from the third wave (2011-2012) of the Australian Diabetes, Obesity and Lifestyle Study (AusDiab), a national, population-based study of Australian adults. In AusDiab, depressive symptoms were measured only in Wave 3. We described sampling procedure, power calculations and data collection procedures elsewhere (Dunstan et al. Citation2002, Anstey et al. Citation2015). Participants were mid-age and older adults with the average age of 61 years (SD = 11.4, range: 34-97 years) (). Participants were eligible to participate in the study if they were: (1) aged 25 years and older; (2) resided at their residential addresses for at least six months prior to the survey; and (3) lived in urban areas, with a population of 10,000 people or more. Participants who did not meet the above inclusion criteria were removed from the statistical analyses (n = 473), resulting in the final sample of 4141. The study was approved by the Alfred Hospital Ethics Committee, Melbourne, Australia (ref. no. 39/11; 2 March 2011). Informed consent was obtained from all participants involved in the study.
Table 1. Sample characteristics.
Measures
Environmental measures
Environmental exposure data consisted of aspects of the neighbourhood natural, built and socioeconomic environment, and air pollution. Neighbourhood was defined as an area within 10-20 minute walking distance from a participant’s residential address home and 1 km street-network buffers were used, respectively. Natural features included percentage of parkland and percentage of blue space (e.g. lakes, coastlines, rivers and reservoirs) in a neighbourhood. Data on these features were respectively derived from the 2011 Australian Bureau of Statistics (ABS) Mesh Block data (Australian Bureau of Statistics ABS Citation2011) and Geoscience Australia data on surface water features (Crossman and Li Citation2015). Built environment measures were population density (persons/ha) and percentage of commercial land use (excluding industrial use) derived from the 2011 ABS Mesh Block data, and street intersection density (intersections/km2) derived from the PSMA Australia Limited (Citation2012) Transport & Topography dataset (PSMA Australia Limited Citation2012). Greater street connectivity refers to how well streets are connected and/or are related to each other in the neighbourhood (Saelens et al. Citation2003). Specifically, neighbourhoods with greater street connectivity are characterised by higher street intersection density, small blocks, shorter street segments and alternative routes to destinations (Saelens et al. Citation2003, Sharifi Citation2019, Chen et al. Citation2022). Although there are many indicators of street connectivity, which include, but are not limited to, the average distance between intersections, the average node connectivity and the average path length (Zhang et al. Citation2015, Sharifi Citation2019) as well as measures of street typology (e.g. street centrality), in this study, we focus on intersection density (the number of intersections (nodes) per unit area)) as a measure of street connectivity. The Index of Relative Socio-Economic Advantage and Disadvantage (IRSAD) at the SA1 (Statistical Area 1) was used to determine neighbourhood socioeconomic status for each participant (Australian Bureau of Statistics ABS Citation2011). Air pollution exposures used in this study were annual average concentrations of nitrogen dioxide (NO2, units: ppb) estimated at each residential address using satellite-based land-use regression (LUR) models (Knibbs et al. Citation2014). Further details on the data sources and measures are provided elsewhere (Knibbs et al. Citation2014, Anstey et al. Citation2015). Please refer to for further information on socio-demographics and neighbourhood variables as well as to Appendix A for information on the neighbourhood self-selection scale.
Depression measures
The Center for Epidemiological Studies Depression Scale (CES-D; Radloff Citation1977) is a 20-item self-reported measure that was used to assess the severity of depressive symptoms in older adults over the previous seven days. CES-D responses are rated on a 4-point Likert scale ranging from 0 (rarely or none of the time) to 3 (most or all of the time). The CES-D total score ranges from 0 to 60 (see Appendix L for more details).
Statistical analyses
From N = 4141, nearly 11% of participants had missing data on at least one variable, 10% on at least two variables and 4% on more than 3 variables. Under a missing at random assumption, 20 imputed datasets were, therefore, created for the multivariable regression analyses in accordance with recommended procedures (Van Buuren and Groothuis-Oudshoorn Citation2011). We used causal directed acyclic graphs (DAGs) to inform the selection of a minimal set of confounders to be included in multiple-exposure regression models (Cerin Citation2019) (see Figure S1 and Tables S2-S3). Generalised additive mixed models (GAMMs; package ‘mgcv’ version 1.8-4.0 in R) (Wood Citation2017) with random intercepts at the SA1 level were used to estimate cross-sectional total and direct effects of neighbourhood environmental attributes on depressive symptoms in mid-age and older adults, to allow for possible curvilinearity in associations and clustering effects at the SA1 level. By total and direct effects, we refer, respectively, to the associations between specific neighbourhood environmental attributes and depressive symptoms unadjusted and adjusted for other environmental attributes deemed to mediate these associations. Further, GAMMs were used to estimate the moderating effects of area-level IRSAD and NO2 on the neighbourhood-depression associations. Environmental exposure measures were centred at their mean. To estimate moderating effects of area-level IRSAD and NO2 on the associations between the aspects of natural and built environment with depressive symptoms, we added two- and three-way interaction terms of each neighbourhood environmental attribute by area-level IRSAD by NO2 to the main effect models (fully-adjusted) of each environmental exposure and depressive symptoms (described in detail in Tables S2-S3). If interaction effects were statistically significant, we probed them by estimating the associations of an environmental exposure at meaningful values of moderators (mean ±1SD) (area-level IRSAD and NO2). Significant moderation effects were also presented graphically (slope estimates of neighbourhood environment variables (and 95% confidence intervals) at meaningful values of area-level IRSAD and NO2). Gaussian variance and identity link functions were used in GAMMs because the depression scores were approximately normally distributed. Model selection (linear vs. curvilinear effect) was based on Akaike Information Criterion (AIC) values, where a lower AIC value was indicative of a better-fitting model (Cerin et al. Citation2023). Our data did not provide sufficient evidence of curvilinear effects of neighbourhood environmental attributes on depressive symptoms and linear terms were used (see Table S1 in Appendix B). No multicollinearity was found, as indicated by Variance Inflation Factors (VIFs) < 3 (Sheather Citation2009). We also conducted multivariable regression analyses on complete (non-imputed) data (Tables S4–S7 in Appendix F–I).
Results
Demographics characteristics
While the distributions of sex and household income categories were relatively balanced, the majority of participants were of English-speaking background, in paid employment and living with a partner but without children (). There was substantial variability in respect to several neighbourhood environmental attributes; for example, population density ranged from .01 to 146.37 persons per/ha, street intersection density ranged from 0 to 316.3 intersection/km2 and percentage of commercial land use varied from 0% to 96%. Of note, the description of population density as ‘higher’ or ‘lower’ is relative and is described in terms of + 1SD and − 1SD from the sample mean. This approach is typically used to quantify the regression coefficients at above and below average values of a continuous moderator (Aiken and West Citation1991). The average percentage of residential buffer area devoted to blue space (0.2%) was lower than that devoted to parkland (11.6%). The annual average concentration of NO2 was 5.5 ppb, which is considered low compared to other urban environments in Europe, Asia and the Americas (Anenberg et al. Citation2022) and is ~ 10.8 µg/m3 which is just above the World Health Organisation (World Health Organisation Citation2021) guidelines. Further, for participants, it was somewhat important to move to the neighbourhood to access destinations (M = 3.0, SD = 1.4) and recreational facilities (M = 3.1, SD = 1.5).
Total and Direct Effects of Neighbourhood Attributes on Depressive Symptoms
The total and direct cross-sectional effects of neighbourhood environmental attributes on depressive symptoms are reported in . In the total- and direct-effect models, higher street intersection connectivity in a 1 km residential buffer was associated with lower depression scores in mid-age and older adults. Further, higher population density showed positive direct effects on depressive symptoms in mid-age and older adults. No other significant associations were observed.
Table 2. Total effects of environmental attributes on depressive symptoms.
Table 3. Direct effects of environmental attributes on depressive symptoms.
The moderating role of neighbourhood socioeconomic status and NO2
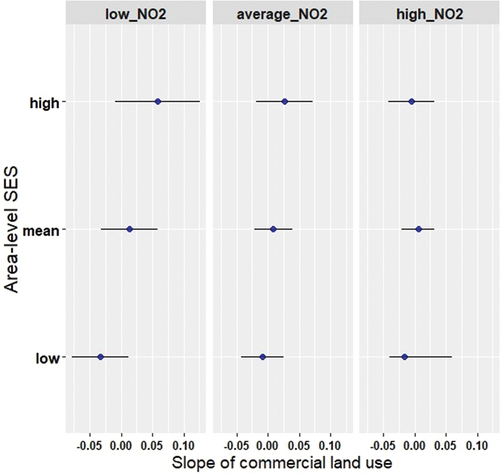
We found a statistically significant three-way interaction effect between commercial land use indexed by area-level IRSAD by NO2 with depressive symptoms (β = −.010; 95% CI, −.009 to − .001, p = .01). As can be seen in , there is evidence for the effect of NO2 on the association between commercial land and depressive symptoms in advantaged and disadvantaged neighbourhoods, but not in neighbourhoods with average IRSAD values. In particular, among residents living in disadvantaged neighbourhoods with low levels of NO2, the association between commercial land use and depression was negative, whereas among residents living in advantaged neighbourhoods with low levels of NO2, the effect of commercial land use on depression was positive. This means that individuals from disadvantaged areas with low levels of NO2, reported fewer depressive symptoms with increased percentage of commercial land use. On the other hand, residents were more likely to report depressive symptoms with greater coverage of commercial land use in high SES neighbourhood with low levels of NO2. No other moderating effects of area-level IRSAD by NO2 on the neighbourhood – depression associations were observed (Table S8 in Appendix K).
Figure 1. Associations between commercial land use and depressive symptoms at different values of neighbourhood socioeconomic status (y-axis) and annual average concentrations of NO2. Legend: IRSAD, Index of Relative Advantage and Disadvantage; panel A, NO2 at mean − 1SD value; panel B, NO2 at mean value; panel C, NO2 at + 1SD value; Slope of commercial land use, slope of the relationship between commercial land use and depressive symptoms.
Discussion
We found that NO2 moderated the association between commercial land use and depressive symptoms in advantaged and disadvantaged neighbourhoods in mid-age and older adults. In particular, residents from disadvantaged areas with low levels of NO2, were less likely to report depressive symptoms with increasing percentage of commercial land use, whereas residents from high SES neighbourhoods with low levels of NO2 reported increased depressive symptoms with greater coverage of commercial land use. Further, we found that individuals who live in neighbourhoods with higher street intersection connectivity reported fewer depressive symptoms. Population density was positively associated with depression. No other significant findings were observed.
Natural environment
Contrary to our expectations, we found no associations between green and blue spaces with depressive symptoms in mid-age and older adults. This finding is quite surprising because, as a whole, greater availability of green space in the neighbourhood has been consistently associated with better mental health outcomes, including diminished depressive symptoms and lower odds of depression (Gonzales-Inca et al. Citation2022). One of the potential explanations is that specific types of green spaces (e.g. street trees, woodland, recreational parks) might be more beneficial in protecting against depression in ageing populations (Annerstedt et al. Citation2012), as opposed to the amount of greenery or parkland (including parkland, natural reserves, public open spaces and outdoor sporting facilities) in the neighbourhood. For example, some studies have shown that exposure to trees was associated with lower odds of depression and better self-reported health in older adults; however, no support was found for grassland and fields (Reid et al. Citation2017, Astell-Burt and Feng Citation2019). It is possible that increased exposure to tree canopies and/or street trees may particularly benefit older adults by reducing surface/sidewalk temperatures and outdoor air pollution, to which older adults are more vulnerable (Kenny et al. Citation2017, Qiu et al. Citation2023). This further prevents pedestrian falls among older adults (Lee et al. Citation2022) and allows them to safely enjoy outdoor activities. Importantly, despite the availability of green spaces (e.g. large areas of grassland) in the neighbourhood, these areas may not be accessible for older adults (e.g. no footpaths) or equipped with the facilities necessary to promote physically, cognitively- and socially-stimulating activities, which are important for positive mental health outcomes.
In a similar vein, our measure of blue space data did not distinguish between ‘blue’ categories (inland, coast, rivers). In particular, the quality and/or certain features of blue spaces might disproportionately affect people’s mental health (Lin and Wu Citation2021) in comparison to the blue space-coverage ratio. In a recent Australian study, Murrin et al. (Citation2023) has shown that living closer to blue space was associated with diminished anxiety, but not with lower symptoms of depression; however, living near the coast was associated with lower levels of anxiety and depression, suggesting that different types of blue spaces hold different associations with depression. Importantly, older adults are likely to prioritise safety (e.g. biking, crime), accessibility (e.g. no heavy traffic), as well as public (e.g. seating, toilets) and recreational facilities (e.g. swimming, picnics, fishing) in the blue space, the lack of which, might discourage them to use blue spaces in their neighbourhood despite the fact that blue spaces might be abundant in the area. Overall, the choice of exposure indicators (tree canopy cover vs total greenness vs street trees with high levels of biodiversity; coast vs inland vs rivers) may differentially affect the relationship between aspects of natural environment and mental health (Astell-Burt and Feng Citation2019) and this should be addressed in future studies.
Built environment
Street intersection connectivity
In line with our expectations, we found that higher street connectivity (intersection density) was associated with lower depressive symptoms in mid-age and older adults. Although there is a dearth of research on the street connectivity-depression association, this finding is consistent with cross-sectional (Guo et al. Citation2020) and longitudinal (Chen et al. Citation2022) studies showing that residents who live in neighbourhoods characterised by higher street intersection density and, therefore, smaller blocks and more alternative routes to destinations, are at lower risk of depression, because such neighbourhoods facilitate walking for transport (e.g. retail, health clinics) (Cerin et al. Citation2017). On the other hand, longer and straight streets with fewer intersections (lower street connectivity) allow more traffic to pass through (e.g. trucks) and promote fast driving. As a result, older adults may avoid walking to destinations and facilities in such neighbourhoods (Saelens et al. Citation2003). Further, superior street connectivity promotes social interactions with neighbours and friends (Leslie and Cerin Citation2008) which, in turn, eases negative emotions and enhances positive mental states (Gascon et al. Citation2018). Importantly, by developing social networks with the local community, older adults’ sense of belonging to the neighbourhood is reinforced and this also protects against depression (Cramm and Nieboer Citation2015). It is important to note that a street connectivity-depression association was found in both total- and direct-effect regression models and after adjustment for key environmental confounders and mediators (e.g. neighbourhood self-selection), emphasising that, in urban settings, higher street connectivity is beneficial for mental health in mid-age and older adults.
Population density and depression
In this study, higher population density was related to worsened depressive symptoms in mid-age and older adults. Most studies thus far have focused on urban – rural comparisons (Bonnell et al. Citation2022) and the evidence about population density and depressive symptoms, especially in older adults, is scarce (Sundquist et al. Citation2004). For example, in a study of the entire population in Sweden (4.4 million), the risk of developing depression in residents living in the most densely populated area was 43% higher than those living in the least populated area. Likewise, in the context of urban-rural research, urban residence was associated with worsened depression and functional capacity compared to rural residents with similar utilisation of care services. A plausible explanation for the urbanicity-depression association is that in densely populated neighbourhoods, people are more likely to live close to each other and/or in shared and crowded spaces, such as living in high-rise buildings which weaken social relationships (Nguyen et al. Citation2020). In particular, it may escalate undesirable social contacts and interactions and compromise a sense of community among older adults which, in turn, lead to stress and depression (Gifford Citation2007). Intrusion of personal space and shortening of social distance is a common occurrence in dense, destination-rich neighbourhoods and it can further compromise mental health in older adults (Engelniederhammer et al. Citation2019). In support, past studies have shown that crowding near buildings and recreational areas negatively impacted mood (Honey-Roses and Zapata Citation2023) and raised stress levels (Zhang et al. Citation2022). As discussed earlier, older adults spend a lot of time in their neighbourhood due to deterioration in physical health, and if they are exposed to stress that is related to excessive population density on a daily basis, it can initiate physiological, psychological and cognitive process that elevate the risk of depression (e.g. formation of maladaptive responses) (Li et al. Citation2022). Future studies are needed to better understand potential mechanisms explaining urbanicity-depression association in ageing populations.
Moderating effects of NO2 and area-level IRSAD
No significant association was found between commercial land use and depression in mid-age and older adults. However, and importantly, we found moderating effects of NO2 and area-level socioeconomic status on the relationship between commercial land use and depressive symptoms. In particular, participants from disadvantaged areas with low levels of NO2, reported fewer depressive symptoms with increased percentage of commercial land use, whereas residents living in advantaged neighbourhoods with low levels of NO2 were more likely to report depressive symptoms with greater coverage of commercial land use within the neighbourhood.
The finding that residents from disadvantaged neighbourhoods with low levels of NO2, mentally benefit from exposure to commercial land use was expected. NO2 is a significant environmental stressor, and if it is kept at low levels, people are likely to enjoy stimulating lifestyle and ‘commercial’ activities, such as shopping, dining or entertainment which, in turn, may reduce depressive symptoms (Yang et al. Citation2022, Cerin et al. Citation2023). Due to the lack of finances and social support, which is a common experience for socially underprivileged residents, they can disproportionately benefit from neighbourhood resources, including the use of commercial areas (Pearce et al. Citation2018). Importantly, commercial areas can increase neighbourly communication, build social capital and an improve sense of place (Manaugh and Kreider Citation2013) as well as facilitate walking behaviour (Cerin et al. Citation2017) known to be beneficial for mental health. Thus, it is not surprising that individuals who live in disadvantaged neighbourhoods with low concentrations of NO2 reported fewer depressive symptoms with greater exposure to commercial land use.
However, we did not expect to see negative effects of commercial land use on depression in mid-age and older adults who live in advantaged areas with low levels of NO2. It is possible that residents from advantaged neighbourhoods may be less tolerant to noise, which results from traffic associated with commercial facilities (shops, restaurants). Alternatively, certain destinations can be more beneficial to older adults’ mental health than others, such as community centres and religious institutions, as well as restaurants, hairdressers and pharmacies, as opposed to shops and offices, because they provide opportunities for social interaction and accidental social contact (King et al. Citation2015), and social engagement is protective against depression. In support, among men aged 65-79 years, increased odds of depression were associated with more land diversity in the neighbourhood, independent of street connectivity and residential density (Saarloos et al. Citation2011) – retail availability was associated with a 40% increased risk of depression. In contrast, at 4-year follow-up, greater availability of community centres in the 500-m neighbourhood buffer reduced depressive symptoms in older adults, suggesting that the type of destinations can play a critical role in the commercial land use-depression association. However, in our study, we could not reveal the composition of land-use and, therefore, could not distinguish destinations that support mental health (e.g. restaurants and cafes) from those that do not (e.g. office buildings). Importantly, NO2 may be considered a proxy of destinations and human activity. Thus, low levels of NO2, as in our study, may indicate less traffic and lack of interesting/appealing places to visit, which is not beneficial for mental health. Future research is needed to better understand the impact of commercial land use on depressive symptoms, while accounting for NO2 and neighbourhood socioeconomic status. Further to this, it has been shown that low levels of NO2 can adversely affect people’s health (Strak et al. Citation2021) and in the context of increased levels of air pollutants globally, it is critical for the governments to consider more stringent air quality standards as well as pursue low emission vehicles as a population-level strategy to support mental health in Australia and internationally (Ewald et al. Citation2021).
Strengths and limitations
To the best of our knowledge, this is the first study that examined the moderating effects of both neighbourhood socioeconomic status and traffic-related air pollution on the association between the natural and build neighbourhood environments with depressive symptoms in mid-age and older adults. In addition, no other study has yet investigated the moderating effects of NO2 and area level SES on neighbourhood-depression association in the Western context, such as in Australia, where levels of air pollutants, including NO2, are relatively low. Further, we adjusted for key neighbourhood environmental attributes in the multiple-exposure regression models to ensure an unbiased evaluation of neighbourhood-depression associations. Other strengths include a large sample of participants (N = 4141) from diverse geographical areas and urban environments, as well as the adjustment for neighbourhood self-selection in the regression models to address the issue of reverse causality using a residential self-selection scale (please see Appendix A). Of note, residential self-selection scale is a brief scale, which has been validated in a number of studies (e.g. Cerin et al. Citation2021); however, as a self-reported measure, it is prone to a recall bias.
The cross-sectional design is a limitation and we cannot infer causation. For example, exposure to neighbourhoods characterised by well-deigned and interconnected streets earlier in life can result in diminished depressive symptoms in older adults (Pearce et al. Citation2018). Several environmental characteristics (e.g. parkland, commercial land use) were measured at the mesh block level, which is deemed coarse for characterising destination accessibility (Cerin et al. Citation2023). This could have limited our capacity to detect significant associations between parkland and depression. Moreover, we could not distinguish commercial destinations that support mental health from those places that do not and this is important given differential impact of commercial land use on depression in advantaged and disadvantaged areas with low levels of NO2. Another limitation is that our sample was relatively healthy; participants in Wave 3 of AusDiab were more physically active and better educated than those who dropped out of the study (Cerin et al. Citation2023) and over 85% of participants reported having no depressive symptoms, which could have resulted in a possible underestimation of environmental correlates of depression. Further, depressive symptoms were measured via a self-reported questionnaire, while validated, there is always the possibility of stigma and/or a social desirability bias. It is worth noting that individuals who exhibit depressive symptoms are more likely to have reduced income and lower individual socioeconomic social status as well as lower educational and occupational attainment (Schlax et al. Citation2019, Patria Citation2022) and, thus, may choose to reside in poorer but affordable areas, with limited access to resources and facilities. Importantly though, this issue of reverse causality was in part addressed by adjusting for residential self-selection in the statistical analysis. Although sex was included as a covariate in the regression models, we did not examine whether there were any sex differences in respect to the moderating effects of NO2 and area-level SES on the association between commercial land use and depressive symptoms in older adults. Moreover, one of the inclusion criteria at baseline was that participants had to reside at least six months in their place of residence; however, no information was available about for how long they had lived in the neighbourhood prior to being assessed for depressive symptoms. Future research should address these limitations by conducting longitudinal studies with rigorous spatial measures to capture the trajectory of changes in depressive symptoms across time, as well as to characterise commercial land use-depression associations more accurately. Lastly, and while not addressed in this study, we recommend future studies to examine neighbourhood-depression associations by the racialised groups and between developed versus developing countries.
Conclusions
In conclusion, this study showed that mid-age and older adults who live in neighbourhoods with higher street connectivity reported fewer depressive symptoms, whereas greater population density was associated with more depressive symptoms in this cohort. This is the first study to demonstrate significant disparities in depressive symptoms associated with exposure to commercial land use in disadvantaged and advantaged areas, characterised by low levels of NO2; however, total- and direct effects of commercial land use itself on depression were not observed. While our results indicate that people residing in disadvantaged areas can benefit from exposure to commercial land use if concentrations of NO2 are low, this is not the case for individuals from advantaged areas. This finding needs clarification.
Our study has a number of implications for policy. It is important to address mental health disparities in mid-age and older adults through policy, with disadvantaged neighbourhoods being a priority target for population-level health interventions. Further, policy responses should include careful planning and development of land use infrastructure, including guidance on the proportion of land devoted to commercial destinations and facilities in advantaged and disadvantaged neighbourhoods to support mental health of its residents. Moreover, our findings support calls for policies aimed at optimising neighbourhood residential density as well as street layout to mitigate the risk of depression in mid-age and older adults and this is particularly relevant in the context of urban densification. For example, one of the potential policy initiatives is to design pedestrian-friendly and walkable streets to suit older adults’ needs in order to increase their levels of physical activity, known to be protective against depressive symptoms (Bigarella et al. Citation2022). Other implications of the findings include the need for policy strategies to reduce concentrations of NO2 in Australia and globally as well as government initiatives to pursue low emission transport options in the cities to ensure air quality is within the recommended guidelines.
Depression is a global phenomenon and our findings provide important insights for policymakers and urban planners in Australia and other developed countries who can design age-friendly neighbourhoods that support and promote the mental health of its communities.Thus, future research with rigorous spatial measures and longitudinal designs to infer causality are needed to better understand and characterise neighbourhood-depression associations.
Supplemental Material
Download PDF (1.1 MB)Acknowledgements
The AusDiab study, initiated and coordinated by the International Diabetes Institute, and subsequently coordinated by the Baker Heart and Diabetes Institute, gratefully acknowledges the support and assistance given by: B Atkins, B Balkau, E Barr, A Cameron, S Chadban, M de Courten, D Dunstan, A Kavanagh, D Magliano, S Murray, N Owen, K Polkinghorne, T Welborn, P Zimmet and all the study participants. Also, for funding or logistical support, we are grateful to: National Health and Medical Research Council (NHMRC grants 233200 and 1007544), Australian Government Department of Health and Ageing, Abbott Australasia Pty Ltd., Alphapharm Pty Ltd., Amgen Australia, AstraZeneca, Bristol-Myers Squibb, City Health Centre-Diabetes Service-Canberra, Department of Health and Community Services—Northern Territory, Department of Health and Human Services—Tasmania, Department of Health—New South Wales, Department of Health—Western Australia, Department of Health—South Australia, Department of Human Services—Victoria, Diabetes Australia, Diabetes Australia Northern Territory, Eli Lilly Australia, Estate of the Late Edward Wilson, GlaxoSmithKline, Jack Brockhoff Foundation, Janssen-Cilag, Kidney Health Australia, Marian & FH Flack Trust, Menzies Research Institute, Merck Sharp & Dohme, Novartis Pharmaceuticals, Novo Nordisk Pharmaceuticals, Pfizer Pty Ltd., Pratt Foundation, Queensland Health, Roche Diagnostics Australia, Royal Prince Alfred Hospital, Sydney, Sanofi Aventis, sanofi-synthelabo, and the Victorian Government’s OIS Program.
Disclosure statement
No potential conflict of interest was reported by the author(s).
Data availability statement
Data that support the findings of this study are available on request.
Supplementary material
Supplemental data for this article can be accessed online at https://doi.org/10.1080/23748834.2024.2356408.
Additional information
Funding
Notes on contributors
Maria V. Soloveva
Maria V. Soloveva is a scientist with a background in cognitive and clinical neuropsychology. Her current research focuses on understanding environmental and psychosocial determinants of cognitive and mental health in non-clinical and clinical populations.
Muhammad Akram
Muhammad Akram is a research fellow and biostatistician. His research interests include applied statistical modelling, application of time-series analysis and forecasting, predictive and multilevel modelling in health sciences.
Anthony Barnett
Anthony Barnett is an associate professor with a background in exercise physiology. Current research interests include built environment and psycho-social influences on health-related outcomes across the age range.
Govinda Poudel
Govinda Poudel is an interdisciplinary researcher with background in computer systems engineering and neurosciences. His research focuses on novel magnetic resonance imaging (MRI) and electroencephalography (EEG) based techniques for understanding human brain in health and disease, including sleep health and neurodegeneration.
Jonathan E. Shaw
Jonathan Shaw is a professor with a background in the epidemiology of diabetes and he is a consultant physician in the diabetes services.
Erika Martino
Erika Martino is a research fellow in healthy housing. Her interests include Australian and global challenges associated with scaling affordable and healthy housing, through analysing partnership and policy frameworks.
Luke D. Knibbs
Luke Knibbs is an associate professor with a multidisciplinary background in atmospheric science, epidemiology and geographic information systems.
Ester Cerin
Ester Cerin is a psychologist and statistician. Her research interests focus on environmental and psychosocial determinants of lifestyle behaviours and health across the lifespan.
References
- Aiken, L.S. and West, S.G., 1991. Multiple regression: testing and interpreting interactions. Newbury Park, CA: Sage.
- Anenberg, S.C., et al., 2022. Long-term trends in urban NO2 concentrations and associated paediatric asthma incidence: estimates from global datasets. The lancet planetary health, 6 (1), e49–e58. doi:10.1016/S2542-5196(21)00255-2.
- Annerstedt, M., et al., 2012. Green qualities in the neighbourhood and mental health – results from a longitudinal cohort study in Southern Sweden. BMC public health, 12 (1), 337. doi:10.1186/1471-2458-12-337.
- Anstey, K. J., et al., 2015. Association of cognitive function with glucose tolerance and trajectories of glucose tolerance over 12 years in the AusDiab study. Alzheimer’s research & therapy, 7 (1), 48. doi:10.1186/s13195-015-0131-4.
- Astell-Burt, T. and Feng, X., 2019. Association of urban green space with mental health and general health among adults in Australia. JAMA network open, 2 (7). e198209-e198209. doi:10.1001/jamanetworkopen.2019.8209.
- Australian Bureau of Statistics (ABS), 2011. Census of population and housing: mesh block counts, 2011, cat. no. 2074. Canberra: Australian Bureau of Statistics.
- Barnett, A., et al., 2018. Relationships between the neighborhood environment and depression in older adults: a systematic review and meta-analysis. International psychogeriatrics, 30 (8), 1153–1176. doi:10.1017/S104161021700271X.
- Barnett, A., et al., 2020. Objective neighbourhood attributes as correlates of neighbourhood dissatisfaction and the mediating role of neighbourhood perceptions in older adults from culturally and physically diverse urban environments. Cities, 107. doi:10.1016/j.cities.2020.102879.
- Bigarella, L.G., et al., 2022. Exercise for depression and depressive symptoms in older adults: an umbrella review of systematic reviews and meta-analyses. Aging & mental health, 26 (8), 1503–1513. doi:10.1080/13607863.2021.1951660.
- Bonnell, L.N., et al., 2022. Urban-rural differences in mental and physical health among primary care patients with multiple chronic conditions: A secondary analysis from a randomized clinical trial. International journal of environmental research and public health, 19 (23). doi:10.3390/ijerph192315580.
- Cai, H., et al., 2023. Global prevalence of depression in older adults: A systematic review and meta-analysis of epidemiological surveys. Asian journal of psychiatry, 80, 1–9. doi:10.1016/j.ajp.2022.103417.
- Cao, Z., et al., 2023. Urbanites’ mental health undermined by air pollution. Nature sustainability, 6 (4), 470–478. doi:10.1038/s41893-022-01032-1.
- Cerin, E., 2019. Building the evidence for an ecological model of cognitive health. Health & place, 60, 102206. doi:10.1016/j.healthplace.2019.102206.
- Cerin, E., et al., and Council on, E. & Physical Activity - Older Adults working, g, 2017. The neighbourhood physical environment and active travel in older adults: a systematic review and meta-analysis. The international journal of behavioral nutrition and physical activity, 14 (1), 15. doi:10.1186/s12966-017-0471-5.
- Cerin, E., et al., 2021. From urban neighbourhood environments to cognitive health: a cross-sectional analysis of the role of physical activity and sedentary behaviours. BMC public health, 21 (1), 2320. doi:10.1186/s12889-021-12375-3.
- Cerin, E., et al., 2023. Do neighbourhood traffic-related air pollution and socio-economic status moderate the associations of the neighbourhood physical environment with cognitive function? Findings from the AusDiab study. Science of the total environment, 858, 160028. doi:10.1016/j.scitotenv.2022.160028.
- Chen, Y.R., et al., 2022. The association between street connectivity and depression among older Japanese adults: the JAGES longitudinal study. Scientific reports, 12 (1), 13533. doi:10.1038/s41598-022-17650-w.
- Cramm, J.M. and Nieboer, A.P., 2015. Social cohesion and belonging predict the well-being of community-dwelling older people. BMC geriatrics, 15 (1), 30. doi:10.1186/s12877-015-0027-y.
- Crossman, S. and Li, O., 2015. Surface hydrology polygons (National). Canberra: Geoscience Australia.
- Dunstan, D.W., et al., 2002. The Australian diabetes, obesity and lifestyle study (AusDiab) - methods and response rates. Diabetes research and clinical practice, 57 (2), 119–129. doi:10.1016/S0168-8227(02)00025-6.
- Engelniederhammer, A., Papastefanou, G., and Xiang, L., 2019. Crowding density in urban environment and its effects on emotional responding of pedestrians: Using wearable device technology with sensors capturing proximity and psychophysiological emotion responses while walking in the street. Journal of human behavior in the social environment, 29 (5), 630–646. doi:10.1080/10911359.2019.1579149.
- Ewald, B., Knibbs, L., and Marks, G., 2021. Opportunity to reduce paediatric asthma in New South Wales through nitrogen dioxide control. Australian and New Zealand journal of public health, 45 (4), 400–402. doi:10.1111/1753-6405.13111.
- Gascon, M., et al., 2018. Long-term exposure to residential green and blue spaces and anxiety and depression in adults: a cross-sectional study. Environmental research, 162, 231–239. doi:10.1016/j.envres.2018.01.012.
- Gifford, R., 2007. The consequences of living in high-rise buildings. Architectural science review, 50 (1), 2–17. doi:10.3763/asre.2007.5002.
- Gonzales-Inca, C., et al., 2022. Residential greenness and risks of depression: longitudinal associations with different greenness indicators and spatial scales in a Finnish population cohort. Health & place, 74, 102760. doi:10.1016/j.healthplace.2022.102760.
- Gruebner, O., et al., 2017. Cities and mental health. Deutsches Ärzteblatt international, 114 (8), 121–127. doi:10.3238/arztebl.2017.0121.
- Guo, Y., et al., 2020. Association of neighbourhood social and physical attributes with depression in older adults in Hong Kong: a multilevel analysis. Journal of epidemiology and community health, 74 (2), 120–129. doi:10.1136/jech-2019-212977.
- Honey-Roses, J. and Zapata, O., 2023. Green spaces with fewer people improve self-reported affective experience and mood. International journal of environmental research and public health, 20 (2), 1219. 20(2. doi:10.3390/ijerph20021219.
- Kenny, G.P., et al., 2017. Hyperthermia and cardiovascular strain during an extreme heat exposure in young versus older adults. Temperature (Austin), 4 (1), 79–88. doi:10.1080/23328940.2016.1230171.
- King, T.L., et al., 2015. Does the presence and mix of destinations influence walking and physical activity? International journal of behavioral nutrition and physical activity, 12 (1), 115. doi:10.1186/s12966-015-0279-0.
- Knibbs, L.D., et al., 2014. A national satellite-based land-use regression model for air pollution exposure assessment in Australia. Environmental research, 135, 204–211. doi:10.1016/j.envres.2014.09.011.
- Lee, S., et al., 2022. The association between tree canopy cover over streets and elderly pedestrian falls: a health disparity study in urban areas. Social science and medicine, 306, 115169. doi:10.1016/j.socscimed.2022.115169.
- Leslie, E. and Cerin, E., 2008. Are perceptions of the local environment related to neighbourhood satisfaction and mental health in adults? Preventive medicine, 47 (3), 273–278. doi:10.1016/j.ypmed.2008.01.014.
- Li, B., et al., 2022. Stress induced microglial activation contributes to depression. Pharmacological research, 179, 106145. doi:10.1016/j.phrs.2022.106145.
- Lin, C. and Wu, L., 2021. Green and blue space availability and self-rated health among seniors in China: Evidence from a National Survey. International journal of environmental research and public health, 18 (2), 545. doi:10.3390/ijerph18020545.
- Manaugh, K. and Kreider, T., 2013. What is mixed use? Presenting an interaction method for measuring land use mix. Journal of transport and land use, 6 (1), 63–72. doi:10.5198/jtlu.v6i1.291.
- Mohebbi, M., et al., and on behalf of the ASPREE Investigator Group, 2019. Prevalence of depressive symptoms and its associated factors among healthy community-dwelling older adults living in Australia and the United States. International journal of geriatric psychiatry, 34 (8), 1208–1216. doi:10.1002/gps.5119.
- Murrin, E., et al., 2023. Does physical activity mediate the associations between blue space and mental health? A cross-sectional study in Australia. BMC public health, 23 (1), 203. doi:10.1186/s12889-023-15101-3.
- Nguyen, L., et al., 2020. Where do people interact in high-rise apartment buildings? Exploring the influence of personal and neighborhood characteristics. International journal of environmental research and public health, 17 (13), 4619. 17(13. doi:10.3390/ijerph17134619.
- Patria, B., 2022. The longitudinal effects of education on depression: finding from the Indonesian national survey. Frontiers in public health, 10, 1–7. doi:10.3389/fpubh.2022.1017995.
- Pearce, J., et al., 2018. Life course of place: A longitudinal study of mental health and place. Transactions of the institute of British geographers, 43 (4), 555–572. doi:10.1111/tran.12246.
- PSMA Australia Limited, 2012. PSMA street network. PSMA Australia Limited.
- Qiu, X., et al., 2023. Association of long-term exposure to air pollution with late-life depression in older adults in the US. JAMA network open, 6 (2), e2253668. doi:10.1001/jamanetworkopen.2022.53668.
- Radloff, L.S., 1977. The CES-D scale: A self-report depression scale for research in the general population. Applied psychological measurement, 1 (3), 385–401. doi:10.1177/014662167700100306.
- Reid, C.E., et al., 2017. Is all urban green space the same? A comparison of the health benefits of trees and grass in New York City. International journal of environmental research and public health, 14 (11), 1411. doi:10.3390/ijerph14111411.
- Saarloos, D., et al., 2011. The built environment and depression in later life: The health in men study. The American journal of geriatric psychiatry, 19 (5), 461–470. doi:10.1097/JGP.0b013e3181e9b9bf.
- Saelens, B.E., Sallis, J.F., and Frank, L.D., 2003. Environmental correlates of walking and cycling: Findings from the transportation, urban design, and planning literatures. Annals of behavioral medicine, 25 (2), 80–91. doi:10.1207/S15324796ABM2502_03.
- Schlax, J., et al., 2019. Income and education predict elevated depressive symptoms in the general population: results from the Gutenberg health study. BMC public health, 19 (1), 430. doi:10.1186/s12889-019-6730-4.
- Sharifi, A., 2019. Resilient urban forms: a review of literature on streets and street networks. Building and environment, 147, 171–187. doi:10.1016/j.buildenv.2018.09.040.
- Sheather S., 2009. A modern approach to regression with R. New York, NY: Springer.
- Soloveva, M.V., et al., 2023. Characteristics of urban neighbourhood environments and cognitive age in mid-age and older adults. Health & place, 83, 1–8. doi:10.1016/j.healthplace.2023.103077.
- Strak, M., et al., 2021. Long term exposure to low level air pollution and mortality in eight European cohorts within the ELAPSE project: pooled analysis. BMJ: British medical journal, 374, 1–11. doi:10.1136/bmj.n1904.
- Sundquist, K., Frank, G., and Sundquist, J., 2004. Urbanisation and incidence of psychosis and depression: follow-up study of 4.4 million women and men in Sweden. British journal of psychiatry, 184 (4), 293–298. doi:10.1192/bjp.184.4.293.
- Van Buuren, S. and Groothuis-Oudshoorn, K., 2011. mice: Multivariate imputation by chained equations in R. Journal of statistical software, 45 (3), 1–67. doi:10.18637/jss.v045.i03.
- Vigo, D., Thornicroft, G., and Atun, R., 2016. Estimating the true global burden of mental illness. The lancet psychiatry, 3 (2), 171–178. doi:10.1016/S2215-0366(15)00505-2.
- Wood, S. N., 2017. Generalised additive models: an introduction with R. 2nd ed. Boca Raton, FL: Chapman & Hall/CRC.
- World Health Organisation, 2021. Ambient (outdoor) air pollution. Available from: https://www.who.int/news-room/fact-sheets/detail/ambient-(outdoor)-air-quality-and-health (Accessed 3 April 2024).
- World Health Organisation, 2023. Mental health of older adults. Available from: https://www.who.int/news-room/fact-sheets/detail/mental-health-of-older-adults (Accessed 18 March 2024).
- Yang, C., et al., 2022. Association of NO(2) with daily hospital admissions for mental disorders: Investigation of the modification effects of green spaces and long-term NO(2) exposure. Journal of psychiatric research, 156, 698–704. doi:10.1016/j.jpsychires.2022.11.014.
- Yue, Y., Yang, D., and Van Dyck, D., 2022. Urban greenspace and mental health in Chinese older adults: associations across different greenspace measures and mediating effects of environmental perceptions. Health & place, 76, 102856. doi:10.1016/j.healthplace.2022.102856.
- Zhang, R., et al., 2022. The relationship between built environment and mental health of older adults: mediating effects of perceptions of community cohesion and community safety and the moderating effect of income. Frontiers in public health, 10, 881169. doi:10.3389/fpubh.2022.881169.
- Zhang, C.J.P., et al., 2018. Cross-sectional associations of objectively assessed neighbourhood attributes with depressive symptoms in older adults of an ultra-dense urban environment: the Hong Kong ALECS study. BMJ open, 8 (3), e020480. doi:10.1136/bmjopen-2017-020480.
- Zhang, X., Miller-Hooks, E., and Denn, K., 2015. Assessing the role of network topology in transportation network resilience. Journal of transport geography, 46, 35–45. doi:10.1016/j.jtrangeo.2015.05.006.