
ABSTRACT
Purpose
The Norwegian football app FotMob (https://www.fotmob.com/) has recently introduced a new and novel composite performance variable or index. The present study examines how this composite performance index is associated with football players’ market values as defined by the Norwegian website FotMob and by the German website Transfermarkt.
Methods
Using data on the players in the Norwegian top-tier league for the 2022 season, FotMob’s performance index’ effect on FotMob’s and Transfermarkt’s market values is estimated by team-fixed effects regression models also controlling for several key independent variables typically used in prior and best-case regression models.
Results
FotMob’s composite performance index has a statistically and practically significant effect on football players’ market values. Yet the magnitude of this index’ effect is contingent on other key independent variables’ effects (i.e. interaction effects). Not adjusting for the index also overestimate other key independent variables’ effects on football players’ market values.
Contributions and implications
Showing how a new and novel composite performance variable or index is associated with football players’ market values, this study contributes to the literature on monetary valuation in football. The study’s results generally suggest that composite performance indexes deserve to play a larger role in future football valuation research than they have done in the past.
Introduction
Professional football players are throughout the world valued according to their varying performances on the pitch. From this routine observation it follows by necessity that some players are worth more than others. Originating with the work of Scully (Citation1974) for baseball, there is a long line of studies seeking to gauge how a set of performance variables affects the valuation or payment of football players.Footnote1 Typically, such performance variables have been easy-to-quantify variables such as minutes on the pitch or number of goals scored in the last season (e.g. Bryson et al., Citation2013; Franck & Nüesch, Citation2012; Frick, Citation2007, Citation2011; Kuethe & Motamed, Citation2010; Lehmann & Schulze, Citation2008; Lucifora & Simmons, Citation2003). Furthermore, some studies have utilized subjective measures of performance in addition to objective measures, often in the form of player rating variables (e.g. Della Torre et al., Citation2018; Deutscher & Büschermann, Citation2016; Garcia-del-Barrio & Pujol, Citation2004; Thrane, Citation2019). A third and recent type of performance variable is of the composite kind: indexes based on the various actions carried out by the players while being on the pitch (e.g. McHale & Holmes, Citation2023; Scarfe et al., Citation2023).
Many studies examine how a large set of independent variables explain variation in football players’ wages or transfer fees. In this regard, the market values provided by the German website Transfermarkt typically serve as proxies for the most-often undisclosed wages, or for the transfer fees that only sometimes are disclosed but only if such a transfer takes place (Franceschi et al., Citation2023a). Following convention, thus, the present study relates a composite performance variable or index to market values in the Transfermarktian sense of the term.Footnote2
Many factors determine football players’ market values, as summarized by Franceschi et al. (Citation2023a). In this study, we examine one such new and novel factor: the composite performance variable or index used by FotMob, which is based on more than 300 individual statistics per match. Such fine-grained player metrics variables have only very recently been tested in the literature (e.g. Coates & Parshakov, Citation2022; McHale & Holmes, Citation2023; Rubio Martín et al., Citation2022; Scarfe et al., Citation2023), but it remains to be established whether these variables deserve a place in regression models explaining football players’ market values. The present study therefore asks a rather straightforward question: Does FotMob’s composite performance index add to the statistical explanation of variation in football players’ market values net of the independent variables most often used in previous and best-case regression models?
Previous research and purpose of study
Any study claiming that variable x from now on should be considered a key factor in the explanation of variation in football players’ market values must succeed in one respect: It must add something of value to existing and best-case regression models. This might imply that the suggested model including the new x explains more of the variation in market values than extant models. Or it could imply that the x in question has a statistically and practically significant effect on market values net of the independent variables constituting what might be dubbed as a core model. After Franceschi et al.’s (Citation2023a) review of 29 player valuation studies in football, one might argue that such a core model include nine key independent variables: (1) minutes or matches played in the last season,Footnote3 (2) number of goals scored in the last season, (3) number of assists made in the last season, (4) number of yellow cards in the last season, (5) number of red cards in the last season, (6) footedness (right, left, or both), (7) national team status (yes or no), (8) total number of matches in career, and (9) age.Footnote4 To prove its worth, thus, any new composite performance index or x should affect the market values of football players significantly while controlling for (at least) these nine independent variables. This statistical task is, in a manner of speaking, the first hurdle to be passed by any such study aiming to make its mark.
The nine key variables identified by Franceschi et al. (Citation2023a) have, collectively, proved to be important predictors of football players’ market values.Footnote5 Yet this does not mean that each one has been vital in every prior application. On the contrary, the authors concluded that “ … the variables studied here in a systematic way could be considered to have mixed results.” (Citation2023a, p. 14). When concluding and clearing the path for future player valuation models, the authors therefore suggested a more parsimonious version of the core model using only the variables minutes (or matches) played in the last season, number of goals scored in the last season, number of assists made in the last season, national team status, and age along with age-squared.Footnote6
Other possibly relevant independent variables tend to fall into four groups: Other performance variables (e.g. titles won, player ratings, player metrics), other player characteristics (e.g. height, position, nationality, experience), employer/club characteristics (e.g. club rating, club economy, contract length), and media exposure (e.g. press citations, Google hits). In addition to the above-mentioned studies, some examples include Pedace (Citation2008), Garcia-del-Barrio & Pujol, Citation2020, Herberger and Wedlich (Citation2015), Herm et al. (Citation2014), Kahane (Citation2001), Medcalfe (Citation2008), Müller et al. (Citation2017), Poli et al. (Citation2022), and Sæbø and Hvattum (Citation2015). It is an empirical matter whether a regression model containing these other independent variables explains more of the variation in market values than the core model or its more parsimonious or down-scaled version. To the extent that it does, any composite performance index should also affect the market values significantly net of these other variables to prove its worth. This is the second hurdle any study aiming to make its mark must pass.
The third and final hurdle concerns the quality and economy of the clubs. It is an obvious fact that better clubs are better because they have better-performing and (thus) better-compensated players at their disposal. Under these circumstances, the only valid way of identifying the effect of individual player performances on market values is by means of a team-fixed effects regression model (Franceschi et al., Citation2023a; Parsons & Rohde, Citation2015).
The empirical part of the study starts by establishing that the composite performance index used by FotMob is positively associated with market values. The study then proceeds by adding the variables mentioned above as control variables in a series of multiple regressions. Finally, the performance index’ predictive validity is examined by associating it to a variable that may be considered as the result of many performances on the pitch. Before this, however, the next section provides the context, the data, and the descriptive statistics.
Context, data, and descriptive statistics
Context and data
The context for this study is the Norwegian top-tier league in football presently called Eliteserien. Eliteserien consists of 16 teams playing against each other during the season that lasts from April or May to November. Since all teams meet up twice (i.e. home and away), there are 240 matches spread across 30 rounds each season. The analyses below refer to all players taking part in the 2022 season.Footnote7 The data were collected from Transfermarkt (https://www.transfermarkt.com/), the Norwegian football app called FotMob (https://www.fotmob.com/), and several Norwegian football websites during February and March 2023. The variable information refers to the numbers registered on these websites on December 31, 2022.
The key explanatory variable in the study is FotMob’s composite performance index. This index is based on more than 300 individual statistics per player per match from Opta (cf. https://www.statsperform.com/opta-analytics/). Some examples of these Opta stats are the success rate of a player’s maneuvers, aerial battles won, number of successful connections with the ball, number of fouls committed, number of times being fouled, successful passes, and wrongful passes to players on the opposing team (Rubio Martín et al., Citation2022; Scarfe et al., Citation2023).Footnote8 FotMob’s composite performance index is the average Opta score for the matches a player was on the pitch. Yet the data include only players with minimum five appearances and 300 min of playing time in the season.Footnote9 After these restrictions, we have complete information on 310 players.
To increase the robustness of the results, we study the association between the performance index and two variants of market values: those of FotMob and those of Transfermarkt. Of these, the website Transfermarkt is presently the go-to place for market values in football. These values are set by the members of the Transfermarkt community and may, to simplify, be thought of as the average of the members’ market value proposals. That is, Transfermarkt applies the principle known as the wisdom of the crowds (Herm et al., Citation2014; Leifheit & Follert, Citation2023; Peeters, Citation2018; Prockl & Frick, Citation2018). Using the Transfermarkt market values as a dependent variable warrants a certain amount of caution, however. For example, Coates and Parshakov (Citation2022) found that Transfermarkt market values underestimated actual transfer fees and therefore warned against using these as proxies for transfer fees or wages. Before that, Thrane (Citation2019) made a similar caution.Footnote10 At the end of the day, however, we have no choice but to follow the standard practice of using Transfermarkt’s market values as a dependent variable in our study.Footnote11 The market values set by FotMob, in contrast, are determined by a proprietary algorithm yet to be disclosed.
Descriptive statistics
presents descriptive statistics for the study’s main variables. The dependent variables – i.e. the market values according to FotMob and Transfermarkt, respectively – are similar in terms of means (NOK 596,000 and 603,000), standard deviations (NOK 755,000 and 794,000), and extreme values. They are as expected also highly correlated, with a Pearson correlation of 0.94 (not shown). NOK 600,000 was roughly the equivalent of EUR 60,000 throughout 2022. FotMob’s composite performance index has a theoretical range from 0 to 10. Yet the empirical range for the season average is between roughly 5.9 and roughly 8.2, with a season average of 6.9 (SD = 0.38).
Table 1. Descriptive statistics for key variables. N = 310.
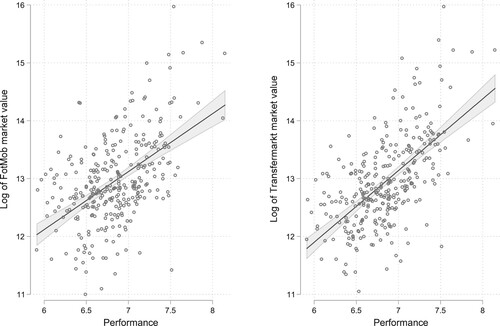
shows the association between the performance index and the log of market values in two scatterplots.Footnote12 To provide readers with an indication of the precision of the regression estimates, the plots also include the 95% confidence intervals (CIs). The two graphs largely speak for themselves: There is a strong and positive bivariate association between player performance and players’ market values.Footnote13
Figure 1. Market value by player performance, with 95% CIs for regression lines. The FotMob market values are on the left-hand side; the Transfermarkt market values are on the right-hand side.
Multiple regression results
Main results 1: the effects of the composite performance index
Model NO in presents the OLS regressions yielding the results shown in . In accordance with the scatterplots and the regression lines, we see that the performance index has a larger effect on the Transfermarkt market value (1.24) than it has on the FotMob market value (1.00). Also, we note the better fit of the Transfermarkt model (R2 = 37.22 versus R2 = 26.05). Yet both coefficients are significant in a statistically and practically important way: A football player with an average score of 7.5 on the performance index has a 246% higher Transfermarkt market value than a player with an average score of 6.5.Footnote14 The similar result for the FotMob market value is 176% higher.
Table 2. Market values (logged) by player performance. OLS regression models. N = 310.
Model A controls for the nine independent variables used in many previous studies; see Franceschi et al. (Citation2023a) and the section on prior research above: minutes played in the last season, number of goals in the last season, number of assists in the last season, number of yellow cards in the last season, number of red cards in the last season, footedness, national team status, total number of matches in career, and age. (Age-squared is also included in the model, as typically recommended.) The performance coefficient drops to 0.63 for the FotMob market value – or about 40% in size. The similar drop for the Transfermarkt market value is about 20% – to 0.96. As expected, the model fit increases substantially for both models, but it continues to be better for the Transfermarkt variable (R2 = 63.89 versus R2 = 40.75; adj. R2 = 62.55 versus adj. R2 = 38.57).
Model B discards the independent variables considered possibly superfluous by Franceschi et al. (Citation2023a) from Model A: number of yellow cards in the last season, number of red cards in the last season, footedness, and total number of matches in career. The performance coefficients now increase in size (to 0.70 for FotMob and to 1.04 for Transfermarkt), and the models’ fit unsurprisingly decreases. The variable mainly responsible for the decrease in model fit and the increase in the performance coefficients is the total number of matches in career, which had strong positive effects in Model A. Model C adds the potentially relevant variables on Franceschi et al.’s (Citation2023a) list to Model A: player position, nationality, year of contract signing, year of contract termination, number of matches in European cups, number of wins in the Norwegian top-tier series or cups, and total number of previous clubs. This causes both performance coefficients to drop further in magnitude: to 0.53 for FotMob and to 0.85 for Transfermarkt.Footnote15 Finally, Model Ds – the team fixed effects model – suggests that the performance coefficient for the FotMob market value is 0.35, whereas the similar coefficient for the Transfermarkt market value is 0.66. Model D thus suggests that a player with an average score of 7.5 on the performance index has a 42% higher FotMob market value than a player with an average score of 6.5, ceteris paribus. For the Transfermarkt market value, this difference is 93%. Both coefficients continue to be both statistically and practically significant. The Transfermarkt model also continues to have the best overall fit, with an R2/adj. R2 of 77.13/73.33.
We also estimated Models NO and D in by means of four median regressions. The regression coefficients were 0.82 and 0.39 (FotMob; NO and D, respectively) and 1.07 and 0.52 (Transfermarkt; NO and D, respectively). Also, these coefficients were consistent in size throughout the distribution for the market values. All in all, these results paint the picture of a robust finding for the performance coefficient. The results are available on request.
The growing use of many detailed player statistics as independent variables is a very recent tendency in valuation models (Coates & Parshakov, Citation2022; McHale & Holmes, Citation2023; Rubio Martín et al., Citation2022; Scarfe et al., Citation2023). Franceschi et al. (Citation2023a) are for commendable reasons concerned about multicollinearity in this regard – or with the less severe problem of obtaining significant effects due to very high correlations between such measures. Against this background, the most comprehensive model of this study (D) was examined with respect to multicollinearity. Excluding the variable age-squared, the mean VIF-score for this model was 2.73. This number is way below any threshold suggesting that multicollinearity might be problematic. Also, high correlations between independent variables might explain how key independent variables fail to reach statistical significance, but this was not at all an issue in this study.
Although the effects of the control variables are of lesser importance in this study, it might be relevant to comment these in passing. We do so for the best-fitting Transfermarkt D model in ; cf. Model i in in the Appendix: Age has a positive coefficient (0.20; p < 0.01), and age2 has a negative coefficient (−0.006: p < 0.01). This implies the inverted-U pattern between age and market values shown in dozens of prior studies. The remaining control variables with significant effects at p < 0.07 or less are minutes played (positive), number of goals scored (positive), total number of matches in career (positive), player position (wingers and strikers have the highest market values), year of contract termination (2022 endings have the highest market values), number of matches in European cups (positive), total number of previous clubs (negative), and some of the club dummies. By and large, these results agree with prior research.
Model ii in shows the similar regression results without the composite performance index. The combined results of Models i and ii suggest that the effects of minutes played and goal scoring on market values might be exaggerated, as in overestimated, when not adjusting for the performance index. For example, the goal scoring effect is almost twice as large when not controlled for the performance index: 0.064 versus 0.039. Not taking the performance index into account also leads to other qualitative conclusions for market value differences between the player positions.
Main results 2: interaction effects
We also examined interaction effects between the performance index and the independent variables in Model D in . Four significant effects were found at p < 0.05: between the performance index and (1) total number of matches in career, (2) total number of previous clubs, (3) player position, and (4) contract signing. presents the interaction effect of the performance index and the total number of matches in career on the Transfermarkt market value. (The interaction effect on the FotMob market value is very similar and thus not shown.)
Figure 2. Market value by player performance for three levels of player experience.
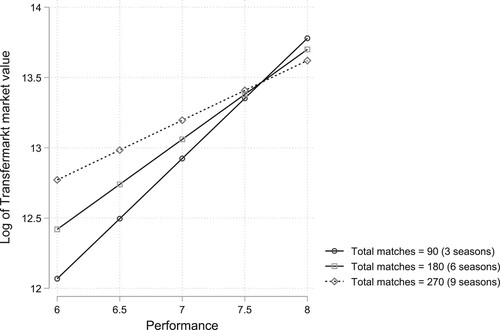
shows that performance has a larger effect on market values for less experienced players (i.e. total matches in career = 90, as in three seasons) than it has for more experienced players (i.e. total matches in career = 180 or 270, as in six or nine seasons).Footnote16 A similar effect was found for the interaction between the performance index and total number of previous clubs (i.e. fewer clubs = a larger effect).
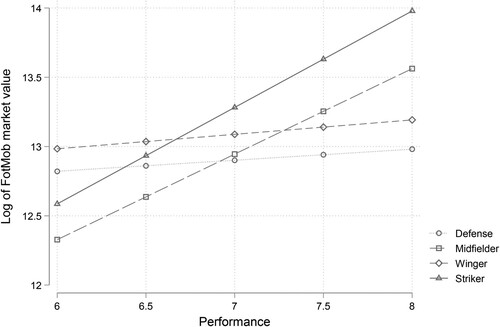
visualizes the interaction effect of the performance index and player position on the FotMob market value. (The interaction effect on the Transfermarkt market value is very similar and thus not shown.) The figure shows that player performance has a larger effect on market values for midfielders and strikers than it has for defensive players and wingers.
Figure 3. Market value by player performance for four player positions.
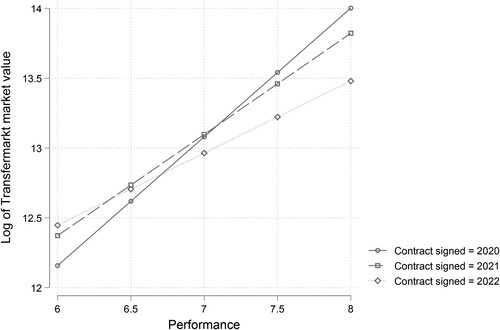
Finally, shows that player performance has the largest effect on market values for contracts that were signed in 2020 or earlier. (The interaction effect on the FotMob market value is very similar and thus not shown.)
Figure 4. Market value by player performance for three different years of contract signing.
Supplemental results: predictive validation analysis
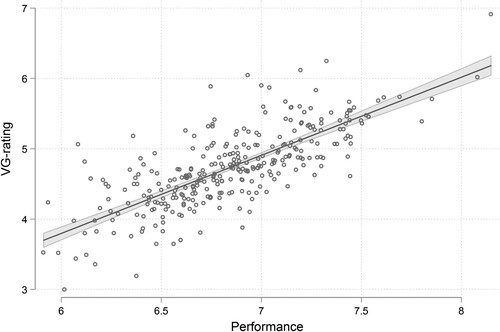
To test the predictive validity of FotMob’s performance index in an indirect fashion, we used it to predict a variable that might be thought of as the result of the performances on the pitch: the average season performance rating provided by the journalists in the newspaper VG. This subjective rating variable is scaled between 1 and 10 for a given match and between 3.00 and 6.79 for the season averages in the data. The results appear in , where the regression coefficient for the performance variable is 1.11 (R2 = 58.48). suggests that FotMob’s performance index has ample explanatory power concerning the subjective rating variable in question. As such, it appears to have satisfactory predictive validity. also hints at the rating variable’s possible endogeneity (cf. Scarfe et al., Citation2023), a point to which we return in the discussion section.
Figure 5. Average season player rating according to the journalists in VG by average player performance, with 95% CI for regression line.
Summary, discussion, and conclusion
Summary
The football economics literature is rampant with studies aiming to show how a set of player performance variables explain variation in payments (wages) and prices (transfer fees). But since wages are seldom disclosed and the agreed-upon transfer fees are typically undisclosed or observed only for some of the sales, researchers often use market values as proxies for payments or prices. In keeping with this tradition, the point of departure for the present study was the following question: Does FotMob’s composite performance variable or index add to the explanation of variation in football players’ market values net of the independent variables typically used in previous and best-case regression models? The short answer to this question is yes. The longer one is that while controlling for an extensive list of independent variables used in prior player valuation research in football (Franceschi et al., Citation2023a), the study found that FotMob’s composite performance index contributed with unique, or ceteris paribus, explanatory power regarding the market values provided by FotMob and Transfermarkt. That said, the relatively small dataset used (N = 310) requires some caution. For this reason, future research from other top-tier football leagues, such as the Big Five (i.e. England, Germany, Spain, Italy, and France), is needed before we can verify this conclusion more firmly.
The study also showed that FotMob’s composite performance index’ effect on market values was contingent on other independent variables typically used in player valuation models. In particular, the performance effect on market values was strongest for less experienced players (in terms of matches played or number of previous clubs), midfielders and strikers as opposed to defensive players and wingers, and for players with contracts signed in 2020 or earlier rather than in later years. These conditional associations seem worthwhile to follow up in future research – in much the same manner as interaction effects in sports valuation models more generally appears to be an under-researched topic. As to the traditional independent variables’ effects of on football players’ market values, the results were mostly in keeping with prior studies. Finally, the study also showed that certain independent variables’ effects on players’ market values might be exaggerated when not adjusted for the composite performance index.
Discussion and conclusion
When a study claims that a new x from now on should be considered as a vital factor in the explanation of variation in y, a crucial question becomes: What control variables does the study use? In this regard, a possible objection to this study’s findings might be that it does not control for variables measuring media coverage or social media (SoMe) exposure, which recently have contributed with significant effects in player valuation models (e.g. Müller et al., Citation2017; Rubio Martín et al., Citation2022). However, such a potential objection carries little force in our opinion. The reason for omitting such variables from our study is that they, in the harsh words of Angrist and Pischke (Citation2009), are “bad controls.” That is, these variables are in the main consequences of (objective) player performances rather than antecedents of it. As such, the media or SoMe variables do not belong in a regression model with the aim of identifying the direct or unbiased effect of (objective) performance on market values.
The same kind of reasoning applies to the use of subjective player ratings. This explains why our study did not use such variables as controls. In fact, we may think of in the study as an example of subjective rating variables’ possible endogeneity in general (cf. Scarfe et al., Citation2023). That said, both subjective rating variables and media/SoMe variables might deserve a place in regression models with the aim of maximizing the explained variance (R2) of market values. In contrast, if the aim of a study is to identify the direct effects subjective rating variables or media/SoMe variables on market values, all prior (objective) performance variables belong in this regression as possibly confounding control variables.
The results of this study suggest that composite performance variables or indexes have a promising future in studies of football players’ valuation or payment for three main reasons. First, our study showed that such an index contributed with ample explanatory concerning football players’ market values. Second, the study also showed that the magnitude of the performance index’ effect was contingent on some of the other key independent variables’ effects. Or, to put it the other way around: that some key independent variables have effect sizes on market values that are contingent on performance. Third, the study showed how certain key independent variables used in prior research – i.e. number of minutes played and number of goals scored in the season – most likely had too large effects on market values when performance was not accounted for. A related logic applied to the effect of player position: The regression model gave qualitatively different results for the positional differences in market values when the performance index was not included. Results such as these might also come up in other valuation or payment settings where one compares, say, male and female players or players of different ethnicities or races.
In conclusion, based on data on the players in the 2022 season of the top-tier Norwegian football league, multiple OLS regressions including fixed-effects for teams were used to estimate the effect of FotMob’s composite performance index on players’ market values. Net of the effects of the key independent variables used in prior and best-case regression models, the study showed that the ceteris paribus effect in question was practically and statistically significant. This result, if it continues to hold up in future research, suggests that composite performance variables bring something new and valuable to the table for best-practice studies. As for practical implications, these composite variables at a minimum provide practitioners with a quick-and-dirty way of measuring player performance, and of associating such performance and monetary returns in the form of wages and transfer fees in football. In terms of scholarly or econometric implications, the study’s results suggests that composite performance variables should be considered as close to mandatory control variables in regression models explaining monetary valuations in sports.
Acknowledgements
Thanks to Amund Lillejordet and Espen Kletthagen Stensby for the permission to analyze the data they compiled in February and March 2023. Thanks also to two anonymous reviewers for many constructive comments on earlier drafts of the paper. The usual disclaimer applies.
Disclosure statement
No potential conflict of interest was reported by the author(s).
Notes
1 A review of this research is beyond the scope of this study. It is also redundant in the sense that Franceschi et al. (Citation2023a) provided a thorough review. The term football rather than soccer is used throughout the paper.
2 For more on the conceptual approaches to the valuation of football players, see Franceschi et al. (Citation2023b) or Poli et al. (Citation2022). According to Franceschi et al. (Citation2023a), market values (by Transfermarkt) and transfer fees are highly correlated, whereas the correlation between such market values and wages is undecided. For example, Frick (Citation2003) found a correlation of 0.80 in this regard for the German Bundesliga, Prockl and Frick (Citation2018) found a correlation of 0.70 for the U.S. Major Soccer League, and Thrane (Citation2019) found a correlation of 0.63 for the Norwegian Eliteserien.
3 Having both minutes and matches among the independent variables in a regression model most likely leads to multicollinearity. In the data to be analyzed in this study, these two variables have a (Pearson) correlation of 0.85. Most analysts would likely call this troublesome.
4 The reader is referred to Franceschi et al. (Citation2023a) for the references to the 29 studies on which they base their core player valuation model.
5 These variables generally subsume the variables found by Rodríguez et al. (Citation2018) in an earlier and more restricted review: (1) performance, (2) national team participation, and (3) age.
6 The Mincer equation captures the core human capital model of the performance-pay relationship in labor economics more generally, i.e. the log of wage by years of education, age, and age-squared. In the football setting, the analogous core model might in the future be named the Franceschi equation (see also Simmons, Citation2022).
7 Since the study focuses on performances such as goal scoring and assisting, the goalkeepers were discarded from the data.
8 See https://www.fotmob.com/faq: “A match in the per match ratings is any match the participant has been involved in even if he came on as a substitute in the last few minutes. A player must have played at least 50% of all matches and at least 90 min (for the per 90 stats) to be included in the rankings.”
9 We set the bar low for inclusion in the sample to avoid (any possible) sample selection.
10 See also Campa (Citation2022) for a related argument.
12 Expressing the market value in logs rather than in its original scale is standard approach in the literature because this most often yields better model fit. This was also the case in the present study.
13 The two (Pearson) correlation coefficients are 0.51 (FotMob) and 0.61 (Transfermarkt). The correlation coefficient between the two logged versions of the market value variables is 0.83.
14 The formula by Halvorsen and Palmquist (Citation1980) is used to get this percentage: (100 × (eb – 1)), i.e. 100 × 2.718281.24–1 = 2.455.
15 The drop in size for the performance coefficients (from Model A to Model C) is mainly brought about by the inclusion of the variable number of matches in European cups.
16 The mean of total matches in career is 181.81 matches (SD = 109.25; min = 10, max = 584). About 21% of the players has played less than 90 matches, and about 22% of them has played more than 270 matches.
References
- Angrist, J. D., & Pischke, J. S. (2009). Mostly harmless econometrics. Princeton University Press.
- Bryson, A., Frick, B., & Simmons, R. (2013). The returns to scarce talent: Footedness and player remuneration in European football. Journal of Sports Economics, 14(6), 606–628. https://doi.org/10.1177/1527002511435118
- Campa, D. (2022). Exploring the market of soccer player registrations: An empirical analysis of the difference between transfer fees and estimated players’ inherent value. Journal of Sports Economics, 23(4), 379–406. https://doi.org/10.1177/15270025211059527
- Coates, D., & Parshakov, P. (2022). The wisdom of crowds and transfer market values. European Journal of Operational Research, 301(2), 523–534. https://doi.org/10.1016/j.ejor.2021.10.046
- Della Torre, E., Giangreco, A., Legeais, W., & Vakkayil, J. (2018). Do Italians really do it better? Evidence of migrant pay disparities in the top Italian football league. European Management Review, 15(1), 121–136. https://doi.org/10.1111/emre.12136
- Deutscher, C., & Büschermann, A. (2016). Does performance consistence pay off financially for players? Evidence from the Bundesliga. Journal of Sports Economics, 17(1), 27–43. https://doi.org/10.1177/1527002514521428
- Franceschi, M., Brocard, J.-F., Follert, F., & Gouguet, J.-J. (2023a). Determinants of football players’ valuation: A systematic review. Journal of Economic Surveys. https://doi.org/10.1111/joes.12552
- Franceschi, M., Brocard, J.-F., Follert, F., & Gouguet, J.-J. (2023b). Football players in light of economic value theory: Critical review and conceptualisation. Managerial and Decision Economics. https://doi.org/10.1002/mde.4039
- Franck, E., & Nüesch, S. (2012). Talen and/or popularity: What does it take to be a superstar? Economic Inquiry, 50(1), 202–216. https://doi.org/10.1111/j.1465-7295.2010.00360.x
- Frick, B. (2003). Contest theory and sport. Oxford Review of Economic Policy, 19(4), 512–529. https://doi.org/10.1093/oxrep/19.4.512
- Frick, B. (2007). The football players’ labor market: Empirical evidence from the major European leagues. Scottish Journal of Political Economy, 54(3), 422–446. https://doi.org/10.1111/j.1467-9485.2007.00423.x
- Frick, B. (2011). Performance, salaries, and contract length: Empirical evidence from German football. International Journal of Sport Finance, 6, 87–118.
- Garcia-del-Barrio, P., & Pujol, F. (2004). Pay and performance in the Spanish football league: Who gets the expected monopsony rents? Working paper #5/04. Universidad de Navarra.
- Garcia-del-Barrio, P., & Pujol, F. (2020). Recruiting talent in a global sports market: Appraisals of football players’ transfer fees. Managerial Finance, 47(6), 789–811. https://doi.org/10.1108/MF-04-2020-0213
- Halvorsen, R., & Palmquist, R. (1980). The interpretation of dummy variables in semilogarithmic equations. American Economic Review, 70, 474–475.
- Herberger, T. A., & Wedlich, F. (2015). Does selection bias matter in football players’ valuation? A crowdsourced valuation approach on players’ athletic characteristics. Journal of Global Sport Management, 2(3), 196–214. https://doi.org/10.1080/24704067.2017.1350593
- Herm, S., Callsen-Bracker, H.-M., & Kreis, H. (2014). When the crowd evaluates football players’ market values: Accuracy and evaluation attributes of an online community. Sport Management Review, 17(4), 484–492. https://doi.org/10.1016/j.smr.2013.12.006
- Kahane, L. H. (2001). Team and player effects on NHL player salaries: A hierarchical linear model approach. Applied Economics Letters, 8(9), 629–632. https://doi.org/10.1080/13504850010028607
- Kuethe, T. H., & Motamed, M. (2010). Returns to stardom: Evidence from U.S. major league football. Journal of Sports Economics, 11(5), 567–579. https://doi.org/10.1177/1527002509354268
- Lehmann, E. E., & Schulze, G. G. (2008). What does it take to be a star? The role of performance and the media for German football players. Applied Economics Quarterly, 54(1), 59–70. https://doi.org/10.3790/aeq.54.1.59
- Leifheit, N., & Follert, F. (2023). Financial player valuation from the perspective of the club: The case of football. Managing Sport and Leisure, 28(6), 618–637. https://doi.org/10.1080/23750472.2021.1944821
- Lucifora, C., & Simmons, R. (2003). Superstar effects in sport. Evidence from Italian Football. Journal of Sports Economics, 4, 35–55.
- McHale, I. G., & Holmes, B. (2023). Estimating transfer fees of professional footballers using advanced performance metrics and machine learning. European Journal of Operational Research, 306(1), 389–399. https://doi.org/10.1016/j.ejor.2022.06.033
- Medcalfe, S. (2008). English lague transfer prices: Is there a racial dimension? A re-examination with new data. Applied Economics Letters, 15(11), 865–867. https://doi.org/10.1080/13504850600949178
- Müller, O., Simons, A., & Weinman, M. (2017). Beyond crowd judgments: Data-driven estimation of market value in association football. European Journal of Operational Research, 263(2), 611–624. https://doi.org/10.1016/j.ejor.2017.05.005
- Parsons, S., & Rohde, N. (2015). The hot hand fallacy re-examined: New evidence from the English Premier League. Applied Economics, 47(4), 346–357. https://doi.org/10.1080/00036846.2014.969830
- Pedace, R. (2008). Earnings, performance, and nationality discrimination in a highly competitive labor market. An analysis of the English professional football league. Journal of Sports Economics, 9(2), 115–140. https://doi.org/10.1177/1527002507301422
- Peeters, T. (2018). Testing the wisdom of crowds in the field: Transfermarkt valuations and international soccer results. International Journal of Forecasting, 34(1), 17–29. https://doi.org/10.1016/j.ijforecast.2017.08.002
- Poli, R., Besson, R., & Ravenel, L. (2022). Econometric approach to assessing the transfer fees and values of professional football players. Economies, 10(1), 4. https://doi.org/10.3390/economies10010004
- Prockl, F., & Frick, B. (2018). Information precision in online communities: Player valuations on www.Transfermarkt.De. International Journal of Sport Finance, 13, 319–335.
- Rodríguez, M. S., Hassan, A. R., & Coad, A. (2018). Uncovering value drivers of high performance football players. Journal of Sports Economics, 20(6), 819–849. https://doi.org/10.1177/1527002518808344
- Rubio Martín, G., García, C. M. M., López, ÁR, & González Sánchez, F. J. (2022). Measuring football clubs’ human capital: Analytical and dynamic models based on footballers’ life cycles. Journal of Intellectual Capital, 23(5), 1107–1137. https://doi.org/10.1108/JIC-06-2020-0211
- Sæbø, O. D., & Hvattum, L. M. (2015). Evaluating the efficiency of the association football Transfermarkt using regression based player ratings. Paper Presented at NIK 2015 Conference. https://core.ac.uk/reader/327107620
- Scarfe, R., Singleton, C., Sunmoni, A., & Telemo, P. (2023). The age-wage-productivity puzzle: Evidence from the careers of top earners. Economic Inquiry. https://doi.org/10.1111/ecin.13191
- Scully, G. W. (1974). Pay and performance in major league baseball. American Economic Review, 64, 915–930.
- Simmons, R. (2022). Professional labor markets in the journal of sports economics. Journal of Sports Economics, 23(6), 728–748. https://doi.org/10.1177/15270025211051062
- Thrane, C. (2019). Performance and actual pay in Norwegian football. Journal of Sports Economics, 20(8), 1051–1065. https://doi.org/10.1177/1527002519851146
Appendix
Table A1. Effects of control variables on Transfermarkt market values (logged) for Model D in Table 2. OLS regression. N = 310.