ABSTRACT
Following previous research which showed the significance of learners’ self-efficacy and dispositions towards progression in school and university transition, we developed and validated similar measures for use in modelling undergraduate students’ Learning Gain (LG). We validated three dimensions of confidence using data from a sample of (mainly first year) undergraduate students in various departments of one major UK University which we call: ‘confidence in learning through…’ a) ‘traditional university transmission pedagogy’ (e.g. in lectures), b) ‘social means’ (e.g. working in teams), and c) ‘problem solving, reflection and critical thinking’. We explored psychometric properties of these measures and then focus on their association with other perceptions of students’ experience in HE and other measures of attainment. We then used these academic self-efficacy variables to inform (regression) models of LG. Finally, we discuss the prospects for measurements and modelling of LG involving dispositions and affect as well as attainment.
Introduction
This article draws on work under the Higher Education Funding Council for England (HEFCE) Learning Gain (LG) initiative which called for projects to pilot LG measures in various Higher Education (HE) institutions across England. ‘Learning Gain’ is generally defined as what is learned between two (or more) time points. For HE, LG is specifically defined in the 2014 HEFCE-commissioned RAND report as ‘the “distance travelled”, or the difference between the skills, competencies, content knowledge and personal development demonstrated by students at two points in time’ (McGrath, Guerin, Harte, Frearson, & Manville, Citation2015, p. xi). HEFCE along these lines, used the following definition more recently: ‘it is an attempt to measure the improvement in knowledge, skills, work-readiness and personal development made by students during their time spent in higher education’ (see https://www.officeforstudents.org.uk/advice-and-guidance/teaching/learning-gain/).
In our pilot Learning Gain project (entitled ‘Alternative measures and models of learning gain’), we considered measurement and modelling of learning gain (i.e. the distance travelled) as requiring an understanding of various interrelated dimensions (some of which might not always be normally perceived as ‘learning’) and background variables which need to be accounted for, in any valid attempt to model learning gain.
This article reports on some pilot work attempting to capture the learning dispositions of undergraduate students. The purpose of capturing learners’ dispositions is threefold. First, we wish to examine whether any association/correlation arises between dispositions and attainment-based measures of learning gain. In other words, do students who enter HE with particular dispositions, such as confidence, achieve (perhaps because they engage with their university in ways that lead to) demonstrably different learning gain outcomes (as measured by grades and qualifications achieved)? Second, we wish to establish a baseline from which we can assess whether students’ learning dispositions evolve during their degree programme. If dispositions do change, we may discover that dispositions are influencing factors in the way individuals make decisions and might become important ‘alternative learning outcomes’ to be valued in themselves: then important questions may arise regarding the factors that explain such change, and why some students are more receptive to disposition change than others. Third, we seek to identify associations between learning dispositions and background characteristics, such as socio-economic status, and gender, and other dispositions and students’ perceptions of their university experience. This may ultimately allow us to better understand differentials in the likelihood of outcomes relating to student satisfaction, student retention, degree award and post-graduation outcomes, and allow interventions to be offered that target those students most in need of support.
Review of related literature
When referring to alternative learning outcomes, or dispositions towards learning/academic skills as part of what might eventually become models of learning gain in HE, one needs to consider at least two interconnected themes in the literature and in the particular field of Higher Education: measuring dispositions such as confidence, and learning gain or ‘value added’. In this section, we briefly outline previous literature on these areas with emphasis on how they interplay in our study.
Sander and Sanders (Citation2003), building upon work by Bandura (Citation1986, Citation1993) and Pajares (Citation2000), consider that a student’s confidence may be a significant determining factor as to the level of commitment they are prepared to invest into academic and social activities. Furthermore, as Webb-Williams (Citation2006) state, confidence, and in particular self-efficacy (i.e. one’s confidence in one’s ability to succeed in specific tasks) are positively correlated with academic success. Consequently, if a greater understanding can be gained of a student’s confidence, it may be possible to tailor support where needed to improve (the chances of) learning gain.
The sense of confidence that we all have (or do not have) when required to perform a task is discussed by Kübler-Ross (Citation1969) and mapped onto the Kubler-Ross Change Curve, which shows how an individual’s morale and self-assurance are linked to a successful progression over periods of change. Similar results were detected by Edwards and Minton (Citation2009) in their study of the problems encountered by distance students in universities.
Previous work from members of the current team along with a wider group at the University of ManchesterFootnote 1 also built on Bandura’s and followers’ work on self-efficacy and developed instruments to capture various aspects of students’ learning experiences in mainly mathematically focused settings. Starting from post-compulsory pre-university experiences and drawing on context-specific items we have established measures of maths self-efficacy (Pampaka, Kleanthous, Hutcheson, & Wake, Citation2011). This was also taken up within a study of students in their transition to HE (Pampaka & Williams, Citation2010), where the multidimensionality of this construct resulted in two sub-measures (one related to more ‘applied’ mathematical modelling and one related to the traditional pre-university curriculum). Other attitudinal measures validated (sometimes labelled as ‘soft learning outcomes’) included maths dispositions, disposition to go into HE and disposition to complete the chosen course in HE as well as other measures of confidence in maths and other skills (Pampaka et al., Citation2013). Usefully, statistically significant associations between these measures were found (e.g. maths self-efficacy related strongly with disposition to further study) and their relation to students’ characteristics were established (such as their mathematical attainment and gender).
The highlight of this work has been the statistically significant association of these measures with measures of characteristics of the teaching practice and learning experiences the students encountered in their educational trajectories (Pampaka & Williams, Citation2016; Pampaka, Williams, Hutcheson, Citation2012). Thus, drawing on qualitative studies of various subject topics (Harris et al., Citation2015; Harris & Pampaka, Citation2016; Jooganah & Williams, Citation2010), sound measures of students’ perceptions of their experience of transition into university were built, and used to relate such experiences with students’ background (Pampaka, Williams, & Hutcheson, Citation2012). This work extended to a comparative study of English and Norwegian students, for instance, suggesting important differences between English norms and a more social democratic educational tradition (Pampaka, Pepin, & Sikko, Citation2016). The current study seeks to build on this, expecting to find the association of learners’ experience of transition with their measures of confidence and also subsequent learning gain. This is not the place to detail all the methodological difficulties encountered in such work: however, two key points of relevance are noted here. First, these measures are only as good as the qualitative work that goes into constructing the scales, both in formulating items for scaling (e.g. checking the sense that they stimulate in students being measured) and in interpreting the measures that result (e.g. drawing inferences from the fact that one student has a higher measure than another). Second, longitudinal data in education is highly prone to attrition and so missingness: inferences from data-sets that have high levels of ‘missingness’ will require careful analysis (Pampaka, Hutcheson, & Williams, Citation2014).
Confidence relating to specific aspects of learning has been identified as being of importance by a number of studies. For example, Margaryan, Littlejohn, and Vojt (Citation2011) explore the impact of students’ confidence with digital technologies, and Händel and Fritzsche (Citation2015) asked students to judge their personal performance in an exam and also to report their confidence in this performance judgement. Some previous research has begun to unpick, differentiate and measure the impact of individual factors on the academic attainment of students in HE (Crawford & Wang, Citation2015), while other studies have focused on motivation (Kyndt et al., Citation2015; Liu, Bridgeman, & Adler, Citation2012) and the strategies deployed by working-class students at university (Lehmann, Citation2009). Context-driven research suggests that academic confidence is unequally distributed among students in HE (Jones, Citation2017; Wei, Ku, & Liao, Citation2011) and that students’ learning may be consequently differentially affected (Crawford & Wang, Citation2015). With policy attention now firmly focused on outcome differentials (HEFCE, Citation2014) and their causes (Mountford-Zimdars et al., Citation2015), research into students’ individual academic disposition continues to gather momentum.
Connections are noted by Wei (Citation2015) and others between students’ socio-economic status and their academic confidence, while background characteristics are drawn upon in other studies to offer explanations for transition differences (Beaumont, Moscrop, & Canning, Citation2016; Briggs, Clark, & Hall, Citation2012). That young people’s HE choices are influenced by their background is well established (Brooks, Citation2003), but studies are increasingly beginning to note the potential impact of background characteristics on performance and engagement (Jones, Citation2017) and, ultimately, it is suspected, on learning gain.
At this point, a note should be made on how learning gain is conceptualised and measured in related literature. Even though the term is relatively new and approaches are currently under development (at least as part of this HEFCE-funded pilot initiative) it has often been considered interchangeably with the term ‘value added’. This term is particularly popular in school evaluations, where models of school effectiveness and improvement depend on the amount of value added to any given student’s test outcome that is uniquely attributable to attending a particular school (e.g. Scheerens, Citation2000; Troncoso, Pampaka, & Olsen, Citation2015). Given the hierarchical nature of the topic and data to model it, this usually advocates the use of multilevel models, which are not going to be explored further within this article. However, another element of the value-added research which is crucial for any such study and consequently studies of learning gain is the modelling of current grades/test results while accounting for previous grades/scores which appear as explanatory variables in regression models (as in Liu et al., Citation2012).
The question of standardising assessments is also raised in the value-added educational measurement literature (Krupczak & Disney, Citation2013), with arguments made that a ‘pre-test to post-test’ approach offers the best solution (Culpepper, Citation2014; Delucchi, Citation2014). However, Caspersen, Smeby, and Olaf Aamodt (Citation2017) emphasise the significance of context to learning gain and warn against false assumptions that standardisation of Learning Outcomes across the HE sector would necessarily make valid comparisons of learning across distinct environments and experiences in competing institutions. This is echoed by McGrath et al.’s (Citation2015) observations that a homogenisation of the HE sector could significantly impact on the unique institutional strengths, autonomy and disciplinary identities in HE.
Finally, a note of caution is expressed by Macfarlane (Citation2016), who warns that students’ rights can be overlooked in the search for new measures of learning gain. Drawing on evidence from a Hong Kong university, MacFarlane argues that the focus on ‘active’ learning privileges certain kinds of predispositions over others and possibly undermines students’ freedom to determine the learning methods that suit them best.
This article focuses on establishing the validity of relevant measures and reporting the preferred methodology for future analyses. The research questions (RQ) for this article are:
RQ1: How can we measure learning dispositions such as confidence of students in their competence to learn at university?
RQ2: How can such learning disposition measures be related with students’ characteristics and their perceptions of the transitional experience into University?
RQ3: How can the extent to which such dispositions are associated with students’ learning gain in attainment in their academic subjects be modelled and their effects measured?
Methods
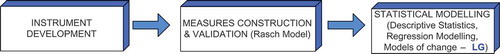
The combined analytical framework used here is shown in , which was introduced and extensively applied in previous work (e.g. Pampaka et al., Citation2016; Pampaka, Williams, & Hutcheson, Citation2012) and is particularly relevant for this study. As shown, the research process includes three main stages starting from the development of the instruments to collect data, the measure construction and validation and a final statistical modelling stage, which is extended in this work to also cover models appropriate for LG. These stages are detailed in the context of this work.
Figure 1. A comprehensive measurement and modelling framework.
Instrument development
The instrument/questionnaire used in this study was based on the aforementioned previous work (e.g. Transmaths questionnaires) and included a series of subsections aiming to cover various aspects of students experience at university. In this article, we focus on the section titled ‘Expectation and Experience of University’ which includes statements aiming to capture students’ confidence across a range of academic areas, perceptions of how university differs from previous school/college and their feelings regarding completion of degree.
We have chosen to focus on a subsection of this section of the instrument that attempts to capture students’ confidence on their ‘generic’ learning skills. This list was developed starting from similar questions asked during the Transmaths study with first- and second-year students in diverse university institutions and subjects, and was extended/revised after discussions with colleagues across the host university, and exploration of the intended learning outcomes in their programmes of studies. The items appeared in the questionnaire as shown in Appendix 1 and are listed along with the distribution of the sample’s responses in (see next section).
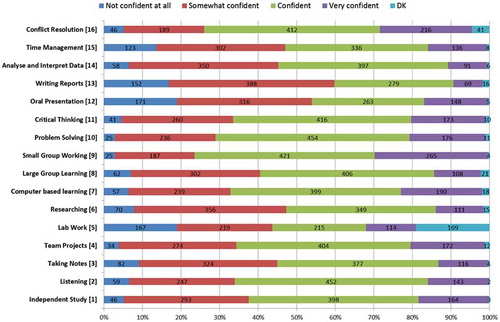
Figure 2. Distribution of students’ responses on the confidence items.
Other Confidence/Disposition measures being developed include: confidence with maths related topics (following Transmaths work); disposition to think critically (not reported here) and disposition to complete chosen course (see Appendix 2 for items and Pampaka et al., Citation2016 for details of validation). The article also utilises measures of transitional experience, which are considered here as process indicators that are expected to affect students’ learning gain, and also be related to the various learning outcomes. Details of the construction and validation of this instrument for the UK context has been provided elsewhere (Pampaka, Williams, & Hutcheson, Citation2012) along with some results using the two constructed measures: the first we called ‘perception of the transitional gap/jump’ and the other ‘degree of positive feeling about the transition’.
Measurement approach for construct validation
The validation approach we employ in this article has been previously extensively tested both within our work with relevant measures in similar and other contexts (Pampaka et al., Citation2016; Pampaka, Williams, & Hutcheson, Citation2012; Pampaka & Williams, Citation2010; Pampaka et al., Citation2013) as well as other work in educational and psychological measurement. This validation process refers to the accumulation of evidence to support validity arguments regarding the investigated constructs of confidence in generic (academic) skills. We have chosen a psychometric analytical approach based on the Rasch measurement framework because it enables us to both check for the validity of the envisaged measures as well as then construct scale variables for use in further modelling, while at the same time avoiding common pitfalls of factor analytic models (which have to assume items are scored on an interval scale, when they are in fact ordinal). We thus follow relevant validation guidelines (Wolfe & Smith, Citation2007a, Citation2007b) which are in turn based on Messick’s unified validity definitions (Messick, Citation1988). The Rasch rating scale is the most appropriate for the confidence constructs we are exploring in detail (i.e. that based on items above) with items measured on the same Likert style scale (Bond & Fox, Citation2001) but for other measures we also use the dichotomous model and the partial credit model depending on the items mixture and type. In all the cases, the data are analysed and validity claims are based on examination of the following statistics:
Item fit statistics to indicate how accurately the data fit the model, and thus provide evidence for fulfilment of the unidimensionality assumption, hence suggesting development of one-dimensional scales. Misfit will then suggest the possibility of existence of new dimensions which we will examine further. Further investigation of dimensionality issues was also performed by exploring the results of principal component analysis of the residuals after the Rasch model was fitted (Linacre, Citation1998). If the instruments are proved to produce multiple distinct measures then each will be examined separately.
C ategory statistics will be examined for the appropriateness of the Likert scale used and its interpretation by the respondents, to justify what is usually called communication validity (Linacre, Citation2002).
Person – item maps and the item difficulty hierarchy will provide evidence for substantive, content and external validity.
Differential item functioning (DIF) and person fit statistics will suggest group differentiation of performance on items and so also on the construct being measured, which is an important aspect of validity when an instrument is used with different groups of persons (Thissen, Steinberg, & Wainer, Citation1993). DIF will be examined in this study for different subgroups where it is thought especially important for measurement across groups to be valid with focus on gender and year groups.
Here a key limitation should be mentioned: interviews with students selected to have different measures have not yet been carried out: the provisional results reported here will thus be subjected to this further scrutiny in due course.
Further analysis – statistical modelling
After the measures’ validation these scores were added to the survey dataset together with background and other outcome variables (linked to administrative data as detailed next) for the students of our sample. The survey data analysis employed generalised linear modelling (GLM) and in particular linear regression of the constructed measures as outcomes in the models in the first instance and then as explanatory variables associated with attainment learning outcome variables over two different time intervals (Hoffman, Citation2004; Hutcheson, Pampaka, & Williams, Citation2011; Hutcheson & Sofroniou, Citation1999). Variable selection was based on procedures where the emphasis is on selecting 'useful' models that incorporate theoretical judgements as well as statistical criteria applied to the sample data (Agresti, Citation1996; Weisberg, Citation1985). To this end, we have avoided selecting models based entirely on statistical criteria and automated procedures such as step-wise selection and all-subsets selection.
A final note regarding software used for analysis: we have used Winsteps for Rasch Analysis, and for descriptive analysis and modelling Microsoft Excel, Stata and R.
Sampling, survey sample and secondary/administrative data matching
The project looked at several ways of accessing the student undergraduate population which is the target population in this study: it should be noted, however, that our aim here was not representativeness of the whole population but ensuring a diverse sample to allow us to validate our measures in this population. We thus opted for a non-probability sampling approach and found the most productive way of engagement was when participating departments understood the nature of the project and the potential value of the data it would return and embedded the data collection into other timetabled activities (open activity days or tutorials). The project also engaged with students during lectures, which allowed the project team the opportunity to explain the nature of the project to potential participants. However, due to the pressure on teaching time, the collections could only take place in lecture breaks and this may have reduced the number of responses gained. About 80% of the responses were completed on hard-copy questionnaires and 20% were completed on equivalent online versions. The data collection was carried out from the end of October to early December 2016 with students in eight subjects taking part in the research.
This resulted in a total of 908 student respondents in our dataset; however, as usually happens in this type of study, there was missing information for some variables, which makes some cases non-usable for certain parts of the results and sample description. For instance, Table presents the sample description in regard to the subjects the students study and their gender: one can see that information for this cross-tabulation is only complete for 887 cases.
Table 1. Sample description, by gender and subject groups.
As demonstrated by , the sample is heavily dominated by students in their first year at University (87.9%) with smaller numbers of students in Year 2 and Year 3 (where the sample size is particularly small). Therefore, even though we currently use this sample for validation of measures across year groups, this is done with caution and we aim to collect further data from these groups in the coming years to enrich these analyses.
Secondary/administrative data linkage
The research gained ethical approval from the University’s Research Ethics Committee. A key component of the research design is linking survey data to the wealth of administrative and academic data held by the University and ensuring that this process met ethical requirements was an issue that had to be worked through with the ethics committee, which included capturing the appropriate consent. Consent was given by the majority (indeed 841, or 91.4%) of the 920 respondents to link their questionnaire data to the administrative data held by the host institution including a range of background socio-demographic data, pre-university qualifications and future academic career data. Those students who did not give consent were excluded from any such analysis (e.g. onwards). Students’ records are based on the Universities and Colleges Admissions Service (UCAS) and registration data with further information being added/updated by students and academic administrators. This data linkage is important in terms of examining differential patterns of confidence and attainment. However, it comes with the cost that results are limited to full-time Undergraduate first degree students with further restrictions discussed below.
The data on socio-economic classification is also taken from consenting students in this secondary data linkage. This comes from the National Statistics Socio-Economic Classification (NS-SEC) and relates to the occupation of students ‘parents, step-parent or guardian who earns the most’ (https://www.hesa.ac.uk/data-and-analysis/performance-indicators/definitions). The data are classified across seven categories: 1 = Higher managerial and professional occupations, 2= Lower managerial and professional occupations, 3= Intermediate occupations, 4= Small employers and own account workers, 5= Lower supervisory and technical occupation, 6= Semi-routine occupations and 7= Routine occupations. Students within NS-SEC classes 5–7 are classified as lower socio-economic and those from NS-SEC classes 1–4 are classified as higher socio-economic.
At the time of writing two attainment measurements were available for the respondents: University entry qualifications and (average) course unit grades from semester one. These measures provided the opportunity to model learning gain (LG) over a short time period. The research team will model more extensive periods of LG as the data become available over the academic trajectories of the participants.
As the research is examining LG in Higher Education, an important consideration was taking into account students’ entry qualifications to provide baseline data. Entry qualifications were given a numerical tariff score based on the type of qualification and grade with higher grades receiving higher points. In particular, we used the top 3 A-level results with the following grade scoring system: A* = 140, A = 120, B = 100, C = 80, D = 60 and E = 40. The tariff score from the qualifications of each student are summed to provide an overall measurement of the quality of students’ entry qualifications. The analysis of LG excluded the students entering the University with qualifications other than A-levels and therefore does not represent the whole University intake (following Hoare & Johnston, Citation2011).
The semester one course unit grade data are based on the course unit assessments that are aggregated to form the course unit grade based on the results and weighting of the assessments. For the analysis presented in this article, the ‘Semester 1- Year 1 result’ outcome variable is available from two academic areas (one from Humanities (n = 102) and one in STEM areas (n = 112)) which is based on year 1 semester 1 course unit grades. Note that the intention here is to demonstrate and validate LG methodology in the context of the measures of confidence, rather than to report substantial or generalisable results with any policy or practice implications.
Results
In this section, we will present first descriptive results with the items related to the validated confidence measures and then we will focus on the detailed presentation of the validation results for the confidence measures. Once the validation is established then we will use these and other measures developed by the same approach to show some further analysis and results, including correlations, and explanatory models of effects of background variables on confidence, and models of learning gain.
Item description
We have used the total of 908 responses in our data-set (see ) for the first step of measurement validation, which includes only a small number of responses from Year 2 and Year 3 students. Therefore, even though we currently use this sample for validation of measures across year groups this is done with caution and we aim to collect further data from these groups in the coming years to enrich these analyses. Using the overall sample, provides the distribution of responses to the item stems that make up the proposed confidence measure we will validate next. Students were asked to answer the question ‘how confident do you feel you are about the following general skills’ by selecting one of the response options available for each skill/activity (not confident at all, somewhat confident, confident, very confident, don’t know (DK); with the latter not part of the ordinal response scale) (see also Appendix 1).
shows, for example, the activities named ‘writing reports’, ‘lab work’ and ‘oral presentations’ attracted the greatest number of ‘Not confident at all’ response option (approx. 17 to 19%). In contrast, students appear more confident with ‘problem solving’, ‘small group working’ and ‘conflict resolution’ (looking at the response options, more than 70% say they are confident or very confident) ‘analyse and interpret data’, ‘writing reports’ and ‘researching’ attracted the highest ‘Somewhat Confident’ response.
Validation results
We first explore the Rasch item fit statistics, which provide evidence for construct validity depending on their deviation from the suggested cut-off points for acceptable ranges. We need to acknowledge here the debate around these cut-off points (Linacre, Citation2002; Smith, Schumacker, & Busch, Citation1998), and considering existing recommendations we take 1.3 as a value for infit and outfit mean squares that suggests cause of concern (though a choice of 1.2 would not make much difference in practice in this case). Items with fit statistics higher than 1.3 will be considered as ‘misfits’ and will be further investigated (qualitatively as well as statistically). Items with value below 1 will not be explored in detail since they are not considered as a threat to the measure’s validity (though they may suggest items that are overly predictable). When exploring item fit statistics, misfit statistics point to data that does not fit with the measurement model, perhaps it might suggest the existence of more than one measurement dimensions, or significant differences in how different learners respond to a particular item even though they are equally confident (Bowles, Citation2003; Wright, Citation1994). Along with cut-off values our decisions are also influenced by Bohlig, Fisher, Masters, and Bond’s (Citation1998) recommendations which suggest that ‘less than pleasing fit statistics say “think again”, not “throw it out”’ (p. 607); hence we seek explanations and interpretations for the high fit values. The summary of the fit statistics for our first calibration of this instrument is shown in .
Table 2. Item measures and fit statistics for a potential construct of confidence in learning at HE.
Looking at the infit and outfit statistics columns, the highest score is observed for item 5 (lab work). A potential explanation for that is that the ‘lab’ could be a confusing ‘content’ as there are computer labs as well as other laboratory sessions in some courses involving experiments. Discussions with staff suggested that lab work indeed means different things on different courses, which throws the validity of this as a measurement item in its original form into doubt: even if this item was reported as a single-item scale, it would not perform well as a means of comparing different groups of students’ confidence. This was actually amended in later data collection version of the instrument and is a theme to be explored deeper with interviews with students. It was thus decided to drop this item for the next calibration steps in this analysis. However, two other items are also signalled with high misfit (e.g. oral presentation and time management) which we thought important to be represented as aspects of the learning profile. This suggested the items are not all working as a whole and might benefit from subscales, with oral presentation being gathered with other less traditional activities perhaps.
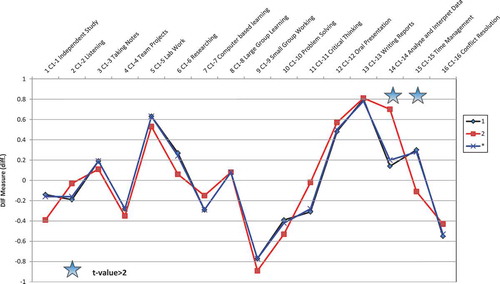
We also explore differential item functioning (DIF). As mentioned in earlier sections, DIF reveals differences in the item difficulty for different sample subgroups. It allows the exploration of item responses given by different groups to identify the potential for construct irrelevant differences between these subgroups thereby helping to establish if the item is malfunctioning. If DIF is present for different genders for example, it indicates that, people from differing genders who share the same measure (e.g. of confidence) have a different probability of a certain response on that item. The points in and show how the item measures differ between the investigated groups (i.e. gender in and year group in ) while the stars indicate statistically significant differences, even though the prevalent cut-off value of concern in DIF analysis is the difference in logit (usually expected to be larger than .5 to cause concern). DIF by gender in confidence scales does often occur and shows up some items, with male students reporting (relative to the overall measure) less confidence with time management and taking notes in lectures, and women reporting less confidence in problem-solving, critical thinking and analysis. However, at this stage this and other DIF evidence was not strong enough in itself to force the deletion of items; for one thing the gender balance in the participating subjects varies and this complicates interpretation. Indeed, in general the difficulty with such interpretations in developing scales is to decide if the DIF is due to ‘real gender differences’ that we might want to study or to bias in the expression of the items themselves (Ong, Williams, & Lamprianou, Citation2012). We therefore look for clusters of DIF and for some reasonable explanation – e.g. that women may tend to express more confidence on their literacy and less in their analytical and mathematical problem-solving activity. But note also that the Figure reveals some DIF in the items discussed above, regarding lab work and time management, the latter also being flagged by DIF between year one and year two. The fact that Year 2 students are more confident than Year One with time management but less with analysis and interpretation seems quite reasonable, as students are thought to become more adjusted to managing their work, but yet some of the intellectual demands of their courses may keep rising. This kind of explanation suggests that there may be differences between subscales with some of these items appearing in different dimensions.
Figure 3. Item measures by gender groups and indicators of significant DIF.
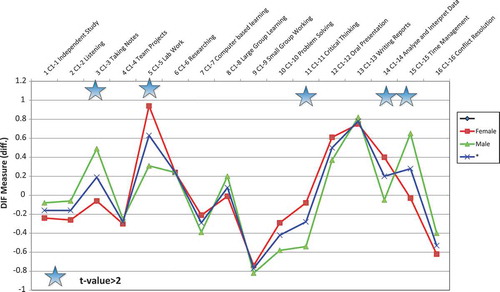
Figure 4. Item measures by year groups and indicators of significant DIF.
The potential dimensionality of this scale is now further explored with the results of the principal component analysis of the residuals. According to this ‘test of dimensionality’, the Rasch model explains 34.5% of the variance; that is, roughly speaking the dominant confidence dimension here explains about a third of the variation in responses. As suggested by relevant guidelinesFootnote 2 (Linacre, Citation2014) it is important to check the ‘contrasts’ which indicate if there might be more dimensions that could account for a significantly greater amount of data variation – in our case the eigenvalue for the first and second contrasts were quite large and in such cases it is advised to inspect the ‘contrasting content of the items which is producing this large off-dimensional component' in the data.
So given the above evidence and the various clusters of items suggested by the dimensionality report as well as a qualitative evaluation of the content of the items (along with expert group reviews of the research team and through meetings with colleagues in participating subject areas) we hypothesised three subscales of activity with distinct constructs of confidence in learning: labelled for the moment as ‘Traditional’, ‘Social’ and ‘Problem Solving’ learning activities. Each of these subscales can be analysed as a separate construct dimension in its own right ().
Table 3. Item measures and fit statistics for the three confidence subscales.
The fit statistics on the above scales signal some potentially misfitting items: item 7 ‘Computer based learning’ in the measure denoted ‘Problem solving’ (perhaps because in some subjects students experience ‘computer based learning’ work as more routine than in others) and item 16 ‘conflict resolution’ in Social learning (speculating that so early in the course the bulk of students may have had little experience of conflict resolution likely to be experienced e.g. in team working on projects). Having speculated on the source of the misfit, Infit and Outfit values around 1.2 are widely accepted in building measurement scales, being indeed typical values even in high stakes testing, and we now emphasise that theoretical and qualitative considerations should be applied here. Do these items really contribute at face value to the constructs we are considering? And what exactly do these dimensions indicate about students’ confidence, and how might we name and interpret these constructs? The validity question ultimately goes to consequential validity: will our research and practice benefit from interpreting students’ confidence on these three dimensions as well as on the ‘confidence as a whole’? (All these will be subject to ongoing inquiry as further survey and interview data become available for analysis.)
The item-map scales: The item/person maps in show the distribution of the measures of confidence of persons (i.e. students, on the left of axis) on the same logit scale as that of the parameters of the relevant items (right hand side of the vertical axis). The higher a person’s measure, the greater their confidence and the more likely they are to respond with a higher category on any given item. The location of the items indicates how likely on average a person is to express confidence related to this item. Because the items in ‘Traditional’ are all roughly similar in their measure, this suggests they are not very different in the amount of confidence they demand from students. In discussion, the team interpreted these items as referring to the traditional way of learning through lectures (often in large groups in lecture halls), listening and taking notes – working independently at home, and being organised enough to prepare to perform in exams (perhaps involving time management of one’s work). This interpretation needs to be validated qualitatively through student interviews, but does seem to make sense to us as teachers and lecturers, and seems reasonably well defined as confidence in ‘learning traditionally through the normative HE transmissionist pedagogy of lectures’.
Figure 5. Person-item maps for the three confidence sub-measures.
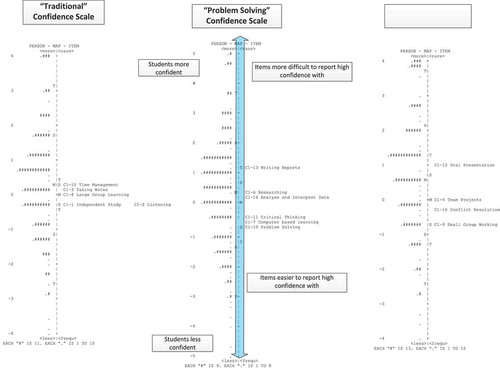
Similarly, the social dimension arguably reflects working with and communicating with others in small groups and teams; again this reflects an important context of learning but according to our previous Transmaths research one that is less well understood by lecturers (see Transmaths briefingsFootnote 3 ).
Finally the problem-solving construct would seem to have gathered concepts involving research, analysis and interpretation, critical thinking and reporting, as well as the explicit problem-solving item. The ambivalence over the context of computers in this dimension perhaps adds to the validity in thus naming the construct. As in the above this provisional definition of the construct waits further qualitative work.
Communication Validity to check for Rating Scale functioning: Rating scales and their response formats serve as tools with which the researcher communicates with the respondents, a function defined by Lopez (Citation1996) as ‘communication validity’. Examining category statistics is essential within the Rasch measurement framework in order to confirm the appropriateness of the Likert scale used and its interpretation by the respondents. A well-functioning scale should, at least, present ordered average measures, and ordered step calibrations (Linacre, Citation2002) with acceptable fit statistics, as shown here ().
Figure 6. Category statistics and item characteristic curve (ICC) for the Traditional Confidence.
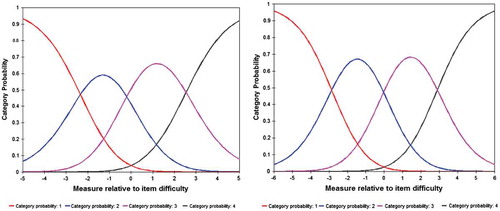
In the probability plot, the three thresholds (i.e. boundary between category 1 and 2, 2 and 3, 3 and 4) appear adequately ordered e.g. the ‘average’ of the students’ confidence scores for the least confident category is −1.56, and for most confident is +1.98, with misfit statistics close to 1 indicating no important misfit to this model. The characteristic curve shows the probability that a learner of a given ‘confidence’ measure will respond using the categories 1–4, and are also well ordered right through the range of measures. This provides evidence of a well-functioning scale for the first dimension. Similar considerations applied to the other two measures which also demonstrate acceptable functioning (see characteristic curves in ).
Figure 7. Item characteristic curves (ICC) for ‘Social’ (left) and ‘Problem Solving’ (right) confidence measures.
Overview of constructed measures used in this analysis
With the same validation procedures, other measures of attitudinal/disposition learning outcomes and perceptions of transitional experience have been constructed and are employed in the models and results presented next in this article. These are summarised in and followed by the histograms of measures not detailed earlier to indicate the range of values in the logit scales presented previously ().
Table 4. Overview of constructed measures.
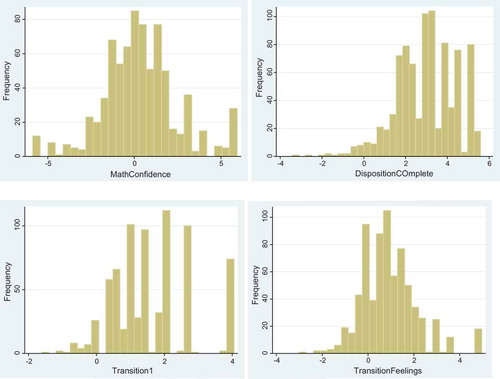
Figure 8. Histograms of measures of students’ dispositions and perceptions of transition.
Statistical modelling and learning gain
Linking these measures back to the data-set with students’ characteristics and the attainment measures presented earlier, we now turn into demonstrating their usefulness (and thus consequential validity) via descriptive analysis and regression modelling in order to answer RQ2 and RQ3. To avoid further complexities, this section presents results only for Year 1 students (N = 768) and the models of Learning gain are limited to available data from only two courses (N = 376 but for models N = 218 as there have been other missing data in the variables).
Descriptive analysis of these measures
We first explore how these measures are related first to students’ background characteristics (e.g. gender), how they are related to each other and then how they are associated with other attainment measures.
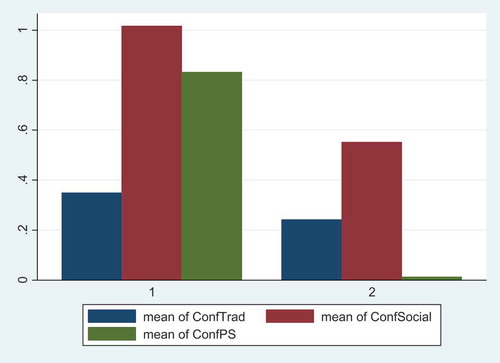
illustrates comparatively the means of gender groups in regard to the three constructed subscales of confidence. The differences were also tested statistically. In regards to the ‘Traditional’ measure, the small observed difference is not statistically significant (Male = .35, female = .24, t = .97, p = .33) however for the ‘Social’ and ‘Problem Solving (PS)’ there are notable statistically significant differences in favour of male students (Social: Male = 1.02, Female = .55, t = 3.5, p < .00: Problem-Solving: Male = .83, Female = .01, t = 6.4, p < .0001).
Figure 9. Means of gender groups on the confidence measures.
presents the Pearson correlations between the constructed measures of confidence, dispositions and perceptions of transitional experience.
Table 5. Correlations between dispositions and confidence measures.
As shown in , all confidence measures are positively associated with each other, as one would expect. Confidence measures are also significantly related to students’ disposition to complete their chosen course. A new finding here is that perception of transitional gap is related negatively with Traditional Confidence and also, all confidence measures are related positively with how positive a student feels about their transition at university.
We now turn to explore how these measures are related to other attainment measures of students. presents the Pearson correlations between the constructed measures of confidence, dispositions and perceptions and the two measures of student attainment.
Table 6. Correlations between dispositions, confidence and attainment measures.
The main highlights from the correlation analysis are as follows: Entry Qualifications are associated significantly and positively only with maths confidence. Semester 1 results present mixed patterns in regard to confidence: they are related positively with confidence measures, apart from ‘Social’ (where the correlation is negative and significant) and PS (not significant). Semester 1 results are also positively related with Disposition to complete HE course and positivity towards the transition.
In order to overcome limitations of above descriptive analysis which only deals with one variable at a time, we consider regression models to capture the inter-relations between variables and account/control for covariates.
Regression models for confidence measures
The first set of models we present aims to illustrate how confidence measures are related with other background and disposition measures. For this linear regression analysis with outcomes for these three confidence measures, we have employed all available data for Year 1 students, however the inclusion of entry qualifications as an explanatory variable reduced the sample size and thus we selected a limited number of variables to study, based on theoretical judgements informed by the literature reviewed earlier. These included a course indicator, gender, nationality, entry qualifications and perceptions of the transitional gap. It is important to note that this type of model measures the effect of each background variable on the confidence measures on the assumption that every other explanatory variable is controlled for, so that the effect of changing several (background and disposition) variables is additive.
The resulting models for each of the three confidence measures are presented in , and the statistically significant effects are highlighted. The model fit statistics are adequate, suggesting that about 13% (for ‘Social’) to 26% (for ‘Problem Solving’, PS) of variance in confidence is explained by these explanatory variables. Some trends in these models indicate that course-related associations are more pronounced for the social and PS confidence dimensions. The same pattern is also shown for gender, with men scoring higher on Social and PS (but not Traditional) confidence (.6, .7 and .05 logits on average) than women, when all other variables are held constant. There are also noted differences in regard to nationality in ‘traditional’ and ‘Problem solving’ confidence. Most importantly, positivity towards transition has a positive effect on all confidence subscales. These results collectively suggest that the three dimensions of confidence might be helpful in modelling, and may help reveal how background variables and other measures of perceptions of transition influence learners experiences and outcomes, and how such measures may be mediating the effects of some of these significant background variables.
Table 7. Regression models for the confidence measures as outcome variables.
Regression models for learning gain
In order to build models which can be helpful for learning gain, we follow a step-wise approach stemming from value-added methods, and building up to contextualise the models with other informative variables, and also to check for equality issues using important background variables such as proxies for social class. To this end, we build linear regression models of students attainment in Semester 1 at Year 1 (as the outcome qualification) while controlling for previous qualification and sequentially other variables in the models. This approach is explored and illustrated below along with some resulting models (presented in ).
Step 1: Outcome Qualification ~ Previous Qualification (no other variables) Semester 1 Year 1 Outcome = 5.42 + .17*EntryQualification (F = 39.86, p < .001, R 2 = .155).
Step 2: Control for course and gender, and checking for nationality (this was not found significant so for simplicity it was removed from next steps).
Step 3: Add Process and disposition (transition) (Model LG1 in ).
Step 4: Add Confidence (Model LG2 in ).
Step 5: Add Socio-economic indicator to check for Inequalities (Model LG3 in ).
Table 8. Regression models for the learning gain (year 1 results as outcome).
There are some interesting findings when looking at the results of the models in . A first observation is that gender and course/topic studied are not found to be significant when measures of confidence are entered into the model: this might be suggesting a potential interaction or mediating effect of gender through confidence on attainment outcome measures, which needs to be explored further. When looking at perceptions of process/transition and dispositions only the latter is significant. More interestingly, once we consider the confidence measures, disposition to complete course is no longer affecting learning gain but confidence in ‘traditional learning’ does (hinting at further mediations). This effect is enhanced when we start considering socio-economic indicators (as in Model LG3) and as can be seen the ‘social’ confidence subscale is also statistically significant in predicting value added in learning (at Year 1). In other words when the proxy for social class enters the model, the measures of confidence become even more significant and there could also be an interaction or moderating effect to explore here as well. Some of these effects are easier to visualise in (for Model LG3).
Figure 10. Effect plots for the significant relations of model LG3.
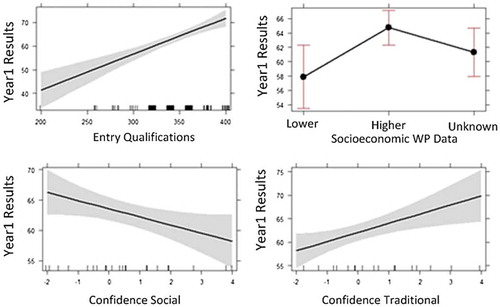
Model LG3, therefore, shows that in models of value added of LG confidence on traditional learning skills may play an important role, and should not be ignored. We acknowledge that this analysis needs further detail, and further explorations with more complete data-sets will be reported in due course. However, the article does show what sorts of analysis are possible with such dispositions measures. In sum, this study of our development of confidence measures for modelling Learning Gain suggests that such models might be incomplete and even misleading if dispositions are left out o, but also that they may help us to explain effects such as ‘quality of transition’, and even those of gender and social class.
Discussion and conclusion
In previous work, confidence or (self-efficacy) in a learner’s capability with a subject has been shown to be an important attitude or disposition explaining student outcomes, such as decisions to continue to study. Confidence has been shown to be significantly associated with the pedagogy (e.g. Transmissionist teaching is associated with 'negative' dispositions and this may even be causal, as detailed earlier; see for example, Pampaka & Williams, Citation2016; Pampaka et al., 2012). In studying teaching and learning therefore, we have argued that it is important to measure these dispositions as learning outcomes of the educational experience (e.g. Pampaka et al., Citation2013). We argued, thus, that there was an important gap in the literature on how dispositions towards learning in HE could be measured and inform measurements of Learning Gain.
Within this framework, then we approached learners' confidence in their capacity to learn and found three distinct constructs of confidence in different learning contexts. The main substantive contribution of the article has been to provide validity evidence of three new confidence measures that distinguish between constructs related to (i) ‘Traditional’ learning in HE through lectures in large groups etc., (ii) ‘Social’ learning in social, communicative contexts with others in teams etc. and (iii) learning through ‘Problem solving’ involving research, critical thinking and analysis, etc. The analysis offered a methodology for such measurement constructs, illustrated through the case of ‘confidence’ using rating scales, multidimensional analysis and DIF; it also pointed to the critical role of qualitative considerations that are partially missing in this article. In addition, the article claimed to have validated but not fully reported some other measures of learners’ perceptions of their university experience. Finally, the main point was to show how this measurement approach could provide a model for analyses of how dispositions and attitudes such as confidence can be built and engaged in statistical analyses that might be revealing of important mediations of background variables on student outcomes.
This multiplicity thus revealed a more nuanced notion of learner confidence than has been reported in previous research, as far as we know. Of course the notion of self-efficacy proposed by Bandura (Citation1978) and widely researched afterwards proposed that confidence needs to be attached to a competence in context, but this has always been previously researched in the context of performance of a learned capability, such as that related to a curriculum task. What we have seen here is that confidence in one’s ability to learn (across many disciplines, skills and knowledge’s in HE) is related to the three contexts of activity mediating the learning. We might call these academic self-efficacies or ‘mediated self efficacy’.
The analysis proceeded to illustrate how such measurement allows one to model Learning Gain and hence provide some insight into the relevance of measures of academic self-efficacy, as well as background variables. Thus in our example, we were able to show that the LG as measured by models of value added between A-level entry qualifications and some course grades in the first semester of the students’ programme was significantly associated with their confidence with ‘Traditional’ learning, but not with ‘Social’ and ‘Problem Solving’ confidence, and how other student dispositions, such as disposition to complete their chosen course, and background variables are implicated.
We should finally note some limitations. One relates to the data available at this stage: The majority of young UK students entered the University with A-level qualifications and they constitute the majority of the sample. Students were only included if they had three or more A-levels and the types of A-level subjects held by students were not taken into account. Similarly for the LG analysis only some end of semester one results were available. These limitations with the sample size limit the LG modelling approach, restricting us from adding more variables into the model. We could also caution on the models we used to demonstrate gain in learning: these are simply value-added (or pre-post ‘test’ style) models, where the outcome of interest (e.g. learning at Year 1) is modelled controlling for a 'pre-test' (i.e. A-level tariff in this example). As a next step in modelling LG we might standardise these scores (either using IRT methods or/and starting from converting to z-scores) and perhaps model the difference.
Future work could employ multilevel modelling which is also an option when more data are collected from the same subjects (with caveats in regard to ‘blaming’ subject or university-levels for gains). And finally, once longitudinal data are collected learning gain can also be seen with similar models (of value added) in regard to the constructed measures of confidence in learning or academic self-efficacy dispositions.
Of course, we leave many substantive questions largely unanswered in this article. For instance, we might expect to see the importance of other confidence dimensions emerging as the project develops and the validation of the new scales is provisional pending qualitative work. Nevertheless, we argue that we have begun to show (i) how important and valid measures of disposition relevant to LG can be rigorously established; and (ii) that such measures can provide models that offer new insights into the student learning experience.
Funding
This work was supported by the Higher Education Funding Council for England (CL.04/2015, project ref: G0177/IMAN03/LG1516).
Acknowledgement
We would like to acknowledge HEFCE for awarding funding for this pilot (CL.04/2015, project ref: G0177/IMAN03/LG1516), and the support of ESRC projects (grant numbers RES-061-025-0538 and RES-062-23-1213), the outcomes of which provided the basis for this work. We would also like to thank the anonymous reviewers and editor for their valuable suggestions.
Disclosure statement
No potential conflict of interest was reported by the authors.
Additional information
Funding
Notes
1. This work refers to a series of ESRC mainly funded projects, see www.transmaths.org, www.teleprism.com.
2. See also: www.winsteps.com/winnman/table_23_0.htm.
3. See www.transmaths.org.
Related Research Data
References
- Agresti, A. (1996). An introduction to categorical data analysis. London: Wiley.
- Bandura, A. (1977). Social learning theory. Englewood Cliffs, NJ: Prentice Hall.
- Bandura, A. (1978). Self-efficacy: Toward a unifying theory of behavioral change. Advances in Behaviour Research and Therapy , 1 , 139–161.10.1016/0146-6402(78)90002-4
- Bandura, A. (1986). Social foundations of thought and action : A social cognitive theory. Englewood Cliffs, NJ: Prentice Hall.
- Bandura, A. (1993). Perceived self-efficacy in cognitive development and functioning. Educational Psychologist , 28 (2), 117–148.10.1207/s15326985ep2802_3
- Beaumont, C. , Moscrop, C. , & Canning, S. (2016). Easing the transition from school to HE: Scaffolding the development of self-regulated learning through a dialogic approach to feedback. Journal of Further and Higher Education , 40 (3), 331–350. doi:10.1080/0309877X.2014.953460
- Bohlig, M. , Fisher, W.P.J. , Masters, G.N. , & Bond, T. (1998). Content validity and misfitting items. Rasch Measurement Transactions , 12 (1), 607.
- Bond, T.G. , & Fox, C.M. (2001). Applying the rasch model: Fundamental measurement in the human sciences . Mahwah, NJ: Lawrence Erlbaum.
- Bowles, R. (2003). Rejecting best items? Rasch Measurement Transactions , 17 (1), 917.
- Briggs, A.R.J. , Clark, J. , & Hall, I. (2012). Building bridges: Understanding student transition to university. Quality in Higher Education , 18 (1), 3–21. doi:10.1080/13538322.2011.614468
- Brooks, R. (2003). Young people's higher education choices: The role of family and friends. British Journal of Sociology of Education , 24 (3), 283–297. doi:10.1080/01425690301896
- Caspersen, J. , Smeby, J.-C. , & Olaf Aamodt, P. (2017). Measuring learning outcomes. European Journal of Education , 52 (1), 20–30. doi:10.1111/ejed.12205
- Crawford, I. , & Wang, Z. (2015). The impact of individual factors on the academic attainment of Chinese and UK students in higher education. Studies in Higher Education , 40 (5), 902–920. doi:10.1080/03075079.2013.851182
- Culpepper, S.A. (2014). The reliability of linear gain scores as measures of student growth at the classroom level in the presence of measurement bias and student tracking. Applied Psychological Measurement , 38 (7), 503–517. doi:10.1177/0146621614534763
- Delucchi, M. (2014). Measuring student learning in social statistics. Teaching Sociology , 42 (3), 231–239. doi:10.1177/0092055X14527909
- Edwards, S. , & Minton, A. (2009). Re-thinking the retention of students in part-time distance learning. In D. Young & J. Garrett (Eds.), Work based learning futures III (pp. 104–120). Bolton: University Vocational Awards Council.
- Händel, M. , & Fritzsche, E.S. (2015). Students’ confidence in their performance judgements: A comparison of different response scales. Educational Psychology , 35 (3), 377–395. doi:10.1080/01443410.2014.895295
- Harris, D. , Black, L. , Hernandez-Martinez, P. , Pepin, B. , Williams, J. , with TransMaths Team . (2015). Mathematics and its value for engineering students: What are the implications for teaching? International Journal of Mathematical Education in Science and Technology , 46 (3), 321–336. doi:10.1080/0020739x.2014.979893
- Harris, D. , & Pampaka, M. (2016). ‘They [the lecturers] have to get through a certain amount in an hour’: First year students’ problems with service mathematics lectures. Teaching Mathematics and its Applications: An International Journal of the IMA , 35 (3), 144–158. doi:10.1093/teamat/hrw013
- HEFCE . (2014). Higher education funding council for England (2014) differences in degree outcomes . Retrieved September 1, 2017, from http://www.hefce.ac.uk/pubs/year/2014/201403/#d.en.86821
- Hoare, A. , & Johnston, R. (2011). Widening participation through admissions policy – A British case study of school and university performance. Studies in Higher Education , 36 (1), 21–41. doi:10.1080/03075070903414297
- Hoffman, J.P. (2004). Generalized linear models: An applied approach . Boston: Pearson Education.
- Hutcheson, G.D. , Pampaka, M. , & Williams, J. (2011). Enrolment, achievement and retention on ‘traditional’ and ‘Use of Mathematics’ pre-university courses. Research in Mathematics Education, 13(2), 147–168. doi:10.1080/14794802.2011.585827
- Hutcheson, G. , & Sofroniou, N. (1999). The multivariate social scientist: Introductory statistics using generalized linear models . London: Sage.10.4135/9780857028075
- Jones, S. (2017). Expectation vs. experience: Might transition gaps predict undergraduate students’ outcome gaps? Journal of Further and Higher Education , 1–15. doi:10.1080/0309877X.2017.1323195
- Jooganah, K. , & Williams, J. (2010). The transition to advanced mathematical thinking: Socio-cultural and cognitive perspectives . Paper presented at the Proceedings of the British Congress for Mathematics Education (BCME) (pp. 113–120), Manchester.
- Krupczak, J. , & Disney, K.A. (2013). Technological literacy: Assessment and measurement of learning gains . Paper presented at 2013 ASEE Annual Conference & Exposition , Atlanta . Retrieved from https://peer.asee.org/22545
- Kübler-Ross, E. (1969). On death and dying . New York, NY : Macmillan.
- Kyndt, E. , Coertjens, L. , van Daal, T. , Donche, V. , Gijbels, D. , & Van Petegem, P. (2015). The development of students' motivation in the transition from secondary to higher education: A longitudinal study. Learning and Individual Differences , 39 , 114–123. doi:10.1016/j.lindif.2015.03.001
- Lehmann, W. (2009). Becoming middle class: How working-class university students draw and transgress moral class boundaries. Sociology , 43 (4), 631–647. doi:10.1177/0038038509105412
- Linacre, J.M. (1998). Detecting multidimensionality: Which residual data-type works best? Journal of Outcome Measurement , 2 (3), 266–283.
- Linacre, J.M. (2002). Optimizing rating scale category effectiveness. Journal of Applied Measurement , 3 (1), 85–106.
- Linacre, J.M. (2014). Winsteps® rasch measurement computer program . Beaverton, OR: Winsteps.com.
- Liu, O.L. , Bridgeman, B. , & Adler, R.M. (2012). Measuring learning outcomes in higher education. Educational Researcher , 41 (9), 352–362. doi:10.3102/0013189X12459679
- Lopez, W.A. (1996). Communication validity and rating scales. Rasch Measurement Transactions , 10 (1), 482–483.
- Macfarlane, B. (2016). The performative turn in the assessment of student learning: A rights perspective. Teaching in Higher Education , 21 (7), 839–853. doi:10.1080/13562517.2016.1183623
- Margaryan, A. , Littlejohn, A. , & Vojt, G. (2011). Are digital natives a myth or reality? University students’ use of digital technologies. Computers & Education , 56 (2), 429–440. doi:10.1016/j.compedu.2010.09.004
- McGrath, H.C. , Guerin, B. , Harte, E. , Frearson, M. , & Manville, C. (2015). Learning gain in higher education . Cambridge: RAND Europe.
- Messick, S. (1988). The once and future issues of validity: Assessing the meaning and consequences of measurement. In H. Wainer & H.I. Braun (Eds.), Test validity (pp. 33–45). London: Lawrence Erlbaum.
- Mountford-Zimdars, A. , Sabri, D. , Moore, J. , Sanders, J. , Jones, S. , & Higham, L. (2015). Causes of differences in student outcomes. Higher Education Funding Council for England . http://www.hefce.ac.uk/pubs/rereports/year/2015/diffout/
- Ong, Y.M. , Williams, J. , & Lamprianou, I. (2012). Exploring differential bundle functioning in mathematics by gender: The effect of hierarchical modelling. International Journal of Research & Method in Education , 36 (1), 82–100. doi:10.1080/1743727X.2012.675263
- Pajares, F. (Producer). (2000). First person: Frank Parajes on nurturing academic confidence . Retrieved from https://www.uky.edu/~eushe2/Pajares/NurturingAcademicConfidence.html
- Pampaka, M. , Hutcheson, G. , & Williams, J. (2014). Handling missing data: Analysis of a challenging data set using multiple imputation. International Journal of Research & Method in Education , 39 , 19–37. doi:10.1080/1743727X.2014.979146
- Pampaka, M. , Kleanthous, I. , Hutcheson, G.D. , & Wake, G. (2011). Measuring mathematics self-efficacy as a learning outcome. Research in Mathematics Education , 13 (2), 169–190.10.1080/14794802.2011.585828
- Pampaka, M. , Pepin, B. , & Sikko, S.A. (2016). Supporting or alienating students during their transition to higher education: Mathematically relevant trajectories in the contexts of England and Norway. International Journal of Educational Research , 79 , 240–257. doi:10.1016/j.ijer.2016.06.008
- Pampaka, M. , & Williams, J. (2016). Mathematics teachers’ and students’ perceptions of transmissionist teaching and its association with students’ dispositions. Teaching Mathematics and its Applications: An International Journal of the IMA , 35 (3), 118–130. doi:10.1093/teamat/hrw007
- Pampaka, M. , Williams, J. , & Hutcheson, G. (2012). Measuring students’ transition into university and its association with learning outcomes. British Educational Research Journal , 38 (6), 1041–1071.10.1080/01411926.2011.613453
- Pampaka, M. , & Williams, J.S. (2010). Measuring mathematics self efficacy of students at the beginning of their higher education studies . Paper presented at the Proceedings of the British Congress for Mathematics Education (BCME) (pp. 159–166), Manchester, NH .
- Pampaka, M. , Williams, J.S. , Hutcheson, G. , Black, L. , Davis, P. , Hernandez-Martinez, P. , & Wake, G. (2013). Measuring alternative learning outcomes: Dispositions to study in Higher Education. Journal of Applied Measurement , 14 (2), 197–218.
- Pampaka, M. , Williams, J.S. , Hutcheson, G. , Wake, G. , Black, L. , Davis, P. , & Hernandez-Martinez, P. (2012). The association between mathematics pedagogy and learners’ dispositions for university study. British Educational Research Journal , 38 (3), 473–496.10.1080/01411926.2011.555518
- Sander, P. , & Sanders, L. (2003). Measuring confidence in academic study. Electronic Journal of Research in Educational Psychology and Psychopedagogy , 1 (1), 1–17.
- Scheerens, J. (2000). Improving school effectiveness fundamentals of educational planning, 68 . Paris: UNESCO – International Institute for Educational Planning. Retrieved from https://pdfs.semanticscholar.org/e206/206a565e5669297be5669295cc5669261afe5669292f5669293a5669232c5650966.pdf
- Smith, R.M. , Schumacker, R.E. , & Busch, M.J. (1998). Using item mean squares to evaluate fit to the Rasch model. Journal of Outcome Measurement , 2 (1), 66–78.
- Thissen, D. , Steinberg, L. , & Wainer, H. (1993). Detection of differential item functioning using the parameters of item response models. In P.W. Holland & H. Wainer (Eds.), Differential item functioning (pp. 67–114). London: Lawrence Erlbaum.
- Troncoso, P. , Pampaka, M. , & Olsen, W. (2015). Beyond traditional school value-added models: A multilevel analysis of complex school effects in Chile. School Effectiveness and School Improvement , 27 , 293–314. doi: 10.1080/09243453.2015.1084010
- Webb-Williams, J. (2006, 6 September). Self-efficacy in the primary classroom: An investigation into the relationship with performance . Paper presented at the British Educational Research Association New Researchers/Student Conference, University of Warwick, Warwick, RI .
- Wei, M. , Ku, T.-Y. , & Liao, K.Y.-H. (2011). Minority stress and college persistence attitudes among African American, Asian American, and Latino students: Perception of university environment as a mediator. Cultural Diversity and Ethnic Minority Psychology , 17 (2), 195–203.10.1037/a0023359
- Wei, T. (2015). Ways to Boost University Students’ self-confidence. Journal of College Advisor, 5 , 18.
- Weisberg, S. (1985). Applied linear regression (2nd ed.). New York: Wiley.
- Wolfe, E.W. , & Smith, E.V., Jr. (2007a). Instrument development tools and activities for measure validation using Rasch Models: Part I – Instrument development tools. Journal of Applied Measurement , 8 (1), 97–123.
- Wolfe, E.W. , & Smith, E.V., Jr (2007b). Instrument development tools and activities for measure validation using Rasch Models: Part II – Validation activities. Journal of Applied Measurement , 8 (2), 204–234.
- Wright, B.D. (1994). Data analysis and fit. Rasch Measurement Transactions , 7 (4), 324.
Appendix 1. Items on the confidence section as appeared in the questionnaire
C1. How confident do you feel you are about the following general skills (at the start of your programme) (please circle 1, 2, 3 or 4, or tick the box if you don’t know)
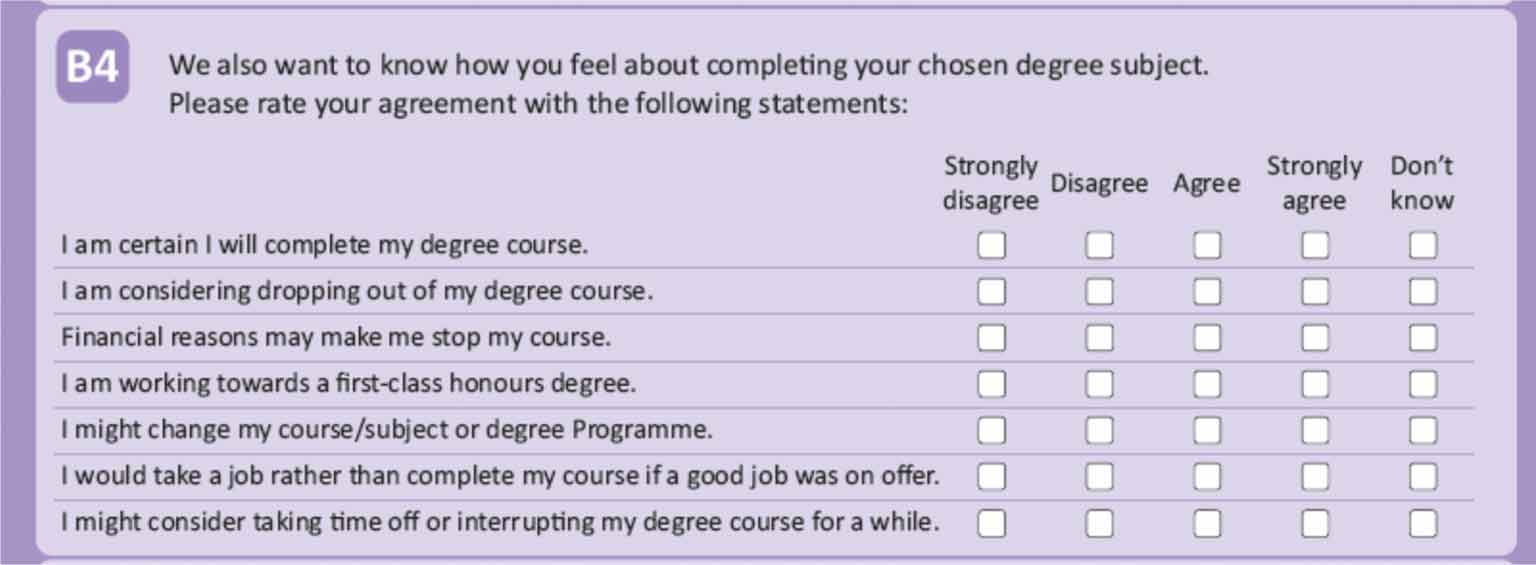
Appendix 2. Items for disposition to complete the chosen course